Group III metabotropic glutamate receptors gate long-term potentiation and synaptic tagging/capture in rat hippocampal area CA2
- Department of Physiology, Yong Loo Lin School of Medicine, National University of Singapore, Singapore
- Life Sciences Institute Neurobiology Programme, National University of Singapore, Singapore
- Institutes of Brain Science, State Key Laboratory of Medical Neurobiology and MOE Frontiers Center for Brain Science, Fudan University, China
Figures
Figure 1
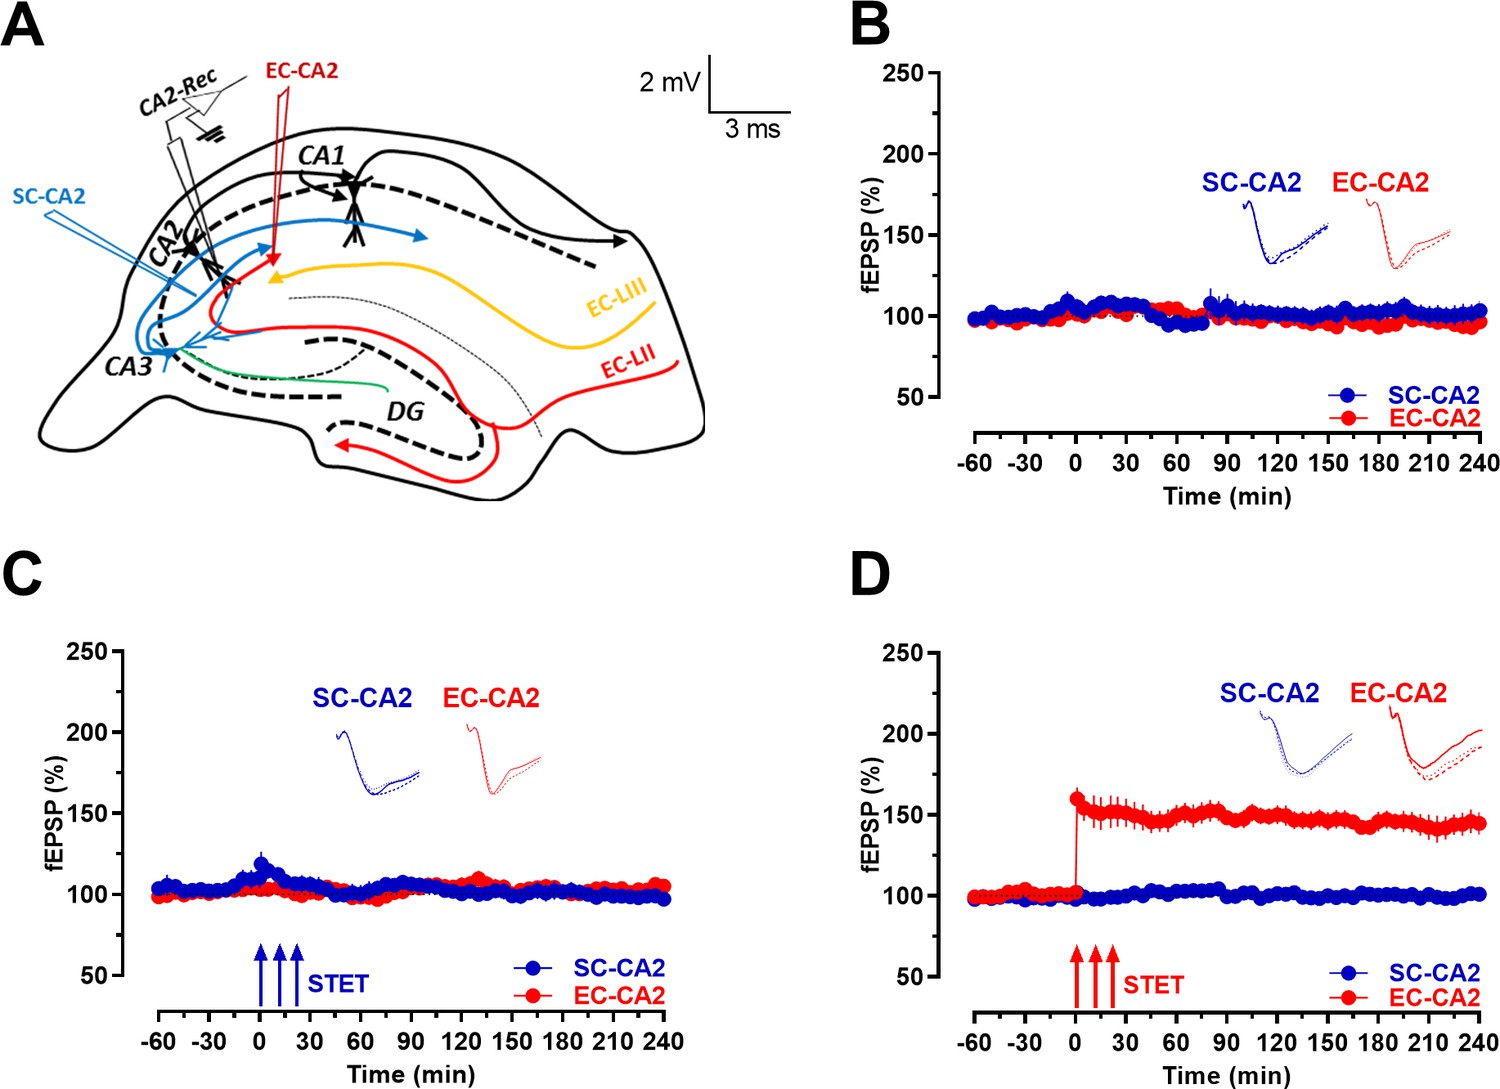
Schaffer collaterals to CA2 neurons are resistant to activity-dependent long-term potentiation while the entorhinal cortical synapses onto CA2 express late-LTP.
(A) Schema showing location of stimulating and recording electrodes. SC-CA2 (blue) and EC-CA2 (red) stimulating electrodes and recording site (black) of fEPSPs within the hippocampal CA2 area are shown. (B) fEPSP recordings under baseline stimulation recorded from SC-CA2 (blue circles) and EC-CA2 (red circles) synaptic inputs for more than 4 hr indicate their stability over time (n = 7). (C) STET at SC-CA2 did not lead to expression of LTP (blue circles; n = 7). EC-CA2 inputs under baseline stimulation exhibited stable potentials throughout the experiment (red circles). (D) STET at EC-CA2 leads to expression of late-LTP (red circles; n = 6) lasting up to 240 min. SC-CA2 inputs under baseline stimulation exhibited stable fEPSPs (blue circles). Representative fEPSP traces 30 min before (closed line), 60 min after (dotted line), and 240 min after (hatched line) STET are depicted. Calibration bars for fEPSP traces in all panels are 2 mV/3 ms. Arrows indicate the time points of STET. ‘n’ represents number of slices.
Figure 2
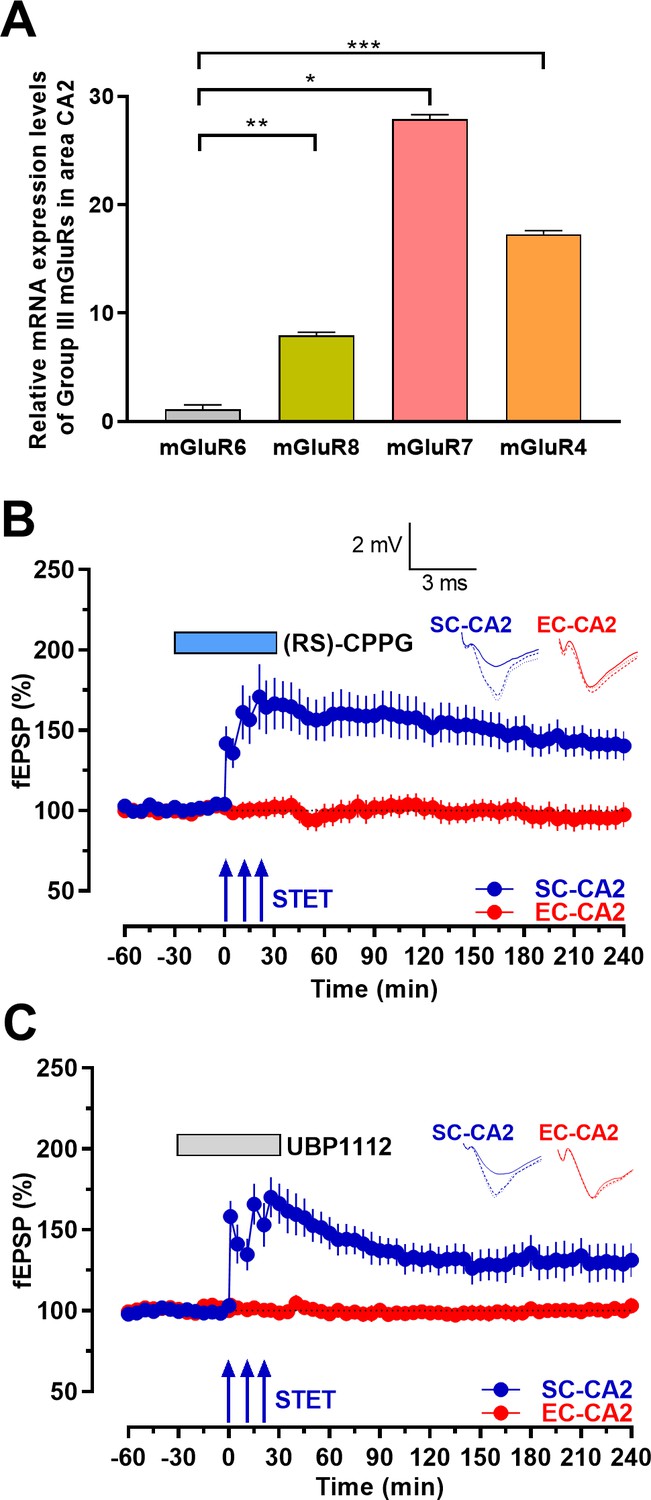
Inhibition of group III mGluRs leads to expression of activity-dependent late-LTP at the Schaffer collaterals to CA2 synapses.
(A) mRNA expression levels of group III mGluRs in area CA2. qRT-PCR analysis showing significantly higher expression levels of mGluR7, mGluR4 and mGluR8 compared to mGluR6. Significant difference between the groups mGluR6 vs mGluR8, mGluR7 and mGluR4 are indicated by * P < 0.05, ** P < 0.01 and *** P < 0.001 (one-way ANOVA, 12 slices each from four different biological samples, n = 4; ‘n’ represents number of animals.) (B) Group III mGluR antagonist (RS)-CPPG (1 µM) was bath applied for 1 hr after recording a stable baseline of 30 min. 30 min into (RS)-CPPG application, STET was delivered at SC-CA2 inputs, which resulted in late-LTP lasting 4 hr at SC-CA2 (blue circles; n = 11). (C) Group III mGluR antagonist UBP1112 (15 µM) was bath applied for 1 hr after recording a stable baseline of 30 min. 30 min into UBP1112 application, STET was delivered at SC-CA2 inputs, which resulted in late-LTP lasting 4 hr at SC-CA2 (blue circles; n = 7). EC-CA2 inputs (red circles) exhibited stable fEPSPs throughout the recording period after antagonist application (C, D). Horizontal bars indicate drug application period. Representative fEPSP traces 30 min before (closed line), 60 min after (dotted line), and 240 min after (hatched line) STET are depicted. Calibration bars for fEPSP traces in all panels are 2 mV/3 ms. Arrows indicate the time points of STET. ‘n’ represents number of slices in the electrophysiology experiments.
Figure 3 with 3 supplements
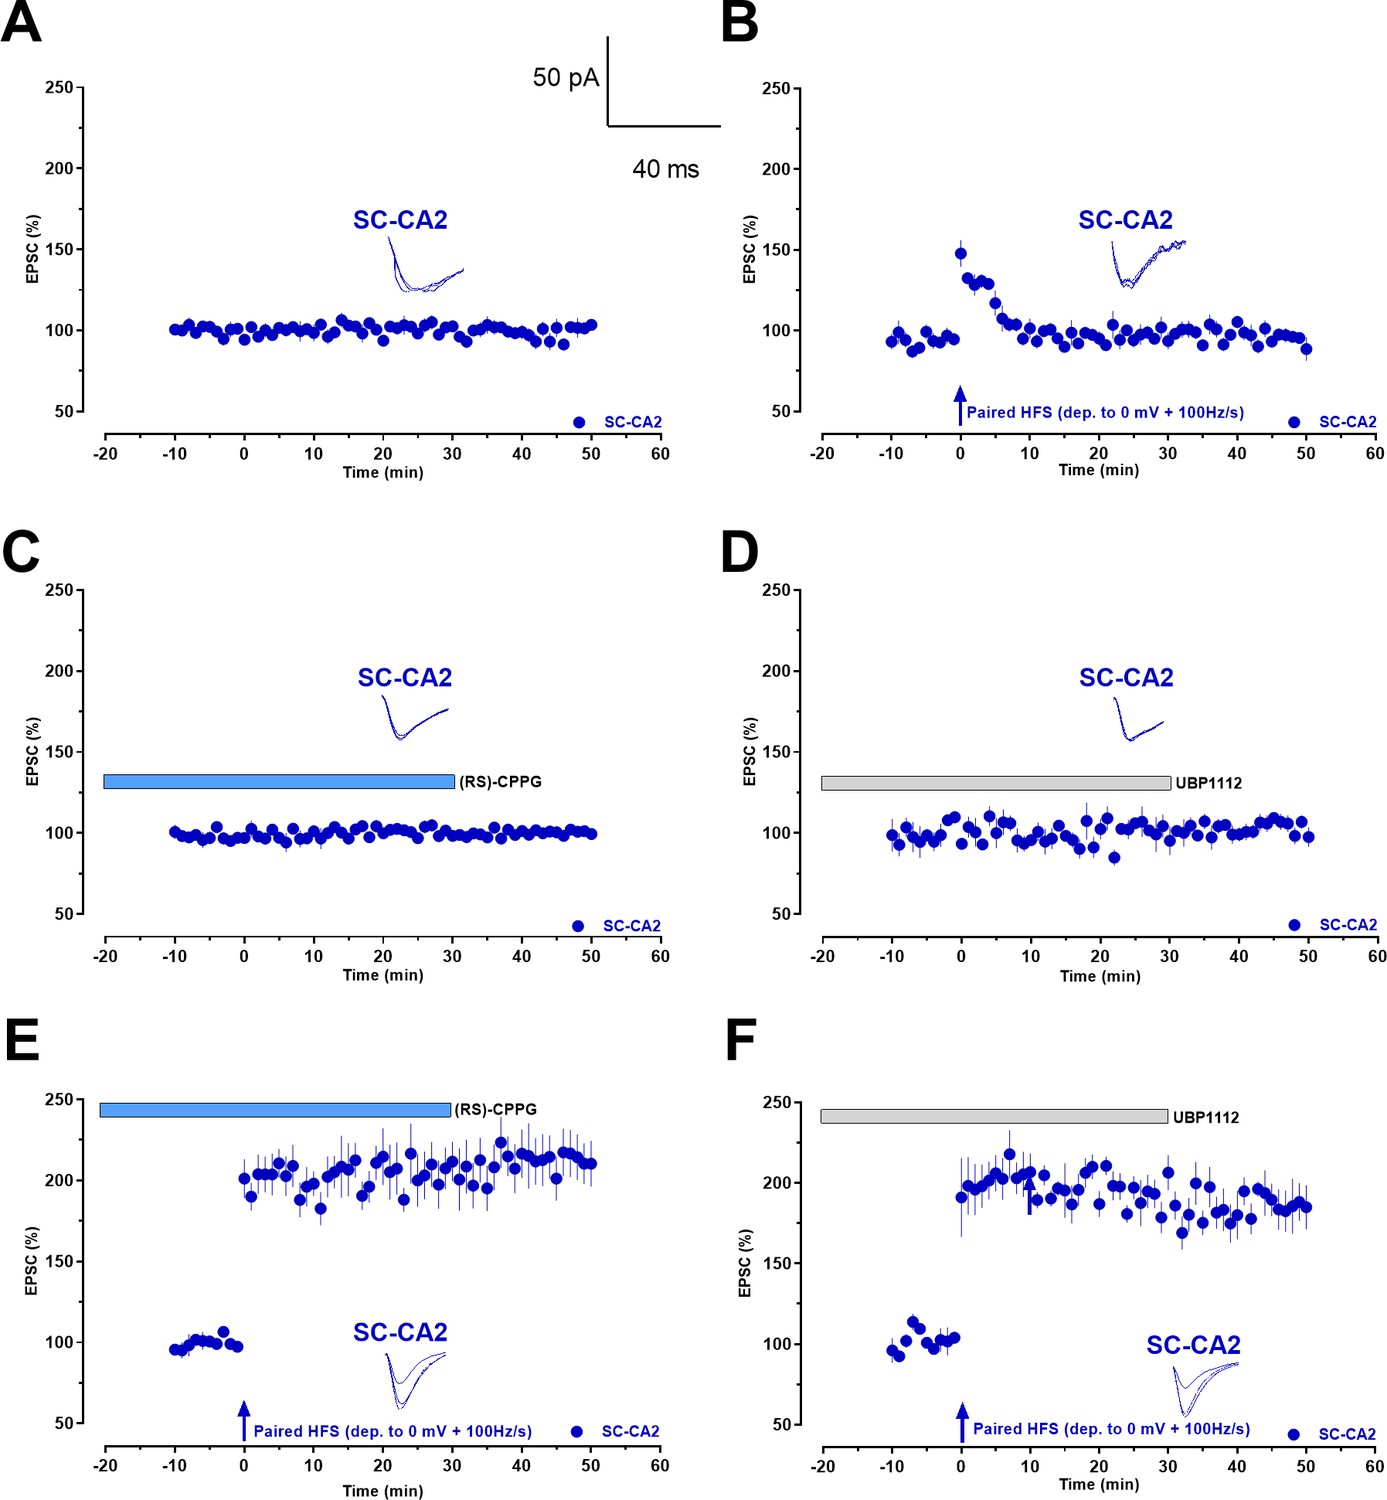
Whole-cell voltage-clamp recordings demonstrate that group III mGluR inhibition leads to activity-dependent late-LTP at Schaffer collaterals to CA2 synapses in single cells.
(A) Control experiment with evoked EPSCs recorded from CA2 pyramidal neurons under basal stimulation of Schaffer collaterals shows the stability of the whole-cell recordings (n = 5). (B) High frequency stimulation (HFS) at Schaffer collaterals paired with a membrane depolarization to 0 mV (paired HFS (dep. to 0 mV + 100 Hz/s)) after a 10 min baseline recording did not cause an expression of LTP at CA2 pyramidal neurons (n = 7) in the absence of group III mGluR antagonists and EPSCs decayed back to baseline quickly. (C) Bath application of (RS)-CPPG for a total period of 50 min under baseline SC-CA2 stimulation resulted in stable EPSCs throughout the recording period (n = 7). (D) Bath application of UBP1112 for a total period of 50 min under baseline SC-CA2 stimulation resulted in stable EPSCs throughout the recording period (n = 5). (E) (RS)-CPPG was bath applied for a total time period of 50 min (20 min before and 30 min after HFS) and HFS resulted in significant potentiation of EPSCs at SC-CA2 (n = 5). (F) UBP1112 was bath applied for a total time period of 50 min (20 min before and 30 min after HFS) and HFS resulted in significant potentiation of EPSCs at SC-CA2 (n = 5). Vertical blue arrows: time point of paired HFS. Horizontal bars: drug application period. Representative EPSC traces 5 min before (closed line), 20 min after (dotted line), and 50 min after (hatched line) paired HFS are depicted. Calibration bars for EPSC traces in all panels are 50 pA/40 ms. ‘n’ represents number of slices.
Figure 3—figure supplement 1
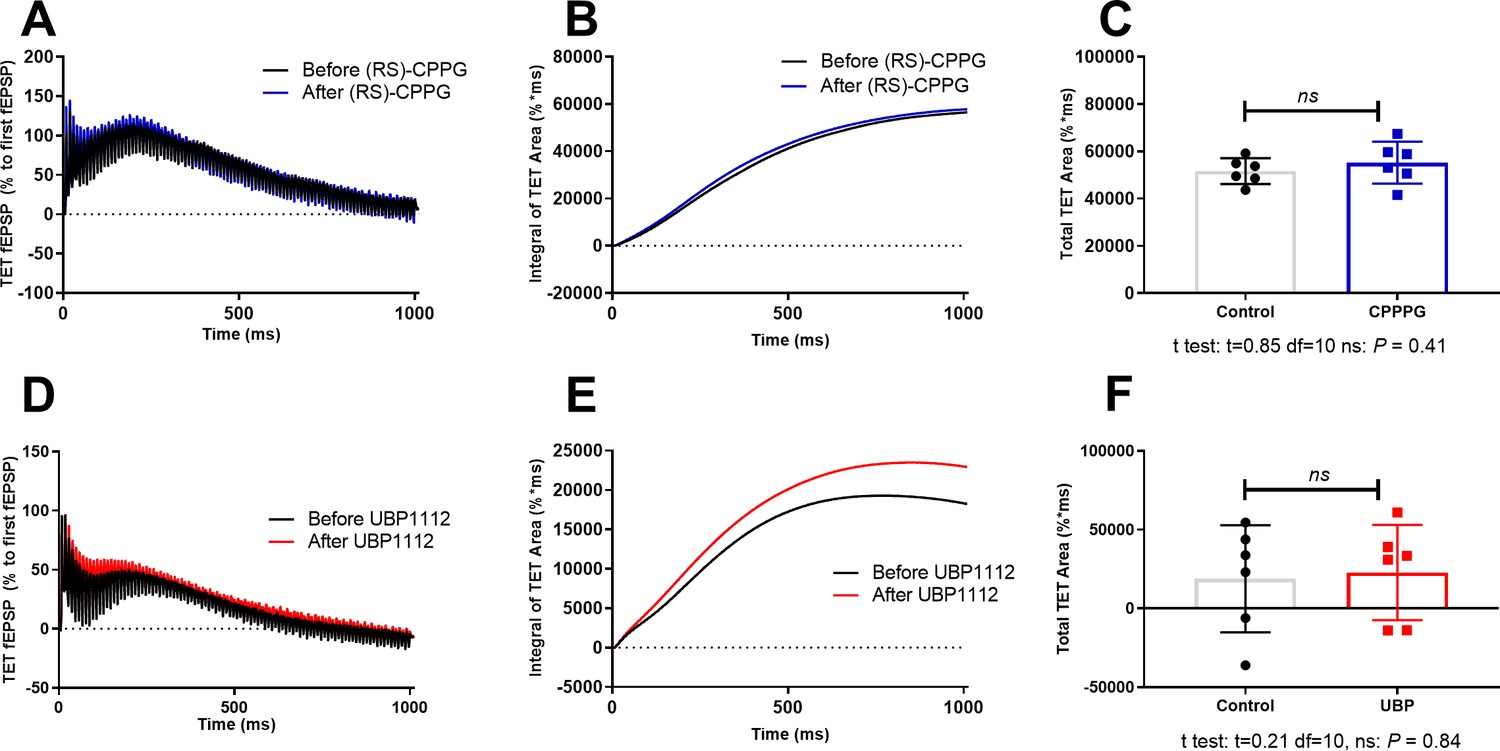
Effect of (RS)-CPPG or UBP1112 on high frequency stimulation mediated summation of field potentials.
(A) Averaged field potential traces in response to 100 Hz/s of six experiments before (black line) and after bath application of (RS)-CPPG (1 µM; blue line). Artefacts were truncated by linear interpolation. The traces were normalized to the amplitude of the first fEPSP in the train. (B) Integral of normalized tetanization (TET) area before and after (RS)-CPPG application. (C) Total normalized TET area of individual experiments is presented. (D, E, F) Similar data presentation and analysis as presented in A-C, but under the application of UBP1112 (15 µM). Data presented as individual data points, mean and SEM.
Figure 3—figure supplement 2

Effect of (RS)-CPPG and UBP1112 on high frequency stimulation-mediated EPSCs at 0 mV holding potential recorded in the whole-cell voltage-clamp configuration.
(A) Averaged current traces in response to 100 Hz/s stimuli of 11 experiments for Control (black line), (RS)-CPPG (1 µM; blue line), and UBP1112 (15 µM; red line). Artefacts were truncated by rolling average. Current transients were normalized to the amplitude of an initial EPSC during tetanization (TET). (B) Integral of normalized TET area under drug free conditions (Control; black line), (RS)-CPPG (blue line), and UBP1112 (red line) is presented. (C) Total normalized TET area of individual experiments is presented. Data are shown as individual data points, mean and SEM. There was no effect of treatment on TET area (one–way ANOVA: (F(2,30)=0.32, p=0.72). NS: p>0.7: Tukey's with multiple comparisons test corrected P value.).
Figure 3—figure supplement 3
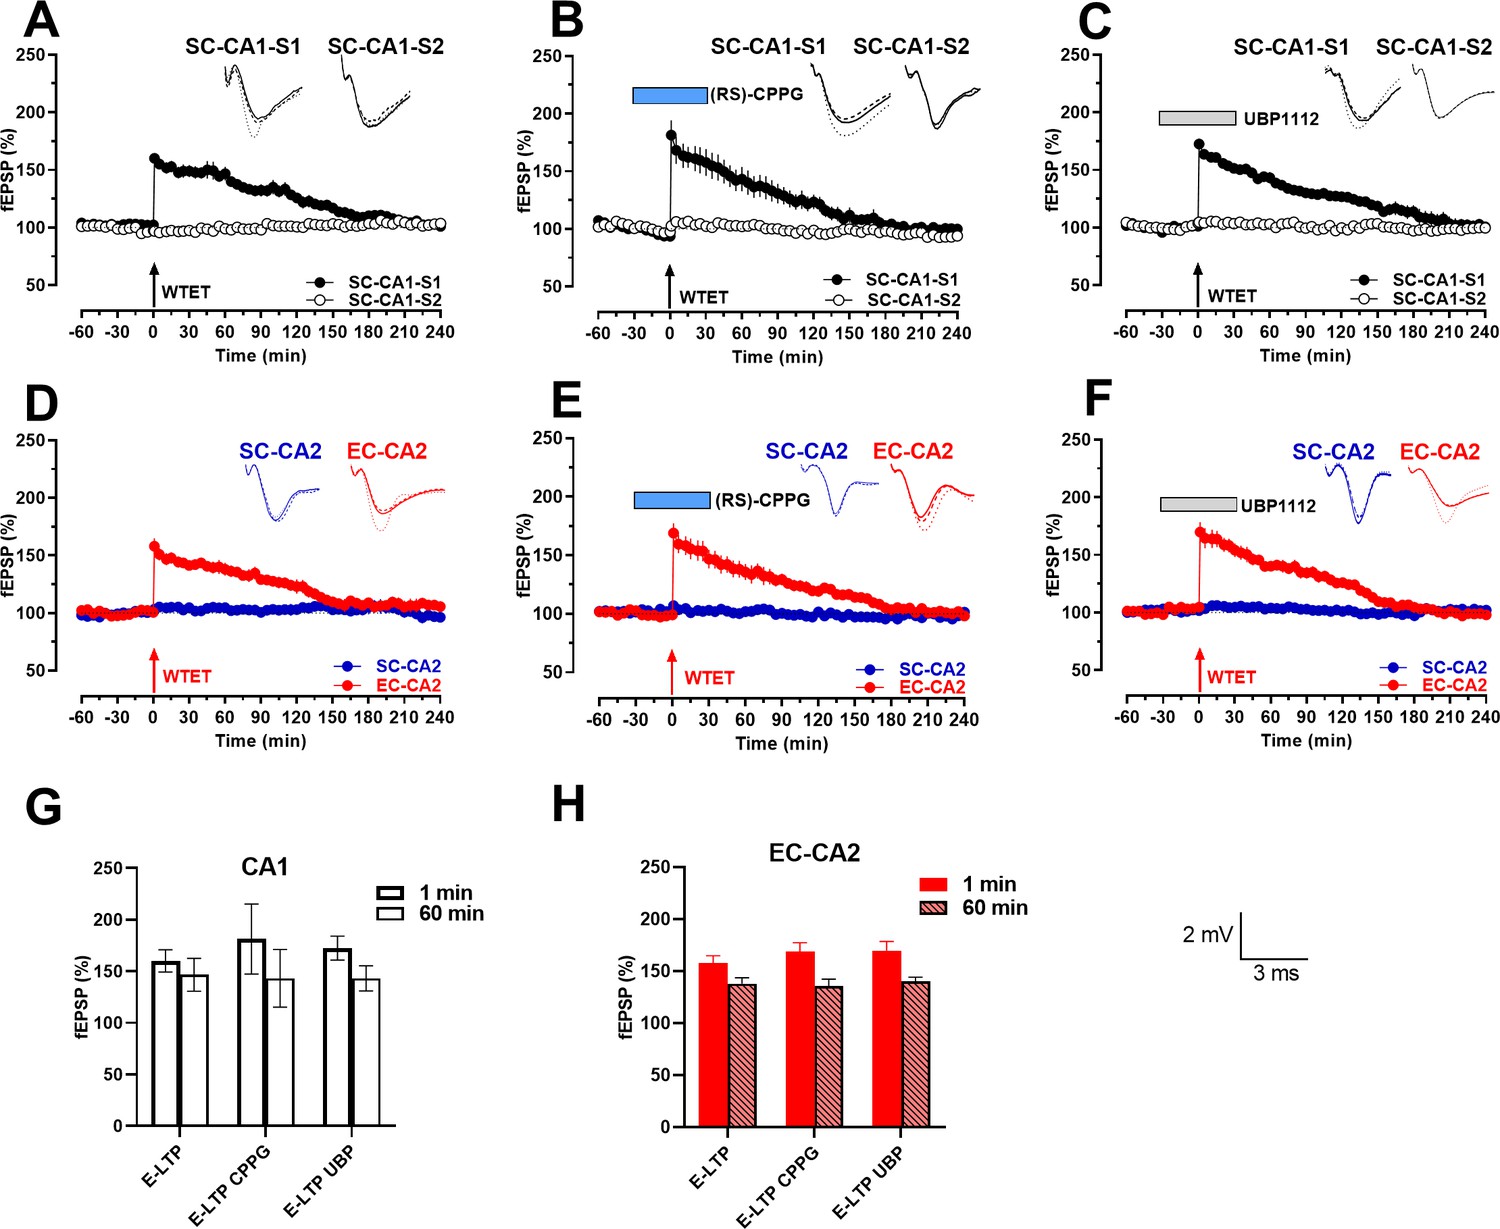
Bath application of group III mGluR inhibitors does not lower LTP induction thresholds in the Schaffer collateral (SC)-CA1 synaptic inputs and entorhinal cortex (EC)-CA2 synaptic inputs.
(A-C) Early-LTP was induced by a weak tetanization (WTET; arrow) in an independent Schaffer collateral (SC) input in the hippocampal area CA1 under control conditions (A) n = 7), during bath application of (RS)-CPPG (1 µM; B); blue box,n = 7) or during bath application of UBP1112 (15 µM; C); grey box,n = 6). In all three cases, in the tetanized input (black filled circle; SC-CA1-S1), a statistically significant potentiation was observed immediately after WTET but fEPSP gradually returned to baseline within 130–175 min (A): at 150 min, Wilcoxon test, p=0.0313; at 150 min, Mann Whitney test, p=0.0175; B): at 125 min, Wilcoxon test, p=0.0469; at 135 min, Mann Whitney test, p=0.0379; C): at 150 min, Wilcoxon test, p=0.0313; at 170 min, Mann Whitney test, p=0.0260). Stable baseline fEPSPs were recorded in the control input (open circle; SC-CA1-S2) throughout the entire recording sessions (A-C: Wilcoxon test, p>0.05 at any given time point). (D–F) Early-LTP was induced by a weak tetanization (WTET; arrow) in entorhinal cortex (EC) input to the hippocampal area CA2 (red circles; EC-CA2) under control conditions (n = 6) (D), during bath application of (RS)-CPPG (1 µM; E); blue box, n = 7) or during bath application of UBP1112 (15 µM; F); grey box, 6). In all three cases, a statistically significant potentiation was observed immediately after WTET but fEPSP gradually returned to baseline within 130–165 min (D) at 140 min, Wilcoxon test, p=0.0313; at 125 min, Mann Whitney test, p=0.0411; E) at 150 min, Wilcoxon test, p=0.0469; at 160 min, Mann Whitney test, p=0.0111; F): at 145 min, Wilcoxon test, p=0.0313; at 145 min, Mann Whitney test, p=0.0455). Stable baseline fEPSPs were recorded in the SC-CA2 input (blue circles) throughout the entire recording sessions (D–F): Wilcoxon test, p>0.05 at any given time point). (G–H) Summary bar graph of mean fEPSP slope values (%) at the given time points. Mean fEPSPs were not statistically different across the control, (RS)-CPPG and UBP1112 groups at 1 min or 60 min after WTET induction (G) at 1 min, Kruskal-Wallis test, p=0.4768; at 60 min, Kruskal-Wallis test, p=0.8063; H): at 1 min, Kruskal-Wallis test, p=0.7344; at 60 min, Kruskal-Wallis test, p=0.6824). Representative fEPSP traces 30 min before (closed line), 60 min after (dotted line), and 240 min after (hatched line) WTET are depicted. Calibration bars for fEPSP traces in all panels are 2 mV/3 ms. Arrows indicate the time points of WTET. ‘n’ represents number of slices.
Figure 4
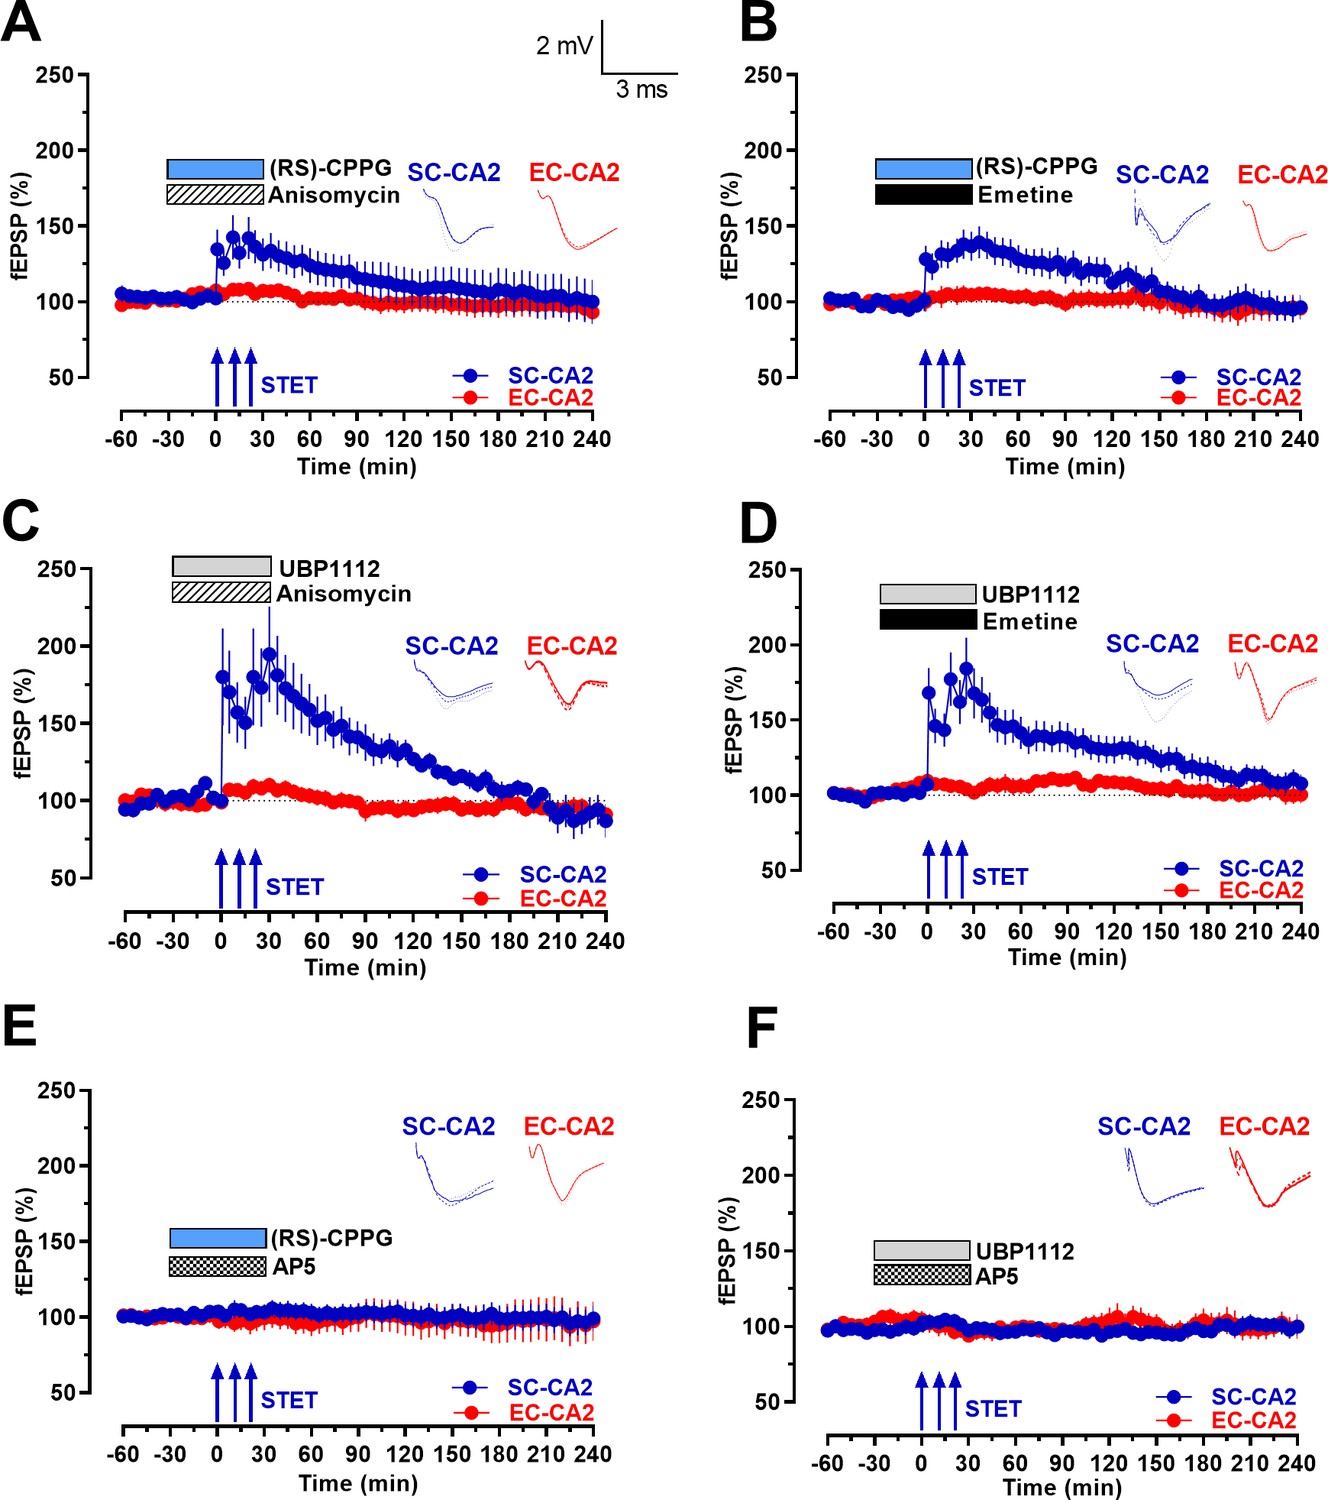
Group III mGluR inhibition-mediated activity-dependent late-LTP at Schaffer collaterals to CA2 is protein synthesis- and NMDAR-dependent.
(A-B) Co-application of protein synthesis inhibitors anisomycin (25 µM; n = 7; A) or emetine (20 µM; n = 9; B) with (RS)-CPPG for 1 hr prevented late-LTP at SC-CA2 (blue circles) after STET was delivered to SC-CA2. EC-CA2 inputs exhibited stable baseline potentials throughout (red circles). (C–D) Co-application of protein synthesis inhibitors anisomycin (25 µM; n = 6; C) or emetine (20 µM; n = 7; D) with UBP1112 prevented late-LTP at SC-CA2 (blue circles) after STET was delivered to SC-CA2. EC-CA2 inputs exhibited stable baseline potentials throughout (red circles). (E–F) Inhibition of NMDA receptors by co-application of D-AP5 (50 µM) with (RS)-CPPG (n = 10; E) or UBP1112 (n = 6; F) for 1 hr completely abolished LTP induction at SC-CA2 after STET (blue circles). Stable baseline potentials were recorded in EC-CA2 synaptic input (red circles). Horizontal bars indicate drug application period. Representative fEPSP traces 30 min before (closed line), 60 min after (dotted line), and 240 min after (hatched line) STET are depicted. Calibration bars for fEPSP traces in all panels are 2 mV/3 ms. Arrows indicate the time points of STET. ‘n’ represents number of slices.
Figure 5
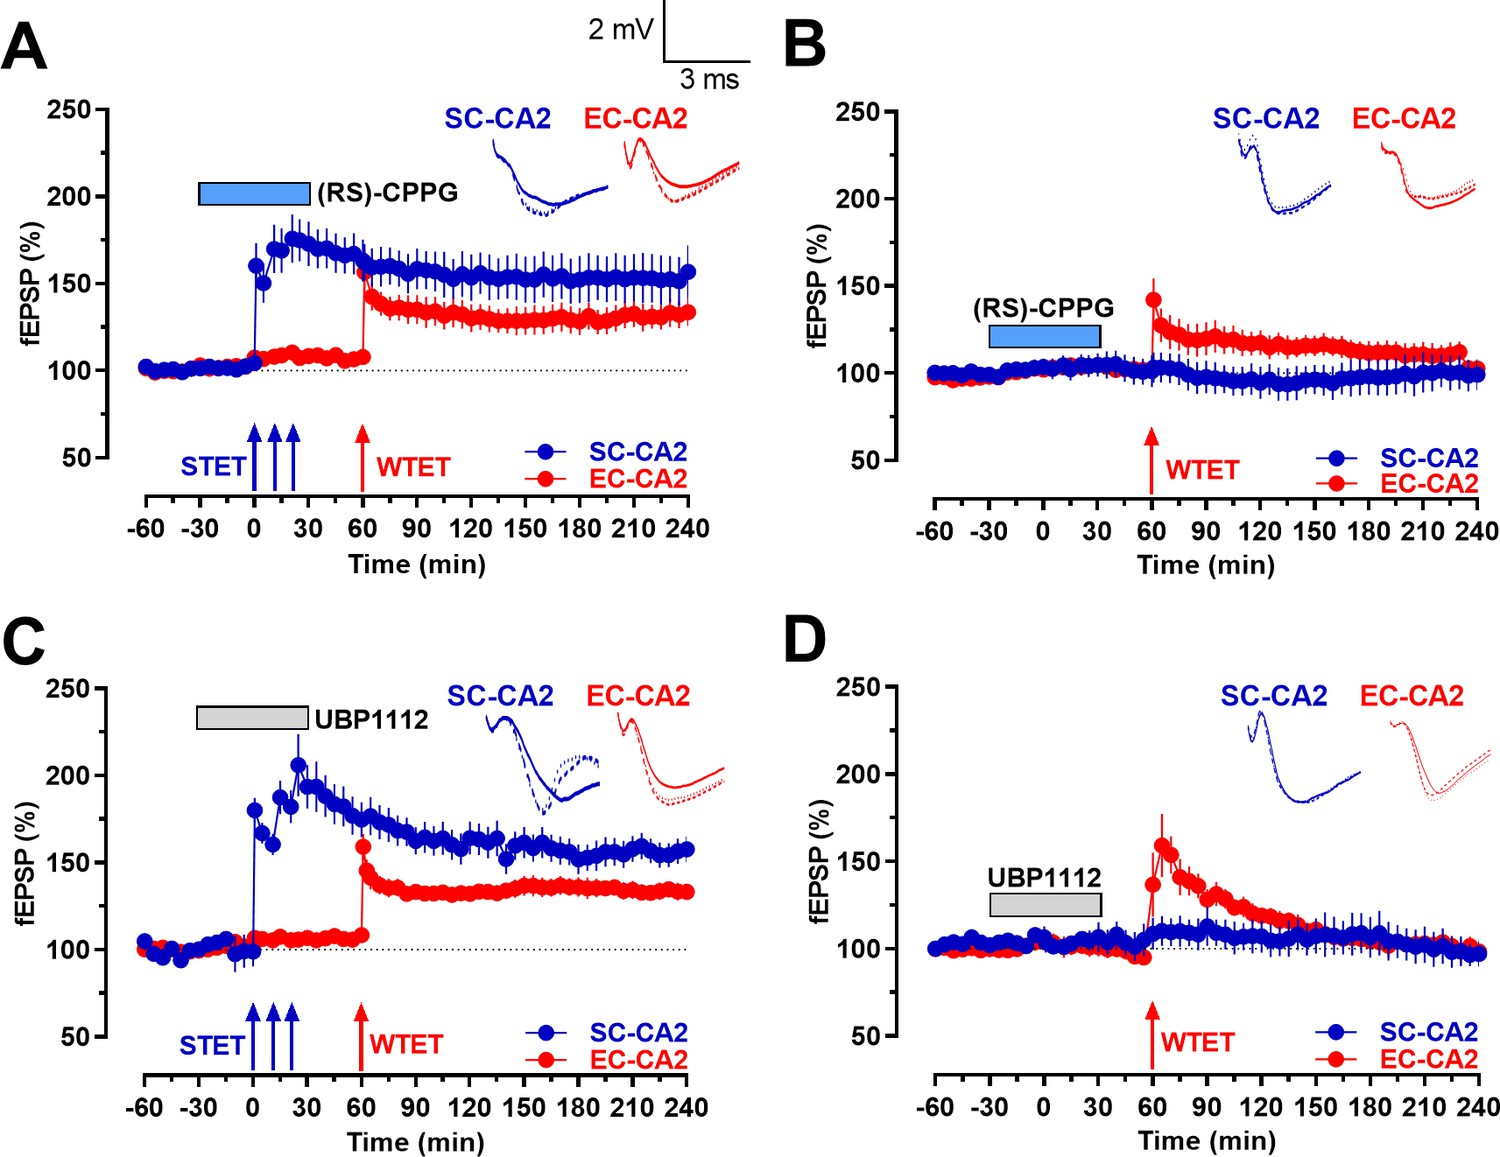
Group III mGluR inhibition-mediated activity-dependent late-LTP at Schaffer collaterals to CA2 synapses allows early-LTP to late-LTP transformation at entorhinal cortical synapses to CA2 through synaptic tagging and capture.
(A) STET at SC-CA2 in the presence of (RS)-CPPG prior to WTET at EC-CA2 transforms early-LTP at EC-CA2 to late-LTP. After recording a stable baseline for 30 min, (RS)-CPPG was bath applied for 1 hr. 30 min into (RS)-CPPG application, STET was delivered to the SC-CA2 synaptic input in the presence of (RS)-CPPG, resulting in late-LTP lasting 4 hr at SC-CA2 (blue circles). WTET was induced at the EC-CA2 synaptic input 1 hr after the induction of STET at SC-CA2. EC-CA2 potentiation in response to WTET was transformed to late-LTP lasting 180 min (red circles; n = 8). (B) Experiment shows expression of early-LTP at EC-CA2 after WTET was delivered at the EC-CA2 synaptic input 30 min after (RS)-CPPG application. (RS)-CPPG was applied in total for 1 hr and washed out for 30 min before the delivery of WTET at EC-CA2. The potentiation at EC-CA2 decayed to baseline levels 65 min post-delivery of WTET (red circles; n = 6). Stable baseline potentials were recorded at SC-CA2 (blue circles). (C) Similar to A, STET at SC-CA2 (blue circles) in the presence of UBP1112 prior to WTET at EC-CA2 transformed early-LTP at EC-CA2 to late-LTP lasting 180 min (red circles; n = 8). The experimental design was similar to that in B, with the exception that UBP1112 was applied in place of (RS)-CPPG. (D) Similar to B, experiment shows expression of early-LTP at EC-CA2 after WTET was delivered at EC-CA2 synaptic input 30 min after UBP1112 application. UBP1112 was applied for 1 hr in total and washed out for 30 min before the delivery of WTET at EC-CA2. The potentiation at EC-CA2 decayed to baseline levels by 140 min (red circles; n = 7). Horizontal bars indicate drug application period. Representative fEPSP traces 30 min before (closed line), 60 min after (dotted line), and 240 min after (hatched line) STET/WTET are depicted. Calibration bars for fEPSP traces in all panels are 2 mV/3 ms. Arrows indicate the time points of WTET or STET. ‘n’ represents number of slices.
Figure 6
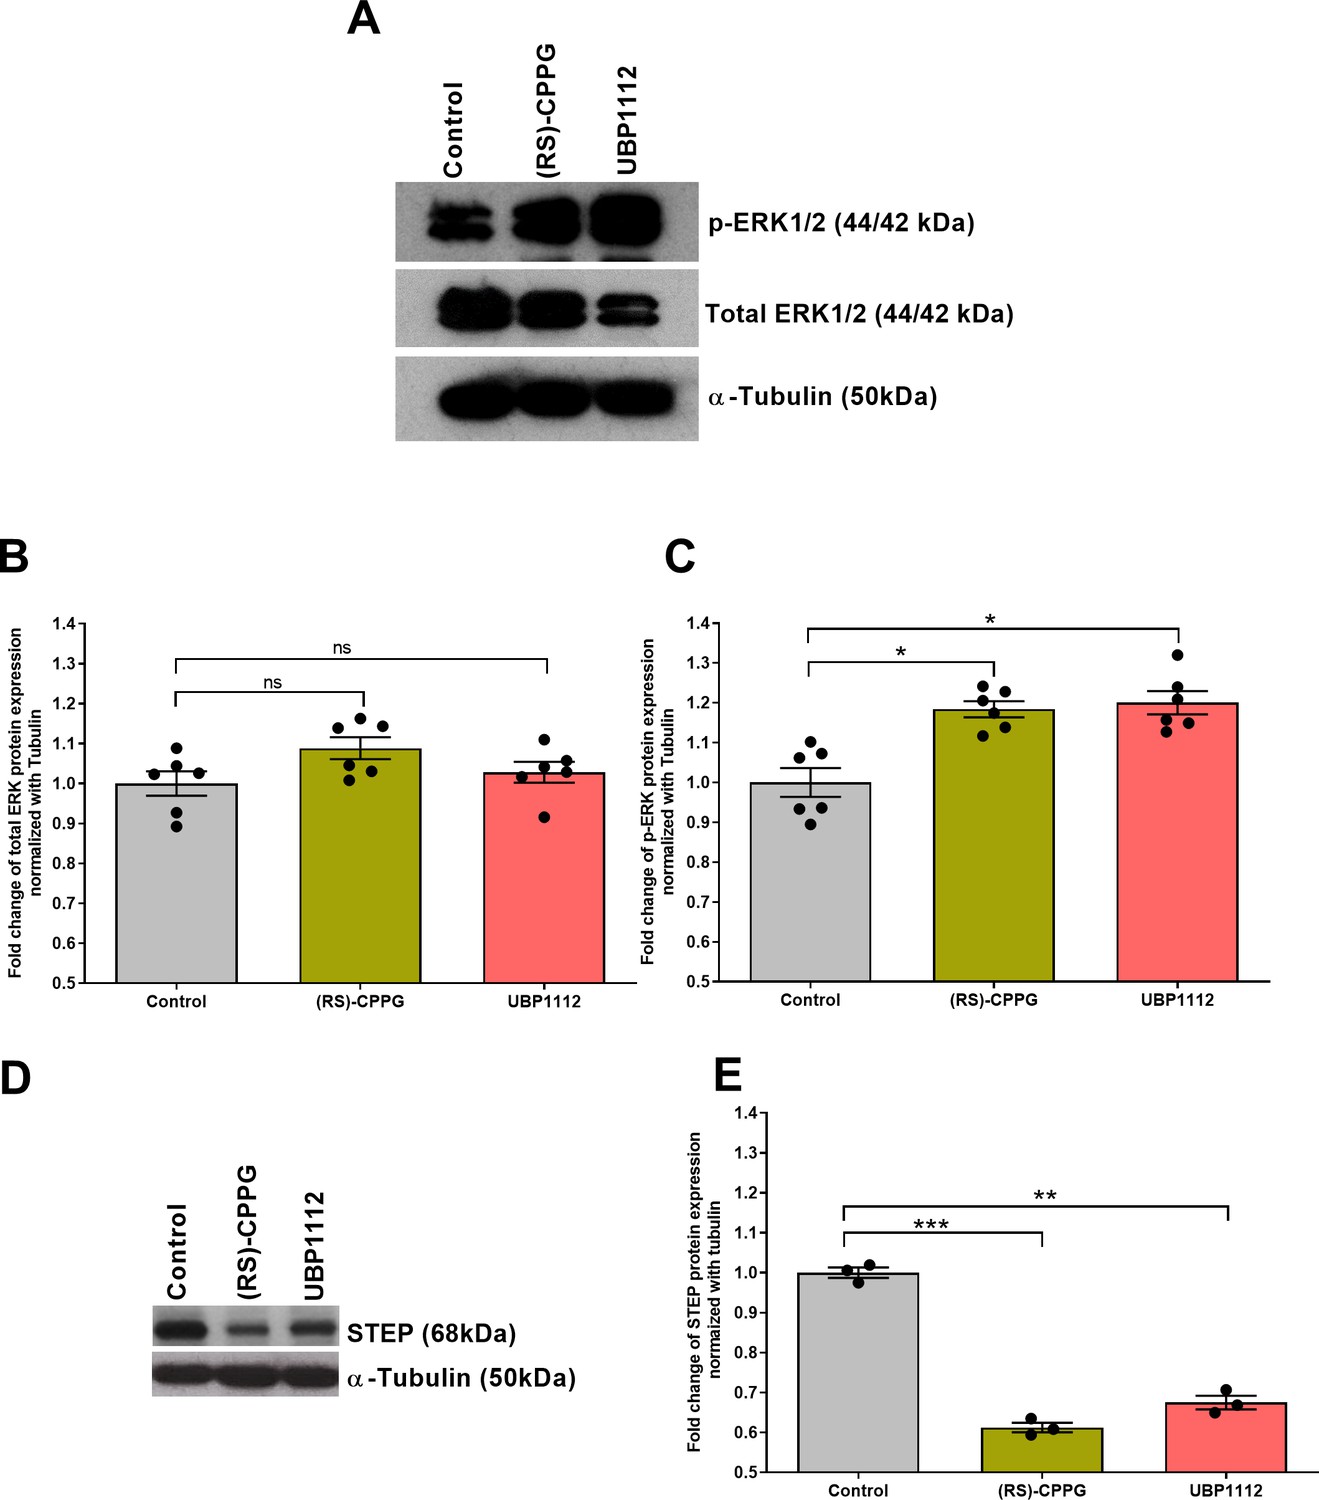
Group III mGluR antagonist treatment increases phosphorylation of ERK1/2 and reduces STEP protein expression in hippocampal area CA2.
(A-C) Group III mGluR antagonist treatment increases phosphorylation levels of ERK in hippocampal area CA2. (A) Total ERK (44/42 kDa), p-ERK (44/42 kDa), and α-Tubulin (50 kDa) immunoreactive bands are shown. (B) The expression levels of total ERK also showed an increase after treatment with (RS)-CPPG and UBP1112, however, the data are not statistically significant (one-way ANOVA, 12 slices each from six different biological samples, n = 6). (C) Western blot analysis showed a significant increase in the phosphorylation levels of ERK after treatment with (RS)-CPPG or UBP1112 when compared to the control group. Significant differences between the groups control vs (RS)-CPPG or UBP1112 are indicated by * P < 0.05 (one-way ANOVA, 12 slices each from six different biological samples, n = 6). In both (B and C), the data were normalized to their respective tubulin levels. (D) STEP (68 kDa) and α-Tubulin (50 kDa) immunoreactive bands are shown. (E) Western blot analysis showed a significant reduction in STEP protein expression levels in (RS)-CPPG- or UBP1112-treated groups when compared to control group in area CA2. The data were normalized to their respective tubulin levels. Significant differences between the groups control vs (RS)-CPPG or UBP1112 are indicated by **: P < 0.01, ***: P < 0.001 (one-way ANOVA, 12 slices each from three different biological samples, n = 3). ‘n’ represents number of animals.
Figure 7
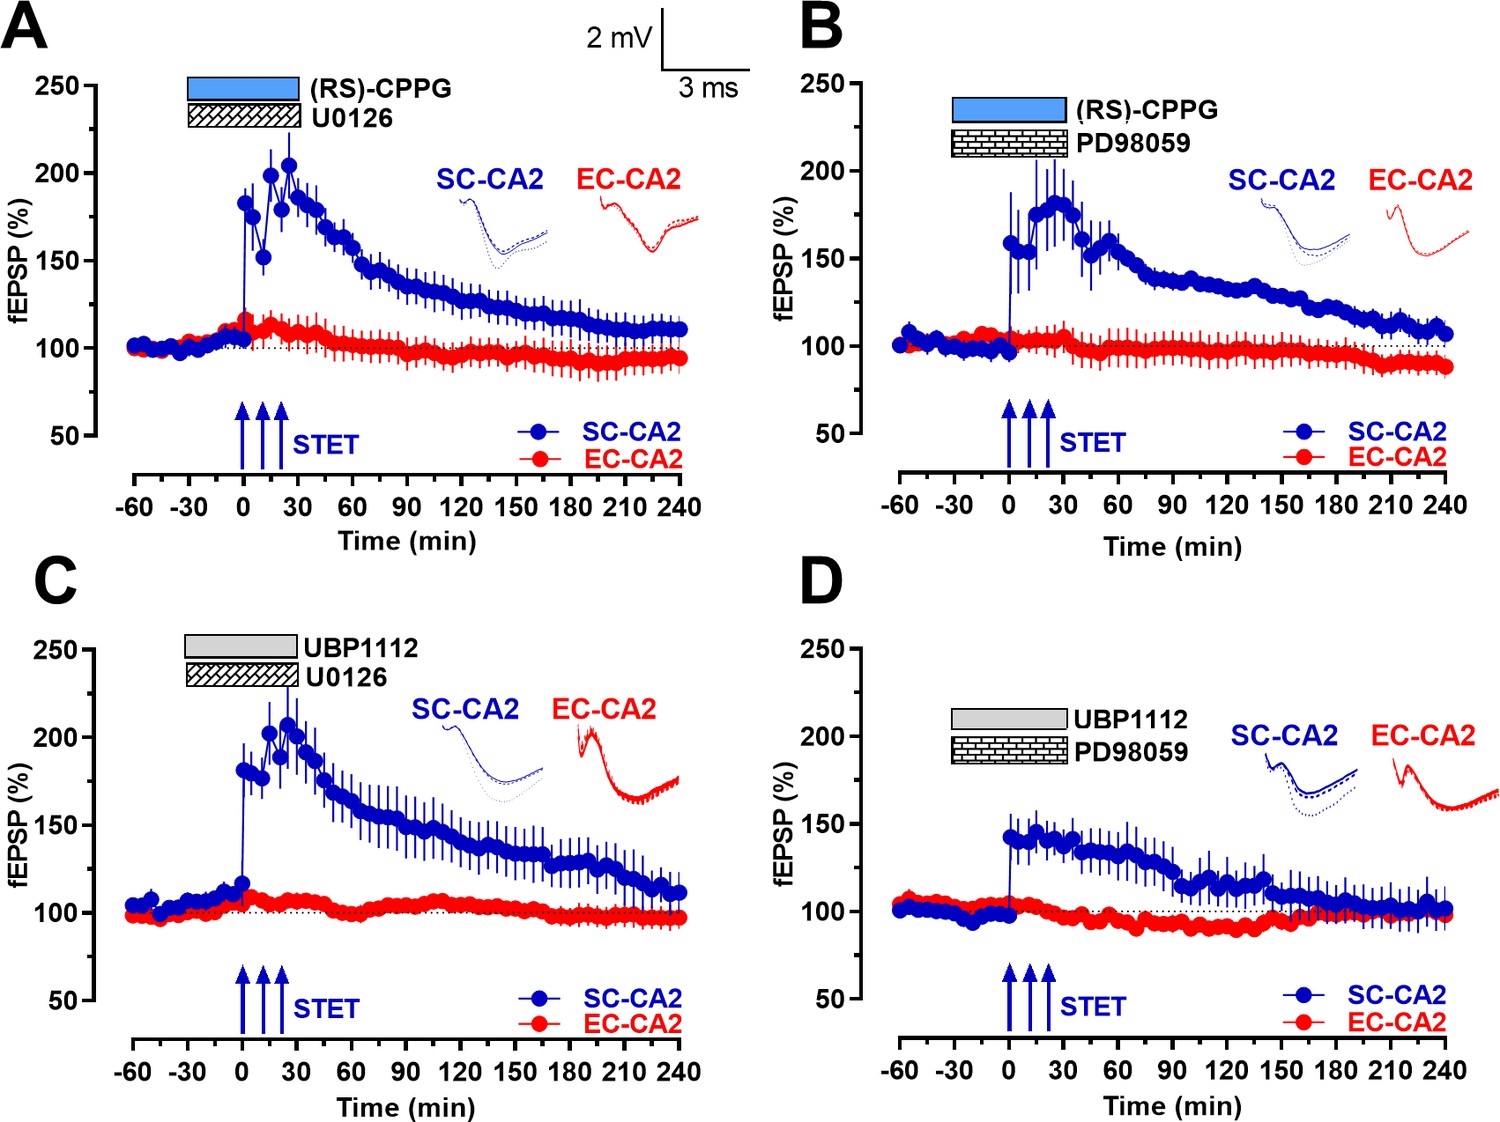
Inhibition of upstream kinases of ERK1/2 prevents group III mGluR inhibition mediated activity-dependent late-LTP at Schaffer collateral inputs to CA2.
(A-B) Co-application of specific inhibitors of the upstream kinases of ERK1/2, U0126 (1 µM; n = 6; A) or PD98059 (1 µM; n = 6; B), with (RS)-CPPG abolished late-LTP after STET at SC-CA2 synaptic input (blue circles; A B). U0126 or PD98059 were co-applied with (RS)-CPPG for a total period of 1 hr and STET was delivered at SC-CA2 30 min into drug application. The potentiation in SC-CA2 after the induction of STET gradually decayed back to baseline potentials (blue circles). Stable baseline potentials were recorded in EC-CA2 synaptic input throughout (red circles). (C–D) Similar to A and B, co-application of U0126 (1 µM; n = 6; C) or PD98059 (1 µM; n = 6; D) with UBP1112 abolished late-LTP after STET at SC-CA2 synaptic input (blue circles; C D) and fEPSPs at SC-CA2 gradually decayed back to baseline potentials in both cases. The experimental design was similar to that in A and B, with the exception that UBP1112 was applied in place of (RS)-CPPG. Stable baseline potentials were recorded in EC-CA2 synaptic input throughout (red circles). Horizontal bars indicate drug application period. Representative fEPSP traces 30 min before (closed line), 60 min after (dotted line), and 240 min after (hatched line) STET are depicted. Calibration bars for fEPSP traces in all panels are 2 mV/3 ms. Arrows indicate the time points of STET. ‘n’ represents number of slices.
Tables
Key resources table
| Reagent type (species) or resource | Designation | Source or reference | Identifiers | Additional information |
|---|---|---|---|---|
| Chemical compound, drug | (RS)-CPPG | Santa Cruz Biotechnology | Cat. #: sc-203448 | 1 µM final concentration |
| Chemical compound, drug | UBP1112 | Santa Cruz Biotechnology | Cat. #: sc-204368 | 15 µM final concentration |
| Chemical compound, drug | Emetine dihydrochloride | Sigma-Aldrich | Cat. #: E2375 | 20 µM final concentration |
| Chemical compound, drug | D-AP5 | Tocris | Cat. #: 0106 | 50 µM final concentration |
| Chemical compound, drug | Anisomycin | Tocris | Cat. #: 1290 | 25 µM final concentration |
| Chemical compound, drug | U0126 | Promega | Cat. #: V1121 | 1 µM final concentration |
| Chemical compound, drug | PD98059 | Cell Signaling Technology | Cat. #: 9900L | 1 µM final concentration |
| Chemical compound, drug | Picrotoxin | Sigma-Aldrich | Cat. #: P1675 | 100 µM final concentration |
| Antibody | rabbit polyclonal anti-P42/44 MAPK or ERK1/2 | Cell Signaling Technology | Cat. #: 9102S | WB (1:500) |
| Antibody | rabbit monoclonal anti-phospho-P42/44 MAPK or p-ERK1/2 | Cell Signaling Technology | Cat. #: 4370S | WB (1:500) |
| Antibody | mouse monoclonal IgG2b anti-STEP | Santa Cruz Biotechnology | Cat. #: sc-23892 | WB (1:500) |
| Antibody | mouse monoclonal anti-tubulin antibody | Sigma-Aldrich | Cat. #: T9026 | WB (1:30000) |
| Antibody | anti-rabbit IgG, HRP- linked secondary antibody | Cell Signaling Technology | Cat. #: 7074 | WB (1:3000) |
| Commercial assay or kit | Supersignal West Pico | Thermo Scientific | Cat. #: 34580 | |
| Commercial assay or kit | RNeasy Mini kit | Qiagen | Cat. #: 74106 | |
| Commercial assay or kit | GoScript Reverse Transcription System | Promega | Cat. #: A5000 | |
| Commercial assay or kit | Taqman universal PCR master mix | Thermo Fisher Scientific | Cat. #: 4304437 | |
| Sequence-based reagent | TaqMan gene expression assay mGluR4/Grm4 | Thermo Fisher Scientific | Lot. #: 1530835 Assay ID: Rn 01428450 | |
| Sequence-based reagent | TaqMan gene expression assay mGluR6/Grm6 | Thermo Fisher Scientific | Lot. #: 1534985 Assay ID: Rn 00709483 | |
| Sequence-based reagent | TaqMan gene expression assay mGluR7/Grm7 | Thermo Fisher Scientific | Lot. #: 1594998 Assay ID: Rn 00667503 | |
| Sequence- based reagent | TaqMan gene expression assay mGluR8/Grm8 | Thermo Fisher Scientific | Lot. #: 1407050 Assay ID: Rn 00573505 |
Additional files
Download links
A two-part list of links to download the article, or parts of the article, in various formats.
Downloads (link to download the article as PDF)
Open citations (links to open the citations from this article in various online reference manager services)
Cite this article (links to download the citations from this article in formats compatible with various reference manager tools)
Group III metabotropic glutamate receptors gate long-term potentiation and synaptic tagging/capture in rat hippocampal area CA2
eLife 9:e55344.
https://doi.org/10.7554/eLife.55344


