Dissecting cell-type-specific metabolism in pancreatic ductal adenocarcinoma
- Koch Institute for Integrative Cancer Research and the Department of Biology at Massachusetts Institute of Technology, United States
- Department of Biochemistry and Molecular Biology, University of Massachusetts, Amherst, United States
- Department of Biology and Biological Engineering, Chalmers University of Technology, Sweden
- Cold Spring Harbor Laboratory, Cold Spring Harbor, United States
- Lustgarten Foundation Pancreatic Cancer Research Laboratory, Cold Spring Harbor, United States
- Cancer Research United Kingdom Cambridge Institute, University of Cambridge, United Kingdom
- Lewis-Sigler Institute for Integrative Genomics, Princeton University, United States
- Department of Molecular Biology, Princeton University, United States
- Department of Medicine, University of Cambridge, United Kingdom
- Cambridge Institute for Therapeutic Immunology and Infectious Disease, University of Cambridge, United Kingdom
- Department of Pathology, Massachusetts General Hospital, United States
- Department of Medical Oncology, Dana-Farber Cancer Institute, United States
Figures
Figure 1 with 3 supplements

Glucose metabolism in PDAC tumors.
(A) Plasma glucose levels over time in autochthonous LSL-KrasG12D/+; Trp53fl/fl; Pdx1-Cre (KP-/-C) or autochthonous LSL-KrasG12D/+; Trp53R172H/+; Pdx1-Cre (KPC) pancreatic tumor-bearing mice infused with U-13C-glucose at a rate of 0.4 mg/min. n = 3 for each group. Mean +/- SEM is shown. (B) Enrichment of fully labeled glucose (M+6) in plasma from the indicated mice following a 6 hr U-13C-glucose infusion at a rate of 0.4 mg/min. Non-tumor bearing C57Bl6/J (WT) mice were used to assess metabolite labeling in normal pancreas. WT, n = 4; KP-/-C, n = 3, KPC, n = 3. Differences in plasma glucose enrichment were not significant between WT and KP-/-C mice (p=0.8723), WT and KPC mice (p=0.1907), or KP-/-C and KPC tumor-bearing mice (p=0.1512) based on unpaired, two-tailed student’s t tests. Mean +/- SEM is shown. (C–F) The fractional labeling of pyruvate (C), lactate (D), alanine (E), and serine (F) in pancreas (black), autochthonous KP-/-C pancreatic tumors (dark blue), or autochthonous KPC pancreatic tumors (light blue) following a 6 hr U-13C-glucose infusion at a rate of 0.4 mg/min. The M+3 isotopomers are shown for each metabolite: n = 3 for each group. Mean +/- SEM is shown. (G) Schematic illustrating how U-13C-glucose can label TCA cycle intermediates. An M+2 labeling pattern of TCA cycle intermediates can be derived from flux through pyruvate dehydrogenase (PDH) (left) while an M+3 labeling pattern can reflect flux through pyruvate carboxylase (PC) (right). (H–O) The fractional labeling of citrate (M+3; WT vs. KP-/-C p=0.0012, KP-/-C vs. KPC p=0.0084) (H), α-ketoglutarate (αKG) (I), succinate (J), fumarate (K), malate (M+3 KP-/-C vs. KPC p=0.0156) (L), aspartate (M+3 WT vs. KPC p=0.0194) (M), glutamate (M+2 WT vs. KP-/-C p=0.0089) (N), and proline (O) in pancreas (black), autochthonous KP-/-C pancreatic tumors (dark blue), or autochthonous KPC pancreatic tumors (light blue) following a 6 hr U-13C-glucose infusion at a rate of 0.4 mg/min. Significance based on unpaired, Students t-test. The M+2 and M+3 isotopomers are shown for each metabolite, n = 3 for each group. Mean +/- SEM is shown.
-
Figure 1—source data 1
Isotope labeling of tumors in U-13C- glucose-infused mice with autochthonous PDAC tumors presented in Figure 1.
- https://cdn.elifesciences.org/articles/56782/elife-56782-fig1-data1-v2.xlsx
Figure 1—figure supplement 1
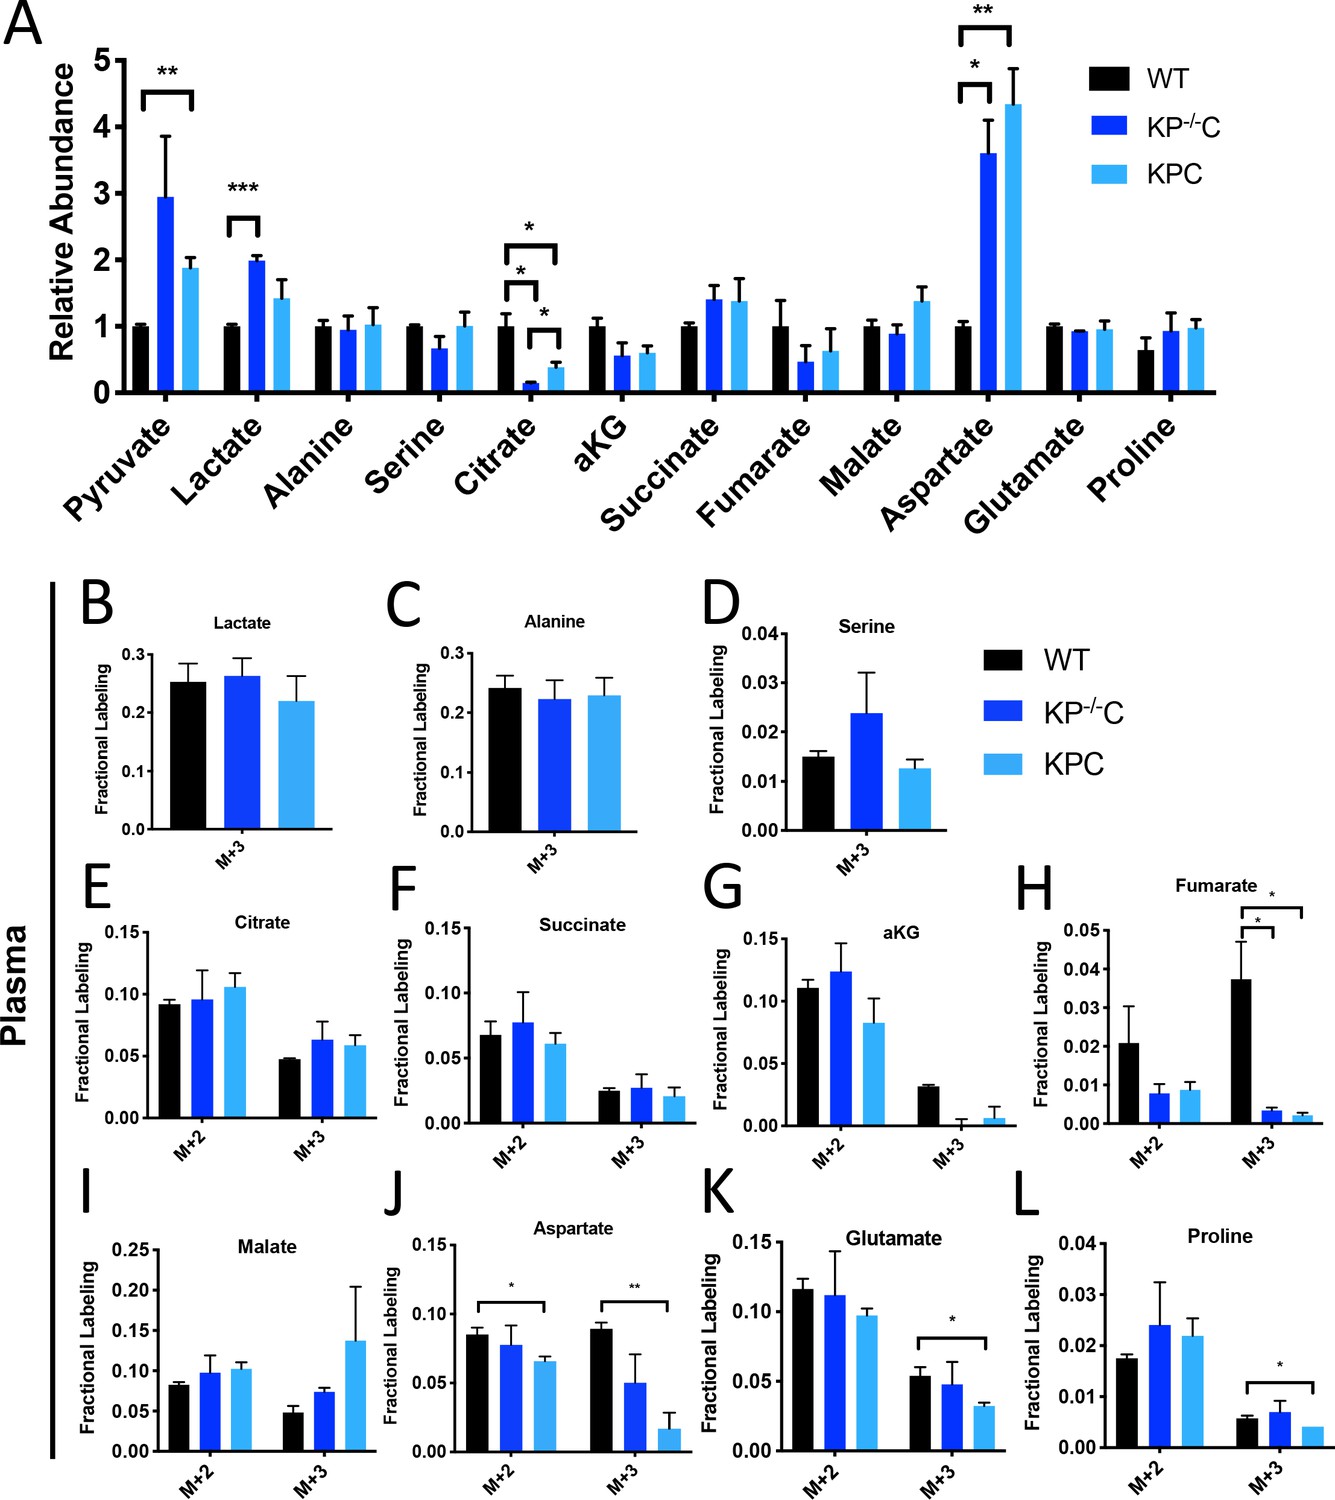
Metabolite abundance and plasma labeling in U-13C- glucose-infused autochthonous PDAC tumors.
(A) Relative abundance of tumor metabolites in autochthonous LSL-KrasG12D/+; Trp53fl/fl; Pdx1-Cre (KP-/-C) (dark blue) or autochthonous LSL-KrasG12D/+; Trp53R172H/+; Pdx1-Cre (KPC) (light blue) pancreatic tumor-bearing mice infused with U-13C-glucose for 6 hr at a rate of 0.4 mg/min. Non-tumor bearing C57Bl6/J (WT) mice (black) were used to assess metabolite abundance in normal pancreas. Total ion counts were first normalized to tissue weight and norvaline abundance as an internal control, and then WT pancreas values were set to 1. Differences were significant based on unpaired, Students t-test for pyruvate, WT vs. KPC (p=0.0048), lactate, WT vs. KP-/-C (p=0.0003), citrate WT vs. KP-/-C (p=0.0106), WT vs. KPC (p=0.0387), and KP-/-C vs. KPC (p=0.0340), and aspartate WT vs. KP-/-C (p=0.0065) and WT vs. KPC (p=0.0034). n = 3 for each group. Mean +/- SEM is shown. (B–L) The fractional labeling of lactate (B), alanine (C), serine (D), citrate (E), succinate (F), α-ketoglutarate (αKG) (G), fumarate (M+3 WT vs. KP-/-C p=0.0252, WT vs. KPC p=0.0224) (H), malate (I), aspartate (M+2 p=0.0338, M+3 p=0.0044) (J), glutamate (M+3 p=0.0325) (K), and proline (M+3 p=0.0355) (L) in plasma in WT mice (black), KP-/-C mice (dark blue), or KPC mice (light blue) following a 6 hr U-13C-glucose infusion at a rate of 0.4 mg/min. Significance was based on unpaired, Students t-test. n = 3 for each group. Mean +/- SEM is shown.
-
Figure 1—figure supplement 1—source data 1
Tumor metabolite abundance and plasma isotope labeling in U-13C- glucose-infused mice with autochthonous PDAC tumors presented in Figure 1—figure supplement 1.
- https://cdn.elifesciences.org/articles/56782/elife-56782-fig1-figsupp1-data1-v2.xlsx
Figure 1—figure supplement 2
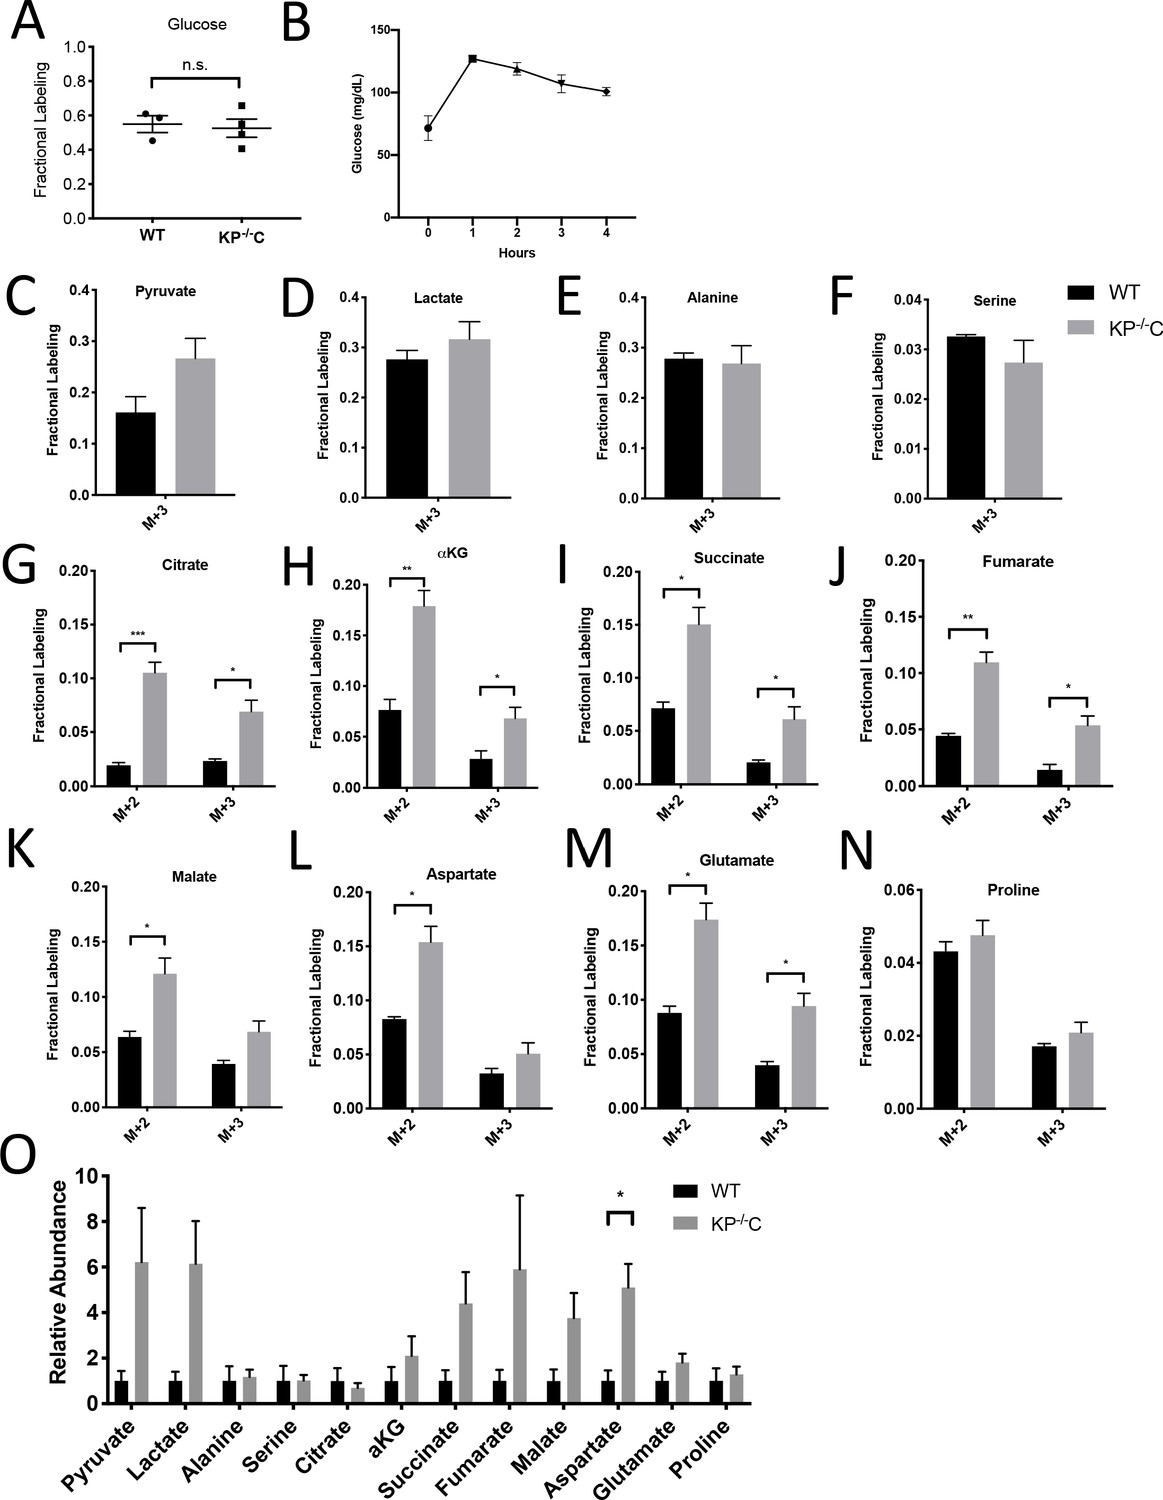
Glucose metabolism in autochthonous PDAC tumors infused with U-13C- glucose at 30 mg/kg/min.
(A) Enrichment of fully labeled glucose (M+6) in plasma from the indicated mice following a 4 hr U-13C-glucose infusion at a rate of 30 mg/kg/min. Non-tumor bearing C57Bl6/J (WT) mice were used to assess metabolite labeling in normal pancreas. WT, n = 3; KP-/-C, n = 4. Differences in plasma glucose enrichment were not significant between WT and KP-/-C tumor-bearing mice (p=0.7600) based on an unpaired student’s t test. Mean +/- SEM is shown. (B) Plasma glucose levels over time in tumor-bearing KP-/-C mice infused with U-13C-glucose at a rate of 30 mg/kg/min. n = 4. Mean +/- SEM is shown. (C–N) The fractional labeling of pyruvate (C), lactate (D), alanine (E), serine (F), citrate (M+2 p=0.0008, M+3 p=0.0155) (G), α-ketoglutarate (αKG) (M+2 p=0.0038, M+3 p=0.0398) (H), succinate (M+2 p=0.0098, M+3 p=0.0334) (I), fumarate (M+2 p=0.0018, M+3 p=0.0138) (J), malate (M+2 p=0.0208) (K), aspartate (M+2 p=0.0097) (L), glutamate (M+2 p=0.0058, M+3 p=0.0115) (M), and proline (N) in WT normal pancreas (black) and autochthonous pancreatic tumors (grey) from LSL-KrasG12D/+; Trp53fl/fl ; Pdx1-Cre (KP-/-C) mice following a 4 hr U-13C-glucose infusion at a rate of 30 mg/kg/min. Non-tumor bearing C57Bl6/J (WT) mice were used to assess metabolite labeling in normal pancreas. The M+2 and M+3 isotopomers are shown for each metabolite: pancreas, n = 3; tumor, n = 4. Significance was based on unpaired, Students t-test. Mean +/- SEM is shown. (O) Relative abundance of tumor metabolites in WT normal pancreas (black) and autochthonous pancreatic tumors (grey) from LSL-KrasG12D/+; Trp53fl/fl; Pdx1-Cre (KP-/-C) mice following a 4 hr U-13C-glucose infusion at a rate of 30 mg/kg/min. Total ion counts were first normalized to tissue weight and norvaline abundance as an internal control, and then WT pancreas values were set to 1. Differences were significant based on unpaired, Students t-test for aspartate (p=0.0171). pancreas, n = 3; tumor, n = 4. Mean +/- SEM is shown.
-
Figure 1—figure supplement 2—source data 1
Isotope labeling of tumors in U-13C- glucose-infused mice with autochthonous PDAC tumors presented in Figure 1—figure supplement 2.
- https://cdn.elifesciences.org/articles/56782/elife-56782-fig1-figsupp2-data1-v2.xlsx
Figure 1—figure supplement 3
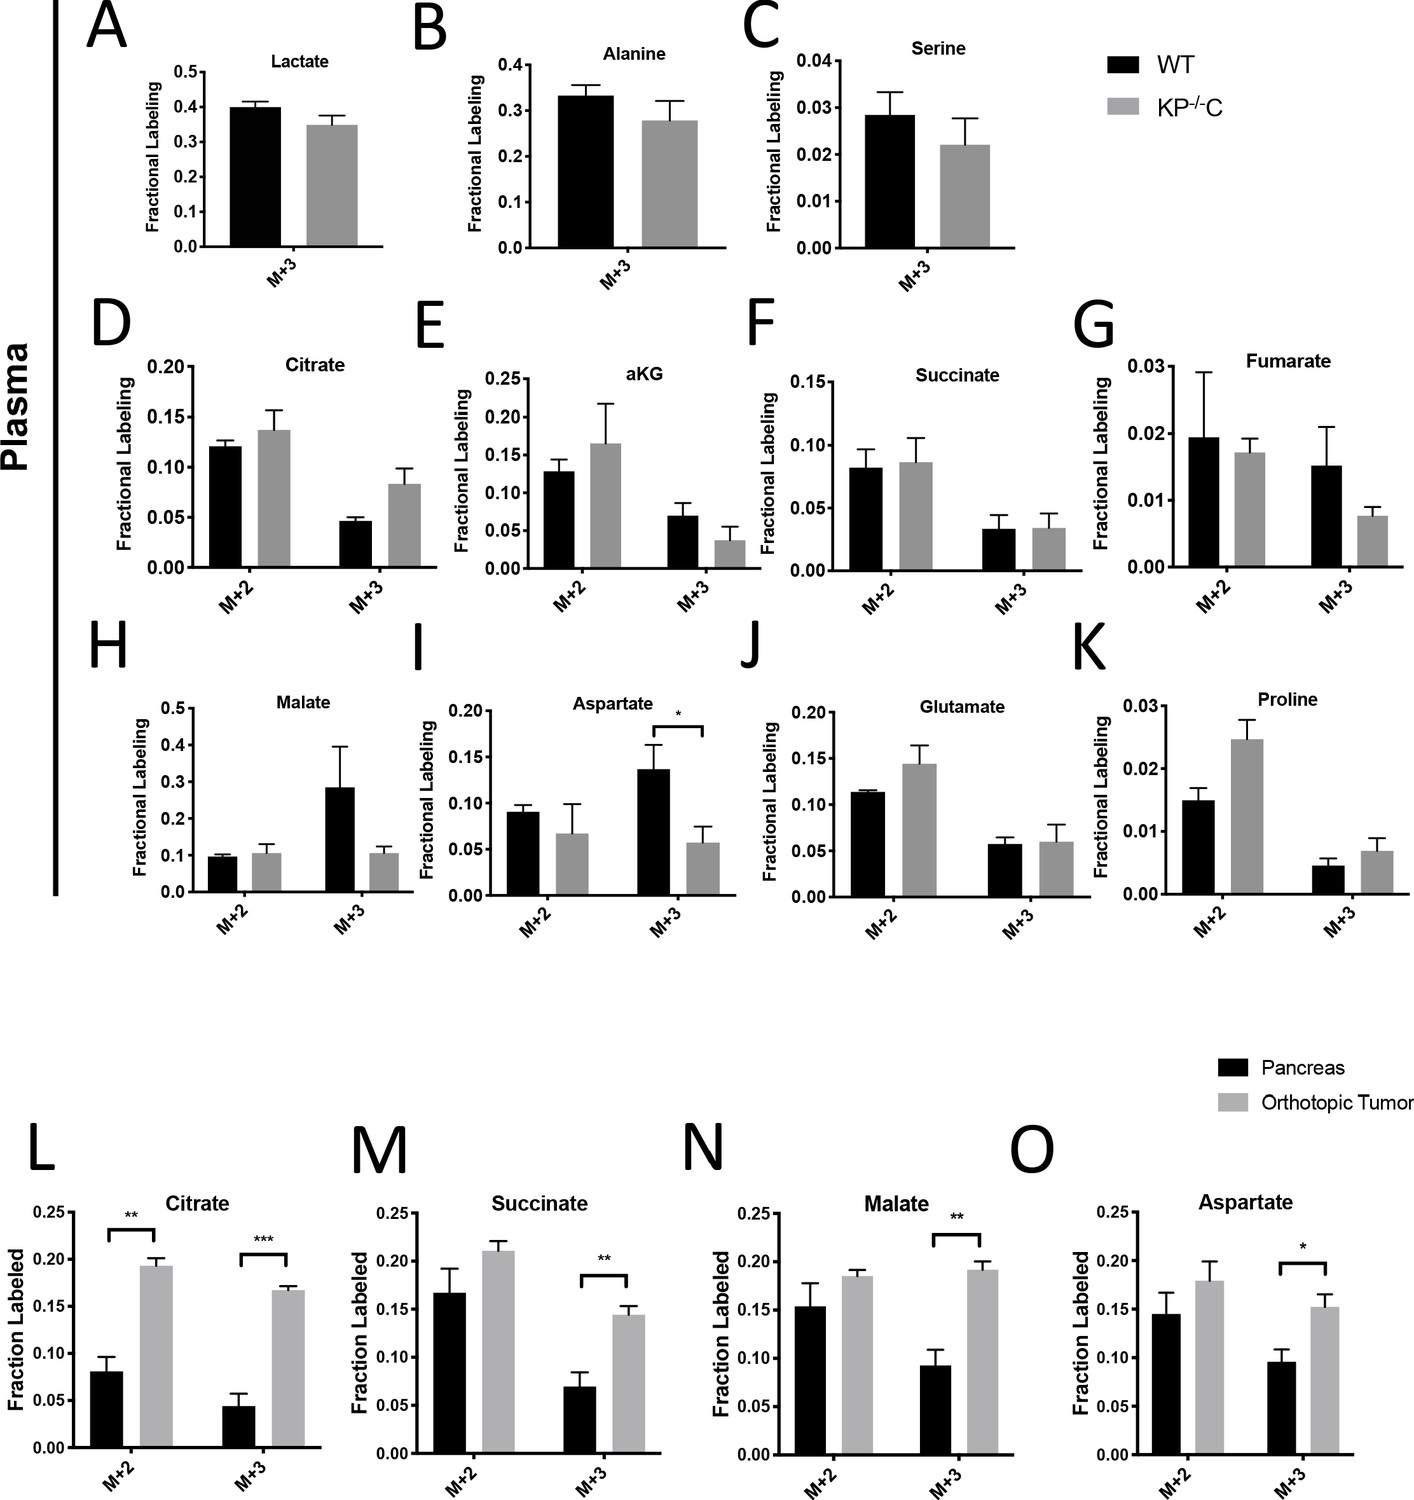
Glucose metabolism in autochthonous and orthotopic PDAC tumors infused with U-13C-glucose at 30 mg/kg/min.
(A–K) The fractional labeling of lactate (A), alanine (B), serine (C), citrate (D), succinate (E), α-ketoglutarate (αKG) (F), fumarate (G), malate (H), aspartate (M+3 p=0.0458) (I), glutamate (J), and proline (K) in plasma in WT mice (black), KP-/-C mice (dark blue), or KPC mice (light blue) following a 4 hr U-13C-glucose infusion at a rate of 30 mg/kg/min. Significance was based on unpaired, Students t-test. pancreas, n = 3; tumor, n = 4. Mean +/- SEM is shown. (L–O) The fractional labeling of citrate (M+2 p=0.0006, M+3 p=0.0001) (L), succinate (M+3 p=0.0049) (M), malate (M+3 p=0.0017) (N), and aspartate (M+3 p=0.0204) (O) in adjacent normal pancreas (black) or orthotopically transplanted pancreatic tumors (grey) from the same mice following a 4 hr U-13C-glucose infusion at a rate of 30 mg/kg/min. Significance was based on unpaired, Students t-test. The M+2 and M+3 isotopomers are shown for each metabolite: n = 4 for each group. Mean +/- SEM is shown.
-
Figure 1—figure supplement 3—source data 1
Plasma isotope labeling in 13C- glucose-infused mice with autochthonous PDAC tumors and metabolite isotope labeling in orthotopic PDAC tumors presented in Figure 1—figure supplement 3.
- https://cdn.elifesciences.org/articles/56782/elife-56782-fig1-figsupp3-data1-v2.xlsx
Figure 2 with 1 supplement

Assessment of pyruvate carboxylase activity in PDAC cancer cells and fibroblasts.
(A) Sections from tumors arising in LSL-KrasG12D/+; Trp53fl/fl; Pdx1-Cre (KP-/-C) mice were stained with an antibody against pyruvate carboxylase. Scale bar represents 100 μm. (B) Representative image from a human pancreatic tumor tissue microarray that was stained with an antibody against pyruvate carboxylase. Scale bar represents 100 μm. (C) Pyruvate carboxylase expression was assessed by qPCR in whole PDAC tumors and different cell populations in sorted from PDAC tumors arising KP-/-C mice. The difference in expression between sorted cancer cells and the whole tumor (p=0.5485) or between sorted cancer cells and fibroblasts from tumors was not significant (p=0.0722) based on unpaired, two-tailed student’s t-tests. Mean +/- SEM is shown. 36B4 was used as a housekeeping gene control. (D–F) The fractional labeling of aspartate (D) or malate (E) in cultured murine PDAC cells derived from tumors in KP-/-C mice (black) and in cultured isolated pancreatic stellate cells (PSCs) (grey) was measured after exposure to U-13C-glucose for 24 hr. The M+2 and M+3 isotopomers are shown for each metabolite. Mean +/- SD is shown. (F) Fluorescent images of KP-/-C PDAC cancer cell organoids expressing tdTomato cultured in DMEM without pyruvate with 10% dialyzed FBS (top) or in the same media conditions with murine PSCs included in the culture (bottom). (G) Quantification of tdTomato fluorescence from images in (G). Organoid cultures with PSCs included had significantly higher tdTomato fluorescence than organoids cultured without PSCs (p=0.0014) based on an unpaired, two-tailed student’s t-test. Mean +/- SD is shown. (H) Expression of pyruvate carboxylase as assessed by qPCR in PDAC cancer cells or PSC cells sorted from organoid co-cultures (3D) or in standard 2D culture as indicated. The difference between cancer cells in 3D compared to PSCs in 3D (p=0.1071) was not significant, but the differences between cancer cells in 3D and cancer cells in 2D (p=0.0140), cancer cells in 3D compared to PSCs in 2D (p=0.0209), PSCs in 3D compared to cancer cells in 2D (p<0.0001), and PSCs in 3D compared to PSCs in 2D (p=0.0014) were significant based on unpaired, two-tailed student’s t-tests. Mean +/- SD is shown. (I–J) The fractional labeling of aspartate (I) or malate (J) in murine PDAC organoid-PSC co-cultures was measured after 24 hr of exposure to U-13C-glucose. The M+2 and M+3 isotopomers are shown for each metabolite. Mean +/- SD is shown.
-
Figure 2—source data 1
Metabolite isotope labeling by U-13C- glucose in unsorted organoid-PSC co-cultures.
- https://cdn.elifesciences.org/articles/56782/elife-56782-fig2-data1-v2.xlsx
Figure 2—figure supplement 1
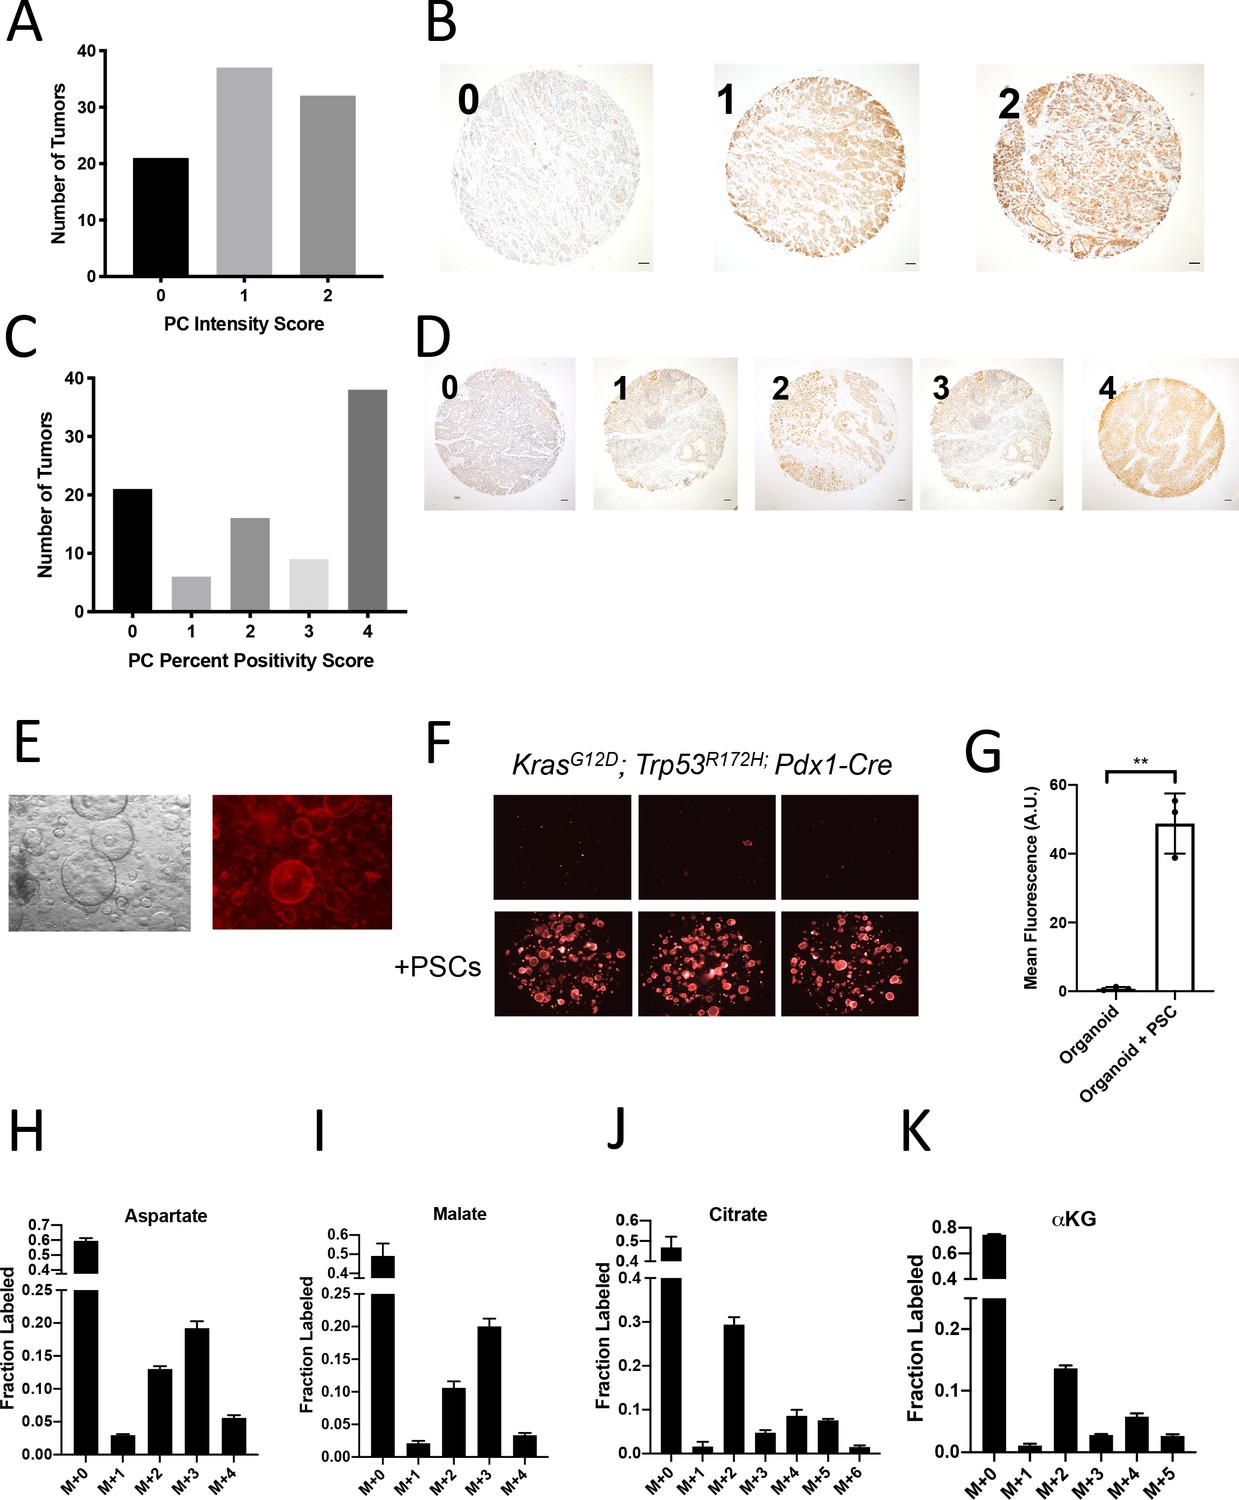
Assessment of pyruvate carboxylase activity in PDAC cancer cells and fibroblasts.
(A) Distribution of pyruvate carboxylase staining intensity scores from a tissue microarray containing sections from 90 human pancreatic tumors. (B) Representative TMA cores containing human pancreatic tumors showing pyruvate carboxylase staining intensity scored as 0, 1, or 2. Scale bars represent 100 μm. (C) Distribution of the scores for percentage of cells positive for pyruvate carboxylase staining in each sample of a tissue microarray containing sections from 90 human pancreatic tumors. (D) Representative TMA cores containing human pancreatic tumors showing the percentage of cells positive for pyruvate carboxylase staining scored as 0–4. Scale bars represent 100 μm. (E) Images including bright field (left) and fluorescent (right) of murine PDAC organoids cultured from KP-/-C mice engineered such that the cancer cells express a fluorescent tdTomato allele. Cultures shown use standard PDAC organoid culture conditions (Boj et al., 2015). (F) Fluorescent images of murine PDAC organoids from LSL-KrasG12D/+; Trp53R172H/+; Pdx1-Cre; (KPC) mice engineered such that the cancer cells express a fluorescent tdTomato allele cultured in DMEM-pyruvate with 10% dialyzed FBS alone (top) or with murine PSCs (bottom). (G) Quantification of tdTomato fluorescence from images in (E). Organoids with PSCs had significantly higher tdTomato fluorescence than organoids grown alone (p=0.0007) based on an unpaired, two-tailed student’s t-test. Mean +/- SD is shown. (H–K) The fractional labeling of aspartate (H), malate (I), citrate (J), or α-ketoglutarate (αKG) (K) in murine PDAC organoid-PSC co-cultures was measured after 24 hr of tracing with U-13C-glucose. The full isotopomer distribution is shown for each metabolite. Mean +/- SD is shown. M+2 and M+3 labeling data from (H–I) is the same as that shown in Figure 2I–J.
Figure 3 with 1 supplement
Turnover of polar metabolites but not protein is fast relative to the time needed to sort cells.
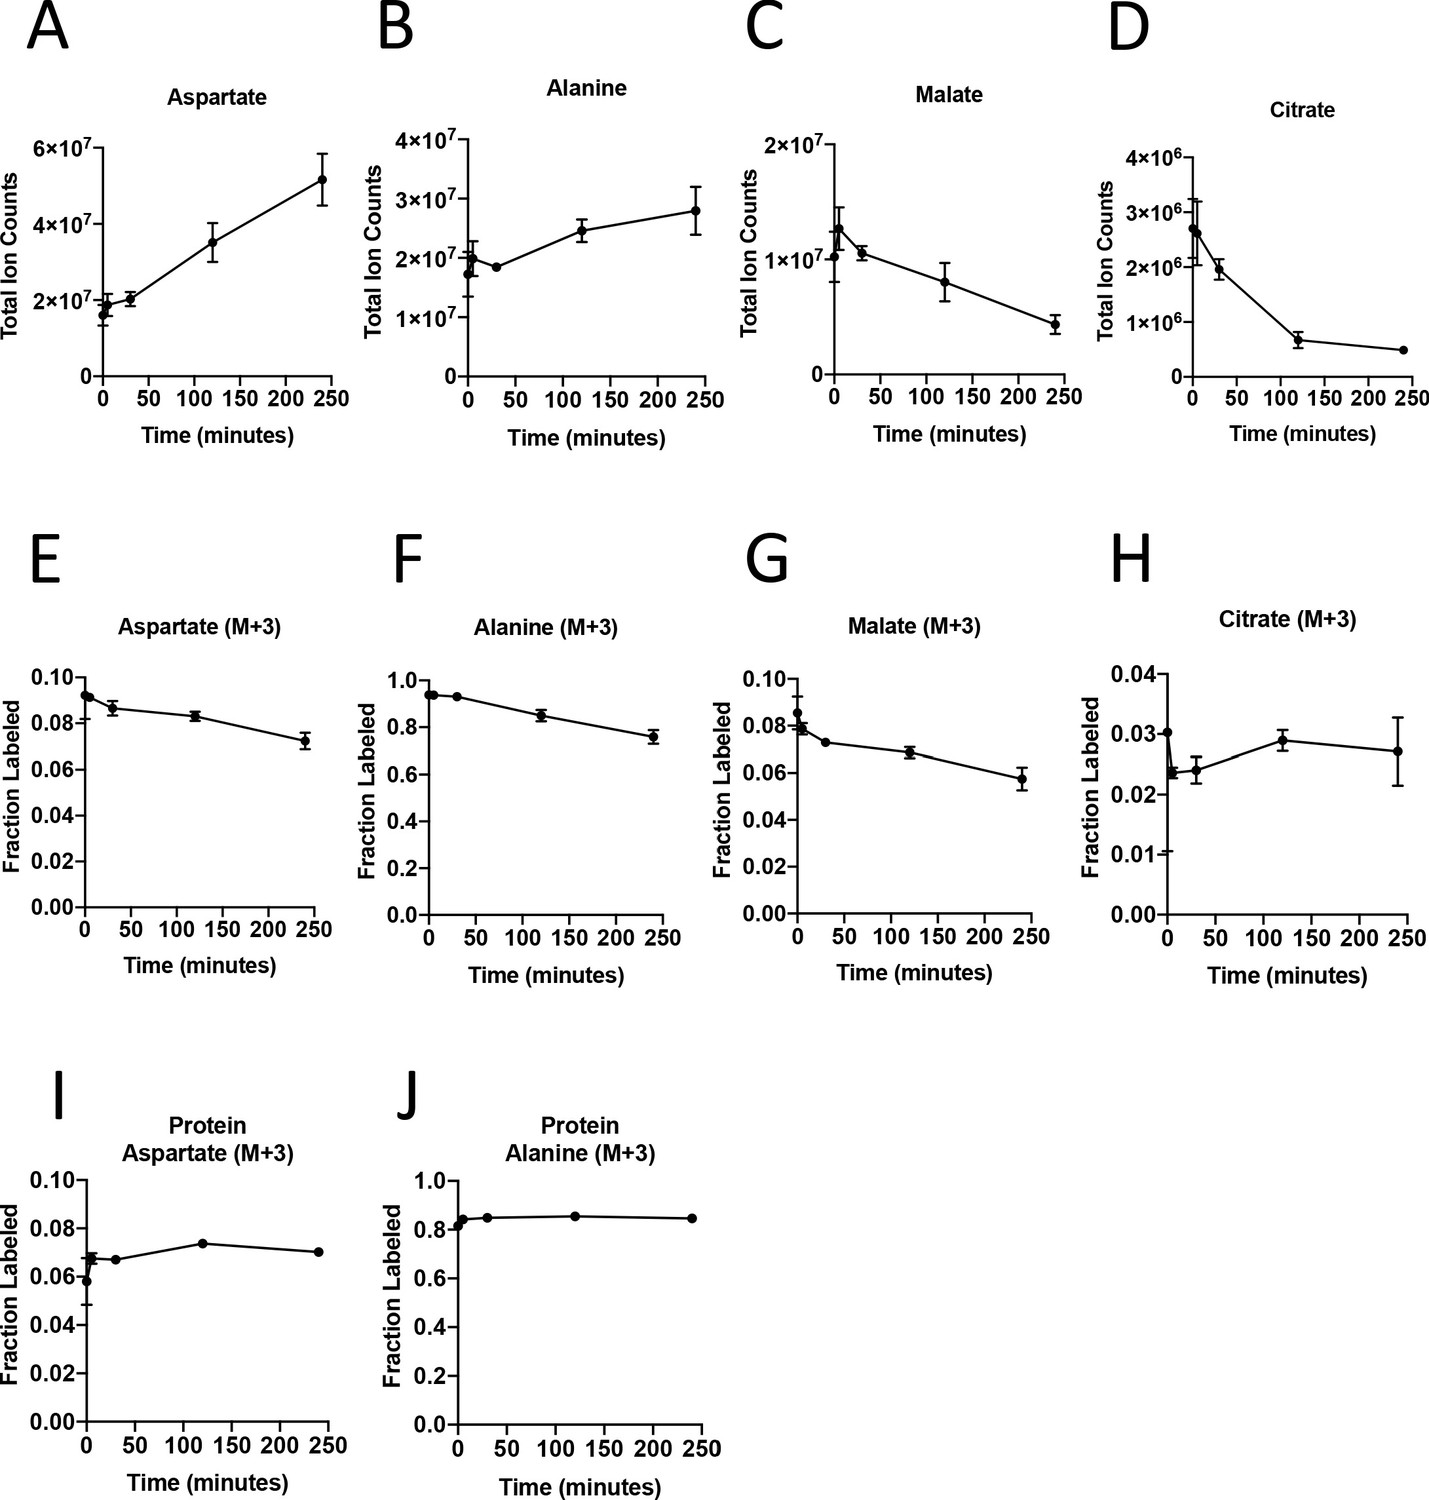
(A–D) Metabolite levels (total ion counts, TIC) of (A) aspartate, (B) alanine, (C) malate, and (D) citrate were measured by GC-MS in AL1376 PDAC cells extracted 0–240 min after incubation in PBS on ice to mimic optimal sorting conditions. Mean +/- SD is shown. (E–H) Fractional labeling of (E) aspartate, (F) alanine, (G) malate, and (H) citrate were measured by GC-MS from cells extracted 0–240 min after incubation in PBS on ice. The M+3 isotopomer is shown. Mean +/- SD is shown. (I–J) Fractional labeling of (I) aspartate and (J) alanine from protein hydrolysates were measured by GC-MS in cells extracted 0–240 min after incubation in PBS on ice. The M+3 isotopomer is shown. Mean +/- SD is shown. Time points analyzed were 0 min (no PBS incubation), 5 min, 30 min, 120 min, or 240 min of incubation in PBS.
-
Figure 3—source data 1
Metabolite abundance, metabolite isotope labeling, and protein hydrolysate isotope labeling by U-13C- glucose in AL1376 PDAC cells.
- https://cdn.elifesciences.org/articles/56782/elife-56782-fig3-data1-v2.xlsx
Figure 3—figure supplement 1
Turnover of polar metabolites but not protein is fast relative to the time needed to sort cells.
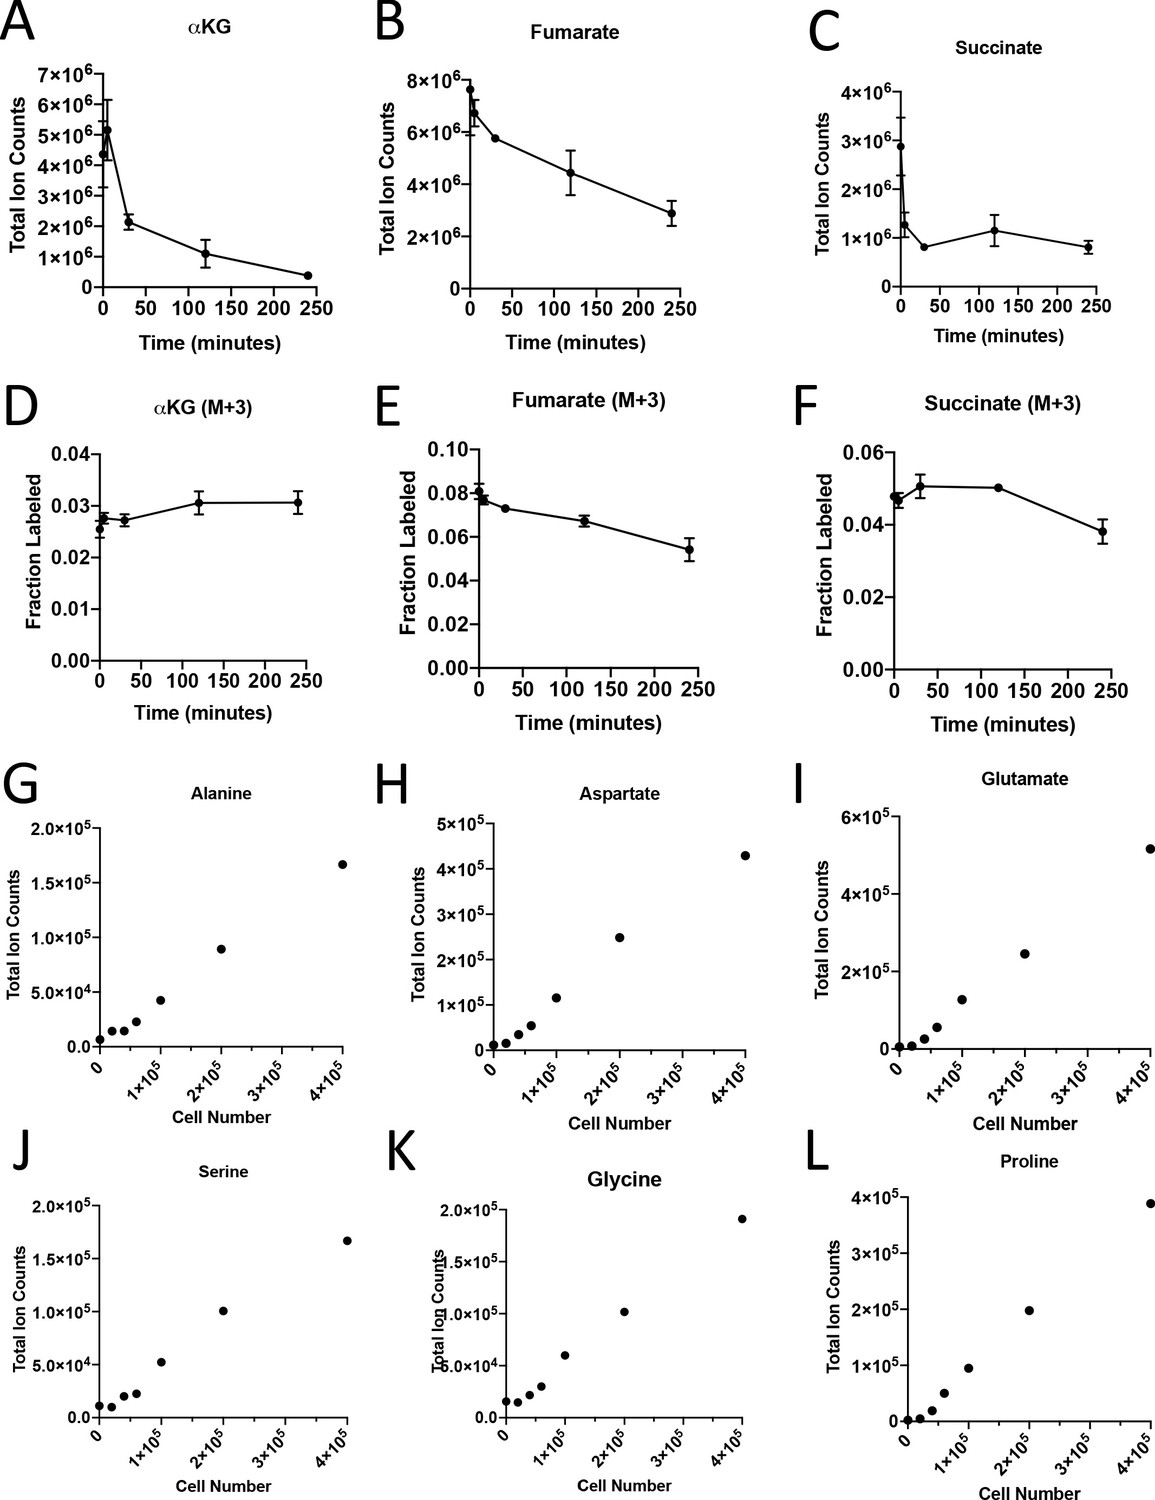
(A–D) Metabolite levels (total ion counts) of (A) α-ketoglutarate (αKG), (B) fumarate, and (C) succinate were measured by GC-MS in cells extracted after 0–240 min in PBS on ice. (D–F) Fractional labeling of (D) α-ketoglutarate, (E) fumarate, and (F) succinate were measured by GC-MS in cells extracted after 0–240 min in PBS on ice. The M+3 isotopomer is shown. Mean +/- SD is shown. (G–L) Metabolite levels (total ion counts) of (G) alanine, (H) aspartate, (I) glutamate, (J) serine, (K) glycine, and (L) proline from protein hydrolysates from sorted cells from tumors from KP-/-C mice.
Figure 4 with 1 supplement
PDAC cancer cells have higher pyruvate carboxylation activity than fibroblasts in organoid co-cultures.
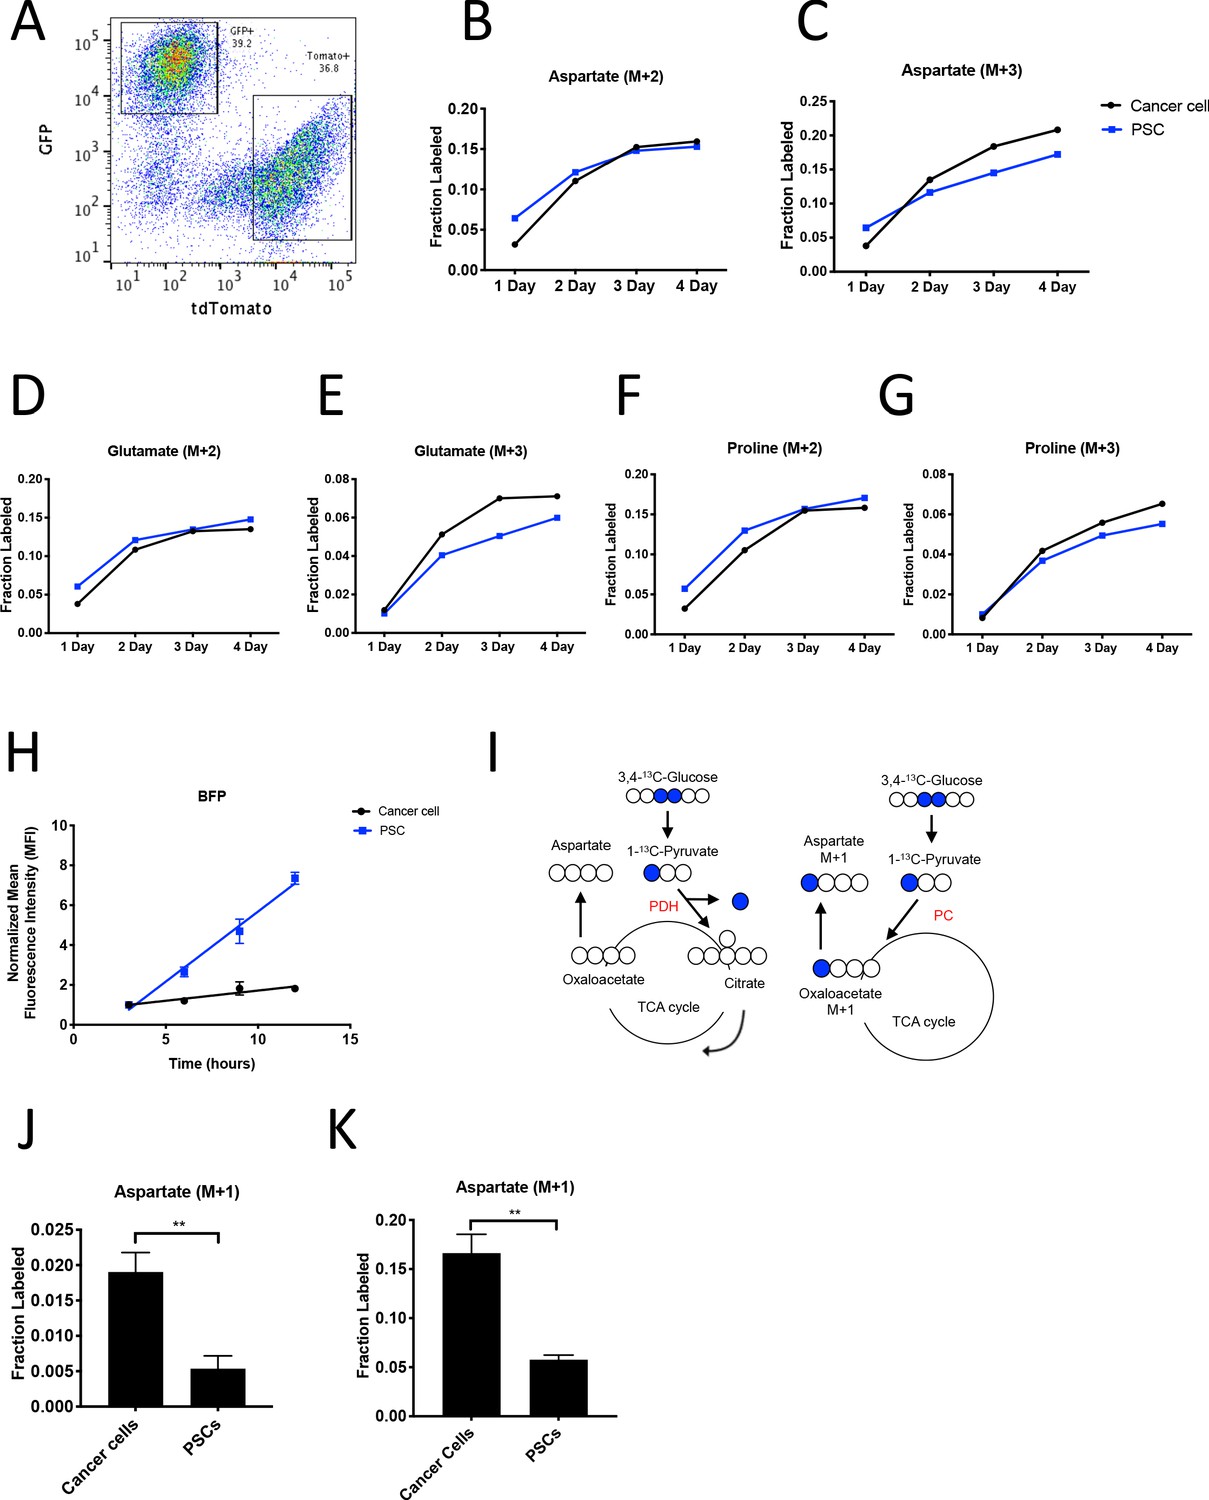
(A) A representative flow cytometry plot showing GFP and tdTomato expression in PSCs and cancer cells respectively from digested organoid-PSC co-cultures. Cells were gated on the single cell, live population. (B–G) Fractional labeling of aspartate (B–C), glutamate (D–E), and proline (F–G) in protein hydrolysates from sorted organoid cancer cells (black) and PSCs (blue) after exposure of organoid co-cultures to U-13C-glucose for the indicated time. Cancer cells were derived from LSL-KrasG12D/+; Trp53fl/fl; Pdx1-Cre; LSL-tdTomato (KP-/-CT) mice. M+2 and M+3 isotopomers are shown as indicated. Each time point represents pooled organoid co-culture samples from one 24-well plate in a representative experiment. (H) BFP fluorescence as measured by flow cytometry of a protein synthesis reporter in the indicated cell type isolated from KP-/-CT PDAC organoid-PSC co-cultures over time following TMP administration. BFP fluorescence is shown for cancer cells (black) and PSCs (blue). Mean +/- SD is shown. Data were normalized to no TMP controls. (I) Schematic illustrating the 13C labeling patterns for 3,4-13C-glucose or 1-13C-pyruvate tracing. TCA cycle metabolites and aspartate are unlabeled from these tracers if metabolized via PDH (left), but result in one carbon labeling (M+1) if metabolized via PC (right). (J) Fractional labeling of aspartate M+1 from protein hydrolysates following three days of KP-/-CT organoid-PSC co-culture with 1-13C-pyruvate. The difference in aspartate M+1 labeling was significant (p=0.0020) using an unpaired student’s t test. Mean +/- SD is shown. (K) Fractional labeling of aspartate M+1 from protein hydrolysates following 3 days of KP-/-CT organoid-PSC co-culture with 3,4-13C-glucose. The difference in aspartate M+1 labeling was significant (p=0.0007) using an unpaired student’s t test. Mean +/- SD is shown.
-
Figure 4—source data 1
Isotope labeling of protein hydrolysates by U-13C- glucose in organoid-PSC co-cultures after sorting.
- https://cdn.elifesciences.org/articles/56782/elife-56782-fig4-data1-v2.xlsx
Figure 4—figure supplement 1
PDAC cancer cells have higher pyruvate carboxylation activity than fibroblasts in organoid co-cultures.
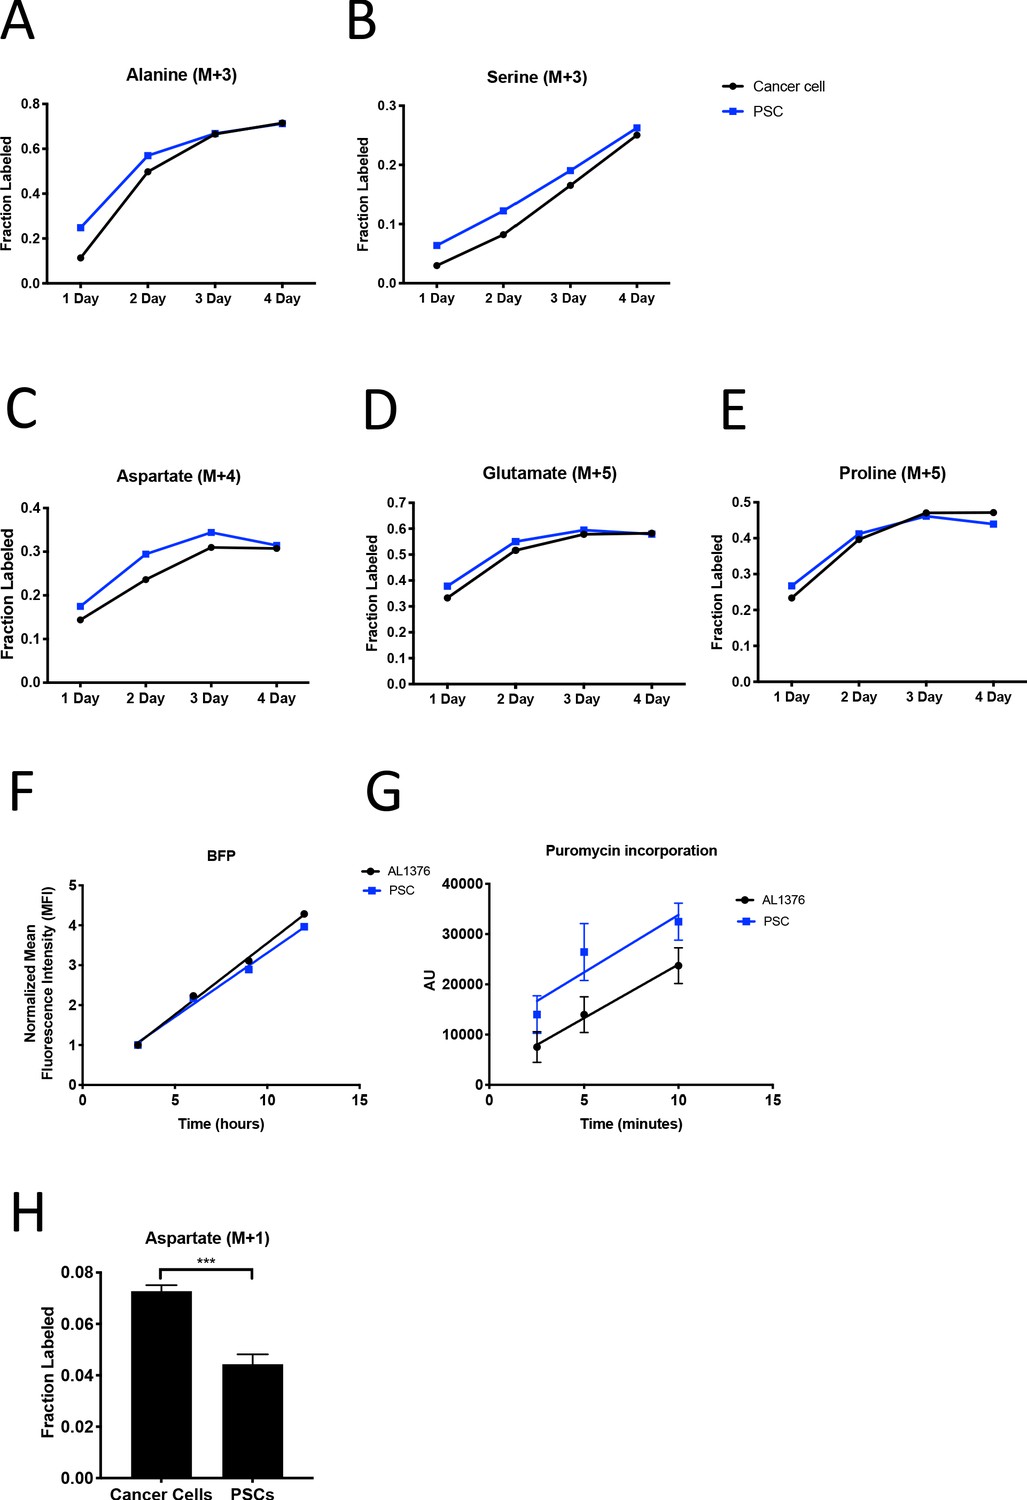
(A–B) Fractional labeling of alanine (A) or serine (B) from protein hydrolysates from sorted organoid cancer cells (black) and PSCs (blue) after tracing with U-13C-glucose in murine organoids from LSL-KrasG12D/+; Trp53fl/fl; Pdx1-Cre; LSL-tdTomato (KP-/-CT) mice. M+3 isotopomers are shown. Each time point represents pooled organoid co-culture samples from one 24-well plate. (C–E) Fractional labeling of aspartate (C), glutamate (D), and proline (E) from protein hydrolysates from sorted organoid cancer cells (black) and PSCs (blue) after tracing with U-13C-glutamine in murine organoids from KP-/-CT mice. M+4 or M+5 isotopomers are shown. Each time point represents pooled organoid co-culture samples from one 24-well plate. (F) BFP fluorescence of a protein synthesis reporter measured by flow cytometry up to 12 hr following TMP administration in murine PDAC cell line AL1376 or PSCs. (G) Puromycin incorporation into protein in PDAC cell line AL1376 (black) or PSCs (blue). Mean +/- SD is shown. As a negative control, 100 ug/mL cycloheximide was added to a plate of cells for 45 min before the addition of puromycin. (H) Fractional labeling of aspartate from protein hydrolysates following three days of 1-13C-pyruvate tracing in organoid-PSC co-cultures using murine PDAC organoids cultured from LSL-KrasG12D/+; Trp53R172H/+; Pdx1-Cre; LSL-tdTomato (KPCT) mice. The difference in aspartate M+1 labeling was significant (p=0.0004) using an unpaired student’s t test. Mean +/- SD is shown.
-
Figure 4—figure supplement 1—source data 1
Isotope labeling of protein hydrolysates by U-13C- glutamine in organoid-PSC co-cultures after sorting.
- https://cdn.elifesciences.org/articles/56782/elife-56782-fig4-figsupp1-data1-v2.xlsx
Figure 5 with 1 supplement

PDAC cancer cells have higher pyruvate carboxylation activity in vivo.
(A–B) Tumors from LSL-KrasG12D/+; Trp53fl/fl; Pdx1-Cre; LSL-tdTomato (KP-/-CT) mice were stained with antibodies against RFP (red) and (A) α-SMA (green), a fibroblast marker, or (B) CK19 (green), a cancer cell marker. Scale bars represent 25 μm. (C) A representative flow cytometry plot showing CD45 and tdTomato expression in cells derived from a PDAC tumor arising in KP-/-CT mice. Cells were gated on the live population. (D) Expression of tdTomato was measured by qPCR in sorted cells from KP-/-CT PDAC tumors. The difference in expression between cancer cells and whole tumor (p=0.0430), fibroblasts (p=0.0156), or hematopoietic cells (p=0.0119) was significant based on unpaired, two-tailed student’s t-tests. Mean +/- SEM is shown. n = 6 mice. 18S was used as a housekeeping gene control. (E) Expression of α-SMA was measured by qPCR in sorted cells from KP-/-CT PDAC tumors. The difference in expression between fibroblasts and whole tumor (p=0.0004), cancer cells (p=0.0013), or hematopoietic cells (p=0.0003) was significant based on unpaired, two-tailed student’s t-tests. Mean +/- SEM is shown. n = 6 mice. 18S was used as a housekeeping gene control. (F) Expression of CD3ε was measured by qPCR in sorted cells from KP-/-CT PDAC tumors. The difference in expression between hematopoietic cells and whole tumor was not significant (p=0.3347), but the difference between hematopoietic cells and cancer cells (p=0.0378) or fibroblasts (p=0.0379) was significant based on unpaired, two-tailed student’s t-tests. Mean +/- SEM is shown. n = 6 mice. 18S was used as a housekeeping gene control. (G) Fractional labeling of aspartate from protein hydrolysates from intact PDAC tumors following a 24 hr U-13C-glucose infusion at a rate of 30 mg/kg/min. n = 4. Mean +/- SEM is shown. (H) Fractional labeling of aspartate from protein hydrolysates from the indicated sorted cell populations from tumors arising in KP-/-CT mice following a 24 hr U-13C-glucose infusion at a rate of 30 mg/kg/min. The M+3 isotopomers are shown. The differences in M+3 aspartate labeling in cancer cells compared to fibroblasts (p=0.0413) and hematopoietic cells (p=0.0005) were significant, and the difference between cancer cells and unsorted tumor cells (p=0.0612) was not significant based on unpaired, two-tailed student’s t-tests. Mean +/- SEM is shown. n = 5 mice. (I) Fractional labeling of aspartate from protein hydrolysates from the indicated sorted cell populations from tumors arising in KP-/-CT mice following a 24 hr U-13C-glucose infusion at a rate of 30 mg/kg/min. The M+2 isotopomers are shown. The differences in M+2 aspartate labeling in cancer cells compared to fibroblasts (p=0.0309) and hematopoietic cells (p=0.0035) were significant, and the difference between cancer cells and unsorted tumor cells (p=0.7444) was not significant based on unpaired, two-tailed student’s t-tests. Mean +/- SEM is shown. n = 5 mice.
-
Figure 5—source data 1
Isotope labeling of protein hydrolysates in mice with autochthonous PDAC tumors after 24 hr of U-13C- glucose infusion and sorting.
- https://cdn.elifesciences.org/articles/56782/elife-56782-fig5-data1-v2.xlsx
Figure 5—figure supplement 1
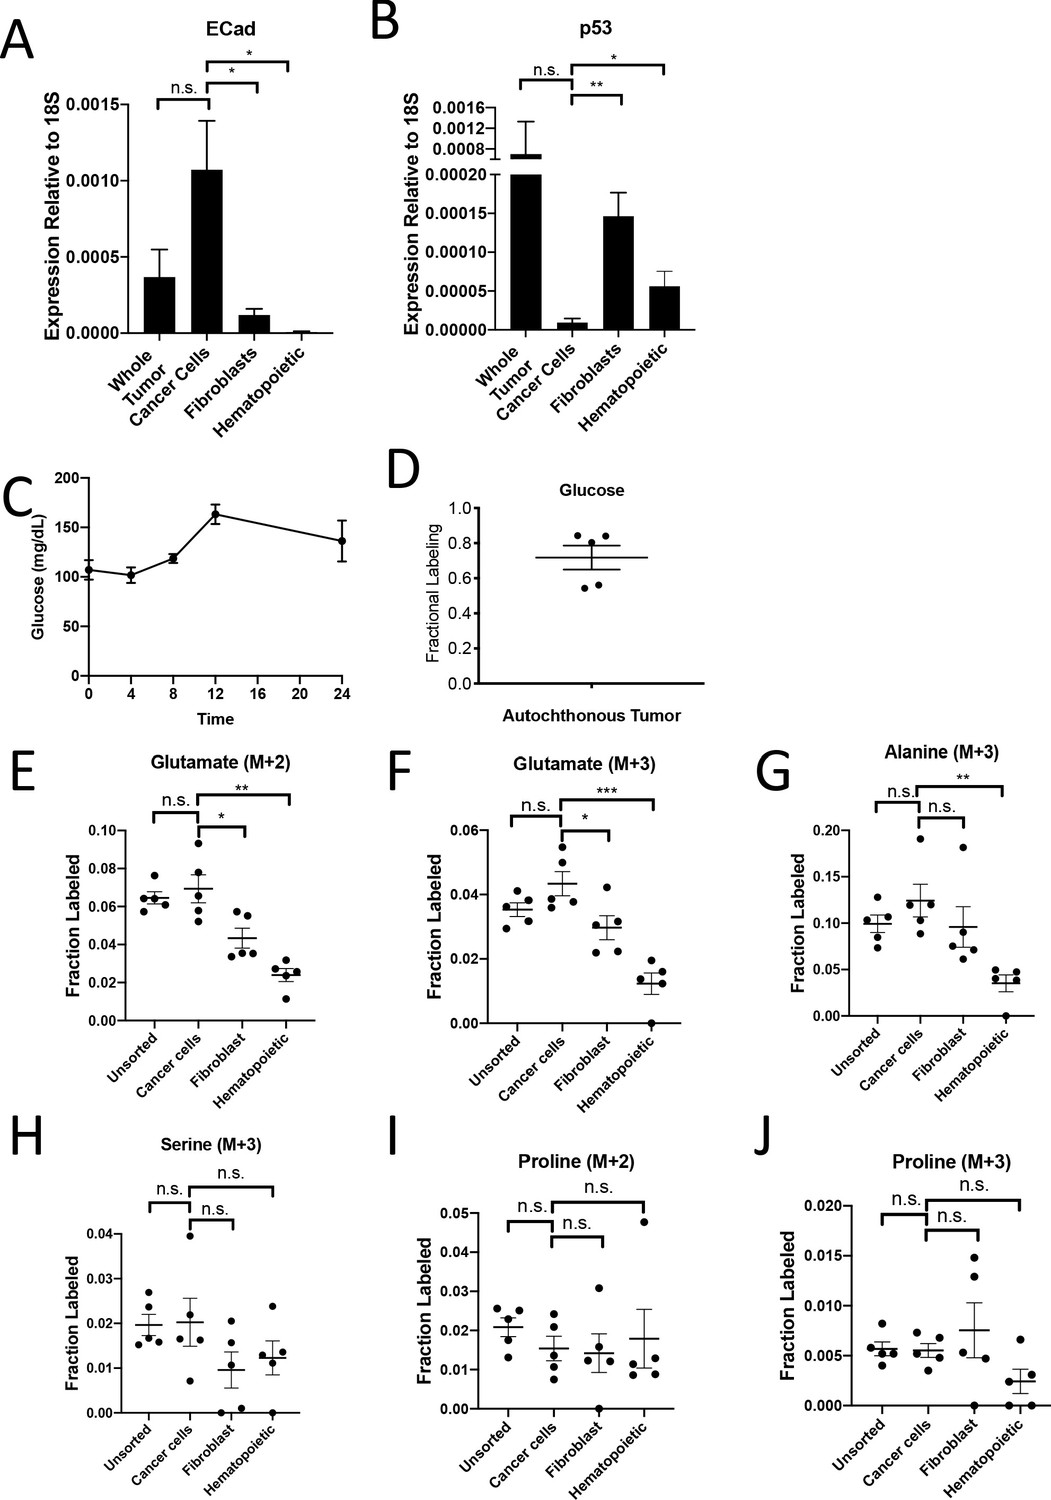
PDAC cancer cells have higher pyruvate carboxylation activity in vivo.
(A) Expression of E-Cadherin was measured by qPCR in sorted cells from KP-/-CT PDAC tumors. The difference in expression between cancer cells and whole tumor was not significant (p=0.0765), but the difference between cancer cells and fibroblasts (p=0.0106) or hematopoietic cells (p=0.0051) was significant based on unpaired, two-tailed student’s t-tests. n = 6 mice. Mean +/- SEM is shown. 18S was used as a housekeeping gene control. (B) Expression of p53 was measured by qPCR in sorted cells from KP-/-CT PDAC tumors. The difference in expression between cancer cells and whole tumor was not significant (p=0.2910), but the difference between cancer cells and fibroblasts (p=0.0006) or hematopoietic cells (p=0.0206) was significant based on unpaired, two-tailed student’s t-tests. n = 6 mice. Mean +/- SEM is shown. 18S was used as a housekeeping gene control. (C) Blood glucose levels over time in mice infused with U-13C-glucose for 24 hr at a rate of 30 mg/kg/min. n = 4. Mean +/- SEM is shown. (D) Enrichment of fully labeled glucose (M+6) in plasma from mice following a 24 hr U-13C-glucose infusion at a rate of 30 mg/kg/min. n = 5. Mean +/- SEM is shown. (E) Fractional labeling of M+2 glutamate from protein hydrolysates from sorted cell populations from tumors from KP-/-CT mice following a 24 hr U-13C-glucose infusion at a rate of 30 mg/kg/min. The differences in M+2 glutamate labeling in cancer cells compared to fibroblasts (p=0.0208) and hematopoietic cells (p=0.0005) were significant, and the difference between cancer cells and unsorted tumor cells (p=0.5667) was not significant based on unpaired, two-tailed student’s t-tests. Mean +/- SEM is shown. n = 5 mice. (F) Fractional labeling of M+3 glutamate from protein hydrolysates from sorted cell populations from tumors from KP-/-CT mice following a 24 hr U-13C-glucose infusion at a rate of 30 mg/kg/min. The differences in M+3 glutamate labeling in cancer cells compared to fibroblasts (p=0.0323) and hematopoietic cells (p=0.0003) were significant, and the difference between cancer cells and unsorted tumor cells (p=0.0994) was not significant based on unpaired, two-tailed student’s t-tests. n = 5 mice. Mean +/- SEM is shown. (G) Fractional labeling of M+3 alanine from protein hydrolysates from sorted cell populations from tumors from KP-/-CT mice following a 24 hr U-13C-glucose infusion at a rate of 30 mg/kg/min. The differences in M+3 alanine labeling in cancer cells compared to fibroblasts (p=0.3415) or unsorted tumor cells (p=0.2448) were not significant, but the difference between labeling in cancer cells and hematopoietic cells (p=0.0020) was significant based on unpaired, two-tailed student’s t-tests. n = 5 mice. Mean +/- SEM is shown. (H) Fractional labeling of M+3 serine from protein hydrolysates from sorted cell populations from tumors from KP-/-CT mice following a 24 hr U-13C-glucose infusion at a rate of 30 mg/kg/min. The differences in M+3 serine labeling in cancer cells compared to fibroblasts (p=0.1499), hematopoietic cells (p=0.2590), and unsorted tumor cells (p=0.9210) were not significant based on unpaired, two-tailed student’s t-tests. n = 5 mice. Mean +/- SEM is shown. (I) Fractional labeling of M+2 proline from protein hydrolysates from sorted cell populations from tumors from KP-/-CT mice following a 24 hr U-13C-glucose infusion at a rate of 30 mg/kg/min. The differences in M+2 proline labeling in cancer cells compared to fibroblasts (p=0.8450), hematopoietic cells (p=0.7661), and unsorted tumor cells (p=0.2039) were not significant based on unpaired, two-tailed student’s t-tests. n = 5 mice. Mean +/- SEM is shown. (J) Fractional labeling of M+3 proline from protein hydrolysates from sorted cell populations from tumors from KP-/-CT mice following a 24 hr U-13C-glucose infusion at a rate of 30 mg/kg/min. The differences in M+3 proline labeling in cancer cells compared to fibroblasts (p=0.4966), hematopoietic cells (p=0.0576), and unsorted tumor cells (p=0.8742) were not significant based on unpaired, two-tailed student’s t-tests. n = 5 mice. Mean +/- SEM is shown.
Figure 6 with 2 supplements
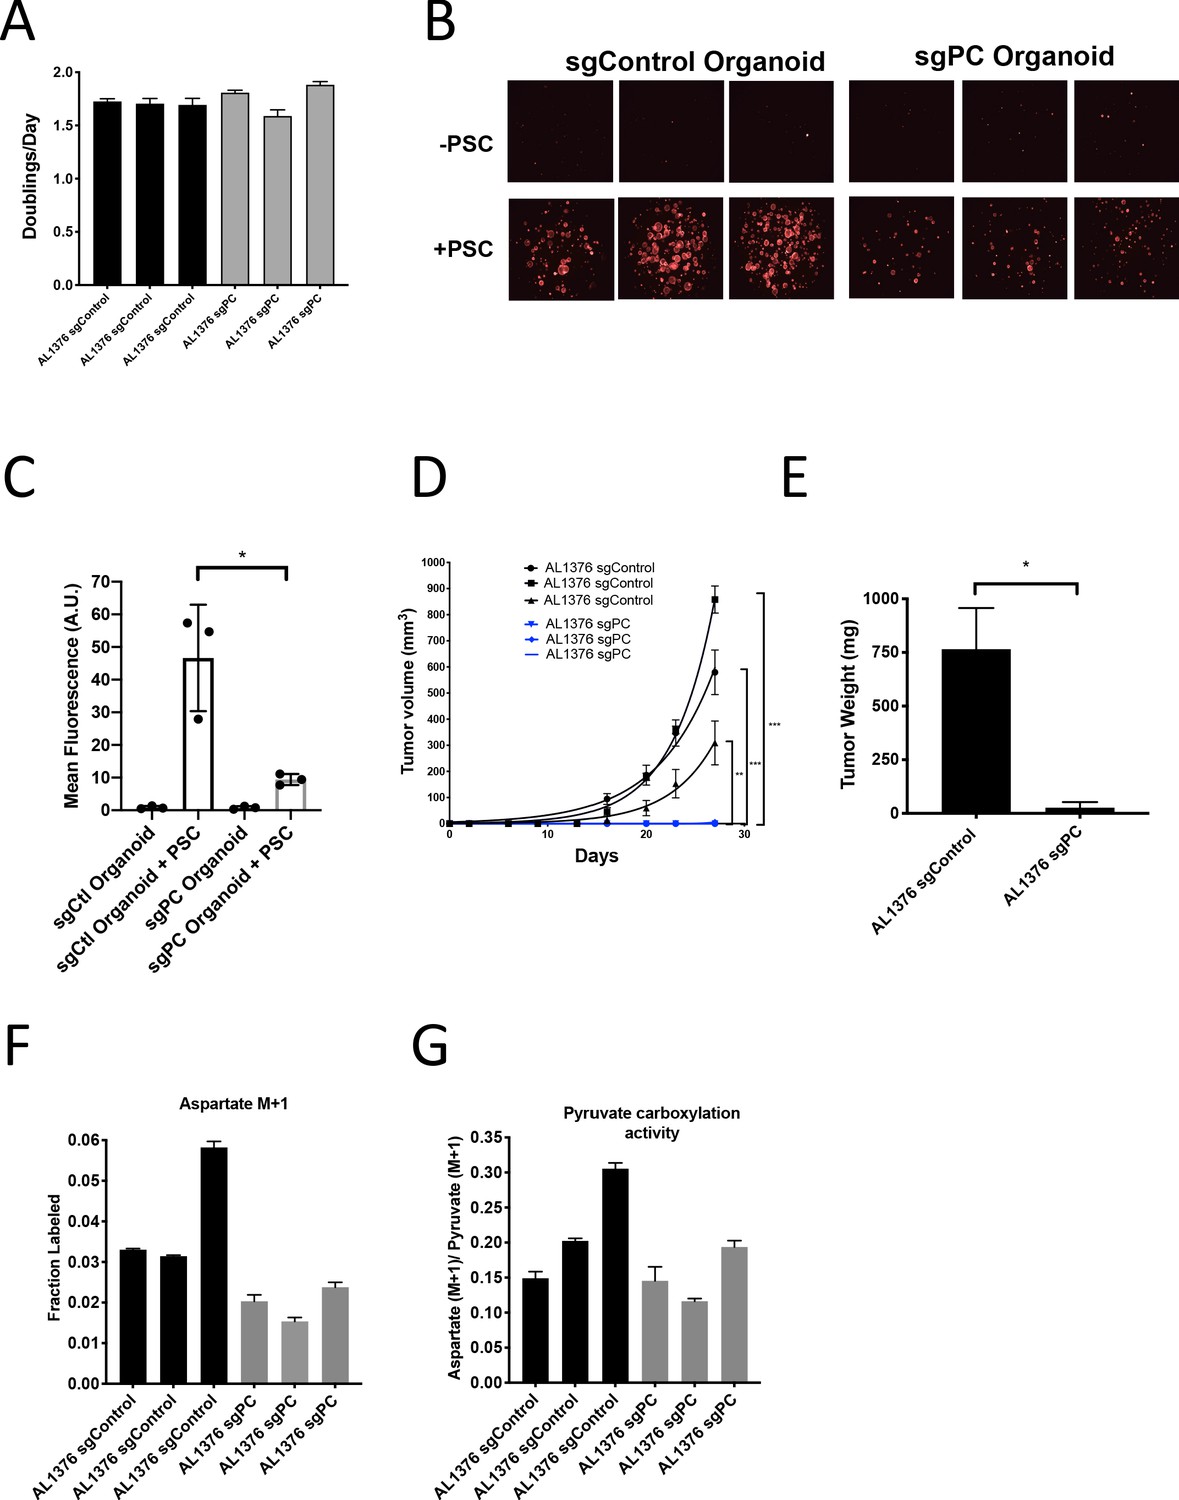
Pyruvate carboxylase in cancer cells is required for PDAC tumor growth in vivo.
(A) Proliferation rate of AL1376 murine PDAC cells without (sgControl) or with (sgPC) deletion in standard 2D culture. Mean +/- SD is shown. (B) Fluorescent images of murine PDAC cancer cell organoids expressing tdTomato without (sgControl) or with (sgPC) deletion cultured in DMEM-pyruvate with 10% dialyzed FBS alone (top) or with murine PSCs (bottom). (C) Quantification of tdTomato fluorescence from images in (B). Control organoids with PSCs had significantly higher tdTomato fluorescence than sgPC organoids grown with PSCs (p=0.0171) based on an unpaired, two-tailed student’s t-test. Mean +/- SD is shown. (D) Growth of sgControl (black) and sgPC (blue) AL1376 murine PDAC cells as tumors following subcutaneous transplantation into syngeneic Bl6 mice. The final tumor volume is significantly greater in sgControl AL1376 cells compared to sgPC cells based on unpaired, two-tailed student’s t-tests (p<0.0001 to 0.0049). Mean +/- SEM is shown. n = 6 for each group. (E) Growth of sgControl and sgPC AL1376 murine PDAC cells as tumors after orthotopic transplantation into the pancreas of syngeneic Bl6 mice. Tumor weight was measured after 21 days and was significantly greater in mice transplanted with sgControl cells based on an unpaired, two-tailed student’s t-test (p=0.0050). Mean +/- SEM is shown. n = 5 mice for each group. (F) Fractional labeling of aspartate in sgControl and sgPC AL1376 murine PDAC cells after 24 hr of culture with 1-13C-pyruvate. Mean +/- SD is shown. (G) Aspartate M+1 isotopomer labeling from (F) was normalized to pyruvate M+1 labeling as a surrogate for pyruvate carboxylation activity. Mean +/- SD is shown.
Figure 6—figure supplement 1

Pyruvate carboxylase in cancer cells is required for PDAC tumor growth in vivo.
(A) Western blot for PC expression levels in AL1376 murine sgPC PDAC cell lines compared to sgControl cell lines made using CRISPRi using β-actin as a control. (B) Fractional labeling of aspartate M+1 following 24 hr of 1-13C-pyruvate tracing in AL1376 murine sgPC PDAC cell lines compared to sgControl cell lines. The difference in labeling between AL1376 sgControl cells and sgPC-1 cells (p=0.1564) was not significant and the difference in labeling between AL1376 sgControl cells and sgPC-2 cells (p=0.0304) was significant based on unpaired, two-sided student’s t tests. Mean +/- SD is shown. (C) Aspartate M+1 isotopomer labeling from (B) was normalized to pyruvate M+1 labeling as a surrogate for pyruvate carboxylation activity following 24 hr of 1-13C-pyruvate tracing. The difference in pyruvate carboxylation activity between AL1376 sgControl cells and sgPC-1 cells (p=0.0782) was not significant and the difference in pyruvate carboxylation activity between AL1376 sgControl cells and sgPC-2 cells (p=0.0260) was significant based on unpaired, two-sided student’s t tests. Mean +/- SD is shown. (D) Proliferation rate of sgControl and sgPC AL1376 knockdown murine PDAC cell lines generated using CRISPRi over 3 days in DMEM with 10% FBS. Differences in proliferation between AL 1376 sgControl cells and sgPC-1 (p=0.0609) or sgPC-2 (p=0.7585) cells were not significant based on unpaired, two-sided student’s t tests. Mean +/- SD is shown. (E) Western blot analysis of PC expression levels in sgPC knockdown PDAC organoids compared to sgControl organoids made using CRISPRi using β-actin as a control. (F) Fluorescent images of sgControl or sgPC knockdown murine PDAC organoids cultured in DMEM-pyruvate with 10% dialyzed FBS alone (left) or with murine PSCs (right). (G) Quantification of tdTomato fluorescence from images in (F). sgControl organoids with PSCs trended towards higher tdTomato fluorescence compared to sgPC-1 organoids with PSCs (p=0.1166) and had significantly higher tdTomato fluorescence than sgPC-2 organoids with PSCs (p=0.0272) based on unpaired, two-tailed student’s t-tests. Mean +/- SD is shown. (H) Western blot for PC expression levels in AL1376 murine sgPC knockdown and PC overexpression PDAC cell lines compared to sgControl cell lines using β-actin as a control. (I) Fractional labeling of aspartate M+1 following 24 hr of 1-13C-pyruvate tracing in AL1376 murine sgPC and PC rescue PDAC cell lines compared to sgControl cell lines made using CRISPRi. Labeling is significantly increased in AL1376 sgControl + PC cells compared to sgControl + EV cells (p<0.0001), AL1376 sgPC1 + PC cells compared to sgPC + EV cells (p<0.0001), and AL1376 sgPC2 + PC cells compared to sgPC2 + EV cells (p=0.0002). Mean +/- SD is shown. (J) Aspartate M+1 isotopomer labeling from (I) was normalized to pyruvate M+1 labeling as a surrogate for pyruvate carboxylation activity following 24 hr of 1-13C-pyruvate tracing. Pyruvate carboxylation activity is significantly increased in AL1376 sgControl + PC cells compared to sgControl + EV cells (p<0.0001), AL1376 sgPC1 + PC cells compared to sgPC + EV cells (p<0.0001), and AL1376 sgPC2 + PC cells compared to sgPC2 + EV cells (p<0.0001). Mean +/- SD is shown. (K) Growth of sgControl (blue) or sgPC knockdown (red and green) AL1376 murine PDAC cell lines after subcutaneous transplantation into syngeneic Bl6 mice. There is no significant difference in final tumor volume between sgControl AL1376 cells and sgPC1 cells (p=0.7577) and between sgControl AL1376 cells and sgPC2 cells (p=0.9830) cells based on unpaired, two-tailed student’s t-tests. Mean +/- SEM is shown. n = 6 for each group. (L) Western blot showing PC expression in whole tumor lysates from tumors formed from sgControl or sgPC AL1376 knockdown cells after subcutaneous transplantation from (K). (M) Western blot analysis of PC expression levels in single-cell cloned sgPC knockout PDAC cells compared to sgControl clones using β-actin as a control. (N) Western blot analysis of PC expression levels in single-cell cloned sgPC knockout PDAC organoids compared to sgControl organoids using β-actin as a control.
Figure 6—figure supplement 2

Pyruvate carboxylase knockout PSCs retain ability to enhance PDAC growth.
(A) Western blot analysis of PC expression levels in single-cell cloned sgPC knockout PSCs compared to sgControl clones using β-actin as a control. (B) Fractional labeling of aspartate M+1 following 24 hr of 1-13C-pyruvate tracing in sgPC PSC cell lines compared to sgControl cell lines. Mean +/- SD is shown. (C) Aspartate M+1 isotopomer labeling from (P) was normalized to pyruvate M+1 labeling as a surrogate for pyruvate carboxylation activity following 24 hr of 1-13C-pyruvate tracing. Mean +/- SD is shown. (D) Fluorescent images of murine PDAC organoids cultured in DMEM-pyruvate with 10% dialyzed FBS alone (top), with murine sgControl PSCs (middle), or with murine sgPC PSCs (bottom). (E) Quantification of tdTomato fluorescence from images in (R). The differences in tdTomato fluorescence between organoids alone and organoids with sgControl PSCs (0.0023), organoids alone and organoids with sgPC PSCs (p=0.0122), and organoids with sgControl PSCs and organoids with sgPC PSCs (p=0.0041) are significant based on unpaired, two-tailed student’s t-tests. Mean +/- SD is shown. (F) Growth of sgControl AL1376 murine PDAC cell lines alone (blue), with sgControl PSCs (green), or sgPC PSCs (black) after subcutaneous transplantation into syngeneic Bl6 mice. There is no significant difference in final tumor volume between sgControl AL1376 cells and sgControl AL1376 cells co-injected with sgPC PSCs (p=0.1313), but differences are significant at intermediate time points. The difference in final tumor volume is significant between sgControl AL1376 cells and sgControl AL1376 cells with sgControl PSCs (p<0.0001), based on unpaired, two-tailed student’s t-tests. Mean +/- SEM is shown. n = 6 for each group.
Figure 7 with 2 supplements
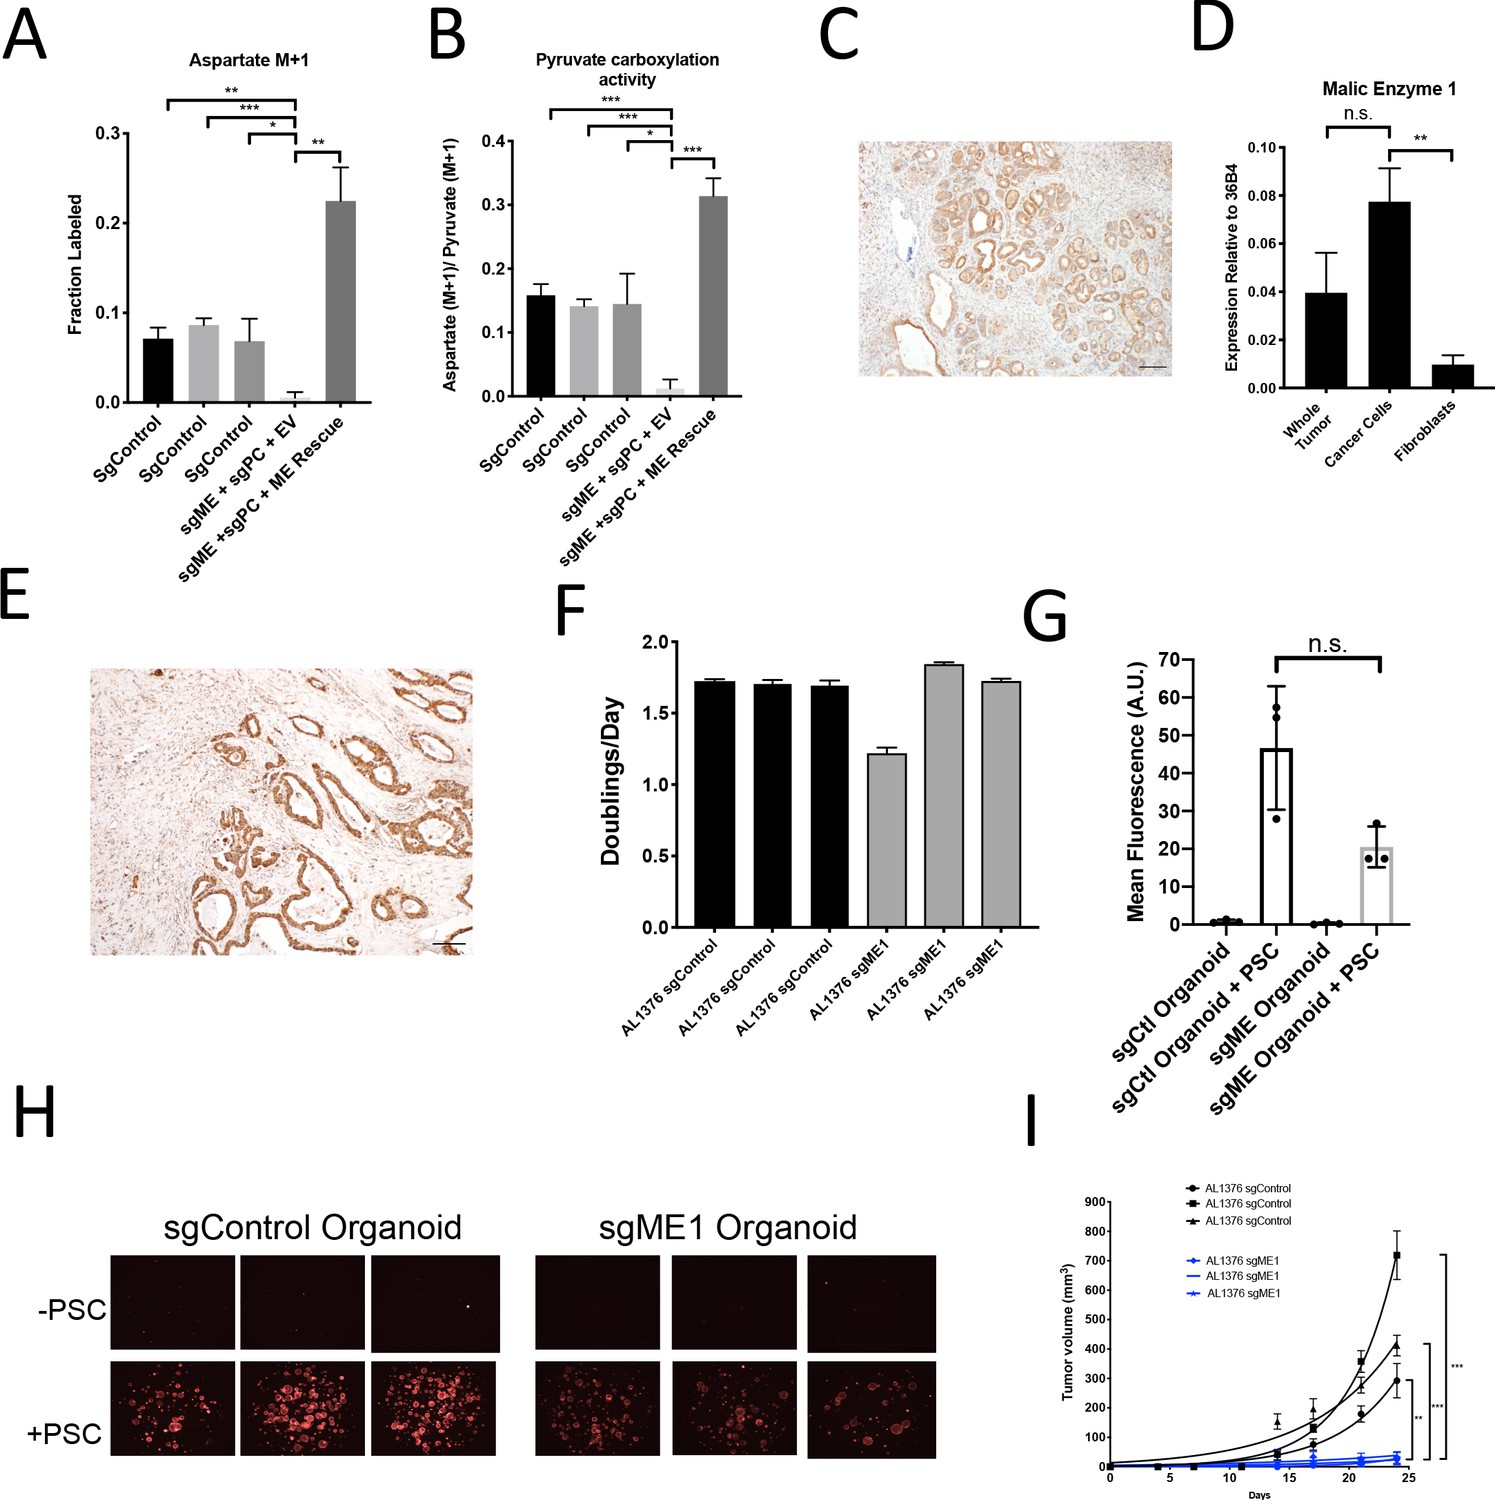
Malic enzyme 1 contributes to pyruvate carboxylation activity in PDAC cells and is important for tumor growth.
(A–B) CRISPR/Cas9 was used to disrupt PC and/or ME1 as indicated in AL1376 murine PDAC cells. (A) Fractional labeling of M+1 aspartate following culture of the indicated cells for 24 hr in media containing 1-13C-pyruvate. M+1 aspartate labeling was significantly decreased in double knockout cells compared to control cells (p=0.0012, 0.0001, and 0.0131) or to double knockout cells with exogenous ME1 expression (ME rescue) (p=0.0006) based on unpaired, two-tailed student’s t-tests. Mean +/- SD is shown. (B) Aspartate M+1 isotopomer labeling was normalized to pyruvate M+1 labeling as a surrogate for pyruvate carboxylation activity following 24 hr of 1-13C-pyruvate tracing. Pyruvate carboxylation activity was significantly decreased in double knockout cells compared to control cell lines (p=0.0004, 0.0002, and 0.0100) or to double knockout cells with exogenous ME1 expression (ME rescue) (p<0.0001) based on unpaired, two-tailed student’s t-tests. Mean +/- SD is shown. (C) Sections from tumors arising in LSL-KrasG12D/+; Trp53fl/fl; Pdx1-Cre (KP-/-C) mice were stained with an antibody against ME1. Scale bar represents 100 μm. (D) Expression of ME1 was measured by qPCR in the indicated cells sorted from tumors arising in KP-/-C mice. The expression of ME1 was not significantly different in sorted cancer cells compared to the whole tumor (p=0.1114), but was significantly higher in sorted cancer cells compared to fibroblasts (p=0.0009) based on unpaired, two-tailed student’s t-tests. Mean +/- SEM is shown. 36B4 was used as a housekeeping gene control. (E) Representative image from a human pancreatic tumor tissue microarray stained with an antibody against ME1. Scale bar represents 100 μm. (F) Proliferation rate of sgControl and sgME1 AL1376 murine PDAC cells in standard 2D culture. (G) Quantification of tdTomato fluorescence from images of sgControl or sgME1 PDAC cancer cell organoids isolated from KP-/-CT tumors cultured in DMEM-pyruvate with 10% dialyzed FBS alone or with murine PSCs. sgControl organoids with PSCs trended towards higher tdTomato fluorescence compared to sgME1 organoids with PSCs (p=0.0579) but was not significant based on an unpaired, two-tailed student’s t-test. Mean +/- SD is shown. The sgControl data are also shown in Figure 6B–C. (H) Fluorescent images of sgControl or sgME1 PDAC cancer cell organoids cultured DMEM-pyruvate with 10% dialyzed FBS alone (top) or with murine PSCs (bottom). The sgControl images are also shown in Figure 6B–C. (I) Growth of sgControl (black) and sgME1 (blue) AL1376 murine PDAC cells as tumors following subcutaneous transplantation into syngeneic B6 mice. The final tumor volume is significantly greater in sgControl AL1376 cells compared to sgME1 cells based on unpaired, two-tailed student’s t-tests (p<0.0001 to 0.0017). Mean +/- SEM is shown. n = 6 for each group.
Figure 7—figure supplement 1
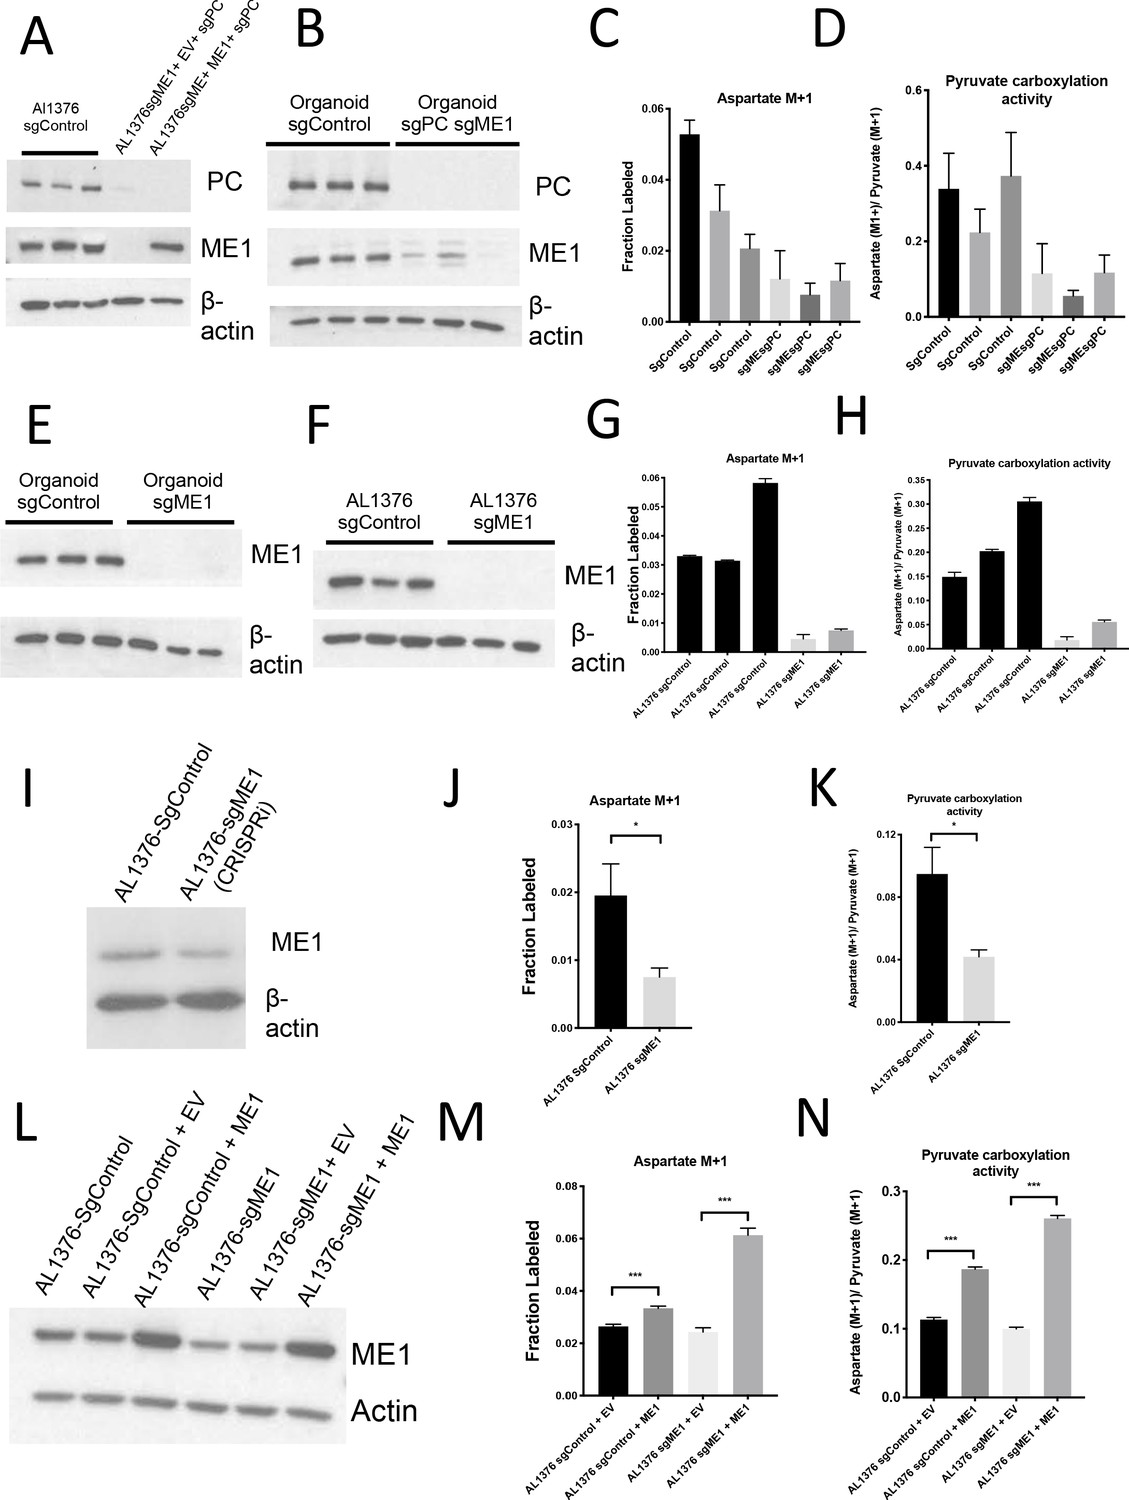
Malic enzyme 1 contributes to pyruvate carboxylation activity in PDAC cells and is important for tumor growth.
(A) Western blot for PC and ME1 expression levels in double knockout AL1376 PDAC cells compared to control and ME1 rescue cells using β-actin as a control. (B–D) CRISPR/Cas9 was used to knockout both PC and ME1 in murine PDAC organoids. (B) Fractional labeling of aspartate following 24 hr of 1-13C-pyruvate tracing. Mean +/- SD is shown. (C) Aspartate M+1 isotopomer labeling was normalized to pyruvate M+1 labeling as a surrogate for pyruvate carboxylase activity following 24 hr of 1-13C-pyruvate tracing. Mean +/- SD is shown. (D) Western blot for PC and ME1 expression levels in double knockout organoids compared to control organoids using β-actin as a control. (E–G) CRISPR/Cas9 was used to knockout ME1 in AL1376 PDAC cells. (E) Western blot analysis of ME1 expression levels in sgME1 knockout organoids compared to sgControl organoids using β-actin as a control. (F) Western blot analysis of ME1 expression levels in single-cell cloned sgME1 knockout AL1376 PDAC cells compared to sgControl clones using β-actin as a control. (G) Fractional labeling of aspartate following 24 hr of 1-13C-pyruvate tracing. Mean +/- SD is shown. (H) Aspartate M+1 isotopomer labeling was normalized to pyruvate M+1 labeling as a surrogate for pyruvate carboxylase activity following 24 hr of 1-13C-pyruvate tracing. Mean +/- SD is shown. (I) Western blot for ME1 expression levels in AL1376 murine sgME1 PDAC cell line compared to sgControl cell line made using CRISPRi using β-actin as a control. (J) Fractional labeling of aspartate M+1 following 24 hr of 1-13C-pyruvate tracing in AL1376 murine sgME1 PDAC cell lines compared to sgControl cell lines. The difference in labeling between AL1376 sgControl cells and sgME1 cells (p=0.0126) was significant based on unpaired, two-sided Student’s t tests. Mean +/- SD is shown. (K) Aspartate M+1 isotopomer labeling from (I) was normalized to pyruvate M+1 labeling as a surrogate for pyruvate carboxylation activity following 24 hr of 1-13C-pyruvate tracing. The difference in pyruvate carboxylation activity between AL1376 sgControl cells and sgME1 cells (p=0.0065) was significant based on unpaired, two-sided student’s t tests. Mean +/- SD is shown. (L) Western blot for ME1 expression levels in AL1376 murine sgME1 knockdown and ME1 overexpression PDAC cell lines compared to sgControl cell lines using β-actin as a control. (M) Fractional labeling of aspartate M+1 following 24 hr of 1-13C-pyruvate tracing in AL1376 murine sgME1 and ME1 rescue PDAC cell lines compared to sgControl cell lines made using CRISPRi. Labeling is significantly increased in AL1376 sgControl + ME1 cells compared to sgControl + EV cells (p=0.0005) and AL1376 sgME1 + ME cells compared to sgME1 + EV cells (p<0.0001). Mean +/- SD is shown. (N) Aspartate M+1 isotopomer labeling from (L) was normalized to pyruvate M+1 labeling as a surrogate for pyruvate carboxylation activity following 24 hr of 1-13C-pyruvate tracing. Pyruvate carboxylation activity is significantly increased in AL1376 sgControl + ME1 cells compared to sgControl + EV cells (p<0.0001) and AL1376 sgME1 + ME1 cells compared to sgME1 + EV cells (p<0.0001). Mean +/- SD is shown.
Figure 7—figure supplement 2
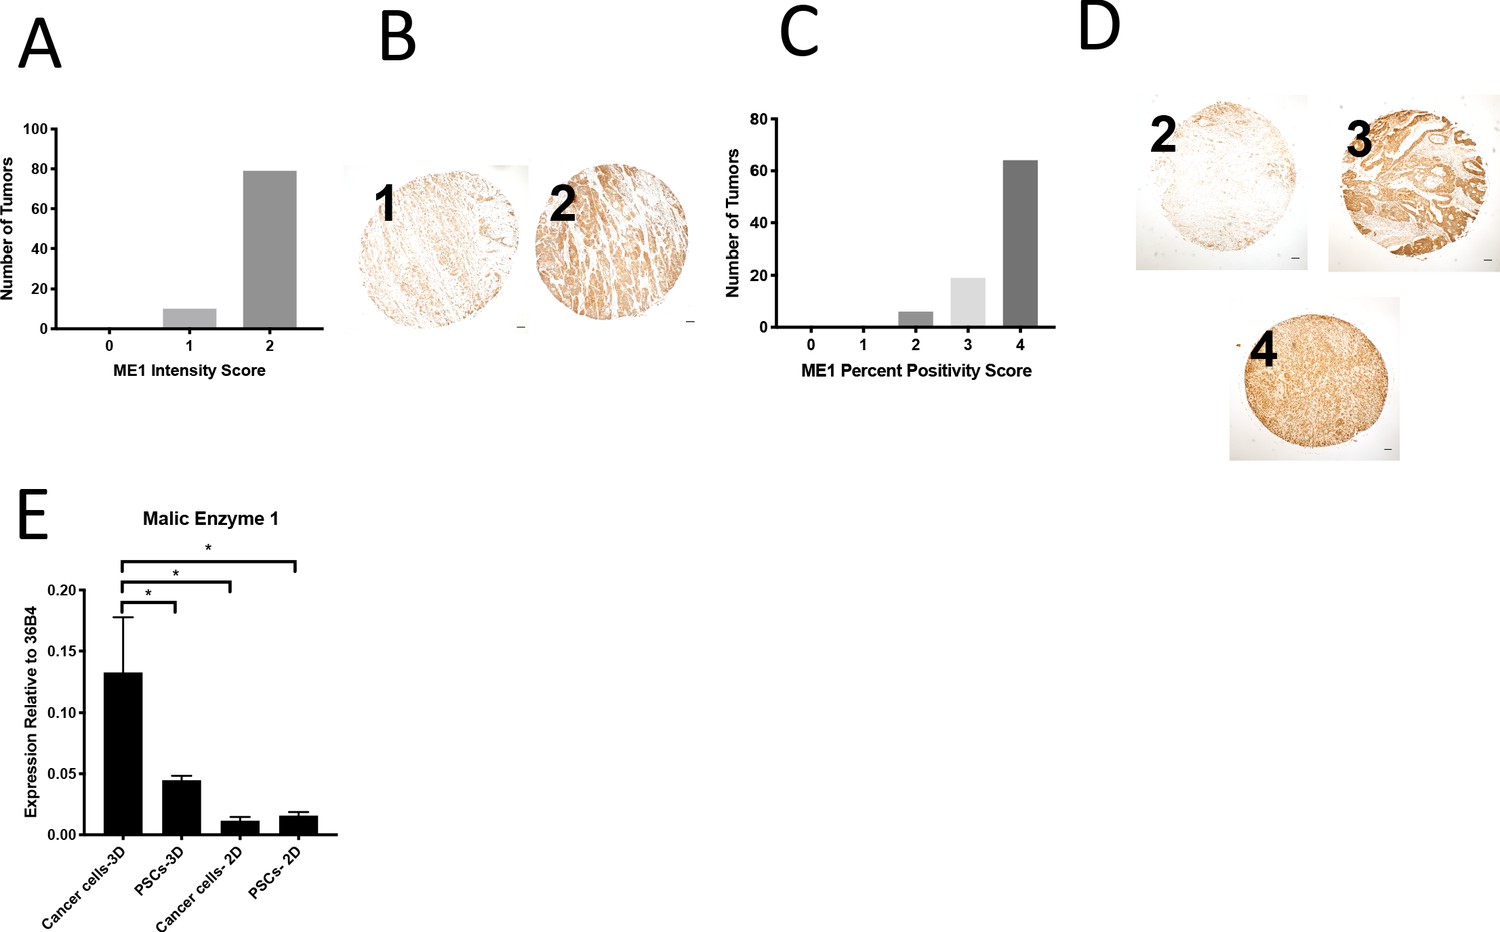
Expression of ME1 in a human PDAC tissue microarray and in murine organoids and stroma.
(A) Distribution of ME1 staining intensity scores from a tissue microarray containing sections from 100 human pancreatic tumors. (B) Representative TMA cores containing human pancreatic tumors showing ME1 staining intensity scored as 0, 1, or 2. Scale bars represent 100 μm. (C) Distribution of the scores for percentage of cells in each sample of a tissue microarray containing sections from 90 human pancreatic tumors that were positive for ME1 staining. (D) Representative TMA cores containing human pancreatic tumors showing percentage of cells in each sample that were positive for ME1 staining, scored as 0–4. Scale bars represent 100 μm. (E) Expression of ME1 was measured by qPCR in PDAC or PSC cell lines or from cells sorted from organoid-PSC co-cultures. The difference between cancer cells in 3D compared to PSCs in 3D (p=0.0285), cancer cells in 2D (p=0.0098), or PSCs in 2D (p=0.0111) is significant based on unpaired, two-tailed student’s t-tests. Mean +/- SD is shown. 36B4 was used as a housekeeping gene control.
Tables
Key resources table
| Reagent type (species) or resource | Designation | Source or reference | Identifiers | Additional information |
|---|---|---|---|---|
| Strain, strain background (Mus musculus) | C57Bl6/J | Jax | Cat# JAX:000664, RRID:IMSR_JAX:000664 | Used for cell line transplantation |
| Genetic Reagent (M. musculus) | LSL-KrasG12D/+ Trp53flox/flox Pdx-1-Cre LSL-tdTomato; KP-/-CT | Bardeesy et al., 2006 PMID:16585505 | Mice from a mixed 129/Sv and C57Bl6/J genetic background as well as pure C57Bl6/J mice were used. Both sexes of mice were included in experiments. | |
| Genetic Reagent (M. musculus) | LSL-KrasG12D/+ Trp53R172H/+ Pdx-1-Cre LSL-tdTomato; KPCT | Hingorani et al., 2005 PMID:15894267 | Mice from a mixed 129/Sv and C57Bl6/J genetic background as well as pure C57Bl6/J mice were used. Both sexes of mice were included in experiments. | |
| Genetic Reagent (M. musculus) | β-actin-GFP | Jax | Cat# JAX:006567, RRID:IMSR_JAX:006567 | PSCs were isolated from β-actin-GFP mice in a C57Bl6/J background. |
| Cell line (M. musculus) | PSC | Danai et al., 2018 PMID:29925948 | Isolated from β-actin-GFP mice in a C57Bl6/J background (Jax 006567). PSCs were immortalized with TERT and SV40 largeT after several passages. | |
| Cell line (M. musculus) | AL1376 | Sullivan et al., 2018 PMID:29941931 | Isolated from KP-/-CT mouse PDAC tumor in a C57Bl6/J background. | |
| Cell line (M. musculus) | Organoid | This paper | Isolated from KP-/-CT mouse PDAC tumor in a C57Bl6/J background | |
| Biological sample (Homo sapiens) | Human pancreatic cancer tissue microarray | Biomax | PA961e | |
| Antibody | α-SMA (mouse monoclonal) | Sigma | Cat# F3777, RRID:AB_476977 | IF (1:500) |
| Antibody | CK19 (Rabbit monoclonal) | Abcam | Cat# ab133496, RRID:AB_ 11155282 | IF (1:100) |
| Antibody | tdTomato (Rabbit polyclonal) | Rockland | Cat# 600-401-379, RRID:AB_2209751 | IF (1:500) |
| Antibody | Pyruvate Carboxylase (Rabbit polyclonal) | Santa Cruz | Cat# sc-67021, RRID:AB_2283532 | IHC (1:50) |
| Antibody | Pyruvate Carboxylase (Mouse monoclonal) | Santa Cruz | Cat# sc-271493, RRID:AB_10649369 | WB (1:100) |
| Antibody | Malic Enzyme 1 (Rabbit polyclonal) | Proteintech | Cat# 16619-1-AP, RRID:AB_2143821 | IHC (1:200) WB (1:250) |
| Antibody | β-actin (Rabbit monoclonal) | Cell Signaling Technologies | Cat# 8457, RRID:AB_10950489 | WB (1:10,000) |
| Antibody | CD16/CD32 (Rat monoclonal) | Thermo Fisher | Cat# 14-0161-82, RRID:AB_467133 | FACS (10uL) |
| Antibody | CD45-APC-Cy7 (Rat monoclonal) | BD | Cat# 557659, RRID:AB_396774 | FACS (1:100) |
| Antibody | Puromycin (Mouse monoclonal) | Sigma | MABE343 | WB (1:25,000) |
| Antibody | Vinculin (Mouse monoclonal) | Abcam | Cat# ab18058, RRID:AB_444215 | WB (1:1000) |
| Commercial Assay or Kit | Protein A Antibody Purification Kit | Sigma | PURE1A | |
| Commercial Assay or Kit | RNAqueous-Micro Total RNA Isolation Kit | Life Technologies | AM1931 | |
| Commercial Assay or Kit | iScript cDNA Synthesis Kit | Bio-Rad Laboratories | 1708890 | |
| Commercial Assay or Kit | Pierce BCA Protein Assay Kit | Pierce | 23225 | |
| Commercial Assay or Kit | Amaxa Basic Nucleofector Kit for Primary Mammalian Epithelial Cells | Amaxa | VPI-1005 | |
| Recombinant DNA Reagent | pUSPmNG (plasmid) | Li et al., 2019 PMID:31694929 | U6 sgRNA PGK with mNeonGreen to express sgRNAs for PC and ME1 double knockout cell lines | |
| Recombinant DNA Reagent | LentiCRISPRv2 (plasmid) | Sanjana et al., 2014 PMID:25075903 | Lentiviral construct to create PC and ME1 knockout cells | |
| Recombinant DNA Reagent | Modified LentiCRISPRv2 (plasmid) | Horlbeck et al., 2016 PMID:27661255 | Modified dCas9-KRAB fusion protein to create PC and ME1 knockdown cells | |
| Recombinant DNA Reagent | pLV-Hygro-EFS (plasmid) | Vectorbuilder | Custom lentiviral construct for re-expressing PC or ME1 cDNA under a CMV promoter | |
| Peptide, recombinant protein | EGF | Thermo Fisher | PMG8041 | |
| Peptide, recombinant protein | FGF | Peprotech | 100-26 | |
| Peptide, recombinant protein | Gastrin I | TOCRIS | 3006 | |
| Peptide, recombinant protein | Noggin | Peprotech | 250-38 | |
| Chemical compound, drug | Collagenase I | Worthington Biochemical | LS004194 | |
| Chemical compound, drug | Collagenase XI | Sigma | C9407 | |
| Chemical compound, drug | Collagenase P | Sigma | 11213865001 | |
| Chemical compound, drug | Dispase II | Roche | 04942078001 | |
| Chemical compound, drug | TrypLE Express | Thermo Fisher | 12605-010 | |
| Chemical compound, drug | DNAse I Type II | Sigma | D4527 | |
| Chemical compound, drug | DNAse I Type IV | Sigma | D5025 | |
| Chemical compound, drug | GlutaMAX | Thermo Fisher | 35050 | |
| Chemical compound, drug | HEPES | Thermo Fisher | 15630 | |
| Chemical compound, drug | TGF-b inhibitor A-83-01 | TOCRIS | 2939 | |
| Chemical compound, drug | Rho Kinase Inhibitor Y-27632 | Sigma | Y0503 | |
| Chemical compound, drug | N-Acetylcysteine (NAC) | Sigma | A9165 | |
| Chemical compound, drug | Nicotinamide | Sigma | N0636 | |
| Chemical compound, drug | B-27 supplement | Thermo Fisher | 17504 | |
| Chemical compound, drug | Methoxamine (MOX) reagent | ThermoFisher | TS-45950 | |
| Chemical compound, drug | N–methyl–N–(tert–butyldimethylsilyl)trifluoroacetamide + 1% tert–Butyldimethylchlorosilane | Sigma | 375934 | |
| Chemical compound, drug | Pyridine | Sigma | 270407 | |
| Chemical compound, drug | Nycodenz | VWR | 100356-726 | |
| Chemical compound, drug | Sulforhodamine B | Sigma | 230162 | |
| Chemical compound, drug | SYBR Green Master Mix | Sigma | L6544 | |
| Software, algorithm | Prism | GraphPad | Statistical analysis and graphing | |
| Software, algorithm | FlowJo | BD | Flow cytometry data analysis | |
| Other | SYTOX Red Dead Cell Stain | Life Technologies | S34859 | FACS (1:1000) |
| Other | Advanced DMEM/F12 | Thermo Fisher | 12634 | |
| Other | DMEM without pyruvate | Corning | 10-017-CV | |
| Other | GBSS | Sigma | G9779 | |
| Other | Growth factor reduced (GFR) matrigel | Corning | 356231 | |
| Other | Plastic coverslips | Thermo | 174985 | |
| Other | Flow cytometry staining buffer | Thermo Fisher | 00-4222-57 |
Additional files
-
Supplementary file 1
qPCR primer sequences.
Sequences of primers used for qPCR reactions.
- https://cdn.elifesciences.org/articles/56782/elife-56782-supp1-v2.xlsx
-
Transparent reporting form
- https://cdn.elifesciences.org/articles/56782/elife-56782-transrepform-v2.pdf
Download links
A two-part list of links to download the article, or parts of the article, in various formats.
Downloads (link to download the article as PDF)
Open citations (links to open the citations from this article in various online reference manager services)
Cite this article (links to download the citations from this article in formats compatible with various reference manager tools)
Dissecting cell-type-specific metabolism in pancreatic ductal adenocarcinoma
eLife 9:e56782.
https://doi.org/10.7554/eLife.56782


