Formicine ants swallow their highly acidic poison for gut microbial selection and control
- Animal Ecology I, Bayreuth Center for Ecology and Environmental Research (BayCEER), University of Bayreuth, Universitätsstraße, Germany
- Microbiology, Biocenter, University of Würzburg, Am Hubland, Germany
Figures
Figure 1 with 3 supplements
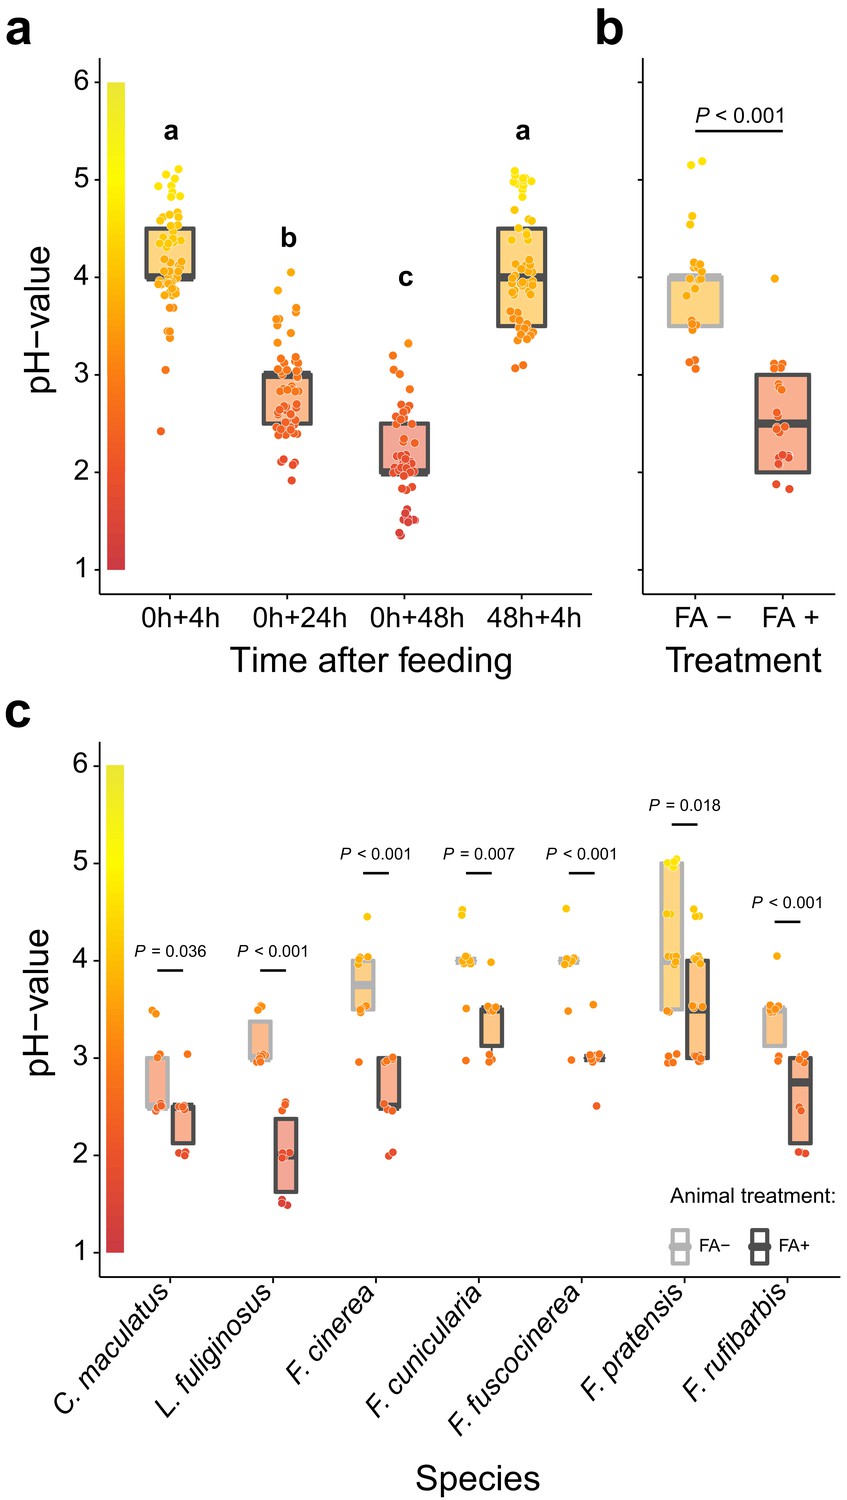
Acidification of formicine ant crop lumens through swallowing of acidic poison gland secretions.
(a) The pH of crop lumens at 4 hr, 24 hr, and 48 hr after feeding C. floridanus ants 10% honey water (pH = 5) at 0 hr and at 4 hr after re-feeding ants at 48 hr (LMM, LR-test, χ2 = 315.18, df = 3, p<0.001, same letters indicate p=0.317 and different letters indicate p<0.001 in Westfall corrected post hoc comparisons). (b) The pH of crop lumens in C. floridanus ants that were either prevented to ingest the formic acid containing poison gland secretion (FA-) or not (FA+) for 24 hr after feeding (LMM, LR-test, χ2 = 44.68, df = 1, p<0.001). (c) The pH-value of crop lumens 24 hr after feeding in seven formicine ant species that were either prevented to ingest the formic acid containing poison gland secretion (FA-) or not (FA+). Wilcoxon rank-sum tests (two-sided). Lines and shaded boxes show the median and interquartile range; points show all data. Colors in shaded rectangles near the y-axis represent universal indicator pH colors. Color filling of shaded boxes correspond to the median pH color of x-axis groups and color filling of points correspond to universal indicator pH colors. The border of shaded boxes represents animal treatment (light gray: prevention of poison ingestion, FA-; dark gray: poison ingestion not prevented, FA+).
-
Figure 1—source data 1
Source data for panel a, on pH of crop lumens at 4 hr, 24 hr, and 48 hr after feeding C. floridanus ants 10% honey water at 0 hr and at 4 hr after re-feeding ants at 48 hr.
- https://cdn.elifesciences.org/articles/60287/elife-60287-fig1-data1-v1.txt.zip
-
Figure 1—source data 2
Source data for panel b, on pH of crop lumens in C. floridanus ants that were either prevented to ingest formic acid containing poison gland secretions (FA-) or not (FA+) for 24 hr after feeding.
- https://cdn.elifesciences.org/articles/60287/elife-60287-fig1-data2-v1.txt.zip
-
Figure 1—source data 3
Source data for panel c, on pH of crop lumens 24 hr after feeding in seven formicine ant species that were either prevented to ingest formic acid containing poison gland secretions (FA-) or not (FA+).
- https://cdn.elifesciences.org/articles/60287/elife-60287-fig1-data3-v1.txt.zip
Figure 1—figure supplement 1
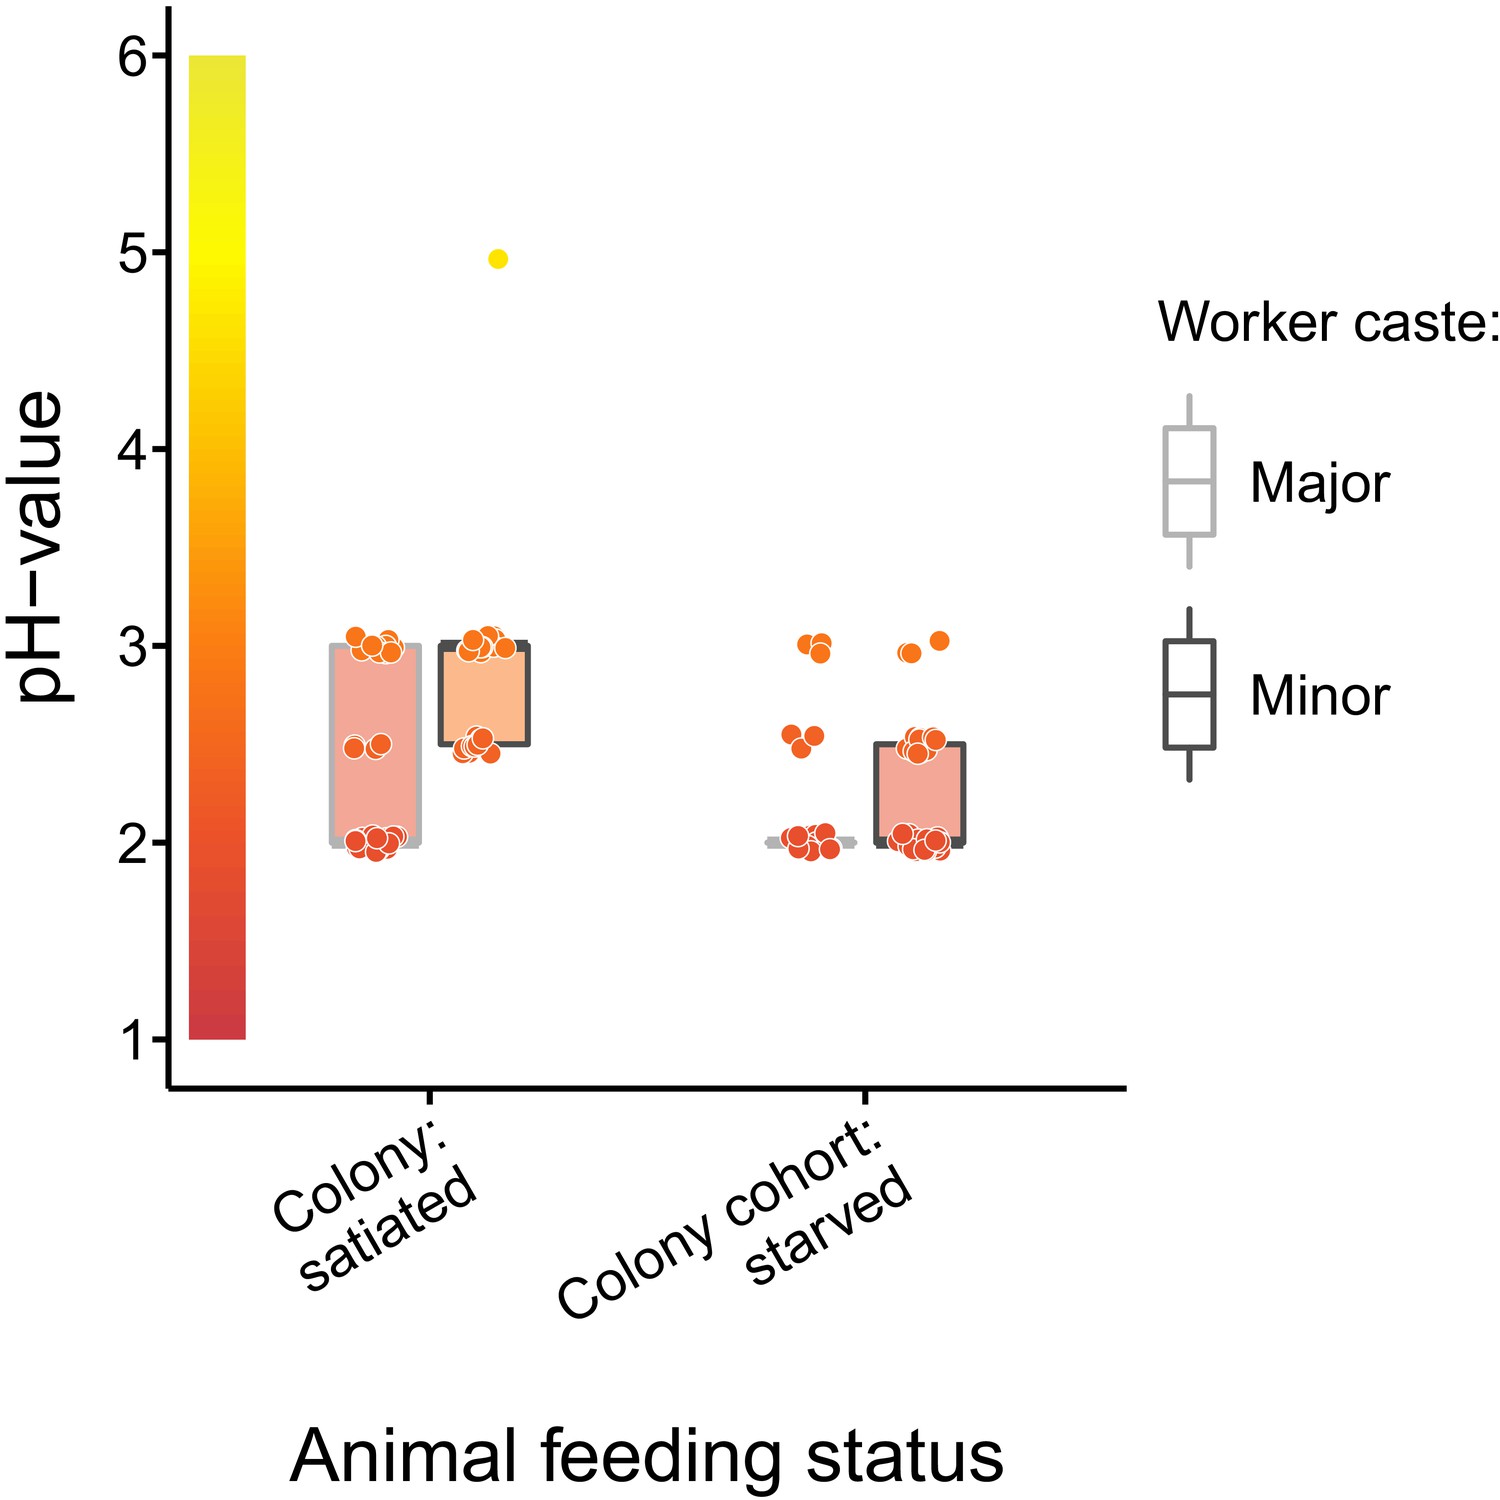
Baseline acidity of C. floridanus crop lumens under satiated and starved conditions.
pH of crop lumens in C. floridanus workers (light gray: major workers, dark gray: minor workers) that were either taken directly out of a satiated colony or that were kept in cohorts of ~100 individuals under satiated conditions for 3 d and then starved for 24 hr before measuring the pH. Lines and shaded boxes show the median and interquartile range; points show all data. Colors in shaded rectangles near the y-axis represent universal indicator pH colors. Color filling of shaded boxes correspond to the median pH color of x-axis groups and color filling of points correspond to universal indicator pH colors. Border of shaded boxes represents animal caste (light gray: major workers; dark gray: minor workers).
-
Figure 1—figure supplement 1—source data 1
Source Data on the baseline acidity of C. floridanus (major and minor worker caste) under satiated and starved conditions.
- https://cdn.elifesciences.org/articles/60287/elife-60287-fig1-figsupp1-data1-v1.txt.zip
Figure 1—figure supplement 2
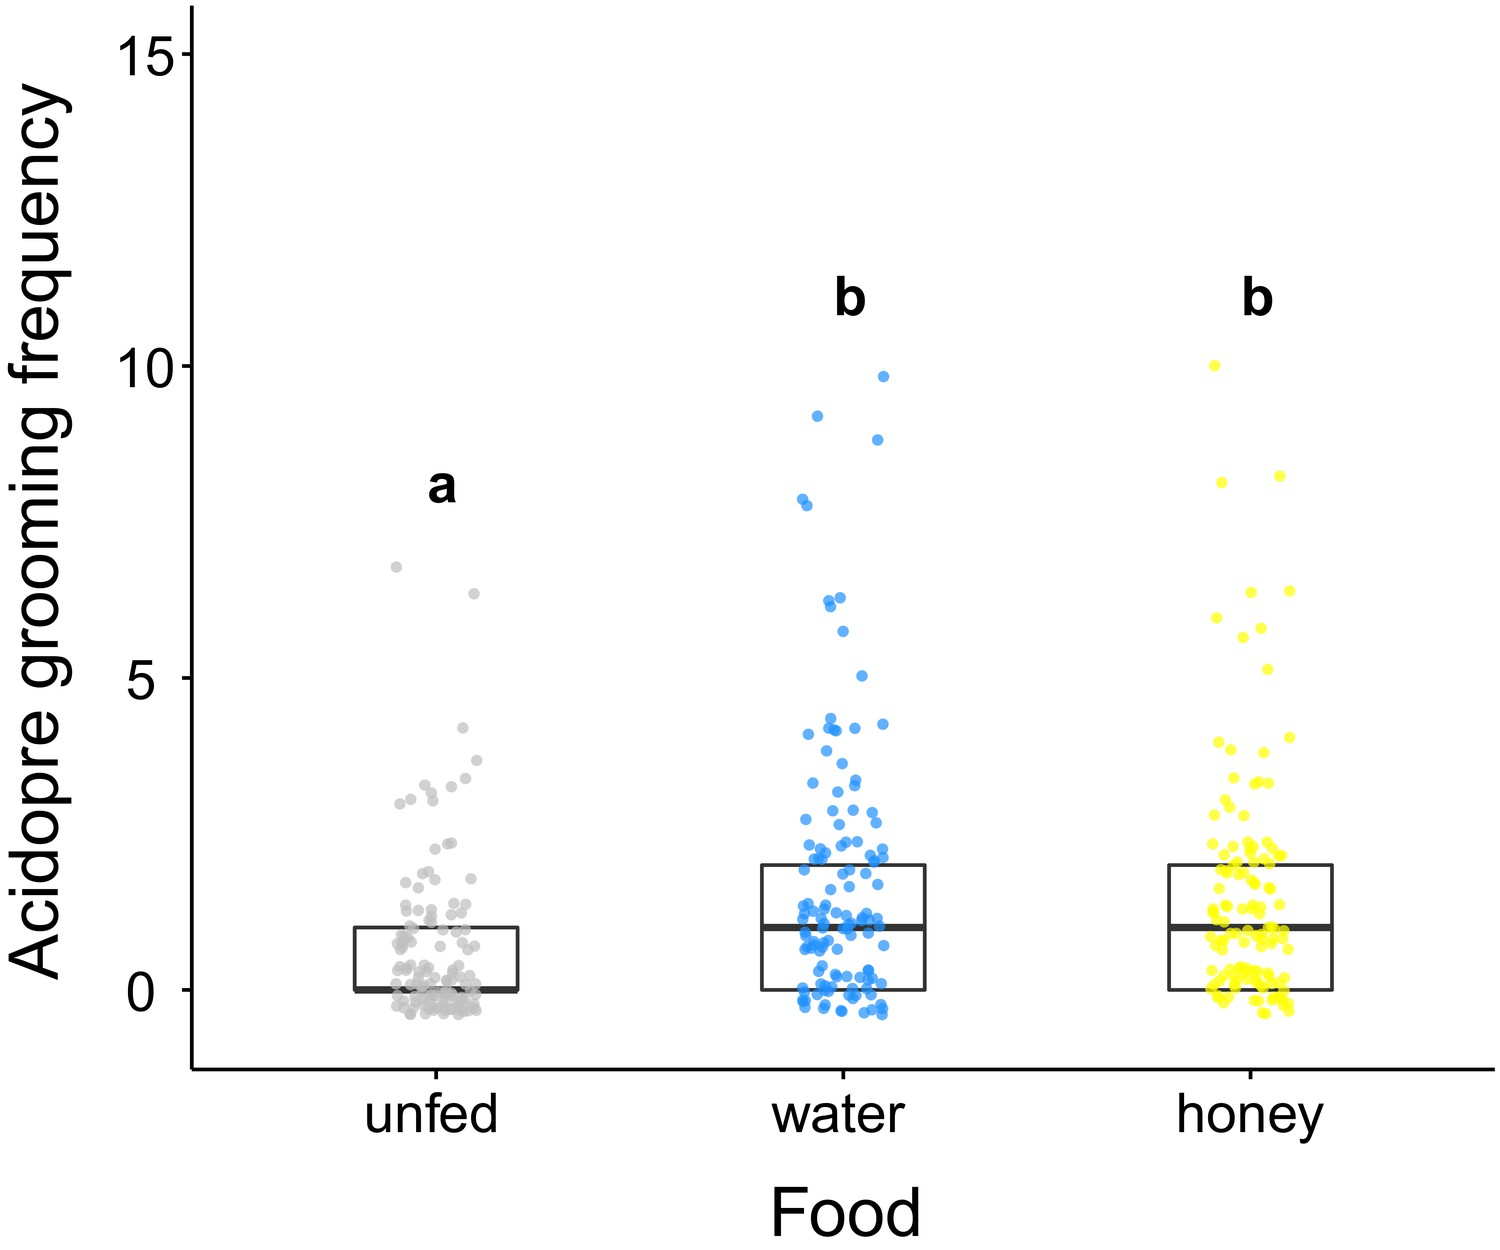
Acidopore grooming frequency of C. floridanus after ingestion of different food types.
Frequency of acidopore grooming within 30 min. after fluid ingestion (water or 10% honey water) compared to ants that did not receive any fluid (unfed) (GLMM, LR-test, χ2 = 33.526, df = 2, p<0.001, same letters indicate p=0.634 and different letters indicate p<0.001 in Westfall corrected post hoc comparisons).
-
Figure 1—figure supplement 2—source data 1
Source data on the frequency of acidopore grooming in C. floridanus ants within 30 min.
after fluid ingestion (water or 10% honey water) compared to ants that did not receive any fluid (unfed).
- https://cdn.elifesciences.org/articles/60287/elife-60287-fig1-figsupp2-data1-v1.txt.zip
Figure 1—figure supplement 3

Acidity along the gastrointestinal tract of C. floridanus.
pH-measurements 24 hr after access to 10% honey-water in the crop (N = 2) and directly after the proventriculus at four points along the midgut (N = 10 except position four with N = 9) (LMM, LR-test, χ2 = 22.152, df = 4, p<0.001, same letters indicate p≥0.443 and different letters indicate p<0.001 in Westfall corrected post hoc comparisons). Lines and shaded boxes show the median and interquartile range; points show all data. Colors in shaded rectangles near the y-axis represent universal indicator pH colors. Color filling of shaded boxes correspond to the median pH color of x-axis groups and color filling of points correspond to universal indicator pH colors.
-
Figure 1—figure supplement 3—source data 1
Source data on pH-measurements 24 hr after access to 10% honey-water in the crop and directly after the proventriculus at four points along the midgut of C. floridanus ants.
- https://cdn.elifesciences.org/articles/60287/elife-60287-fig1-figsupp3-data1-v1.txt.zip
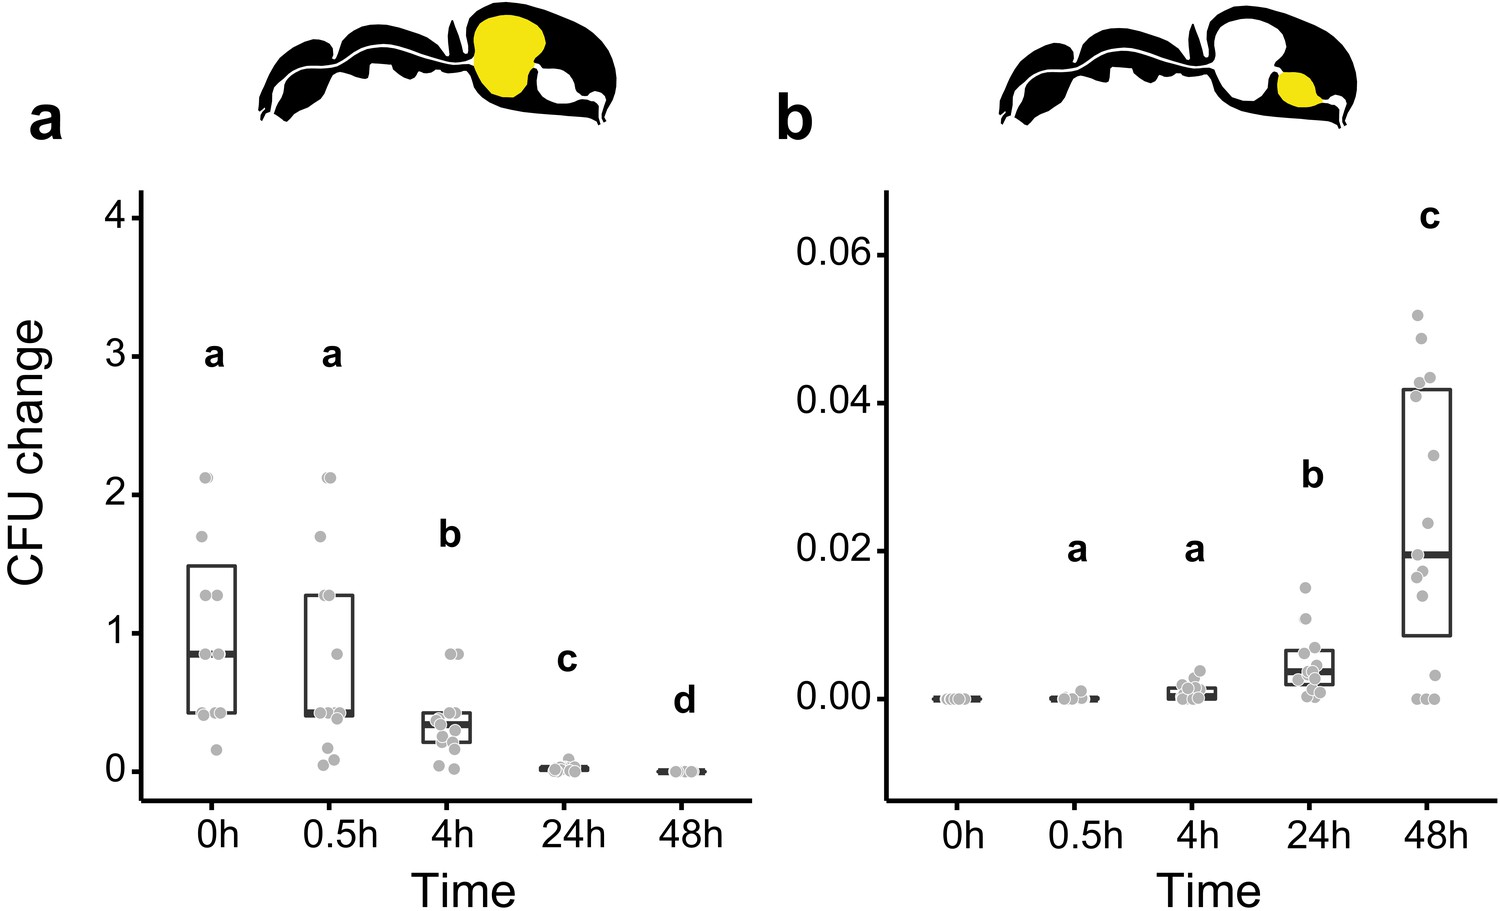
Figure 2 with 3 supplements
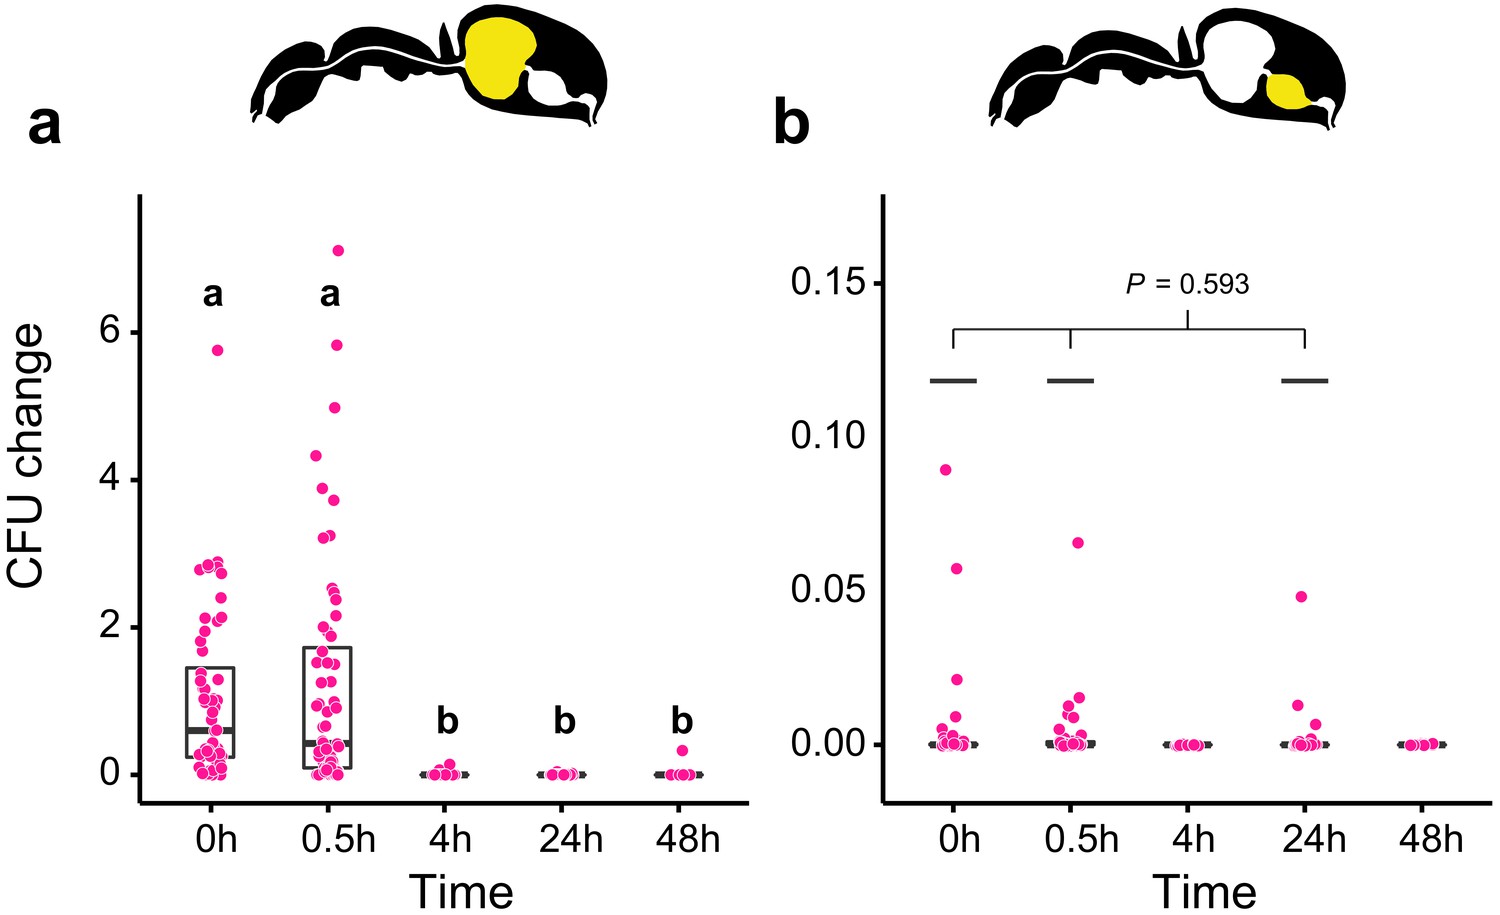
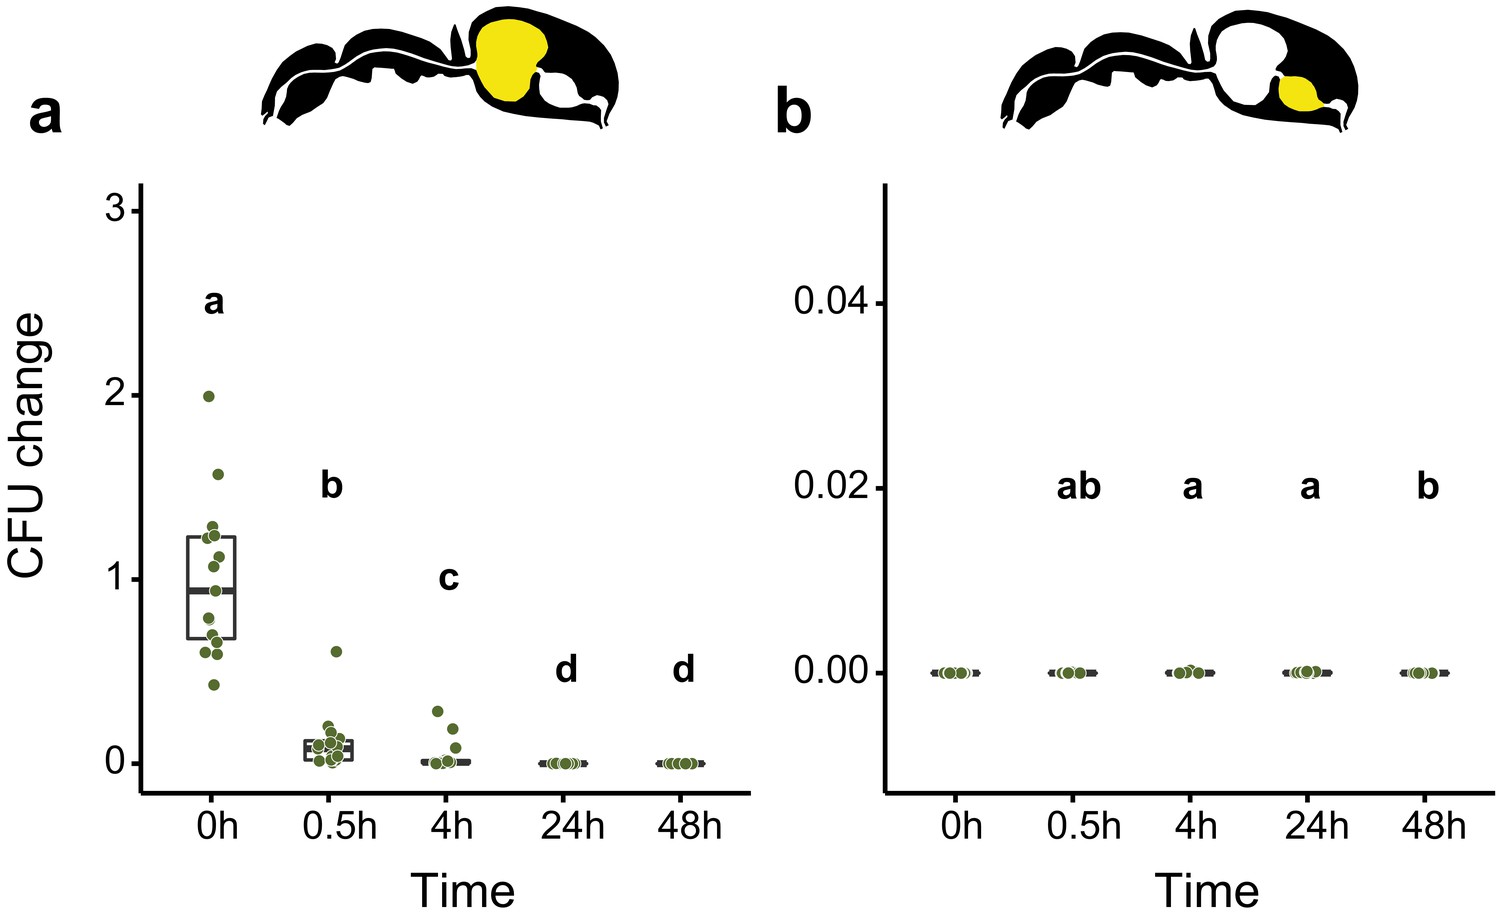
Viability of S. marcescens over time in the digestive tract of C. floridanus.
Change in the number of colony forming units (CFUs) in the crop (a) and midgut (b) part of the digestive tract (yellow color in insert) relative to the mean CFU-number at 0 hr in the crop (CFU change corresponds to single data CFU-value divided by mean CFU-value at 0 hr in the crop), 0 hr, 0.5 hr, 4 hr, 24 hr, and 48 hr after feeding Camponotus floridanus ants 10% honey water contaminated with Serratia marcescens. (a), Change of S. marcescens in the crop (GLMM, LR-test, χ2 = 220.78, df = 4, p<0.001, same letters indicate p≥0.623 and different letters indicate p<0.001 in Westfall corrected post hoc comparisons). (b), Change of S. marcescens in the midgut (GLMM, LR-test, χ2 = 1.044, df = 2, p=0.593). Note that timepoints with zero bacterial growth in the midgut (4 hr and 48 hr) were excluded from the statistical model.
-
Figure 2—source data 1
Source data for panels a and b, on the number and the change in the number of colony forming units (CFUs) relative to 0 hr in the crop in the crop.
(a) And midgut (b) Part of the digestive tract of C. floridanus ants at 0 hr, 0.5 hr, 4 hr, 24 hr, and 48 hr after feeding ants 10% honey water contaminated with Serratia marcescens.
- https://cdn.elifesciences.org/articles/60287/elife-60287-fig2-data1-v1.txt.zip
Figure 2—figure supplement 1
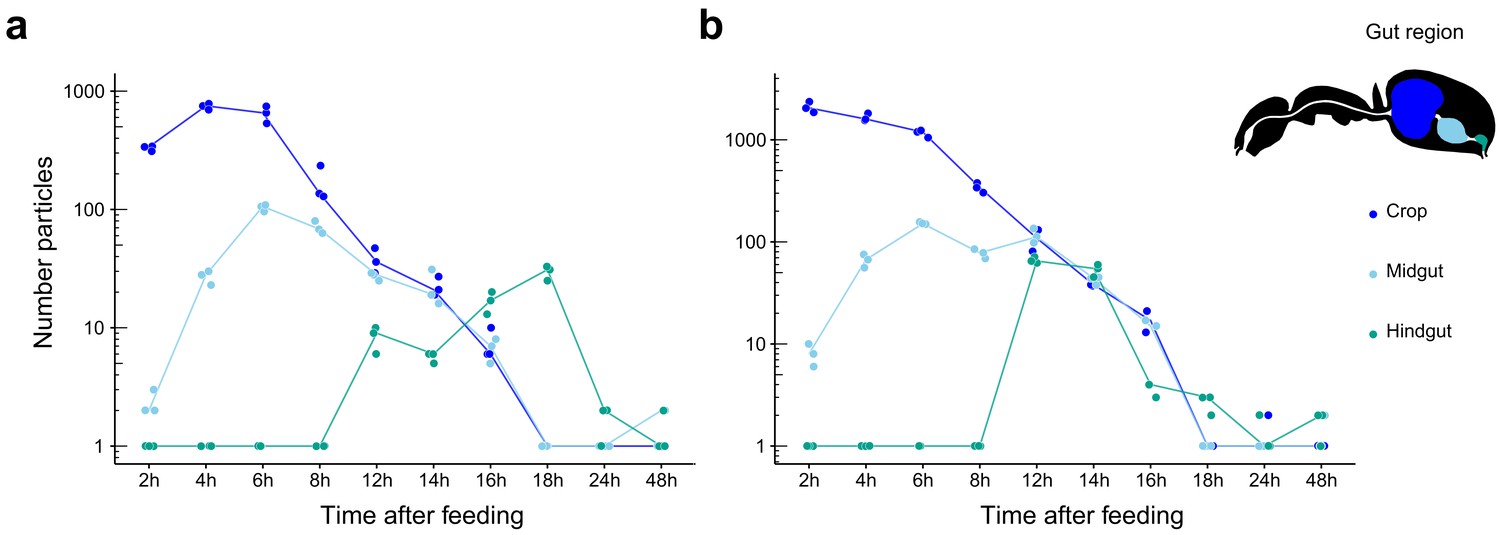
Food passage of fluorescent particles through the digestive tract of C. floridanus.
Number of fluorescent particles on a logarithmic scale in the crop (dark blue), midgut (light blue), and hindgut (turquoise) part of the digestive tract of minor (a) and major (b) ants 2 hr, 4 hr, 6 hr, 8 hr, 12 hr, 14 hr, 16 hr, 18 hr, 24 hr, and 48 hr after feeding them a 1:1 honey-water mix with polymethylmethacrylate (PMM) particles (size ≤40 µm). Note that for displaying purposes and better visibility of zero values a value of one has been added to all datapoints. Points represent the number of counted particles per individual ant and lines connect the median value of particles at the different time points after feeding.
-
Figure 2—figure supplement 1—source data 1
Source data for panels a and b, on the food passage of florescent particles through the digestive tract (crop, midgut, hindgut) of C. floridanus minor (a) and major (b) worker ants.
- https://cdn.elifesciences.org/articles/60287/elife-60287-fig2-figsupp1-data1-v1.txt.zip
Figure 2—figure supplement 2
Viability of E. coli over time in the digestive tract of C. floridanus over time.
Change in the number of colony forming units (CFUs) in the crop (a) and midgut (b) part of the digestive tract (yellow color in insert) relative to mean CFU-number at 0 hr in the crop (CFU change corresponds to single data CFU-value divided by the mean CFU-value at 0 hr in the crop), 0 hr, 0.5 hr, 4 hr, 24 hr, and 48 hr after feeding ants 10% honey water contaminated with Escherichia coli. (a), Change of E. coli in the crop (GLMM, LR-test, χ2 = 156.74, df = 4, p<0.001, same letters indicate p=0.979 and different letters indicate p<0.025 in Westfall corrected post hoc comparisons). (b), Change of E. coli in the midgut (GLMM, LR-test, χ2 = 14.898, df = 3, p=0.002, same letters indicate p≥0.629 and different letters indicate p≤0.038 in Westfall corrected post hoc comparisons). Note that timepoints with zero bacterial growth in the midgut (0 hr) were excluded from the statistical model.
-
Figure 2—figure supplement 2—source data 1
Source data for panels a and b, on the number and the change in the number of colony forming units (CFUs) in the crop (a) and midgut (b) part of the digestive tract of C. floridanus ants relative to 0 hr in the crop at 0 hr, 0.5 hr, 4 hr, 24 hr, and 48 hr after feeding ants 10% honey water contaminated with Escherichia coli.
- https://cdn.elifesciences.org/articles/60287/elife-60287-fig2-figsupp2-data1-v1.txt.zip
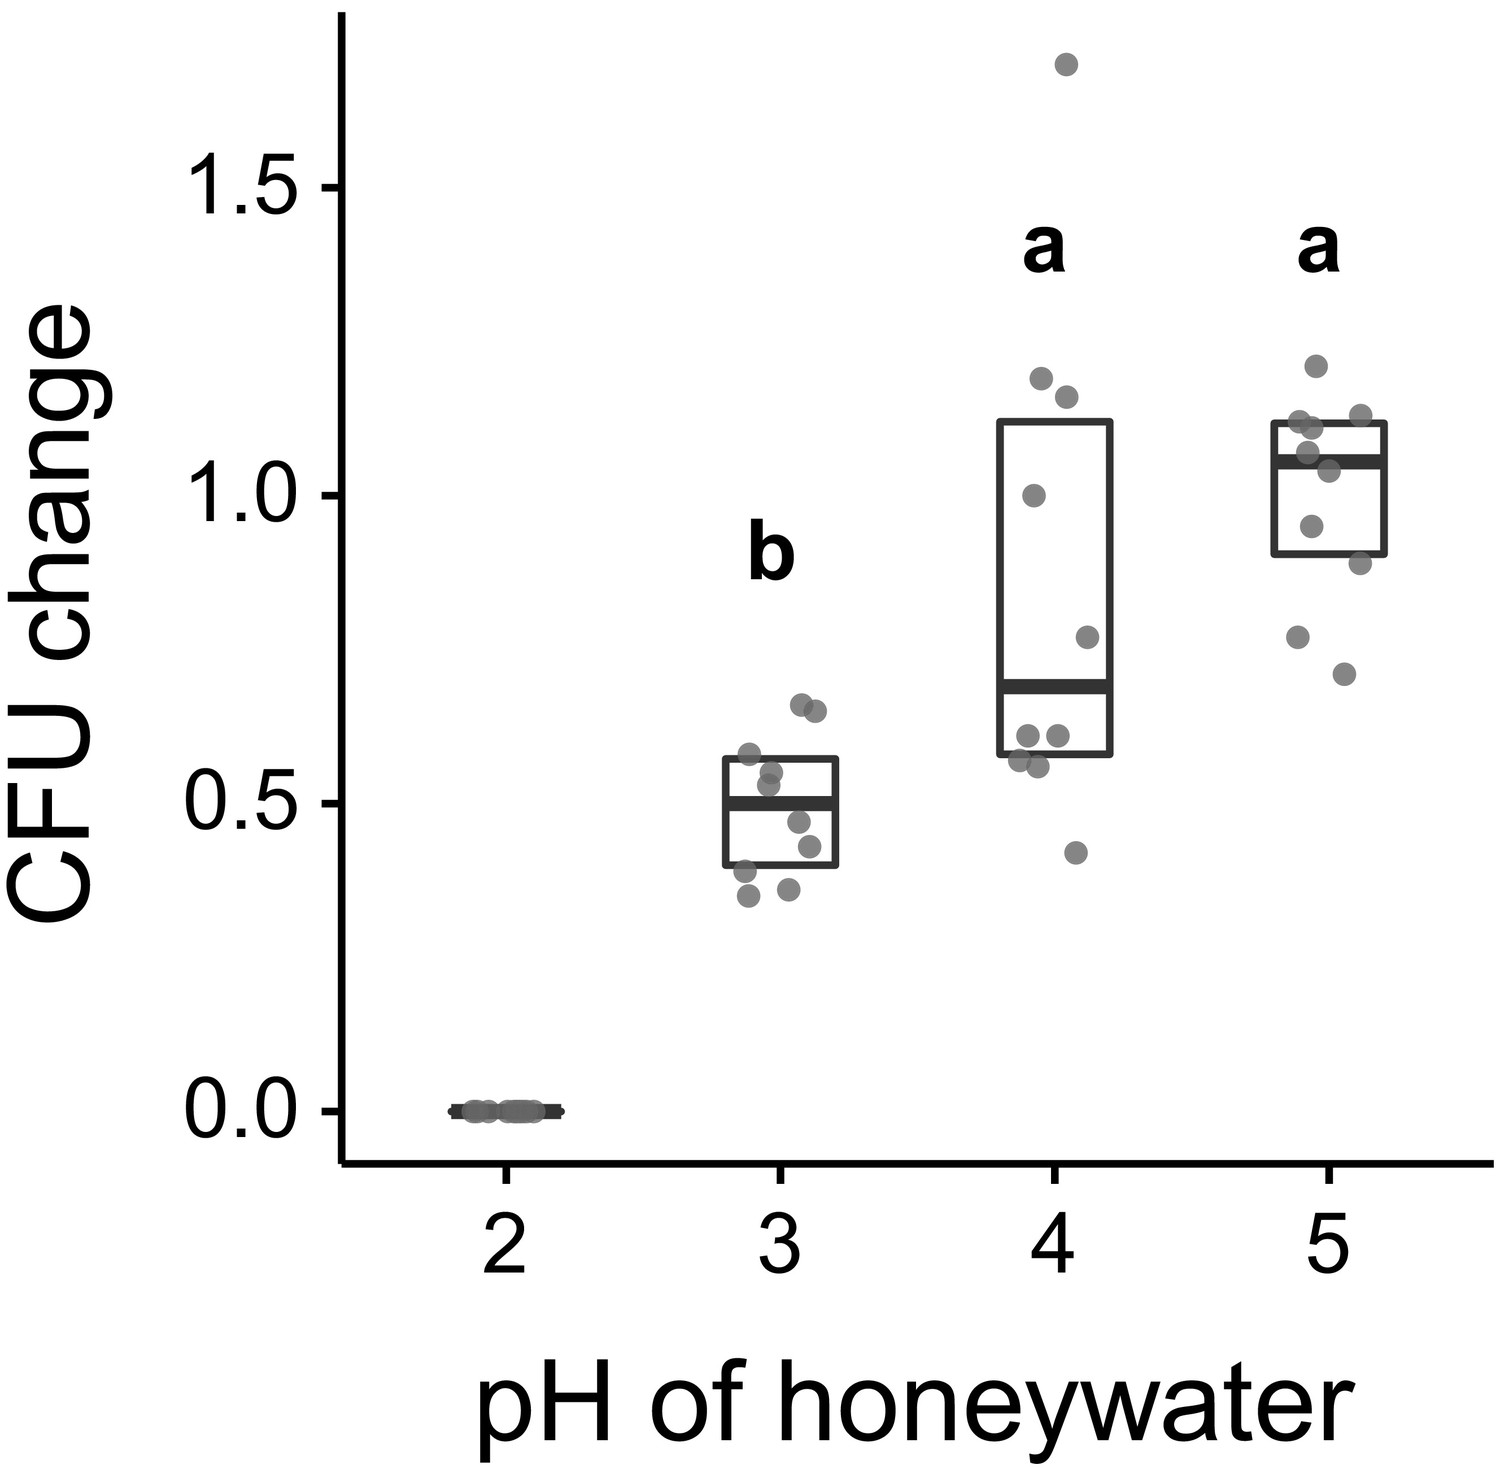
Figure 2—figure supplement 3
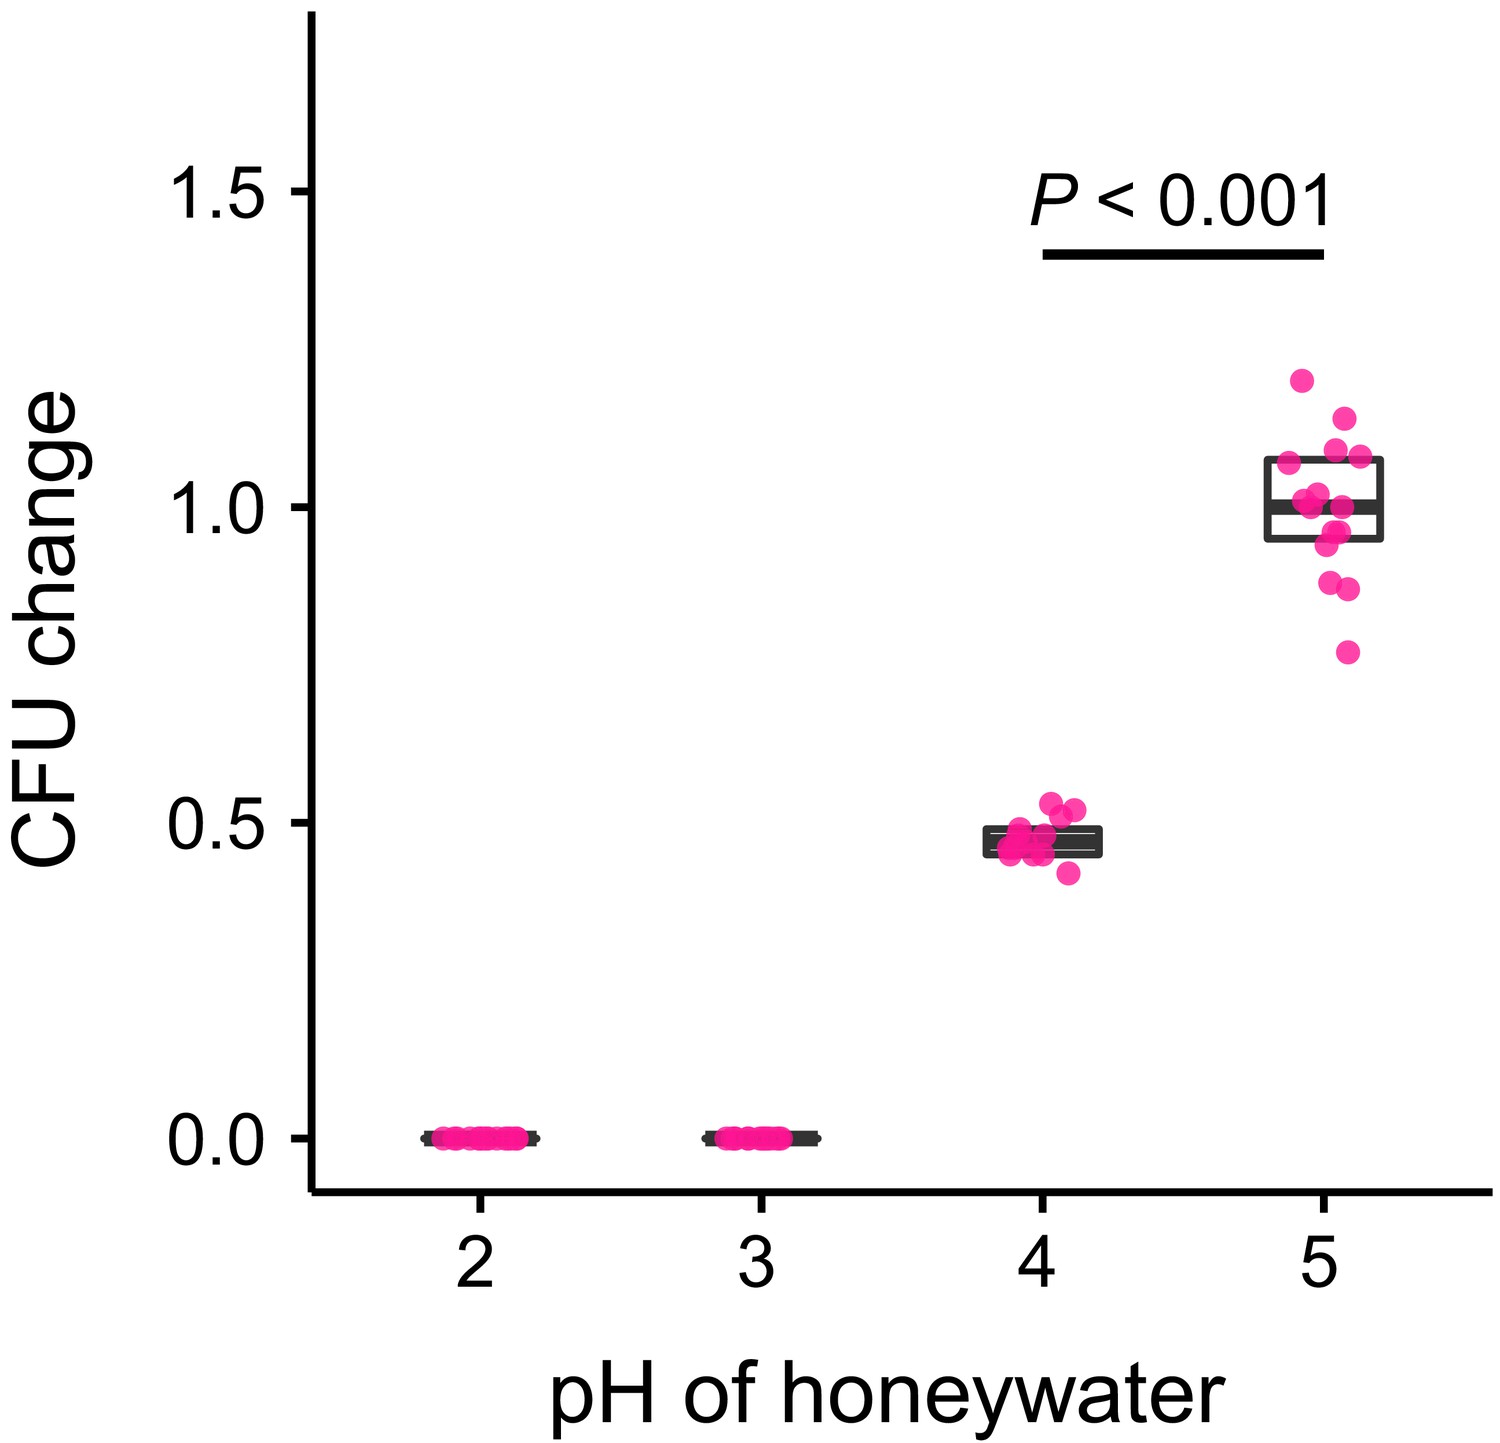
S. marcescens growth in vitro.
Change in the number of CFUs relative to the mean at pH 5 (CFU change corresponds to single data CFU-value divided by the mean CFU-value at pH 5) after incubation of Serratia marcescens in 10% honey water (pH = 5) or in 10% honey water acidified with commercial formic acid to a pH of 4, 3, or 2 for 2 hr (GLM, LR-test, χ2 = 79.442, df = 1, p<0.001). Note that pH-values with zero bacterial growth (pH 2 and 3) were excluded from the statistical model.
-
Figure 2—figure supplement 3—source data 1
Source data on the number and the change in the number of CFUs relative to pH 5 after incubation of Serratia marcescens in 10% honey water (pH = 5) or in 10% honey water acidified with commercial formic acid to a pH of 4, 3, or 2 for 2 hr.
- https://cdn.elifesciences.org/articles/60287/elife-60287-fig2-figsupp3-data1-v1.txt.zip
Figure 3
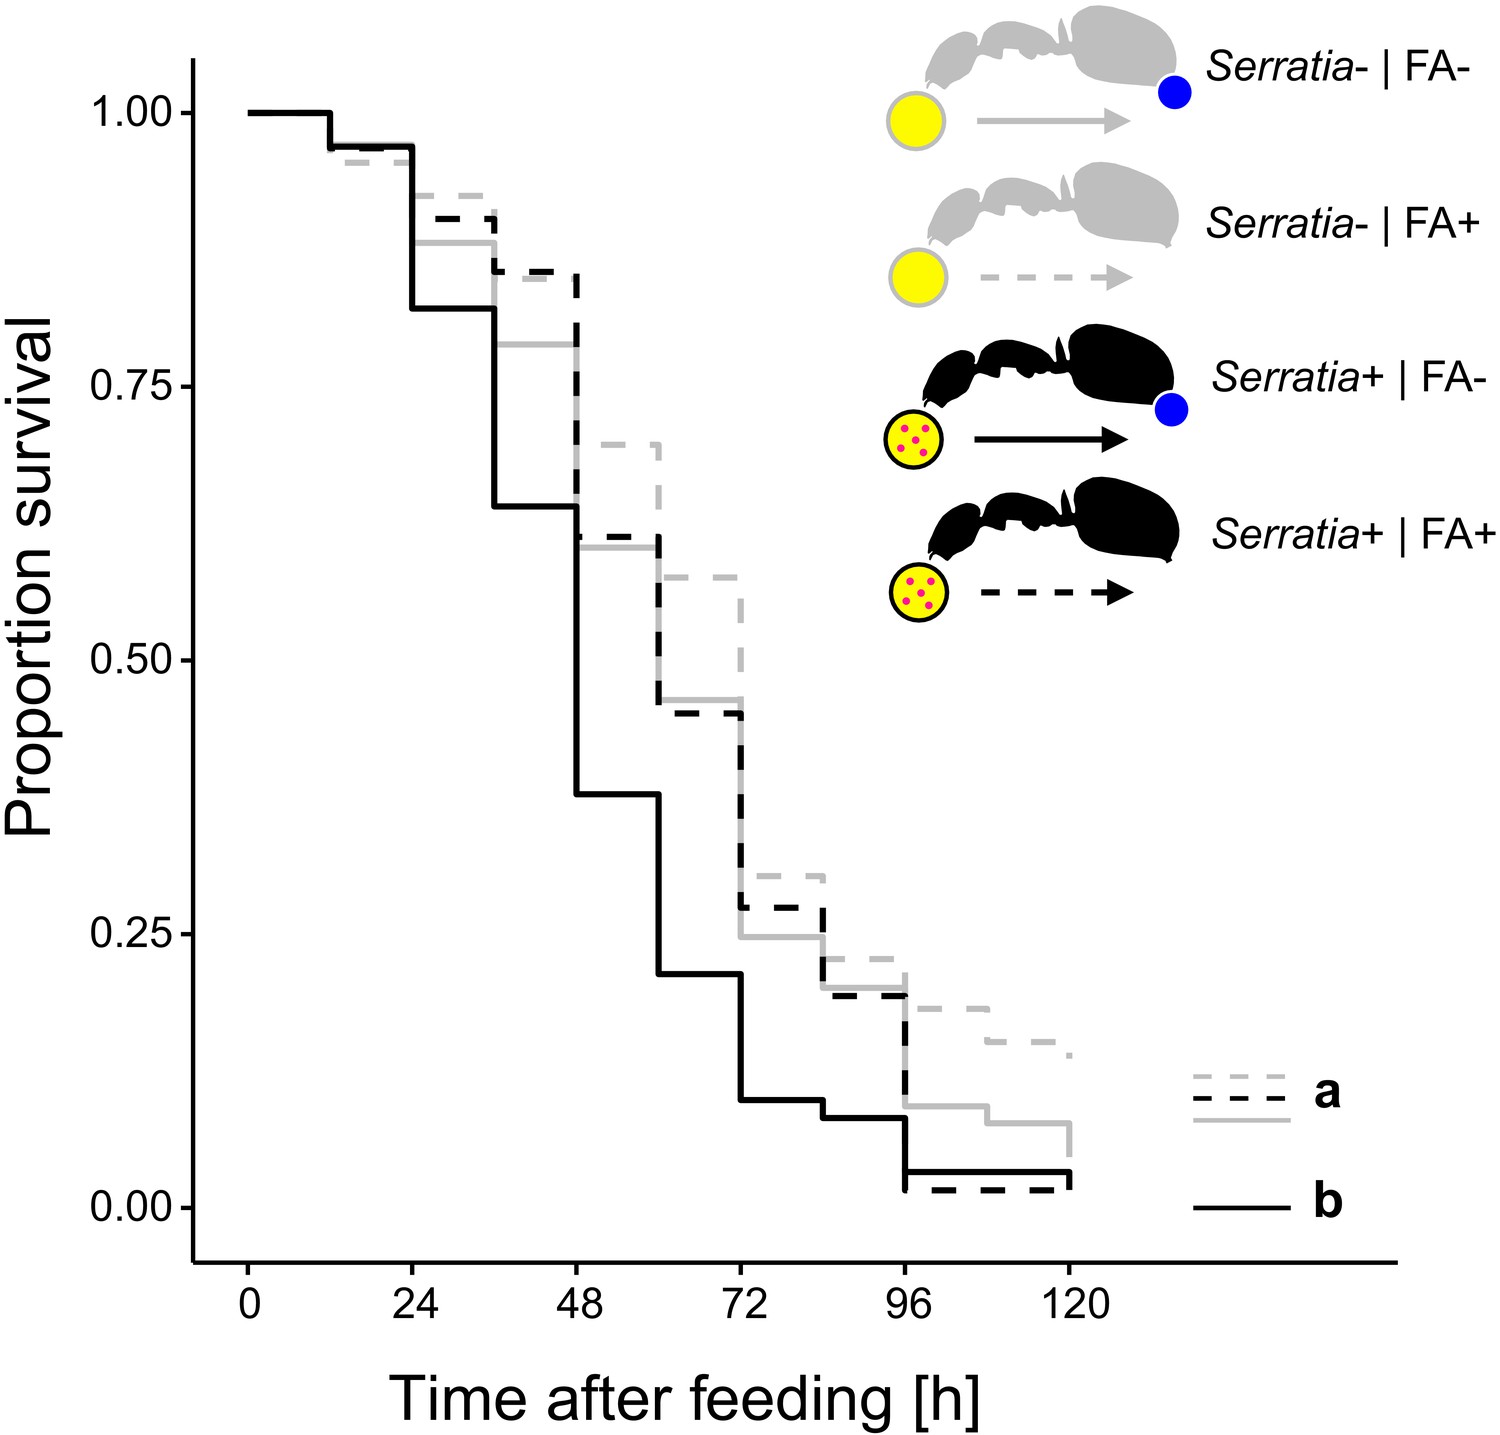
Survival after ingestion of pathogen contaminated food.
Survival of individual C. floridanus ants that were either prevented to ingest the formic acid containing poison gland secretion (FA-; ant outlines with blue dot) or not (FA+) after feeding them once either honey water contaminated with Serratia marcescens (Serratia+, yellow circle with pink dots and black ant outlines) or non-contaminated honey water (Serratia-) without providing food thereafter (COXME, LR-test, χ2 = 20.95, df = 3, p=0.0001, same letters indicate p≥0.061 and different letters indicate p≤0.027 in Westfall corrected post hoc comparisons).
-
Figure 3—source data 1
Source data on the survival of individual C. floridanus ants that were either prevented to ingest formic acid containing poison gland secretions (FA-) or not (FA+) after feeding on either honey water contaminated with Serratia marcescens (Serratia+) or non-contaminated honey water (Serratia-).
- https://cdn.elifesciences.org/articles/60287/elife-60287-fig3-data1-v1.txt.zip
Figure 4 with 1 supplement
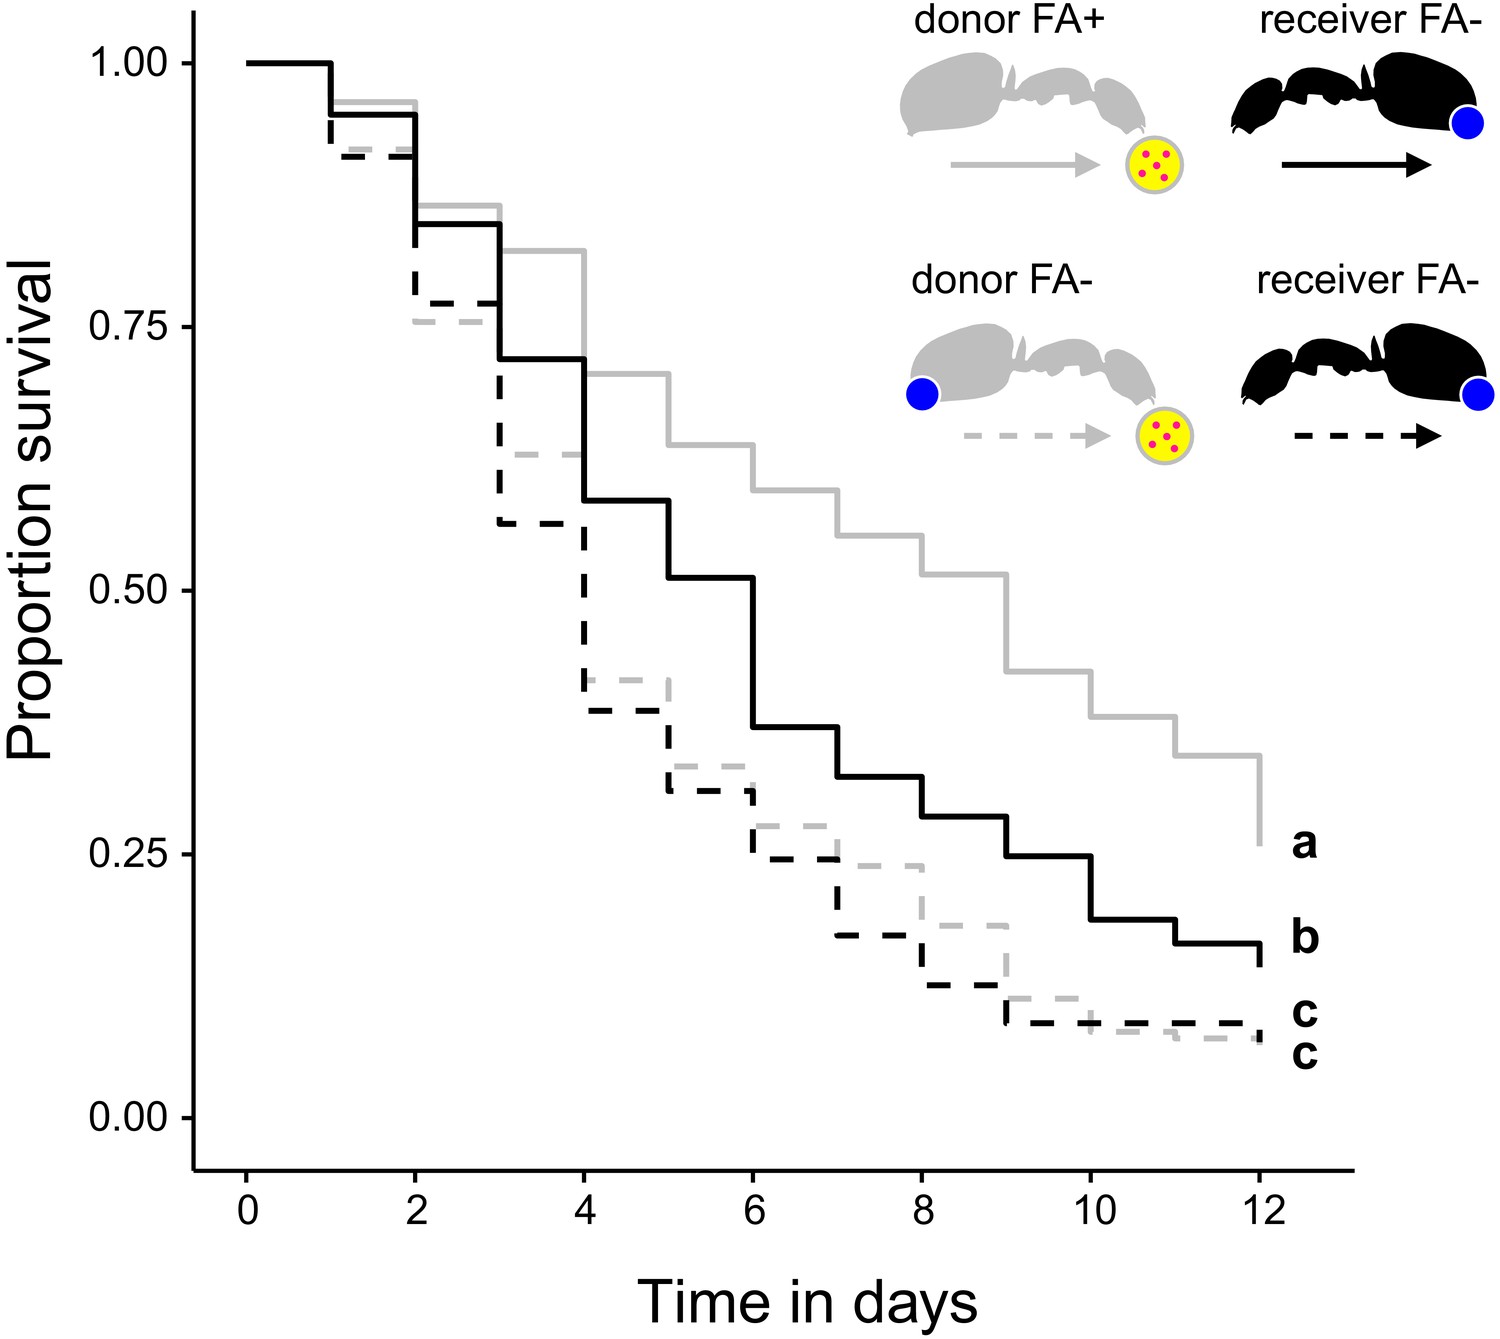
Survival after sharing pathogen contaminated food via trophallaxis.
Survival of donor ants (light gray ant outlines) that were directly fed with pathogen contaminated food (yellow circle with pink dots in insert) every other day and were either prevented to ingest their formic acid containing poison gland secretion (FA-; ant outlines with blue dot) or not (FA+) and survival of receiver ants (black ant outlines) that received pathogen contaminated food only through trophallaxis with donor ants and were always prevented to ingest their formic acid containing poison gland secretion (FA-) (COXME, LR-test, χ2 = 66.68, df = 3, p<0.001, same letters indicate p=0.309 and different letters indicate p≤0.002 in Westfall corrected post hoc comparisons).
-
Figure 4—source data 1
Source data on the survival of donor C. floridanus ants that were directly fed with pathogen contaminated food and were either prevented to ingest formic acid containing poison gland secretions (FA-) or not (FA+) and survival of receiver ants that received pathogen contaminated food only through trophallaxis with donor ants and were always prevented to ingest formic acid containing poison gland secretions (FA-).
- https://cdn.elifesciences.org/articles/60287/elife-60287-fig4-data1-v1.txt.zip
Figure 4—figure supplement 1
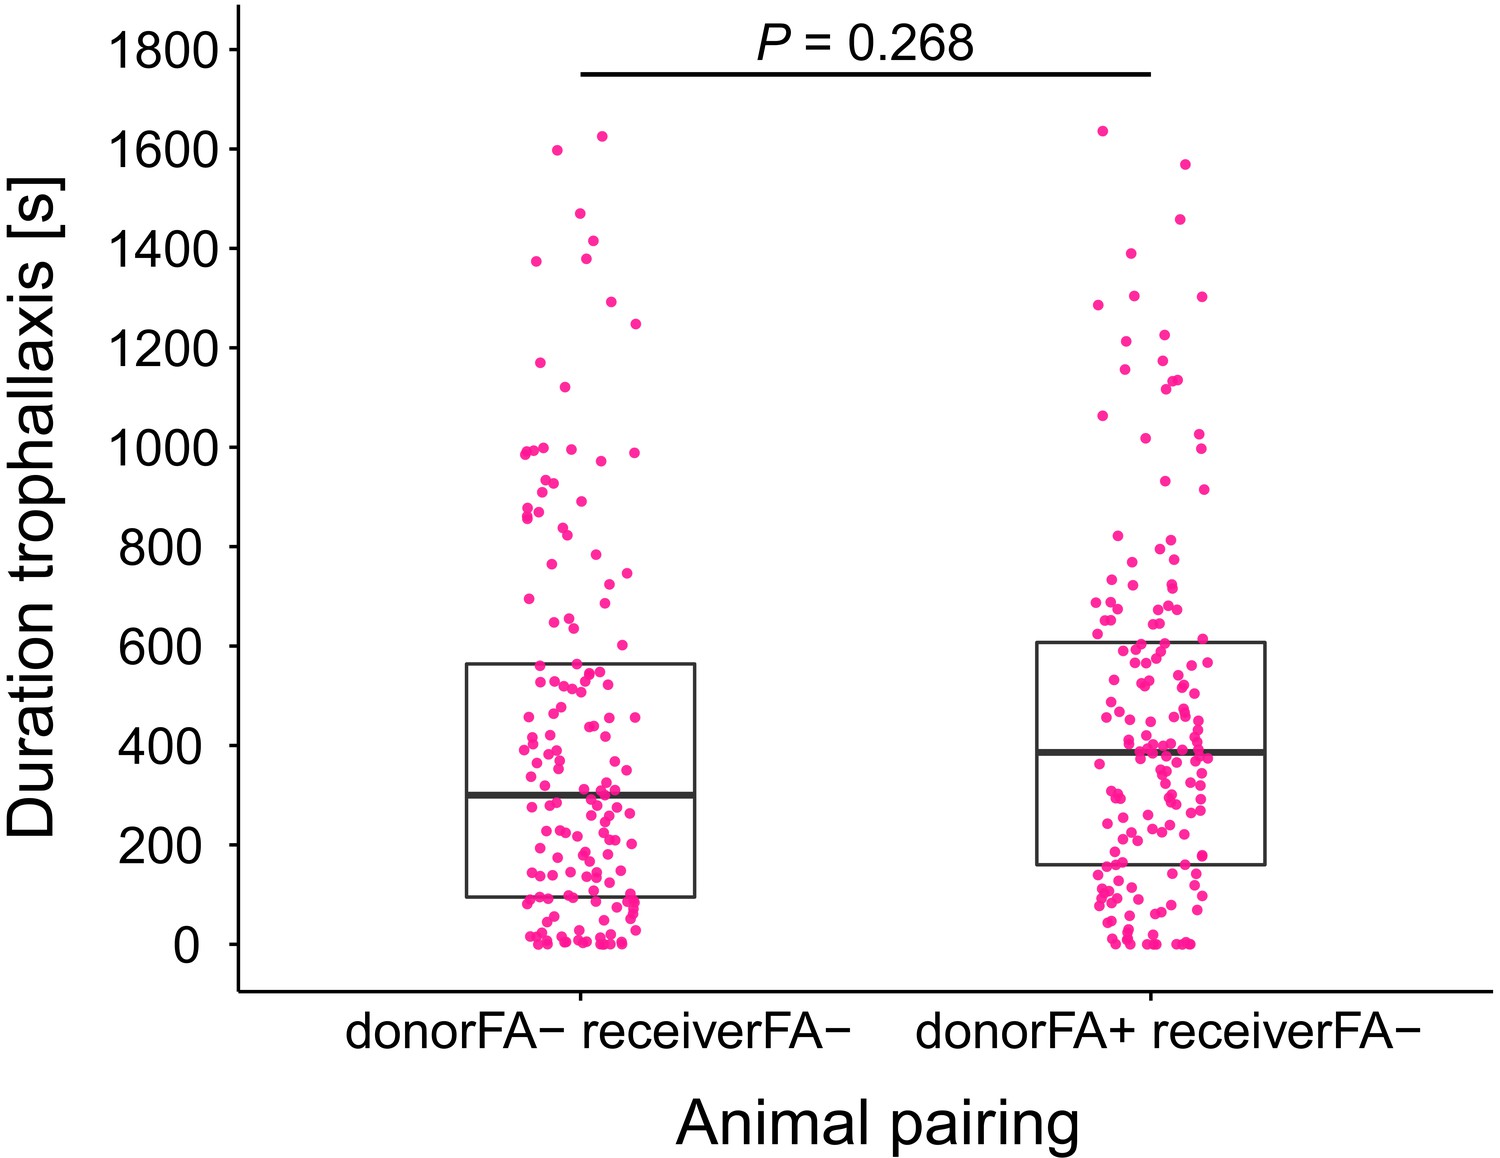
Duration of trophallaxis in donor-receiver ant pairs.
Total duration of trophallaxis events within 30 min. of the first bout of food exchange between donor-receiver ant-pairs (LMM, LR-test, χ2 = 1.23, df = 1, p=0.268). Donor ants in both pairs were directly fed with Serratia marcescens contaminated 10% honey water and were either prevented to ingest their formic acid containing poison gland secretion (FA-) or not (FA+), while receiver ants received pathogen contaminated food only through trophallaxis with the respective donor ants and were always prevented to ingest their formic acid containing poison gland secretion (FA-).
-
Figure 4—figure supplement 1—source data 1
Total duration of trophallaxis events within 30 min.
of the first bout of food exchange between donor-receiver ant-pairs of C. floridanus ants. Donor ants in both pairs were directly fed with Serratia marcescens contaminated 10% honey water and were either prevented to ingest formic acid containing poison gland secretions (FA-) or not (FA+), while receiver ants received pathogen contaminated food only through trophallaxis with the respective donor ants and were always prevented to ingest formic acid containing poison gland secretions (FA-).
- https://cdn.elifesciences.org/articles/60287/elife-60287-fig4-figsupp1-data1-v1.txt.zip
Figure 5 with 1 supplement
Viability of Asaia sp. over time in the digestive tract of C. floridanus.
Change in the number of colony forming units (CFUs) in the crop (a) and midgut (b) part of the digestive tract (yellow color in insert) relative to the mean CFU-number at 0 hr in the crop (CFU change corresponds to single data CFU-values divided by mean CFU-value at 0 hr in the crop), 0 hr, 0.5 hr, 4 hr, 24 hr, and 48 hr after feeding ants 10% honey water contaminated with Asaia sp. (a), Change of Asaia sp. in the crop (GLMM; LR-test, χ2 = 124.01, df = 4, p<0.001, same letters indicate p=0.488 and different letters indicate p≤0.013 in Westfall corrected post hoc comparisons). (b), Change of Asaia sp. in the midgut (GLMM; LR-test, χ2 = 59.94, df = 3, p<0.001, same letters indicate p=0.116 and different letters indicate p≤0.005 in Westfall corrected post hoc comparisons). Note that timepoints with zero bacterial growth in the midgut (0 hr) were excluded from the statistical model.
-
Figure 5—source data 1
Source data for panels a and b, on the number and the change in the number of colony forming units (CFUs) relative to 0 hr in the crop in the crop (a) and midgut (b) part of the digestive tract of C. floridanus ants at 0 hr, 0.5 hr, 4 hr, 24 hr, and 48 hr after feeding ants 10% honey water contaminated with Asaia sp.
- https://cdn.elifesciences.org/articles/60287/elife-60287-fig5-data1-v1.txt.zip
Figure 5—figure supplement 1
Asaia sp. growth in vitro.
Change in the number of CFUs relative to the mean at pH 5 (CFU change corresponds to single data CFU-value divided by mean CFU-value at pH 5) after incubation of Asaia sp. in 10% honey water (pH = 5) or in 10% honey water acidified with commercial formic acid to a pH of 4, 3, or 2 for 2 hr (GLM, LR-test χ2 = 21.179, df = 2, p<0.001, same letters indicate p=0.234, and different letters indicate p<0.001 in Westfall corrected post hoc comparisons). Note that pH-values with zero bacterial growth (pH 2) were excluded from the statistical model.
-
Figure 5—figure supplement 1—source data 1
Source data on the number and the change in the number of CFUs relative to pH five after incubation of Asaia sp.
in 10% honey water (pH = 5) or in 10% honey water acidified with commercial formic acid to a pH of 4, 3, or 2 for 2 hr.
- https://cdn.elifesciences.org/articles/60287/elife-60287-fig5-figsupp1-data1-v1.txt.zip
Tables
Key resources table
| Reagent type (species) or resource | Designation | Source or reference | Identifiers | Additional information |
|---|---|---|---|---|
| Biological sample (Camponotus floridanus) | Camponotus floridanus | other | See Materials and methods | |
| Biological sample (Camponotus maculatus) | Camponotus maculatus | other | See Materials and methods | |
| Biological sample (Lasius fuliginosus) | Lasius fuliginosus | other | See Materials and methods | |
| Biological sample (Formica cinerea) | Formica cinerea | other | See Materials and methods | |
| Biological sample (Formica cunicularia) | Formica cunicularia | other | See Materials and methods | |
| Biological sample (Formica fuscocinerea) | Formica fuscocinerea | other | See Materials and methods | |
| Biological sample (Formica pratensis) | Formica pratensis | other | See Materials and methods | |
| Biological sample (Formica rufibarbis) | Formica rufibarbis | other | See Materials and methods | |
| Strain, strain background (Serratia marcescens) | Serratia marcescens | Strain DSM12481, DSMZ-German Collection of Microorganisms and Cell Cultures GmbH, Braunschweig, Germany | ||
| Strain, strain background (Escherichia coli) | Escherichia coli | Strain DSM6897, DSMZ-German Collection of Microorganisms and Cell Cultures GmbH, Braunschweig, Germany | ||
| Strain, strain background (Asaia sp.) | Asaia sp. | Strain SF2.1 Favia et al., 2007 | ||
| Other | Blaubrand intraMARK micro pipettes | Brand, Wertheim, Germany | 708707 | |
| Other | pH sensitive paper | Hartenstein, Würzburg, Germany | PHIP | |
| Other | pH electrode | Unisense, Aarhus, Denmark | ||
| Other | Polymethylmethacrylate | University of Bayreuth, Animal Ecology I, group microplastic | ||
| Other | Leica microscope DM 2000 LED | Leica, Wetzlar, Germany | ||
| Other | Leica stereomicroscope M 165 C | Leica, Wetzlar, Germany | ||
| Other | Commercial honey | Different brands | 10% (w/v), 1:1 honey:water | |
| Other | superglue | UHU brand | ||
| Chemical compound, drug | ≥95% Formic acid | Sigmaaldrich, Merck, Darmstadt, Germany | Cat# F0507 | |
| Chemical compound, drug | Trypton | Sigmaaldrich, Merck, Darmstadt, Germany | Cat# T7293-250G | |
| Chemical compound, drug | Yeast extract | Millipore, Merck, Darmstadt, Germany | Cat# Y1625-250G | |
| Software, algorithm | R version 3. 6.1 | R Development Core Team, 2019 |
Additional files
-
Source code 1
Script all analyses with R-source code.
File containing all code required to reproduce the analyses and figures in R version 3.6.1.
- https://cdn.elifesciences.org/articles/60287/elife-60287-code1-v1.txt.zip
-
Transparent reporting form
- https://cdn.elifesciences.org/articles/60287/elife-60287-transrepform-v1.docx
Download links
A two-part list of links to download the article, or parts of the article, in various formats.
Downloads (link to download the article as PDF and Executable version)
Open citations (links to open the citations from this article in various online reference manager services)
Cite this article (links to download the citations from this article in formats compatible with various reference manager tools)
Formicine ants swallow their highly acidic poison for gut microbial selection and control
eLife 9:e60287.
https://doi.org/10.7554/eLife.60287


