Structure of the bacterial ribosome at 2 Å resolution
- Department of Chemistry, University of California, Berkeley, United States
- Department of Molecular and Cell Biology, University of California, Berkeley, United States
- Innovative Genomics Institute, University of California, Berkeley, United States
- Earth and Planetary Science, University of California, Berkeley, United States
- Department of Chemistry, Yale University, United States
- Environmental Science, Policy and Management, University of California Berkeley, United States
- Molecular Biophysics and Integrated Bioimaging Division, Lawrence Berkeley National Laboratory, United States
Figures
Figure 1 with 7 supplements
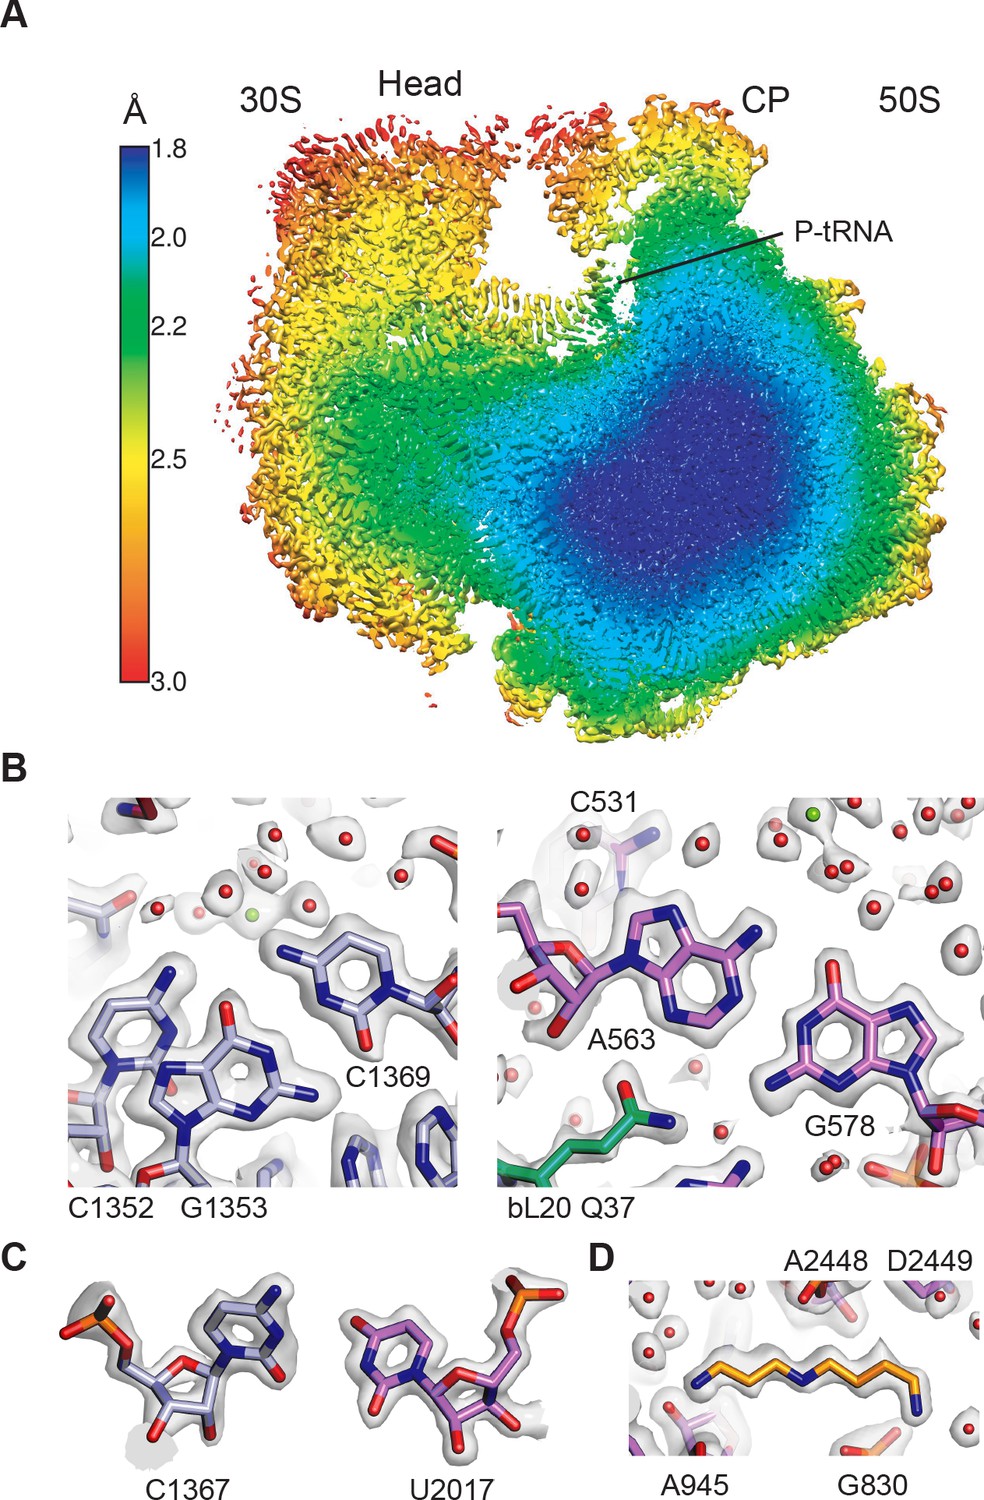
Overall structure of the 70S ribosome and cryo-EM map quality.
(A) Cutaway view through the local resolution map of the 70S ribosome reconstruction. (B) Base pair density in the cores of the 30S (left) and 50S (right) ribosomal subunits. Examples demonstrate the overall high resolution of base pairs and nearby solvation and Mg2+ sites. B factors of −15 Å2 and −10 Å2 were applied to the RELION post-processed 50S subunit and 30S subunit head-focused maps, respectively. (C) Nucleotide ribose in the core of the 30S subunit (left) and 50S subunit (right). A B factor of −10 Å2 was applied to the 30S subunit density after post-processing. (D) Cryo-EM density of the 50S subunit showing the polyamine spermidine.
Figure 1—figure supplement 1
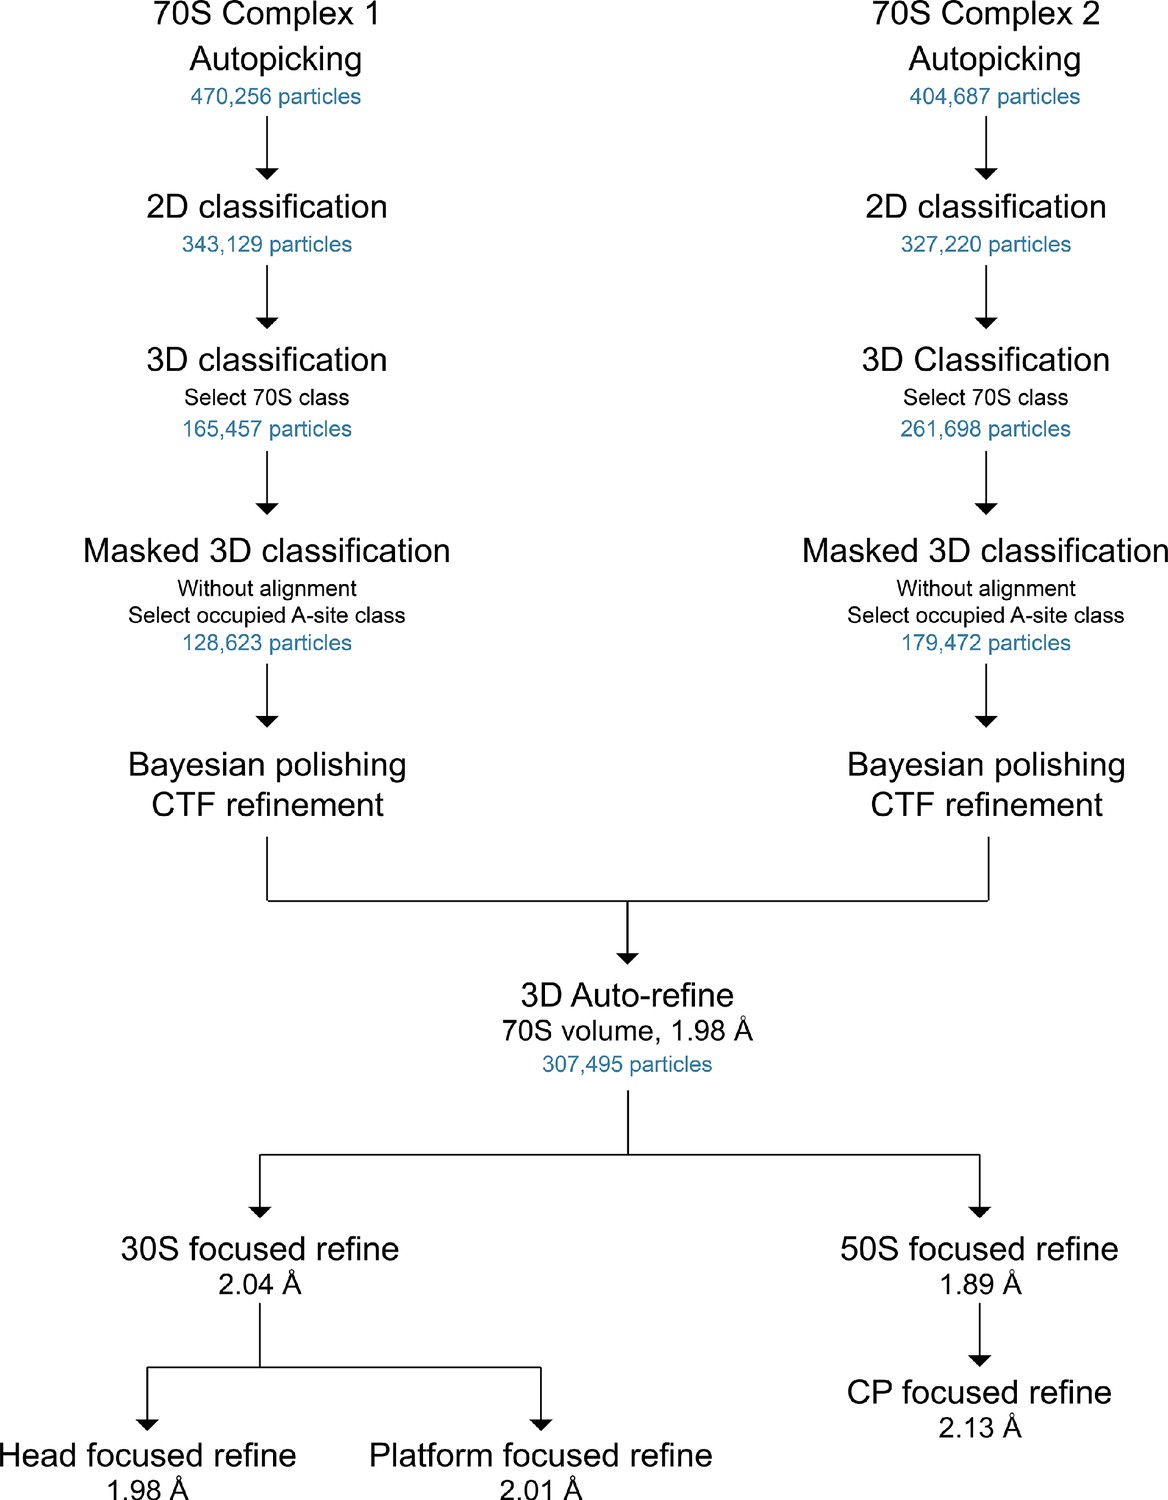
General scheme of cryo-EM data processing workflow.
The number of particles at each stage is shown, as well as the final resolutions as defined by half-map FSCs (cutoff of 0.143).
Figure 1—figure supplement 2
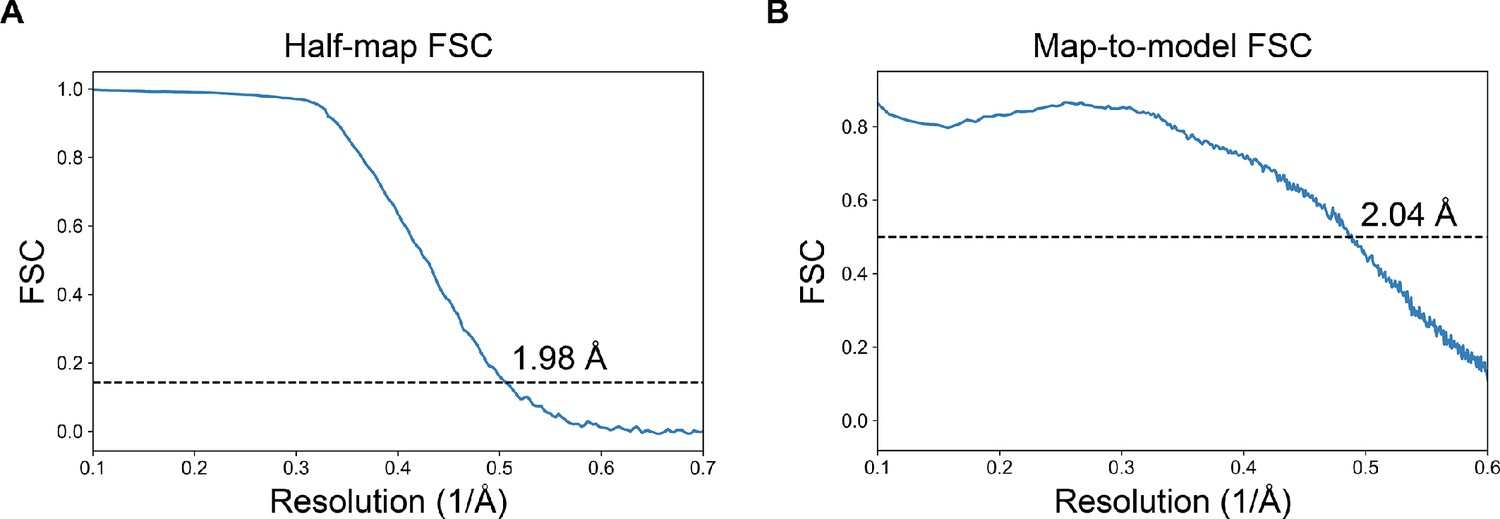
Fourier shell correlations for cryo-EM maps of the 70S ribosome.
(A) Half-map FSC curve for the 70S ribosome is shown. The ‘gold-standard’ cutoff value for resolution (0.143) is indicated. (B) The map-to-model FSC curve for the 70S ribosome, with an overall resolution indicated at an FSC value of 0.5.
Figure 1—figure supplement 3
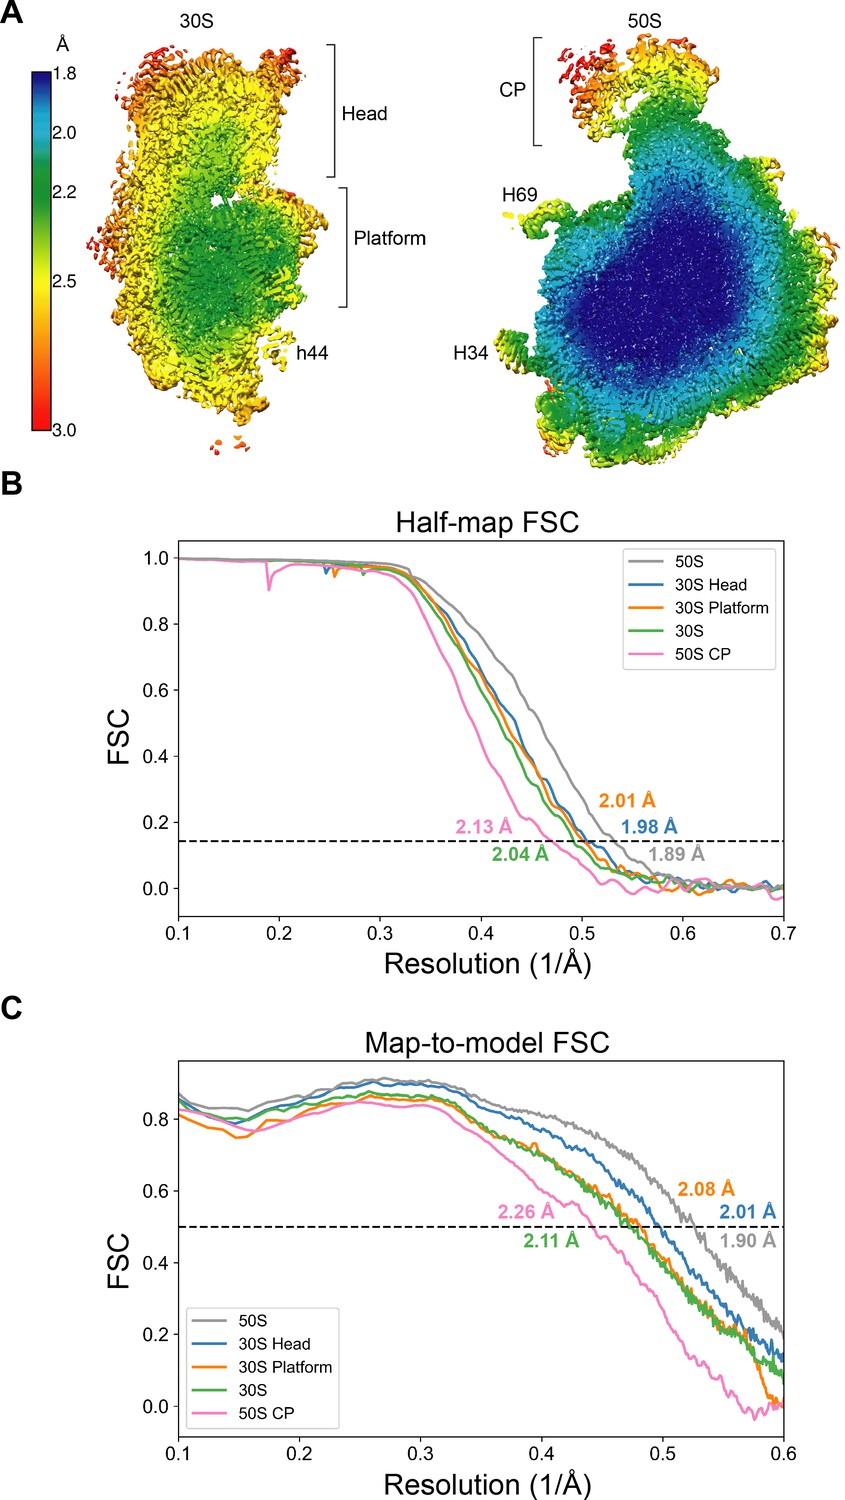
Resolution of maps of the 30S and 50S ribosomal subunits.
(A) Local resolution of the 30S and 50S subunits. Brackets indicate regions masked for further focused refinement. 16S rRNA helix h44 and 23S rRNA helices H34 and H69 are also labeled. (B) Half-map FSC curves for focused-refined maps of the 50S subunit, 30S subunit, 50S central protuberance, 30S subunit head domain, and 30S subunit platform are shown. The ‘gold-standard’ cutoff value for resolution (0.143) is indicated in each graph. (C) The map-to-model FSC curves for the focused-refined maps of the 50S subunit, 30S subunit, 50S central protuberance, 30S subunit head domain, and 30S subunit platform are shown.
Figure 1—figure supplement 4
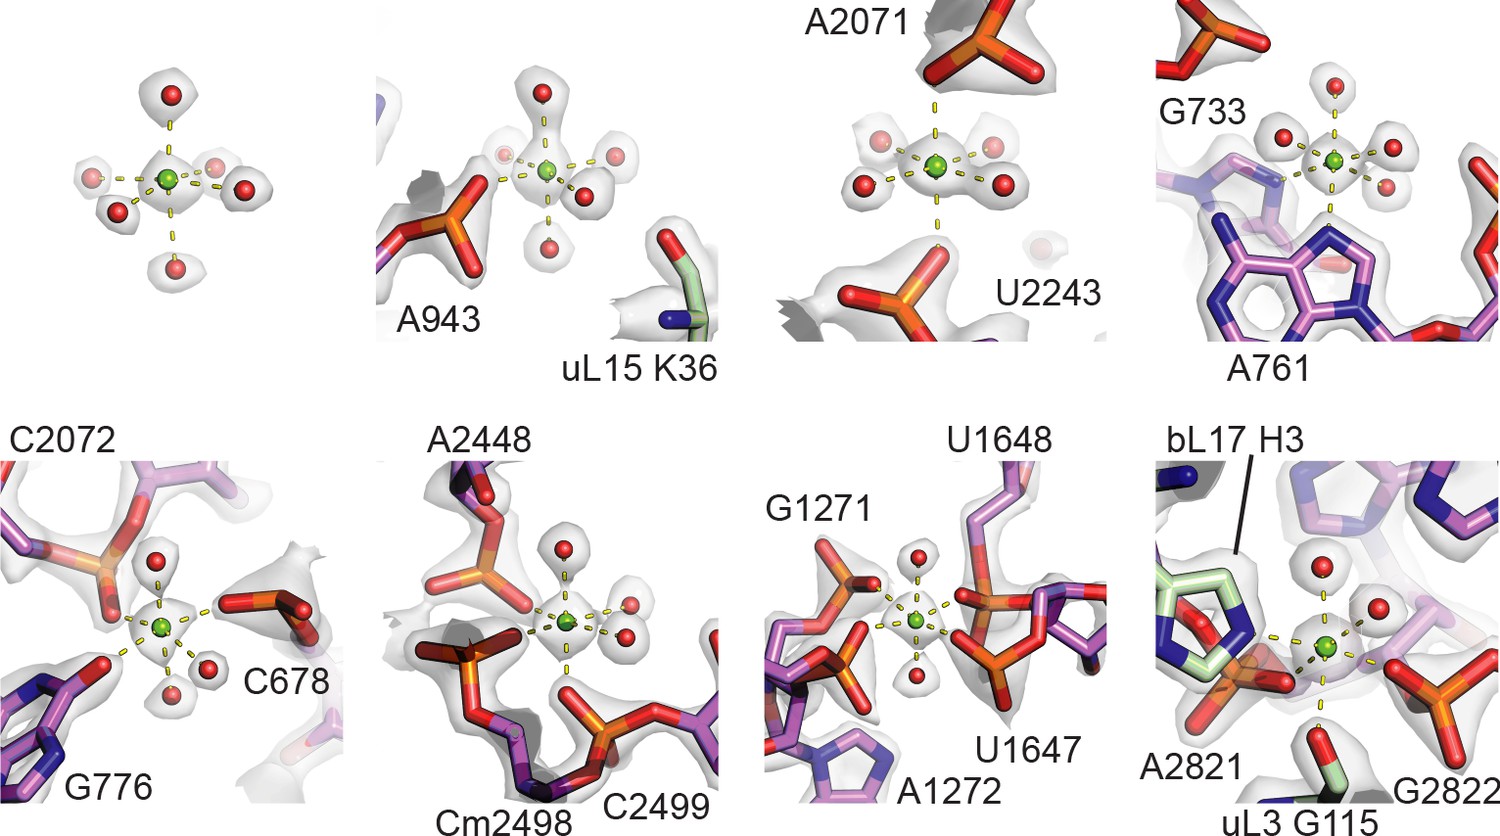
Gallery of Mg2+ coordination states observed in the 50S subunit.
Examples include magnesium ions with different levels of direct coordination to the rRNA or proteins. The fully-hydrated Mg2+ is located near 23S rRNA nucleotide A973.
Figure 1—figure supplement 5
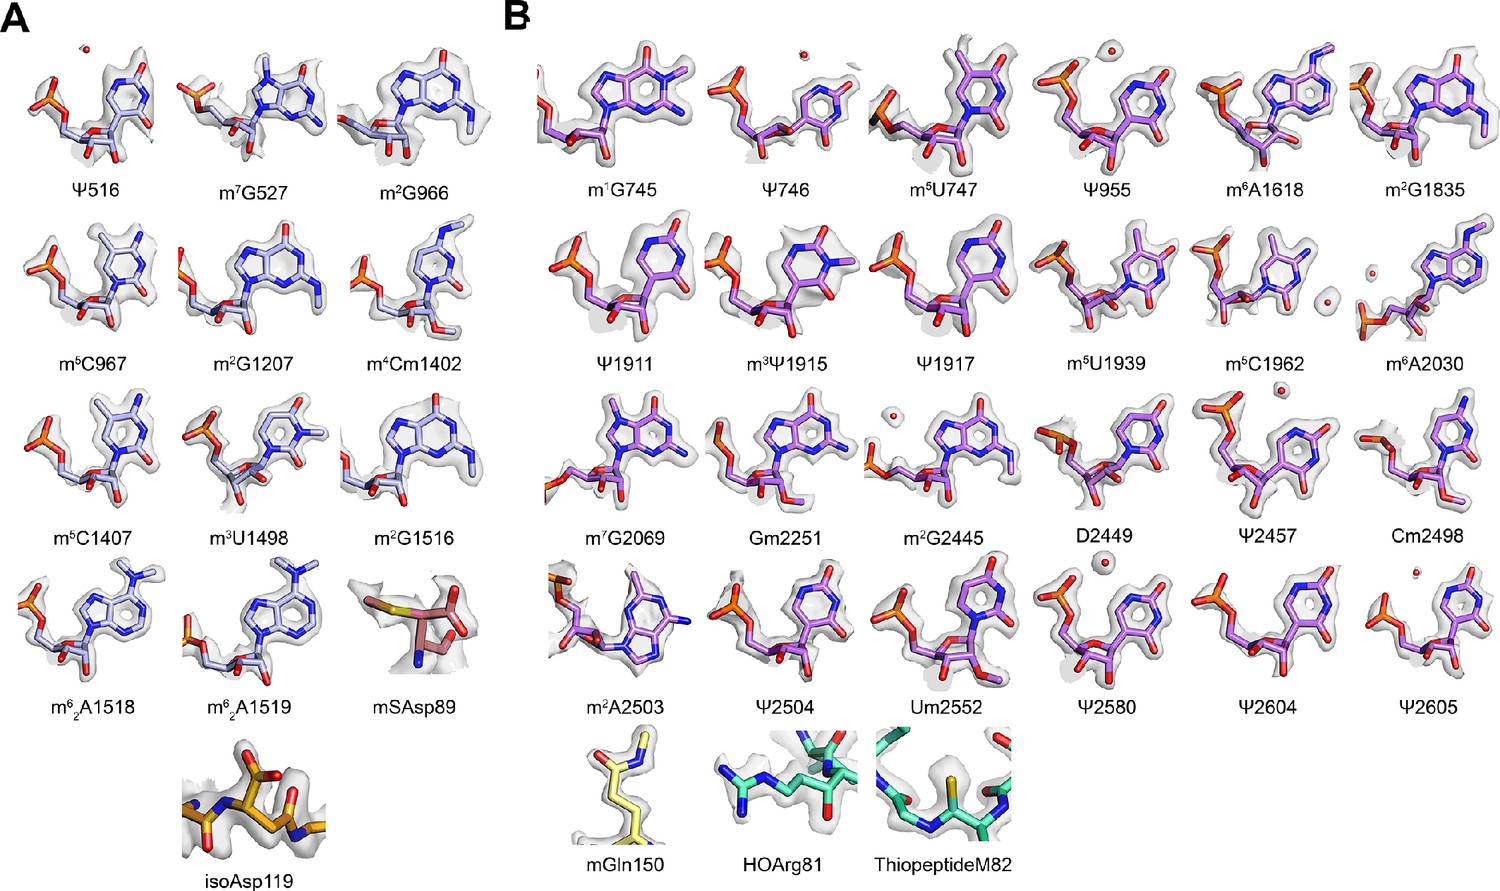
Gallery of post-transcriptionally modified nucleotides and post-translationally modified amino acids.
(A) Post-transcriptionally modified nucleotides and post-translationally modified amino acids in the 30S subunit. The density for m7G527 and mSAsp89 is contoured at a lower level to show the presence of the modifications. (B) Post-transcriptionally modified nucleotides and post-translationally modified amino acids in the 50S subunit. In panel A, nucleotides m7G527 and m62A1519 appear hypomodified, when compared to m7G2069 in 23S rRNA, and when compared to other methylated nucleobases and m62A1518 in 16S rRNA.
Figure 1—figure supplement 6

Close proximity of m7G527 in 16S rRNA and β-methylthio-Asp89 in uS12.
Both m7G527 (light purple) and β-methylthio-Asp89 in uS12 (pink) appear hypomodified based on the cryo-EM map contour level required to enclose adjacent atoms and residues.
Figure 1—figure supplement 7

Weak RNA backbone density in the 50S subunit.
(A) Map around nucleotides C2443, C2442, and U2441 of the 50S subunit in a reconstruction from frames 1–2 of the exposure, corresponding to the first ~2 electrons per Å2. The same nucleotides are shown for the first three frames (~3 electrons per Å2) (B) and the final 50S-focused, Ewald sphere-corrected map with all frames included (~40 electrons per Å2, with dose weighting) (C). Some features persist in all three reconstructions, for instance, the break between C3’ and C4’ in C2443 or between C5’ and O5’ in U2441 (indicated with black triangles). Some features become less connected with longer exposure (e.g. O3’ in C2441, indicated with a white triangle), while others appear improved with longer exposure (e.g. O4’ in C2443 and C2442, indicated with blue triangles).
Figure 2 with 1 supplement
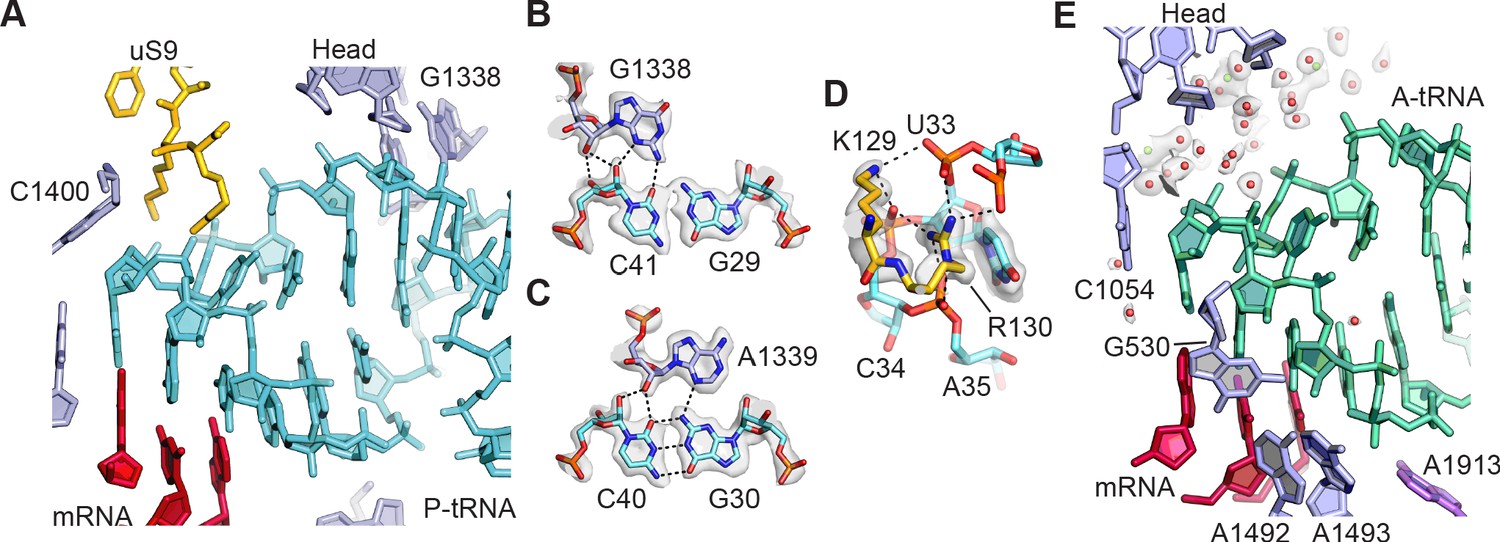
tRNA binding to the 30S ribosomal subunit.
(A) Overall view of P-site tRNA anticodon stem-loop (ASL, cyan), mRNA (red), 16S rRNA nucleotides (light purple), and uS9 residues (gold). (B) Interactions between 30S subunit head nucleotide G1338 with P-tRNA ASL. (C) Interactions between 30S subunit head nucleotide A1339 with P-site ASL. (D) Interactions between P-tRNA ASL and protein uS9. Arg130 is observed stacking with nucleotide U33 of the ASL and forming hydrogen bonds with backbone phosphate groups. (E) Solvation of A-site tRNA near the 30S subunit head domain. A-site tRNA ASL in green, 16S rRNA in light purple, and mRNA in purple-red. Water oxygen atoms in red spheres and Mg2+ in green spheres. Maps shown in panels B–E are from the 30S subunit head-focused refinement.
Figure 2—figure supplement 1

Solvation of the 30S ribosomal subunit.
(A) Solvation of the 30S subunit with solvent oxygen atoms shown as red spheres. (B) Polyamine (gray carbon) and Mg2+ (green) sites in the 30S subunit, shown with metal-coordinating atoms (oxygen in red, nitrogen in blue). Cryo-EM density is shown with a low-pass filter of 8 Å.
Figure 3 with 1 supplement
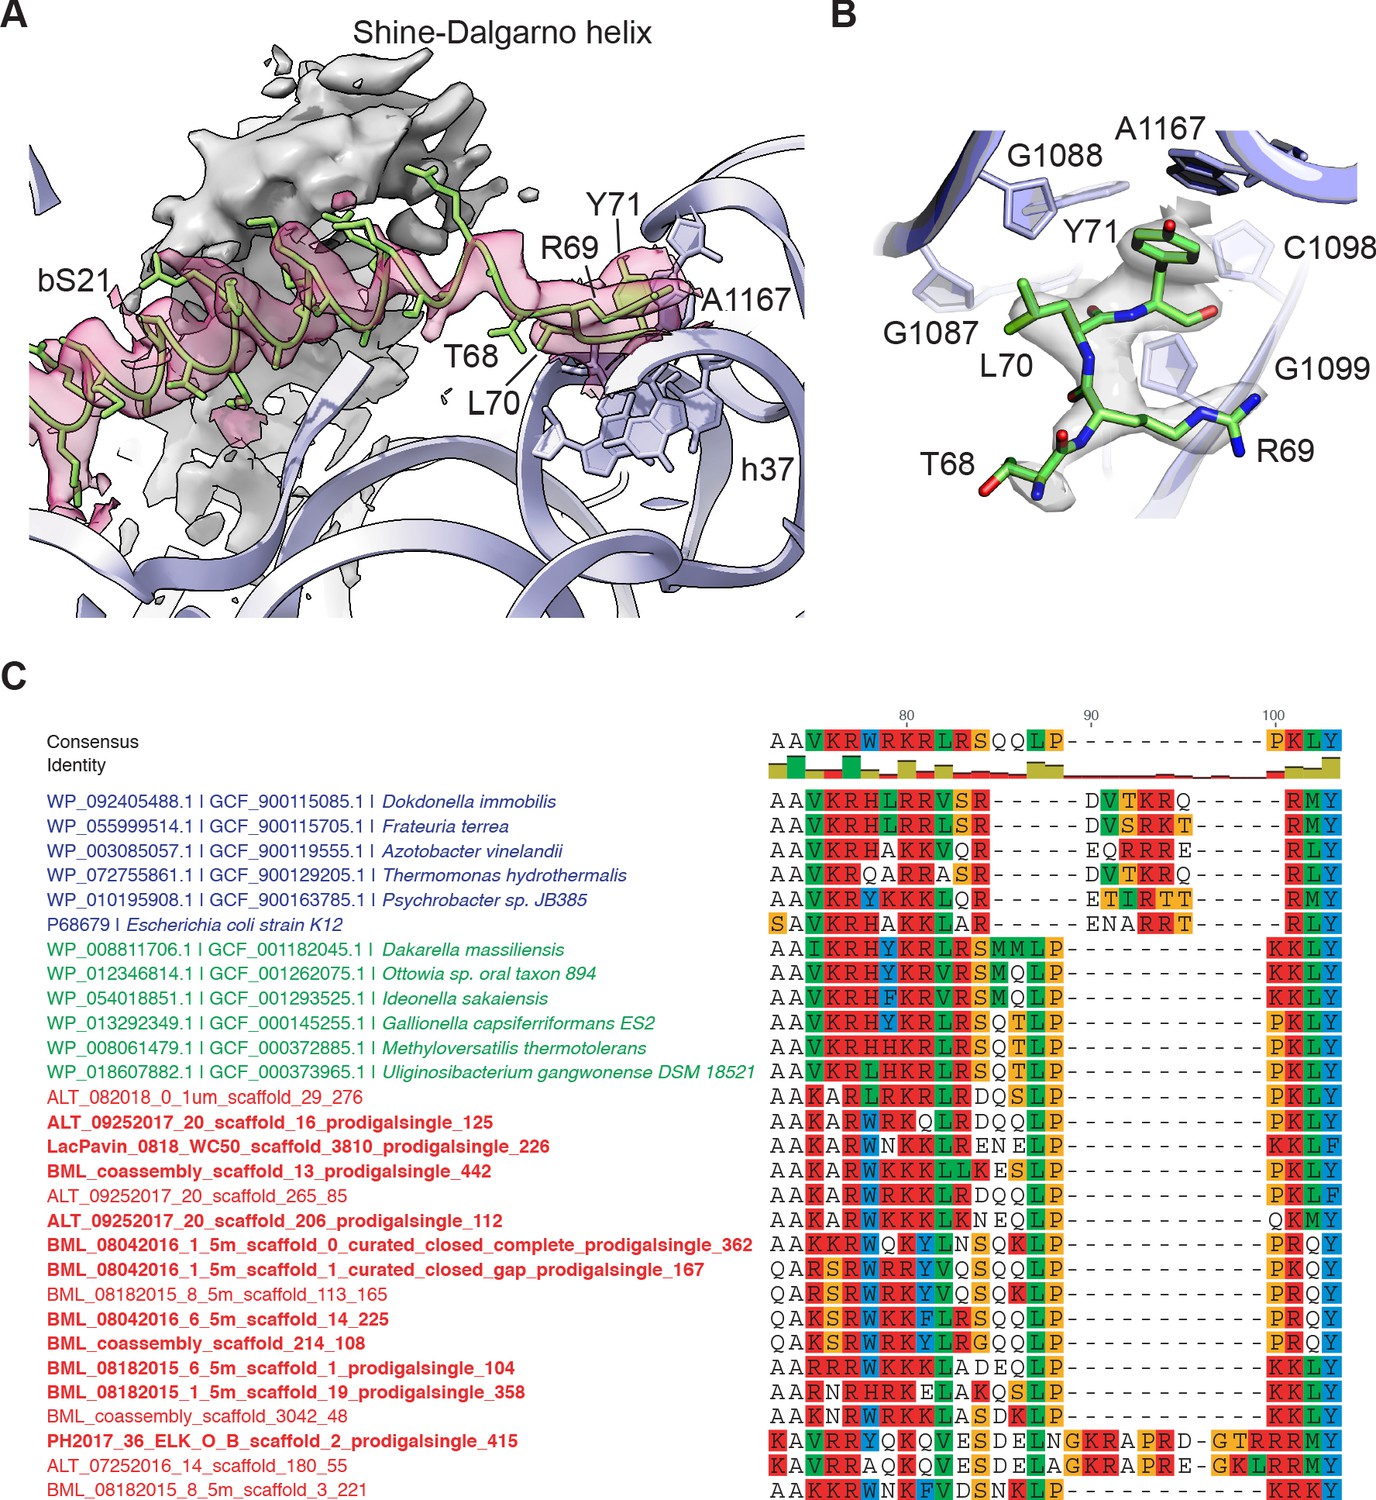
Protein bS21 interactions with the 30S ribosomal subunit head domain.
(A) bS21 C-terminal structure in the 30S subunit head-focused map, with Shine-Dalgarno helical density shown in gray and density for bS21 in rose. Low-pass filtering to 3.5 Å resolution was applied to clarify helical density. 16S rRNA shown in light purple ribbon and bS21 shown in light green. 16S rRNA bases that interact with the RLY motif are shown in stick representation. (B) Closeup of the RLY motif of bS21 and contacts with 16S rRNA h37 and A1167. (C) Protein bS21 sequence alignment near the C-terminus, along with associated phage S21 sequences. Gammaproteobacteria (blue), Betaproteobacteria (green), and phage (red) are shown.
Figure 3—figure supplement 1
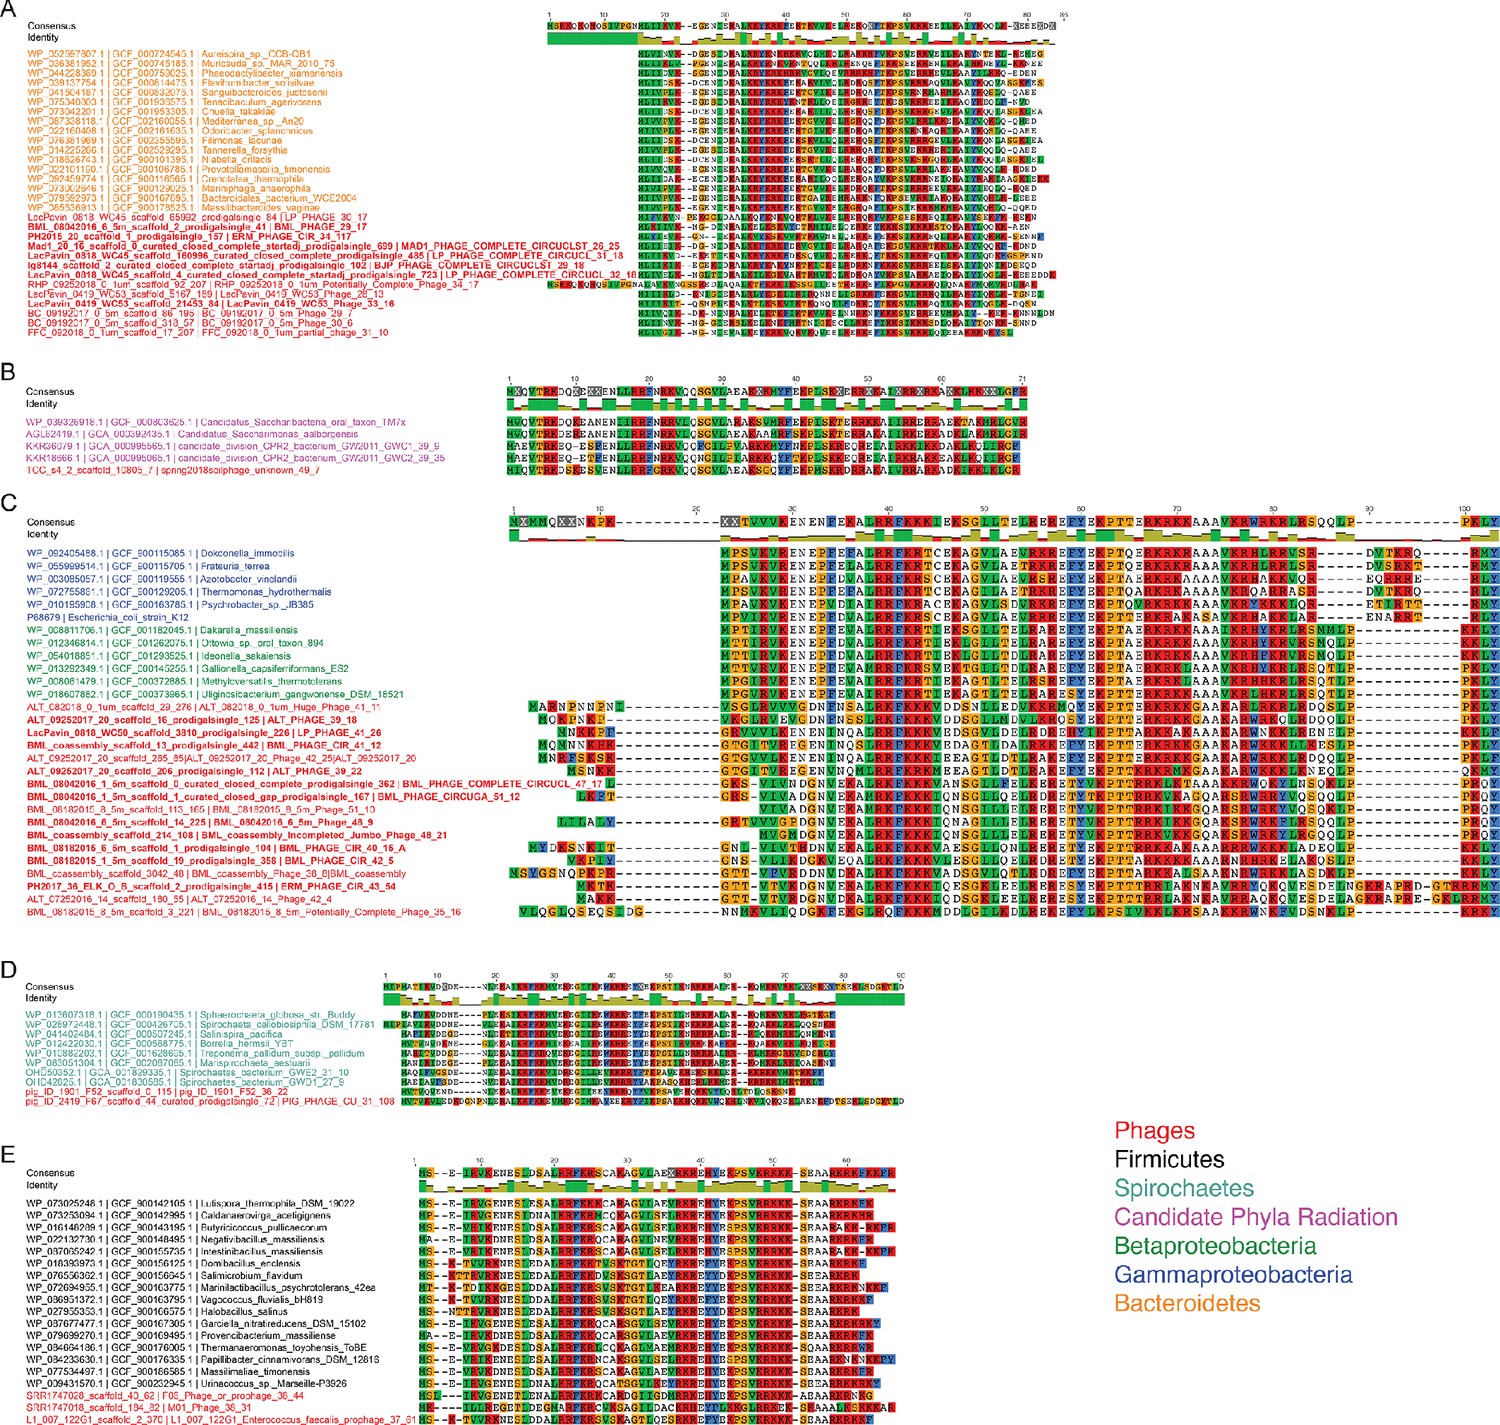
Phage S21 and bacterial host bS21 sequence alignments.
Sequence alignments of phage S21 homologs (in red) and associated host bacterial clades from (A) Bacteroidetes (orange), (B) The Candidate Phyla Radiation (magenta), (C) Betaproteobacteria (green) and Gammaproteobacteria (blue), (D) Spirochetes (blue-green), and (E) Firmicutes (black). Phage sequences in bold indicate phages with a predicted bacterial host.
Figure 4 with 3 supplements
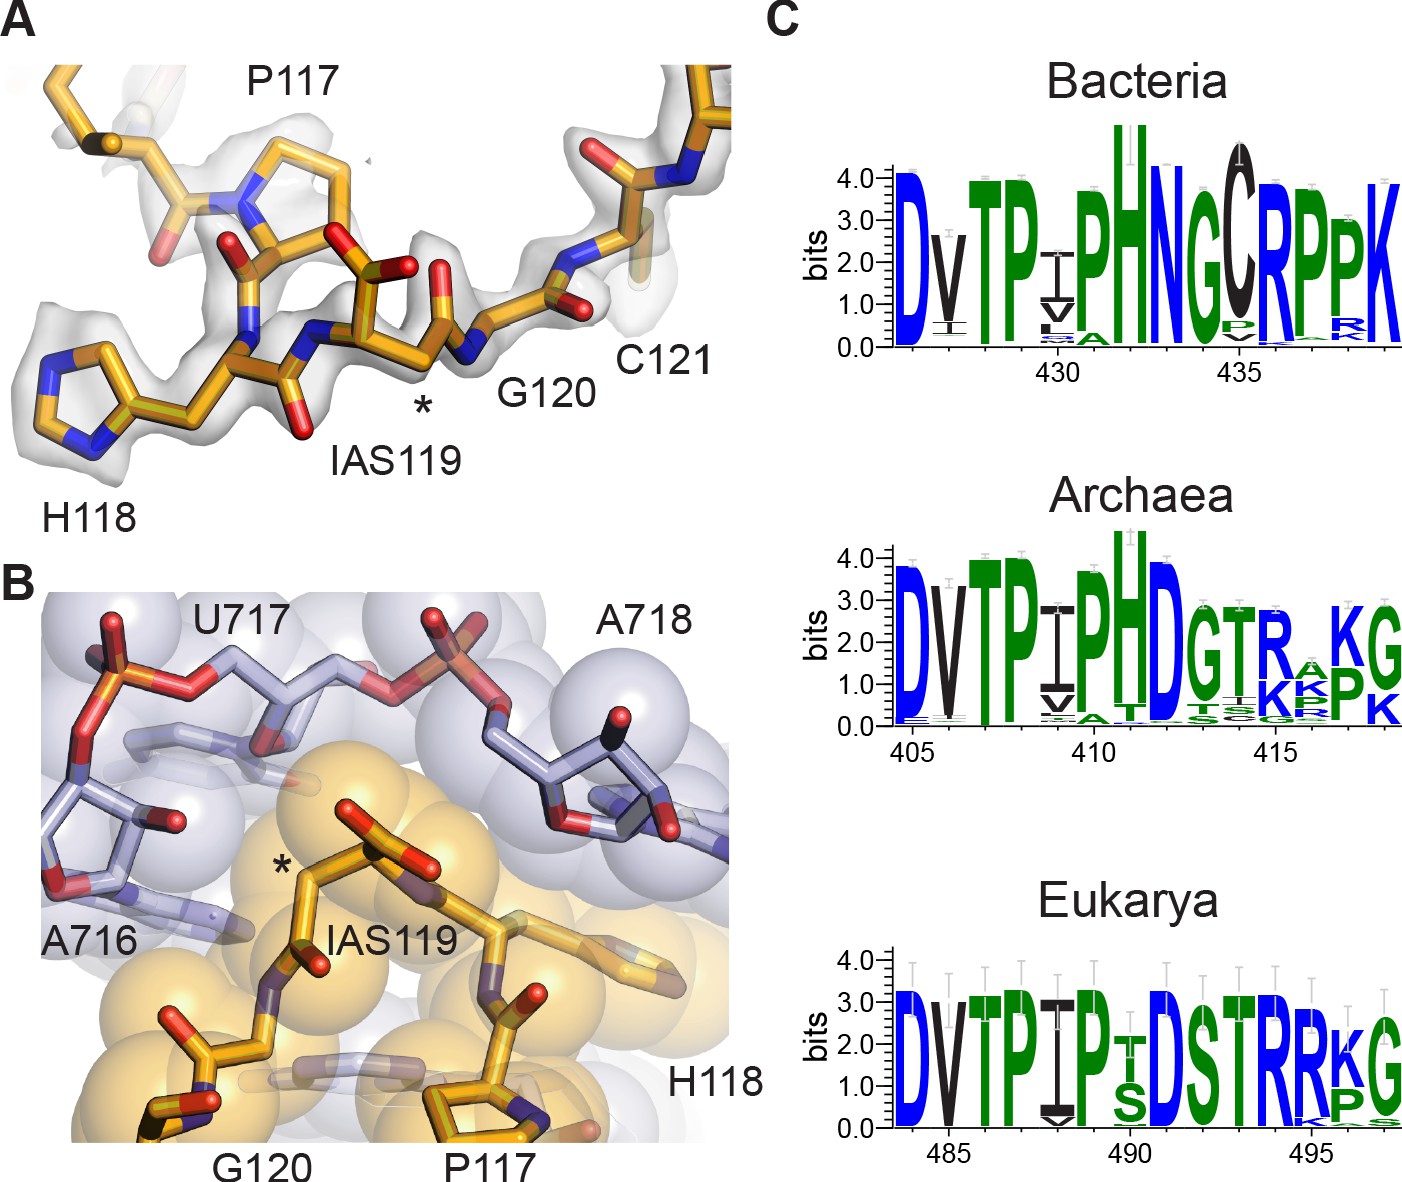
Isoaspartyl residue in protein uS11.
(A) Model of isoAsp at residue position 119 in uS11, with nearby residues and cryo-EM density from the 30S subunit platform-focused refinement. Weak density for the carboxylate is consistent with the effects of damage from the electron beam. The asterisk indicates the position of the additional backbone methylene group. (B) Shape complementarity between uS11 and 16S rRNA nucleotides surrounding IsoAsp119. 16S rRNA is shown in light purple and uS11 in orange, with atomistic coloring for the stick model. (C) Sequence logos of conserved amino acids spanning the putative isoAsp residue in all three domains of life.
Figure 4—figure supplement 1
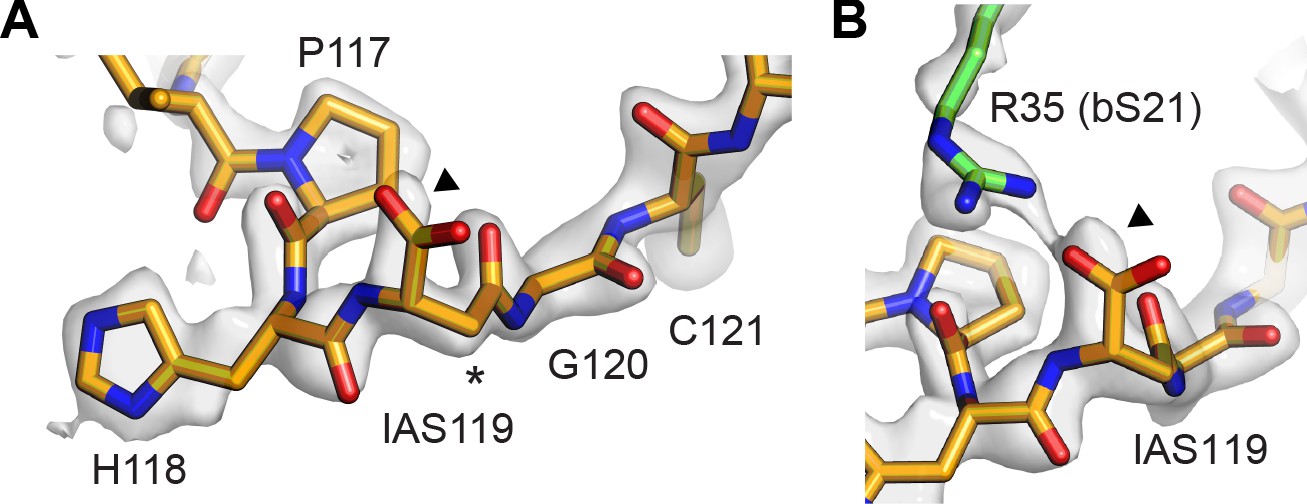
Cryo-EM density for uS11 based on early movie frames.
Frames 1–3 of the acquired movies were used to calculate a 30S focused-refined cryo-EM map. (A) The model of isoaspartate 119 in uS11 and neighboring amino acids is shown in the density. The arrow points to the isoaspartate sidechain density, and the asterisk indicates the position of the additional backbone methylene group. The map-to-model resolution for the 30S subunit in this map was 2.45 Å and GS-FSC resolution was 2.26 Å. (B) An alternative view of isoaspartate sidechain in uS11 (orange) showing interaction with R35 of protein bS21 (green).
Figure 4—figure supplement 2
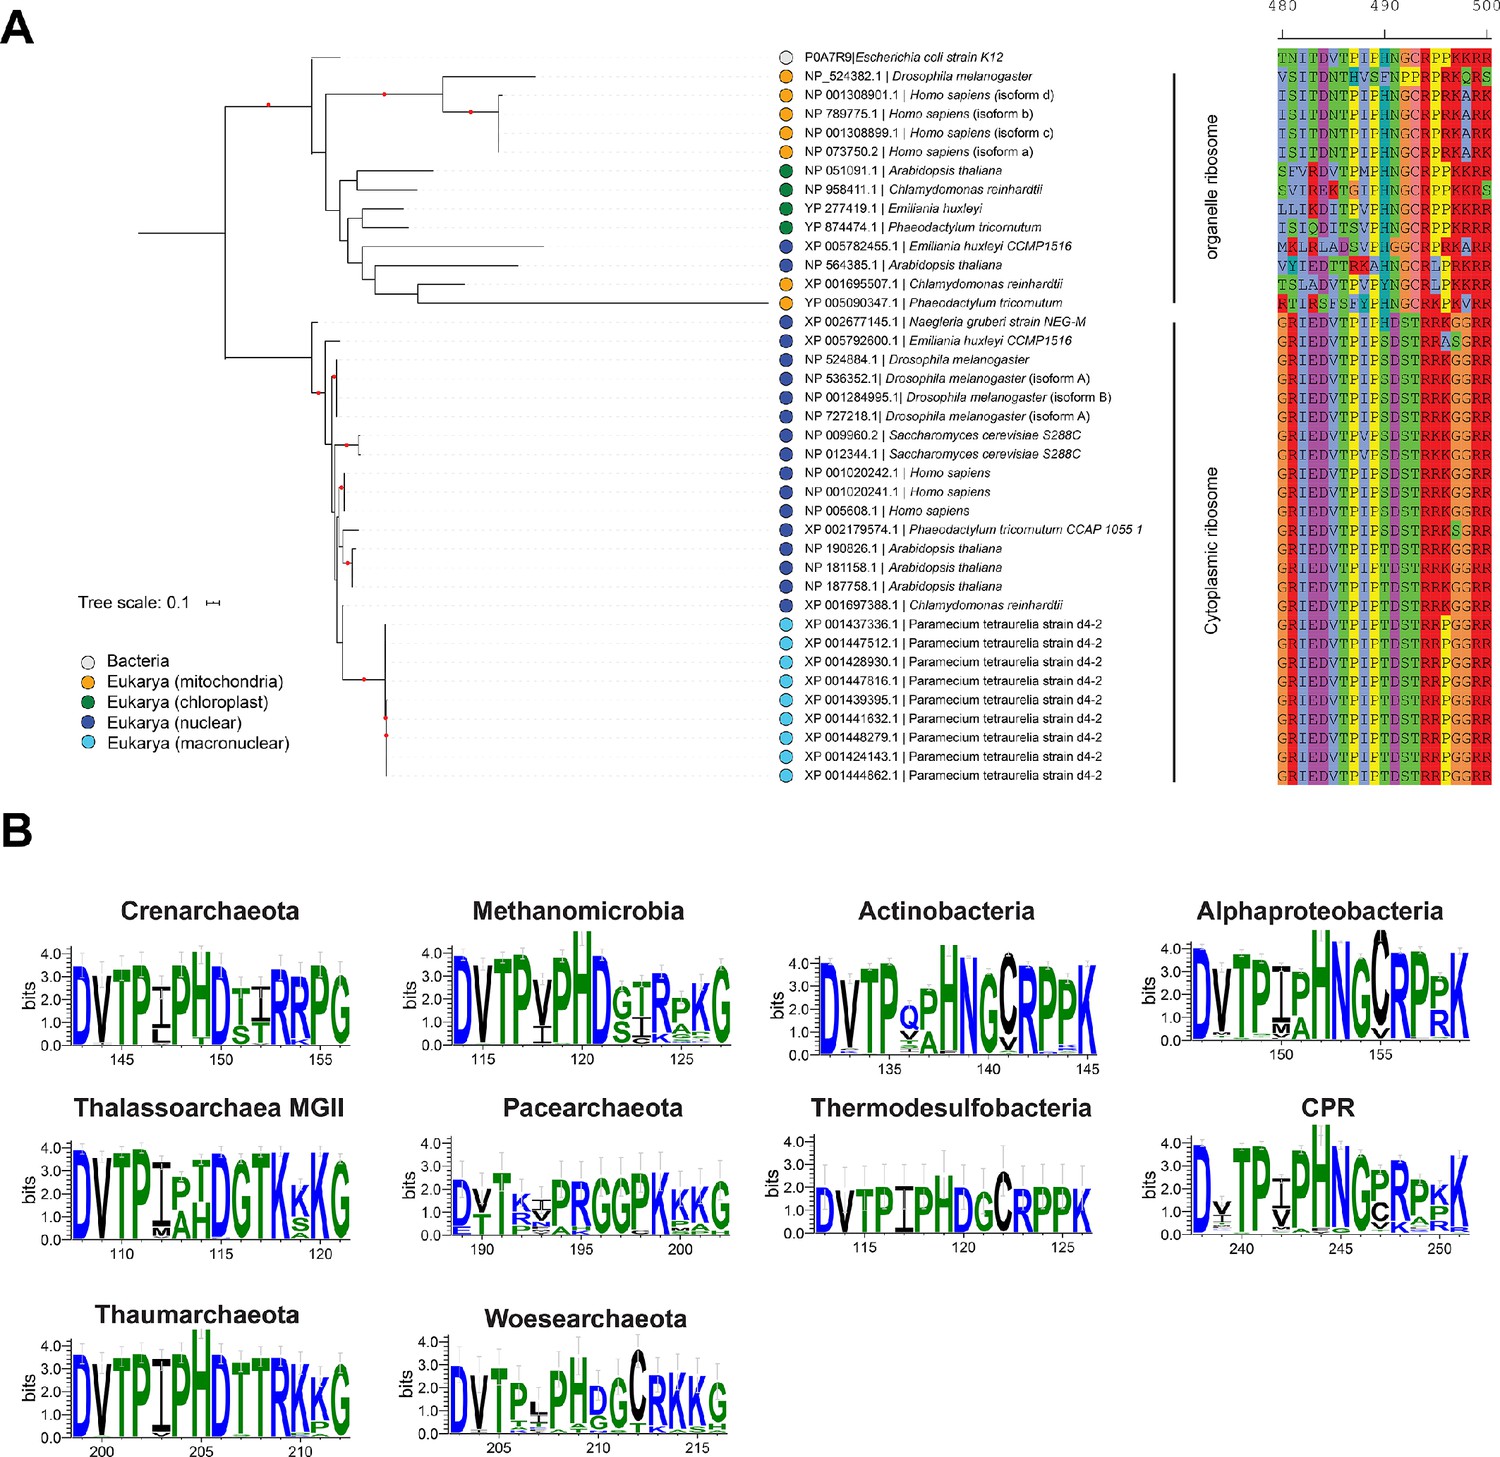
Conservation of residues near the isoAsp residue in uS11 homologs.
(A) Phylogenetic tree of the uS11 ribosomal proteins in eukaryotes, including both cytoplasmic and organelle examples, along with Escherichia coli and the amino acids around the PHNG motif. The maximum likelihood tree was constructed under an LG+G4 model of evolution. Nodes with bootstrap values ≥ 85 are indicated by red circles. Scale bar indicates the average substitutions per site. (B) Sequence conservation in uS11 homologs in different bacterial and archaeal phyla.
Figure 4—figure supplement 3
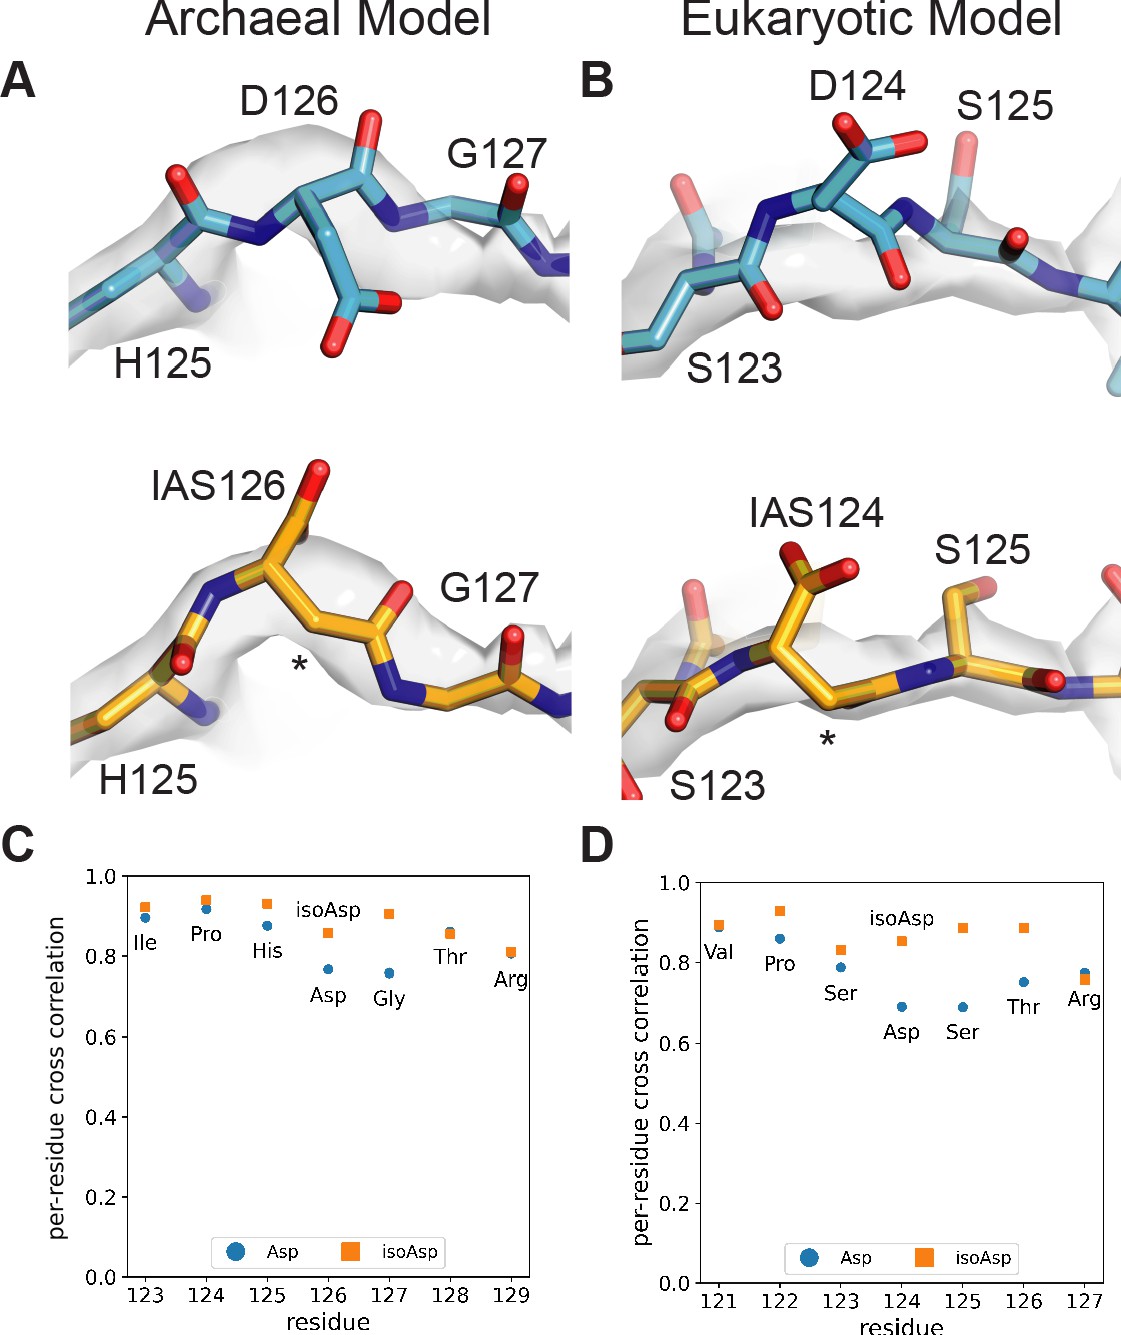
Structural models for isoaspartate in archaeal and eukaryotic ribosomes.
Comparisons of published uS11 models (blue) in the archaeal (Nürenberg-Goloub et al., 2020) (A) and eukaryotic (Tesina et al., 2020) ribosomes (B) with models incorporating the IsoAsp modification (yellow-orange), real-space refined into the corresponding published maps. (C) Real-space correlations of models refined into the archaeal 30S subunit cryo-EM map, on a per-residue basis. (D) Real-space correlations of models refined into the eukaryotic ribosome cryo-EM map.
Figure 5
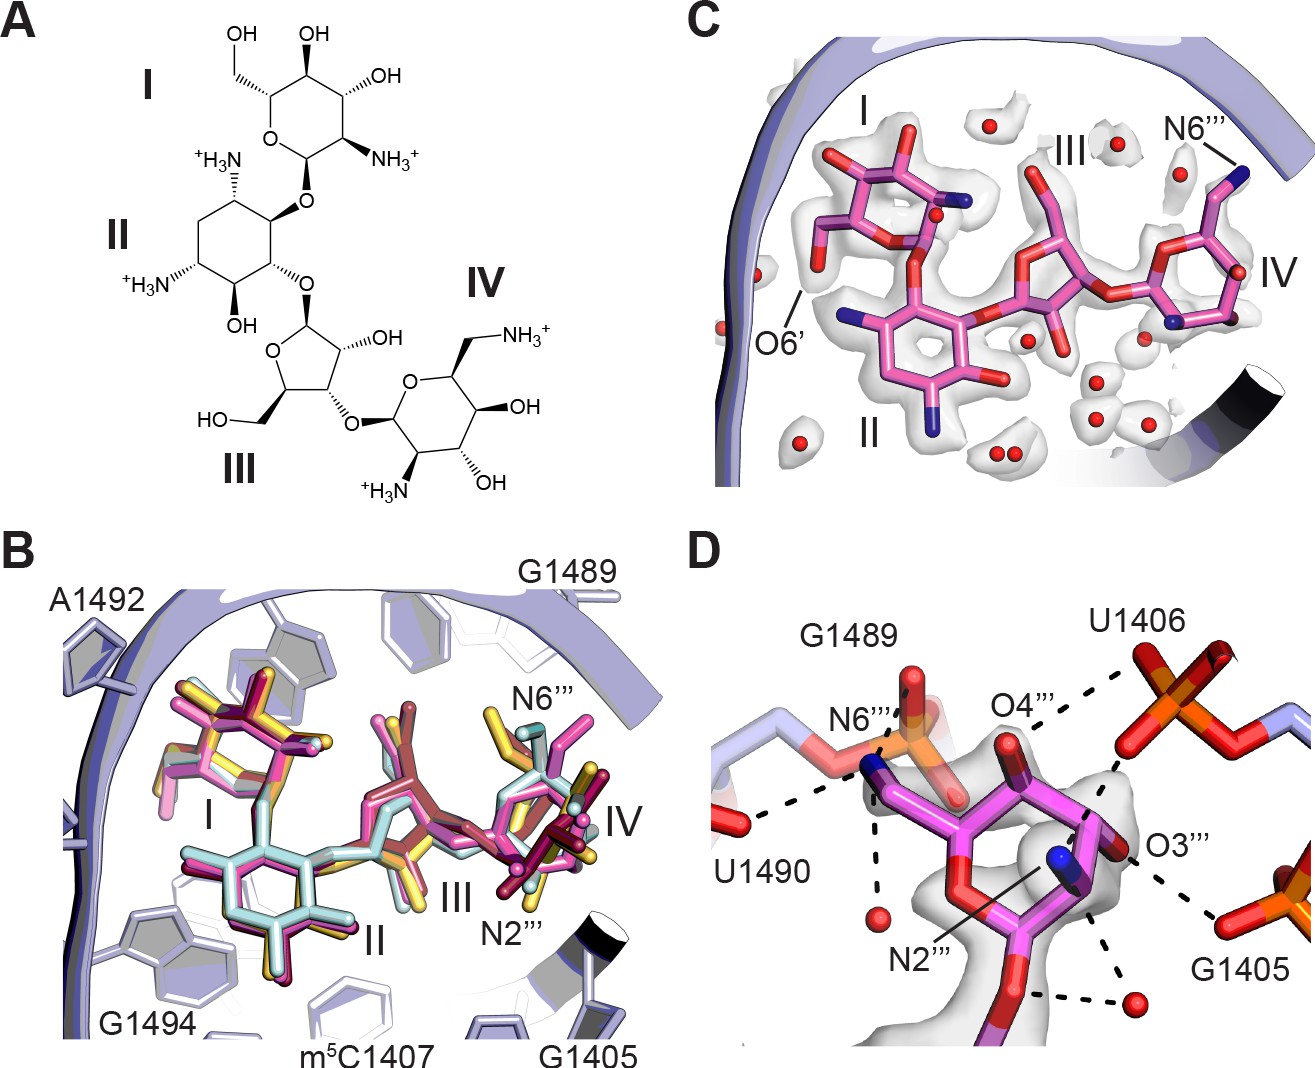
Binding of paromomycin to the mRNA decoding site in the 30S subunit.
(A) Chemical structure of paromomycin (PAR) with ring numbering. (B) Comparison of paromomycin conformations in different structures. Paromomycin from three prior structural models (Kurata et al., 2008; Selmer et al., 2006; Vicens and Westhof, 2001), shown in yellow, dark pink, and light blue, respectively, superimposed with the present model of paromomycin, shown in pink. The binding pocket formed by 16S rRNA is shown in light purple. (C) Overall positioning of PAR within the binding site including solvation. (D) Paromomycin ring IV contacts to the phosphate backbone in 16S rRNA helix h44. Dashed lines denote contacts within hydrogen-bonding distance. The map was blurred with a B factor of 10 Å2.
Figure 6
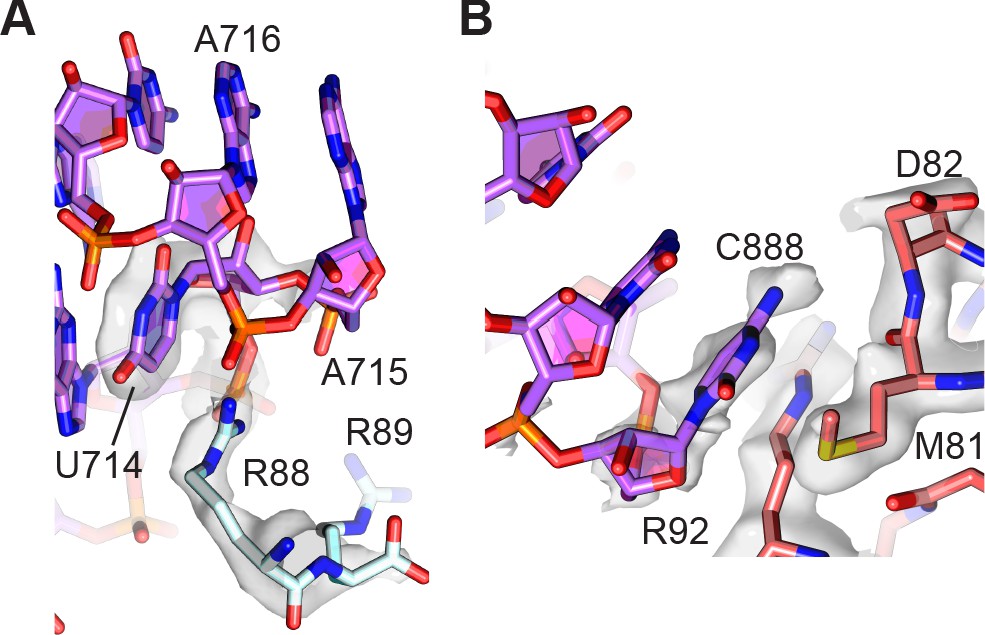
Peripheral contacts between the 30S and 50S subunits.
(A) Interaction of the C-terminus of uS15 (light blue) with 23S rRNA nucleotides 713–715 (purple). The 30S subunit cryo-EM map is shown with a B factor of 20 Å2 applied. (B) Interaction between uS13 (salmon) and the A-site finger hairpin loop nucleotide C888 in the 50S subunit (purple). A B factor of 10 Å2 was applied to the head-focused map.
Figure 7 with 2 supplements
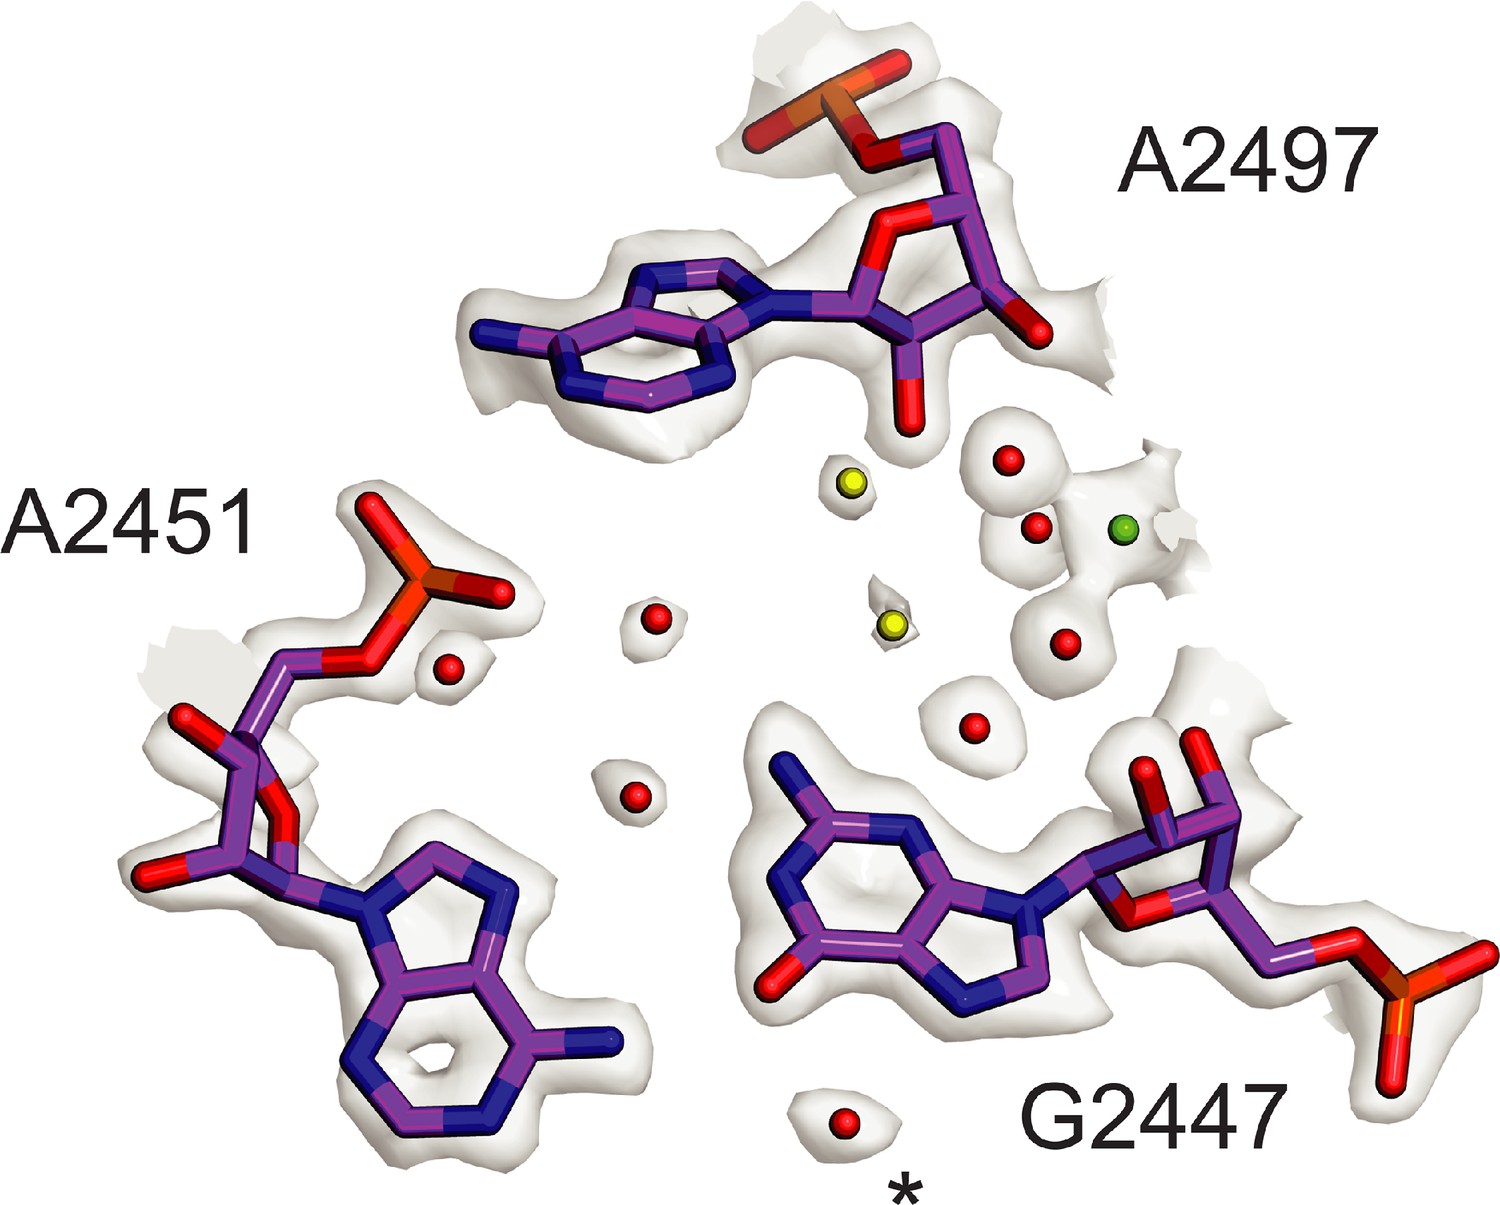
Conserved solvation in the PTC in the 50S ribosomal subunit.
Comparison of solvation in the PTC near E. coli nucleotide G2447 to that in phylogenetically diverse 50S subunits. Solvent molecules conserved in bacterial ribosomes from E. coli, S. aureus, and T. thermophilus (Halfon et al., 2019; Polikanov et al., 2015) and in the archaeal 50S subunit from H. marismortui (Schmeing et al., 2005) are colored red. Water molecules conserved in three of four structures are colored yellow. Mg2+ is shown in green. Asterisk (*) denotes density modeled as K+ in the H. marismortui 50S subunit structure.
Figure 7—figure supplement 1
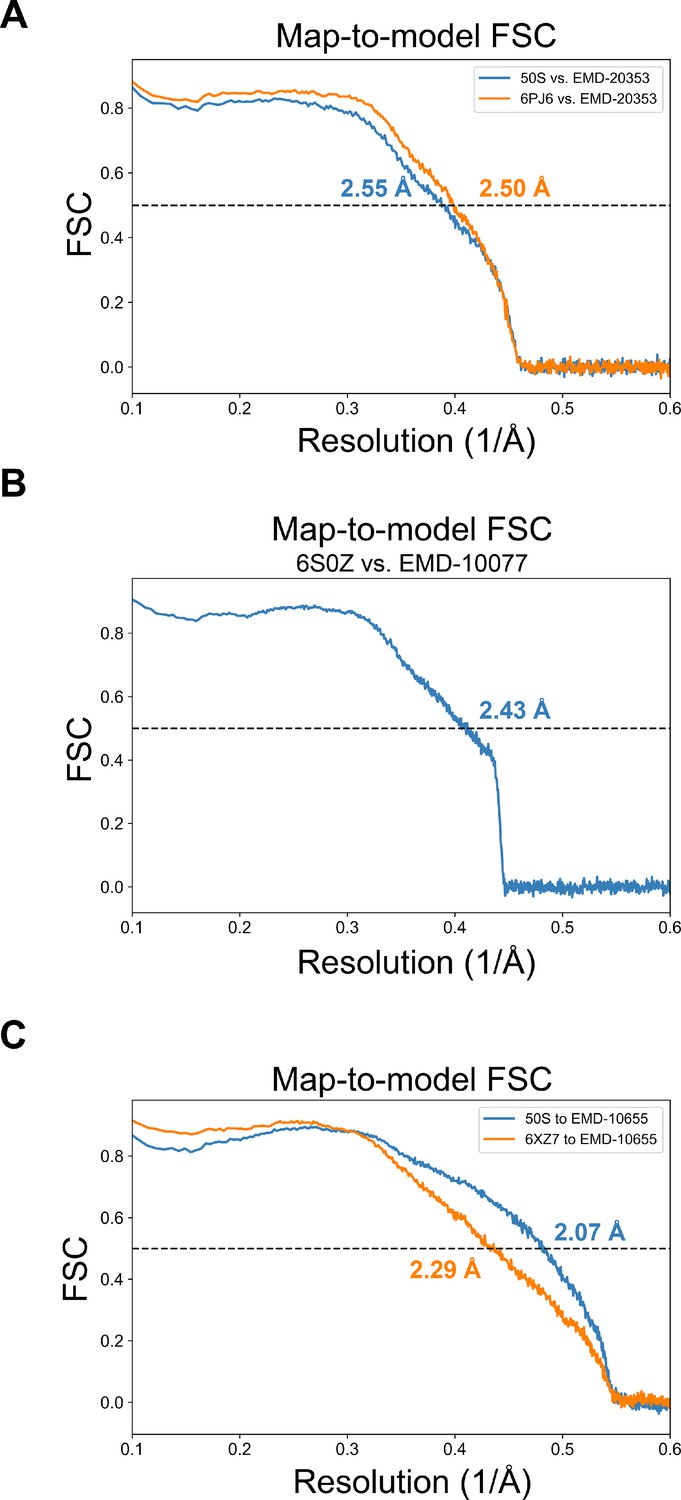
The map-to-model resolution estimates for deposited 50S subunit structures.
(A) The map-to-model FSC curves calculated with the map from Stojković et al., 2020 (EMD-20353) against the associated model (orange; PDB: 6PJ6) and the 50S model presented here (blue). (B) The map-to-model FSC curves calculated for the map and model from Halfon et al., 2019 (EMD-10077; PDB: 6S0Z). (C) The map-to-model FSC curves were calculated with the map from Pichkur et al., 2020 (EMD-10655) against the associated model (orange; PDB: 6XZ7) and the 50S model presented here (blue).
Figure 7—figure supplement 2
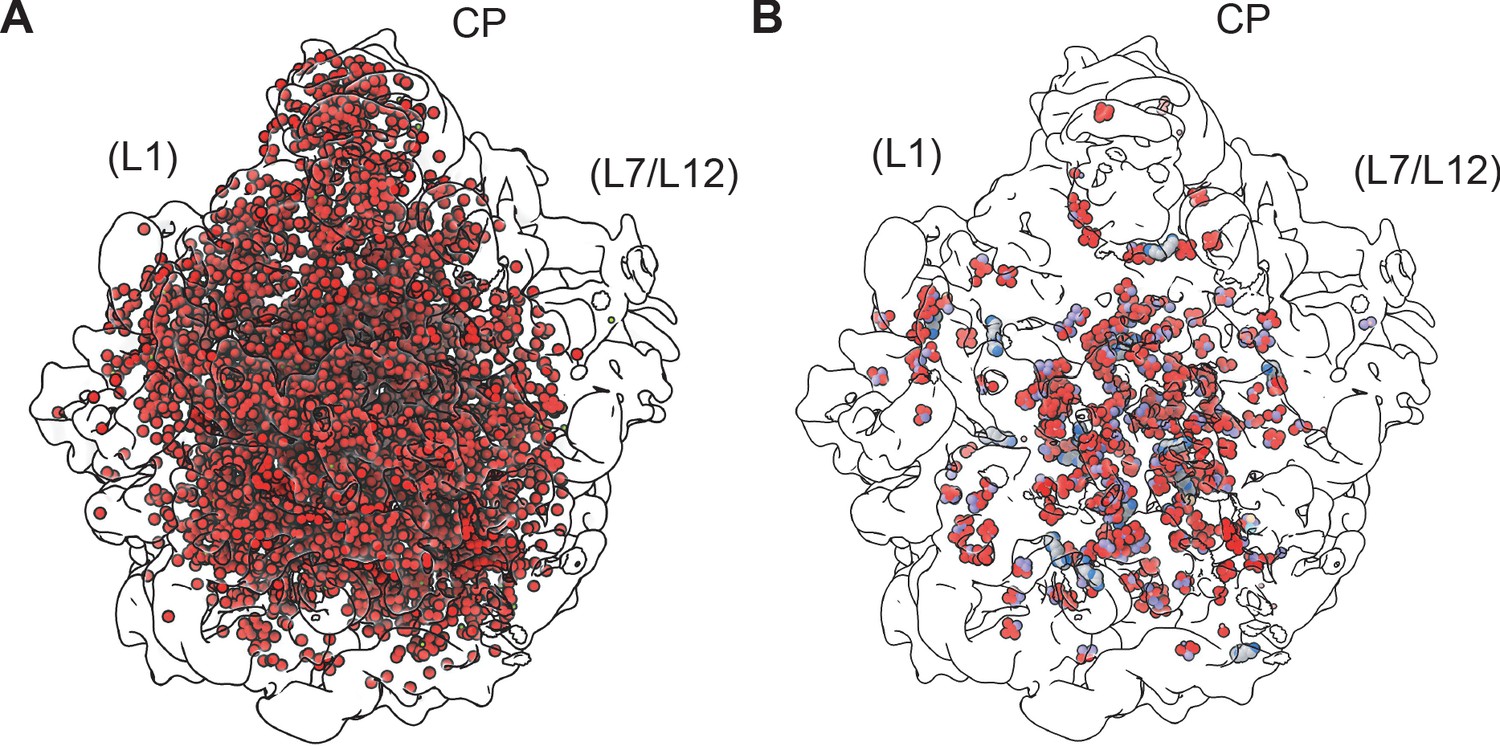
Solvation in the 50S ribosomal subunit.
(A) Water molecules modeled in the 50S subunit are shown as red spheres (oxygen atoms) in the outline of the map. The view is from the 30S subunit interface side, with approximate locations of uL1 and bL12 (disordered in the structure) shown. (B) Polyamine (gray carbons) and Mg2+ (green) sites in the 50S subunit, shown with metal-coordinating atoms (oxygen in red, nitrogen in blue, and carbons in violet, ivory, cyan). Cryo-EM density is shown with a low-pass filter of 8 Å.
Figure 8 with 2 supplements
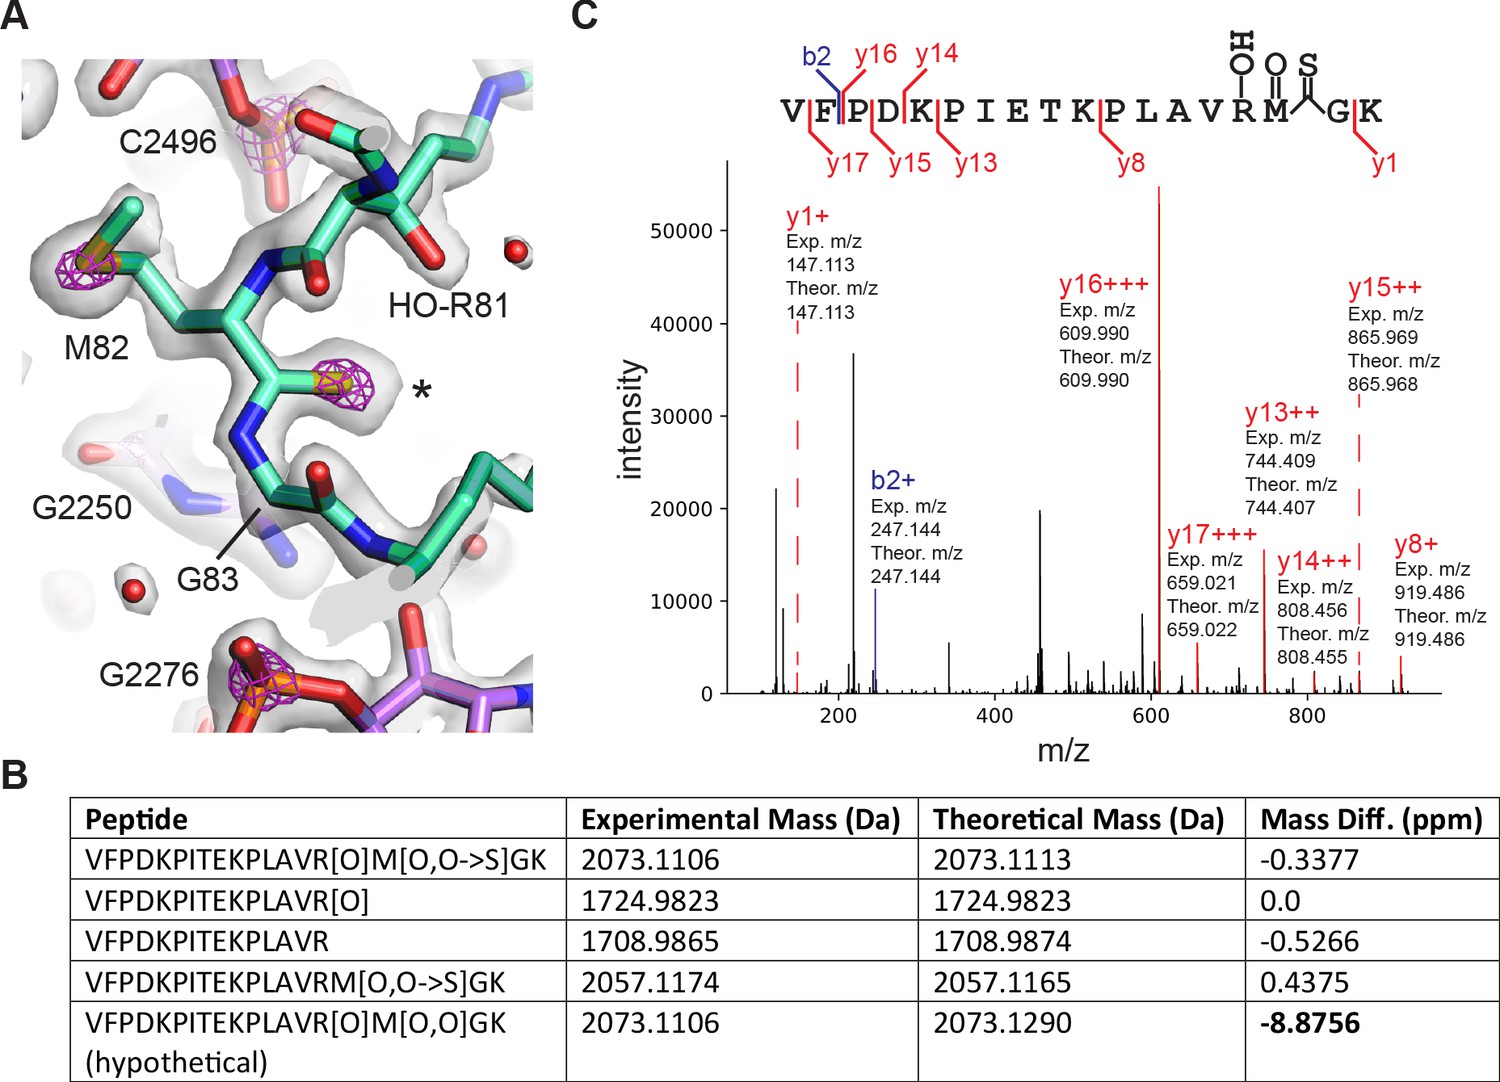
Thioamide modification in protein uL16.
(A) Structural model of thioamide between Met82 and Gly83 in uL16 (mint), with the 50S subunit cryo-EM density map contoured at two levels to highlight sulfur and phosphorus atoms. The lower contour level is shown as a gray surface and the higher contour level is shown as fuchsia mesh. 23S rRNA is shown in purple. Asterisk marks the position of the sulfur in the thiocarbonyl. (B) LC-MS/MS data supporting the presence of a thioamide bond between M82 and G83 of uL16 (Dai et al., 2017). Shown are selected uL16 peptides with designated modifications found in the spectral search and their associated experimental masses, theoretical masses, and mass differences. All peptides were found in multiple fractions and replicates of the experiment. The final row shows a hypothetical peptide identical to the first row, except carrying an oxidation modification instead of O to S replacement. (C) Annotated fragmentation spectra from the LC-MS/MS experiment showing a uL16 peptide with a thioamide bond. Peptide is assigned modifications of: oxidation on M, oxidation on R, and a thiopeptide between M and G. Fragmentation ions are annotated with experimental and theoretical m/z ratios.
Figure 8—figure supplement 1
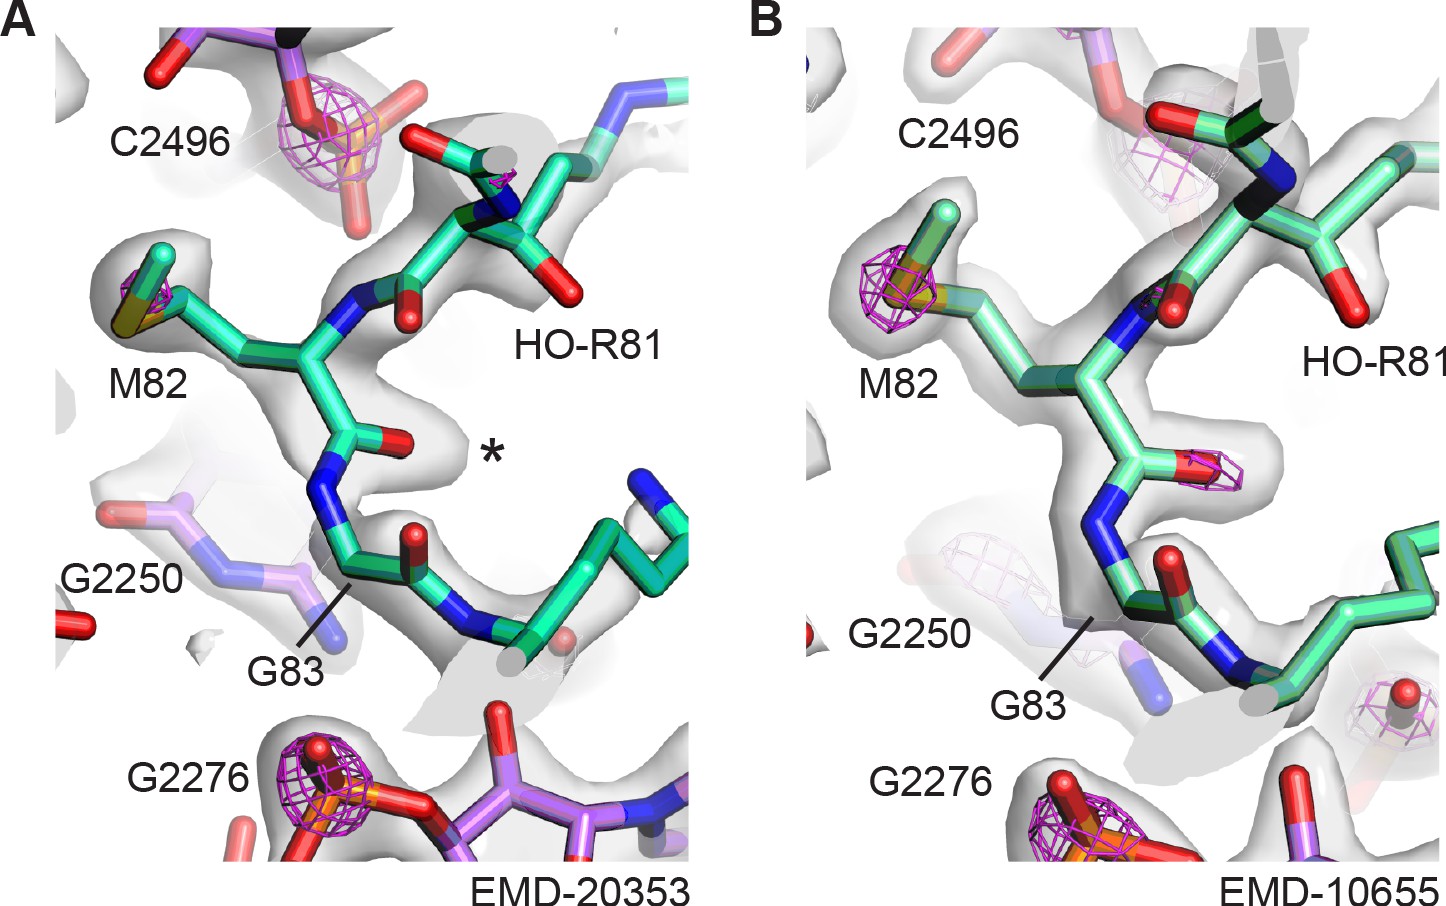
Thioamide density in other E. coli 50S ribosomal subunit cryo-EM reconstructions.
(A) Structural model of thioamide between Met82 and Gly83 in uL16 (mint), with the cryo-EM density of map EMD-20353 contoured at two levels to highlight sulfur and phosphorus atoms. The lower contour level is shown as a gray surface and the higher contour level is shown as fuchsia mesh. 23S rRNA is shown in purple. The asterisk highlights the position of the sulfur in the thioamide. (B) Structural model of thioamide between Met82 and Gly83 in uL16 (mint), with the cryo-EM density of map EMD-10655 contoured at two levels to highlight sulfur and phosphorus atoms, as in panel (A).
Figure 8—figure supplement 2
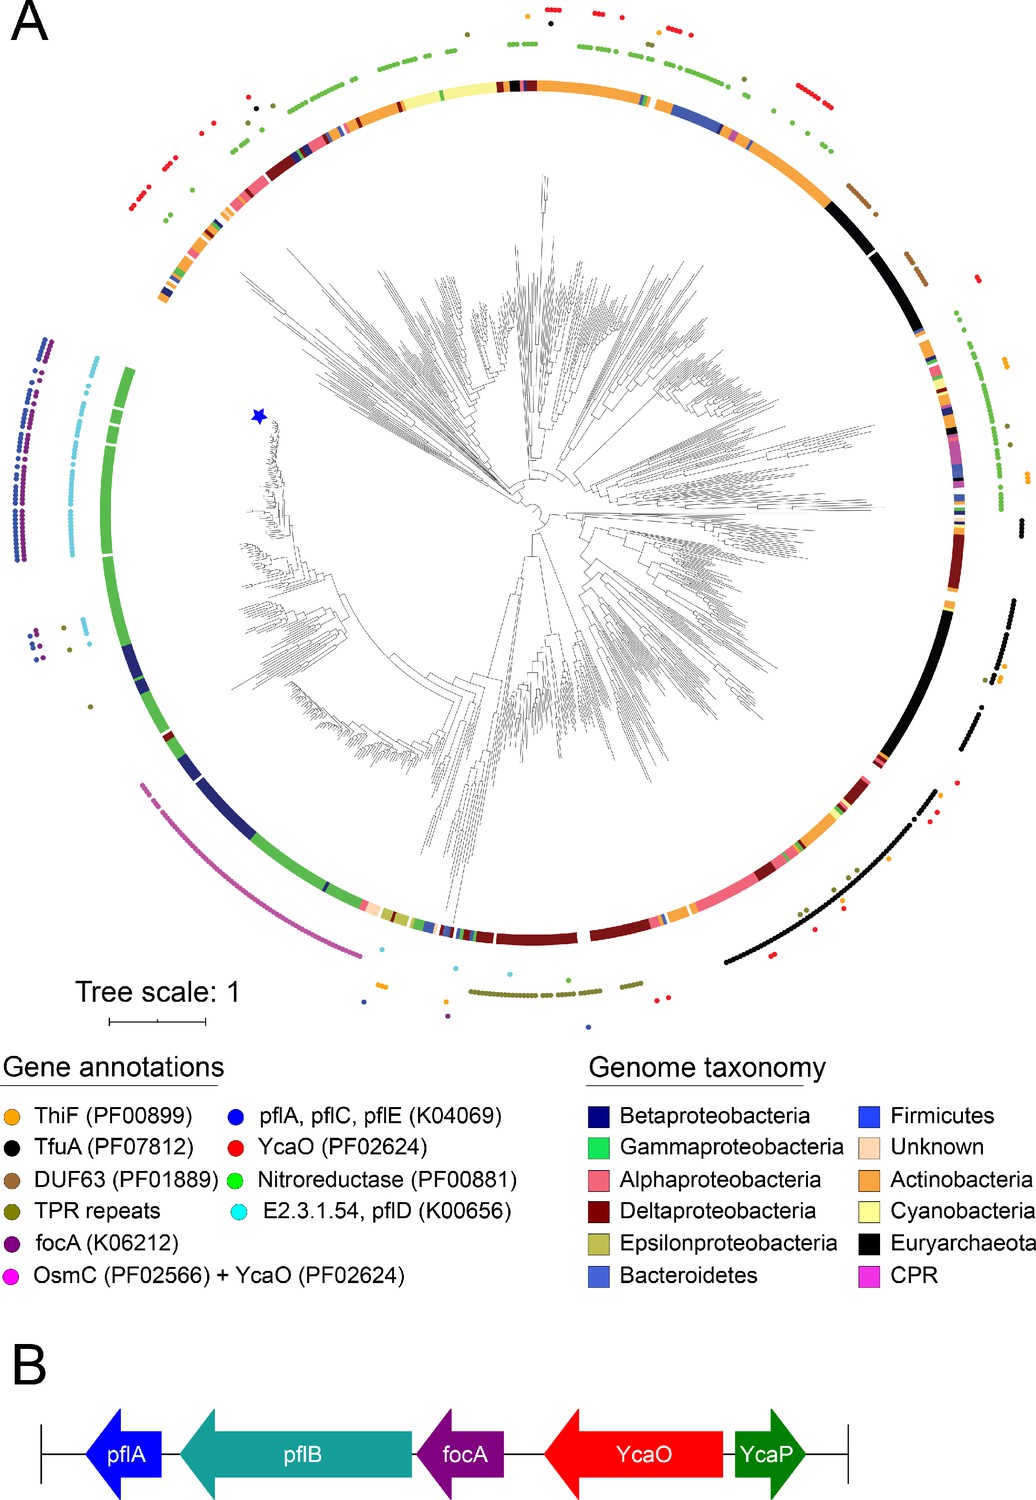
Phylogeny of YcaO family members.
(A) Phylogenetic tree of YcaO family members. The maximum likelihood tree was constructed under an LG+F+G4 model of evolution. Scale bar indicates the average substitutions per site. The inner circle shows the organismal distribution, while the outer circle shows neighboring gene patterns. Star indicates the location of E. coli str K-12 substr MG1655. (B) Genes neighboring YcaO in E. coli K-12 substr MG1655.
Tables
Table 1
Data collection and processing.
| Magnification | 109,160 |
| Voltage (kV) | 300 |
| Spherical aberration (mm) | 2.7 |
| Electron exposure (e–/Å2) | 39.89 |
| Defocus range (μm) | −0.6/−1.5 |
| Pixel size (Å) | 0.7118 |
| Symmetry imposed | C1 |
| Initial particle images (no.) | 874,943 |
| Final particle images (no.) | 307,495 |
| Map resolution (Å) | 2.02 |
| Map resolution with Ewald correction (Å) | 1.98 |
| FSC threshold (gold-standard) | 0.143 |
Table 2
Model resolutions for subunits and domains.
| Model | Without Ewald correction (Å) | Ewald sphere corrected (Å) | Map sharpening B factor for Ewald (Å2) |
|---|---|---|---|
| 30S subunit | 2.15 | 2.11 | −25.7 |
| 30S subunit head domain | 2.09 | 2.01 | −19.7 |
| 30S subunit platform | 2.12 | 2.08 | −21.8 |
| 50S subunit | 1.92 | 1.9 | −25.1 |
| 50S subunitcentral protuberance | 2.28 | 2.26 | −21.5 |
| 70S ribosome | 2.06 | 2.04 | −29.5 |
-
* Map-vs-model FSC with threshold = 0.5.
Table 3
Model refinement statistics.
| Model component | 70S ribosome | 30S subunit | 50S subunit |
|---|---|---|---|
| Model resolution, Ewald-corrected map (Å) | 2.04 | 2.11 | 1.9 |
| FSC threshold (map-vs.-model) | 0.5 | 0.5 | 0.5 |
| Map sharpening B factor (Å2) | −29.5 | −25.7 | −25.1 |
| Model composition | |||
| non-hydrogen atoms | 149356 | 54550 | 91592 |
| Mg2+ ions | 309 | 93 | 218 |
| Zn2+ ions | 2 | 0 | 2 |
| polyamines | 17 | 2 | 15 |
| waters | 7248 | 2413 | 4835 |
| ligands (paromomycin) | 1 | 1 | 0 |
| B factors (Å2) | |||
| RNA | 23.83 | 28.09 | 20.9 |
| protein | 24.42 | 28.91 | 20.95 |
| waters | 20.66 | 17.94 | 22.02 |
| other | 29.29 | 20.35 | 33.12 |
| R.m.s. deviations from ideal values | |||
| Bond (Å) | 0.006 | 0.005 | 0.006 |
| Angle (°) | 0.952 | 0.838 | 0.997 |
| Molprobity all-atom clash score | 7.34 | 7.12 | 7.02 |
| Ramachandran plot | |||
| Favored (%) | 96 | 95.66 | 96.26 |
| Allowed (%) | 3.87 | 4.17 | 3.65 |
| Outliers (%) | 0.13 | 0.17 | 0.1 |
| RNA validation | |||
| Angles outliers (%) | 0.02 | 0.009 | 0.02 |
| Sugar pucker outliers (%) | 0.46 | 0.39 | 0.39 |
| Average suiteness | 0.579 | 0.586 | 0.583 |
Key resources table
| Reagent type (species) or resource | Designation | Source or reference | Identifiers | Additional information |
|---|---|---|---|---|
| Strain, strain background (species) | Escherichia coli (MRE600) | Gift of Arto Pulk, UC Berkeley | ATCC #29417, NCTC #8164 | Strain with low ribonuclease activity |
| Other | 300 mesh R1.2/1.3 UltraAuFoil grids | Electron Microscopy Sciences | Q350AR13A | |
| Software, algorithm | SerialEM | Schorb et al., 2019 | RRID:SCR_017293 | |
| Software, algorithm | MotionCor2 | Zheng et al., 2017 | RRID:SCR_016499 | |
| Software, algorithm | CTFFind4 | Rohou and Grigorieff, 2015 | RRID:SCR_016732 | |
| Software, algorithm | RELION | Zivanov et al., 2018 | Version 3 and 3.1 RRID:SCR_016274 | |
| Software, algorithm | Cryosparc | Punjani et al., 2017 | Version 2 RRID:SCR_016501 | |
| Software, algorithm | Chimera | Pettersen et al., 2004 | RRID:SCR_004097 | |
| Software, algorithm | PHENIX | Liebschner et al., 2019 | RRID:SCR_014224 | |
| Software, algorithm | Coot | Casañal et al., 2020 | RRID:SCR_014222 |
Additional files
-
Supplementary file 1
Phages encoding S21 homologs.
Tabs include phages encoding S21 homologs with predicted bacterial hosts, along with ribosome binding sites for the phages, Betaproteobacteria, Firmicutes, CPR bacteria, Spirochaetes, and Bacteroidetes.
- https://cdn.elifesciences.org/articles/60482/elife-60482-supp1-v2.xlsx
-
Supplementary file 2
Phylogenetic analysis of rRNA contacts near the uS11 isoAsp residue.
Tabs include 16S base pair statistics for prokaryotes, bacteria, archaea, 16S rRNA genome information for prokaryotes, 18S base pair statistics for eukaryotes, 18S rRNA genome information for eukaryotes, and nucleotide statistics for position 718. All 16S rRNA base pairs and position 718 are with E. coli numbering. 18S rRNA base pairs are with S. cerevisiae numbering.
- https://cdn.elifesciences.org/articles/60482/elife-60482-supp2-v2.xlsx
-
Transparent reporting form
- https://cdn.elifesciences.org/articles/60482/elife-60482-transrepform-v2.docx
Download links
A two-part list of links to download the article, or parts of the article, in various formats.
Downloads (link to download the article as PDF)
Open citations (links to open the citations from this article in various online reference manager services)
Cite this article (links to download the citations from this article in formats compatible with various reference manager tools)
Structure of the bacterial ribosome at 2 Å resolution
eLife 9:e60482.
https://doi.org/10.7554/eLife.60482


