Differential occupational risks to healthcare workers from SARS-CoV-2 observed during a prospective observational study
- Big Data Institute, Nuffield Department of Population Health, University of Oxford, United Kingdom
- Oxford University Hospitals NHS Foundation Trust, United Kingdom
- NIHR Oxford Biomedical Research Centre, University of Oxford, United Kingdom
- NIHR Health Protection Research Unit in Healthcare Associated Infections and Antimicrobial Resistance at University of Oxford in partnership with Public Health England, United Kingdom
- Nuffield Department of Medicine, University of Oxford, United Kingdom
- Target Discovery Institute, University of Oxford, United Kingdom
- Nuffield Department of Clinical Neurosciences, University of Oxford, United Kingdom
- Radcliffe Department of Medicine, University of Oxford, United Kingdom
- Kennedy Institute of Rheumatology Research, University of Oxford, United Kingdom
- Oxford University Clinical Research Unit, Viet Nam
Figures
Figure 1

Epidemiological curve for hospital inpatients (panel A) and staff (panel B) diagnosed with Covid-19, by week and timing of asymptomatic staff testing (panel C).
Each patient admitted to hospital with a diagnosis of Covid-19 within ±7 days of any day during their admission is plotted based on the date of their positive PCR test. Testing for symptomatic staff was made available from 27th March 2020; staff were asked to attend on days 2–4 of symptoms and are plotted in the week of their positive test. Of 1128 staff positive by PCR or serology at the asymptomatic staff clinic, 192 had been previously diagnosed at the symptomatic staff clinic. Of the remaining 936 positive staff, 449 (48%) reported a date when they believed a Covid-19 illness had begun, these are plotted in yellow above, many with symptoms before the availability of staff testing. As 487 (52%) of staff did not provide a date of symptom onset the true values for the yellow bars on the y-axis are likely to be around two times higher. Panel C shows the week asymptomatic staff were tested, those testing SARS-CoV-2 PCR-positive and/or IgG-positive are shown in black and those with negative tests in grey. The overall percentage of staff tested each week with positive PCR and/or antibody results is shown above each bar. The bar for 01 June also includes 31 staff tested on 08 June.
Figure 2
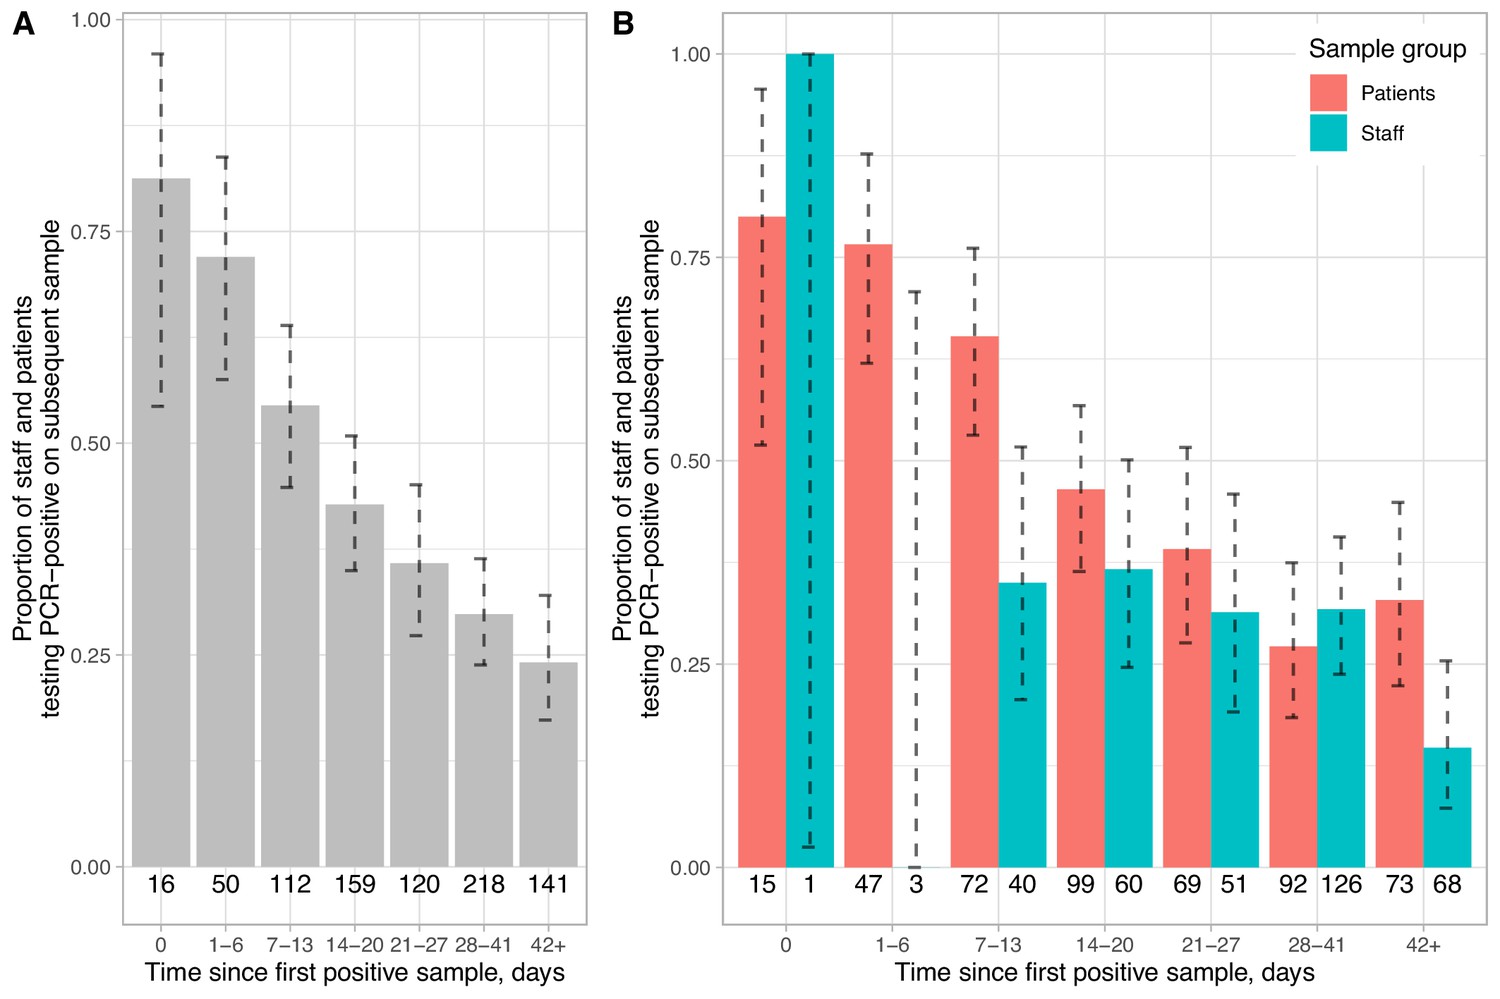
Proportion of staff and patients remaining PCR-positive on repeat nasopharyngeal swabs.
Panel A shows pooled data and Panel B data separately for staff and patients. The number of individuals with a repeat test in each time interval is shown below each bar and 95% exact binomial confidence intervals are plotted. All tests following a first positive sample are included up until the first negative sample per patient. The number of tests positive after a repeat swab on the same day is indicative of the sensitivity of a single swab, 15/16 of these swabs were obtained from patients on wards by any available staff member, whereas staff sampling was undertaken by specially trained teams.
Figure 3
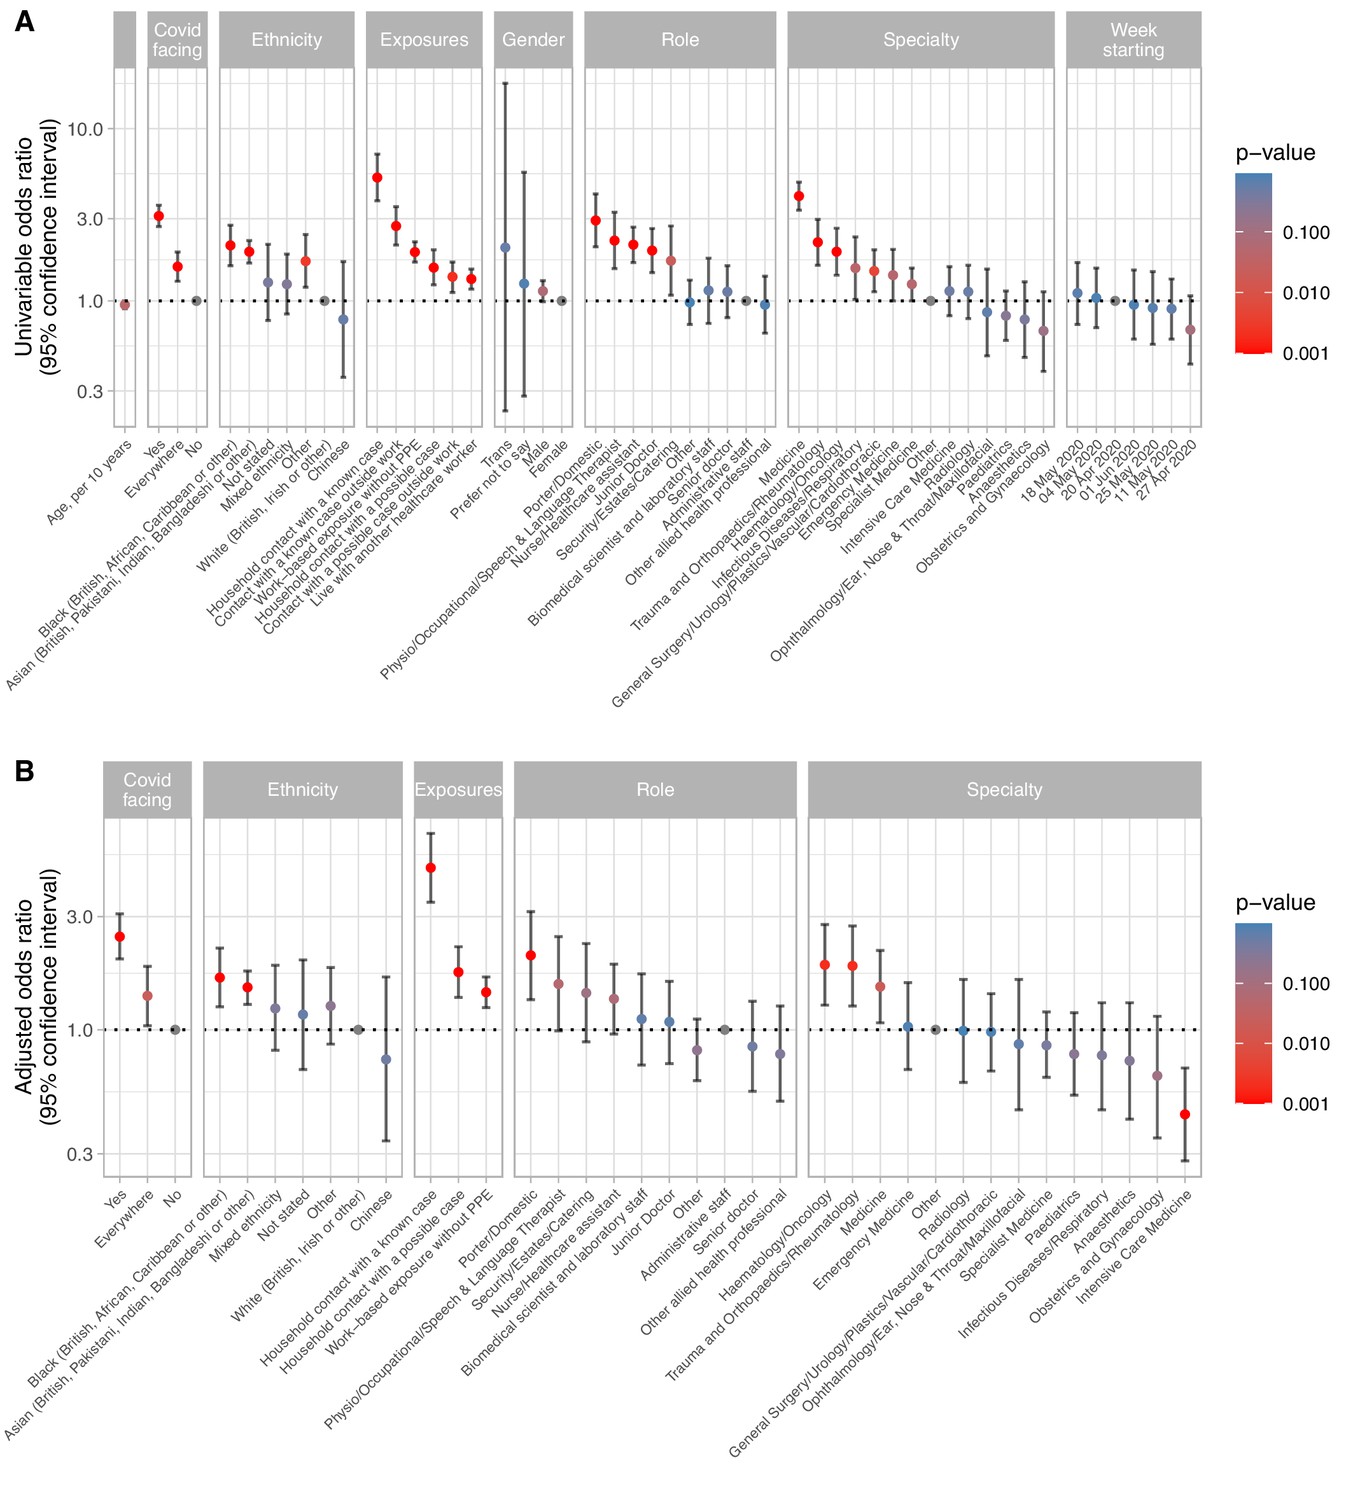
Univariable (panel A) and multivariable (panel B) relationships between risk factors and staff infection with SARS-CoV-2 in 10,032 healthcare workers.
See Supplementary file 1B for count data, univariable and multivariable odds ratios. Pairwise interactions were sought between all variables the multivariable model, a single interaction exceeded the p<0.01 screening threshold, representing decreased risk of Covid-19 in emergency department staff reporting exposure to a Covid-19 without PPE (p=0.002). However, given the large number of interactions sought and biological implausibility, the interaction is omitted from the model presented. For the purpose of plotting p values <0.001 were rounded up to 0.001. Risk factor data were not available for two staff members. In panel A, the category for 01 June also includes 31 staff tested on 08 June.
Figure 4
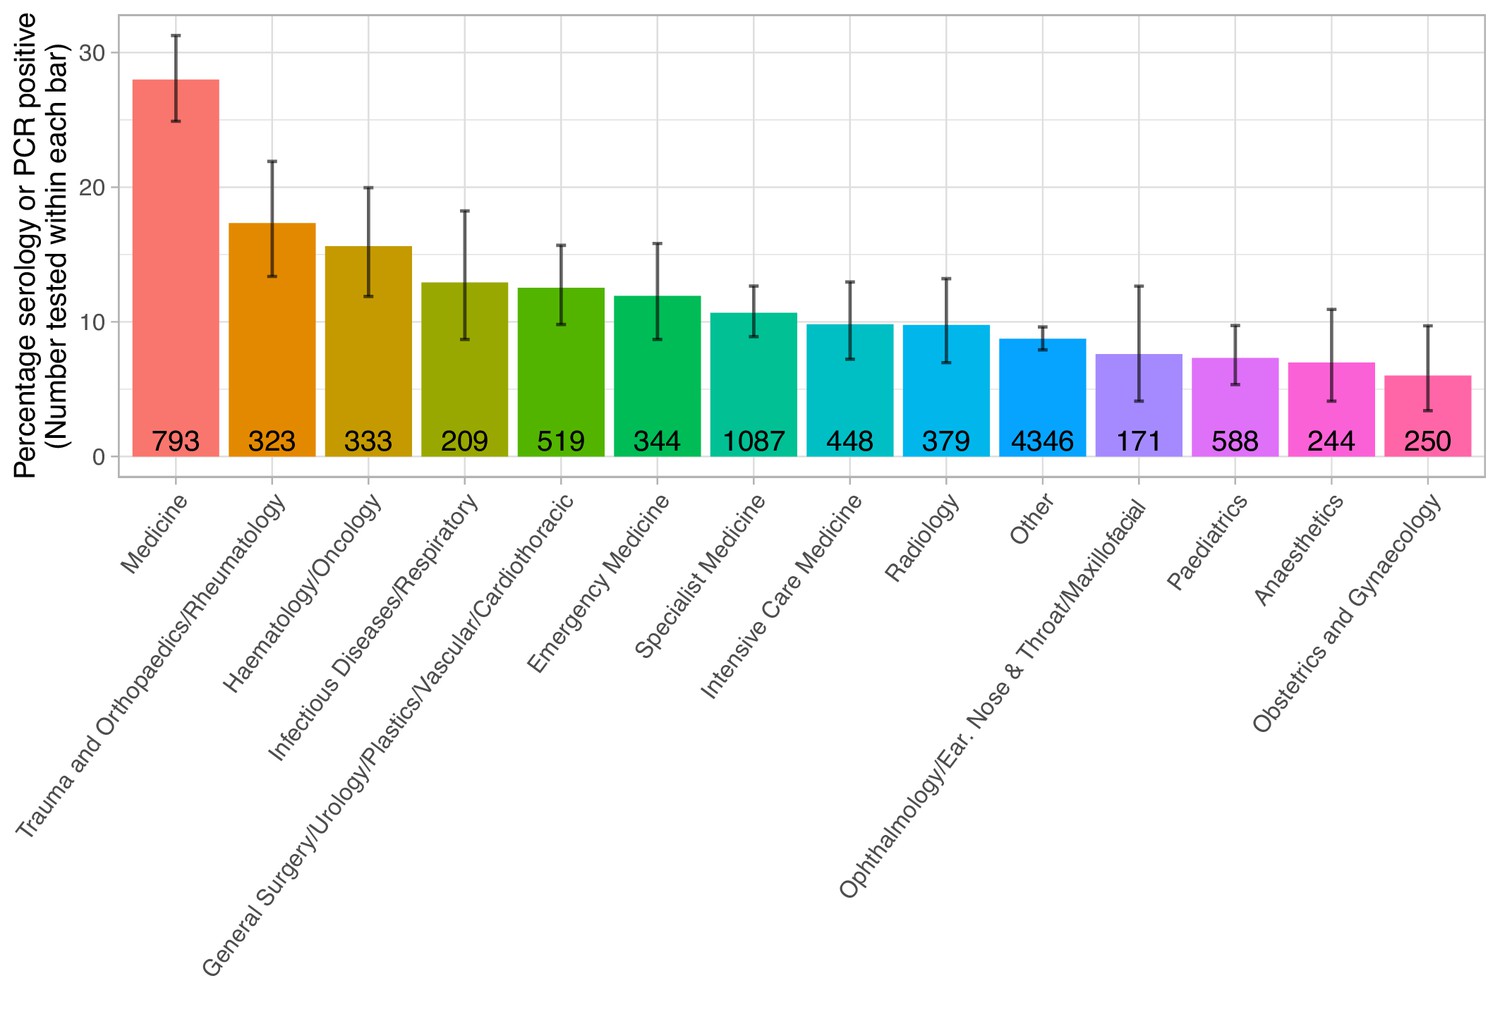
Proportion of staff testing positive by specialty area.
The number of staff tested within each speciality is shown within each bar. The error bar indicates the 95% confidence interval. The ‘Other’ group includes staff members without a self-reported specialty. Staff working in a specialty area are predominantly nurses, healthcare assistances, doctors and therapists.
Figure 5
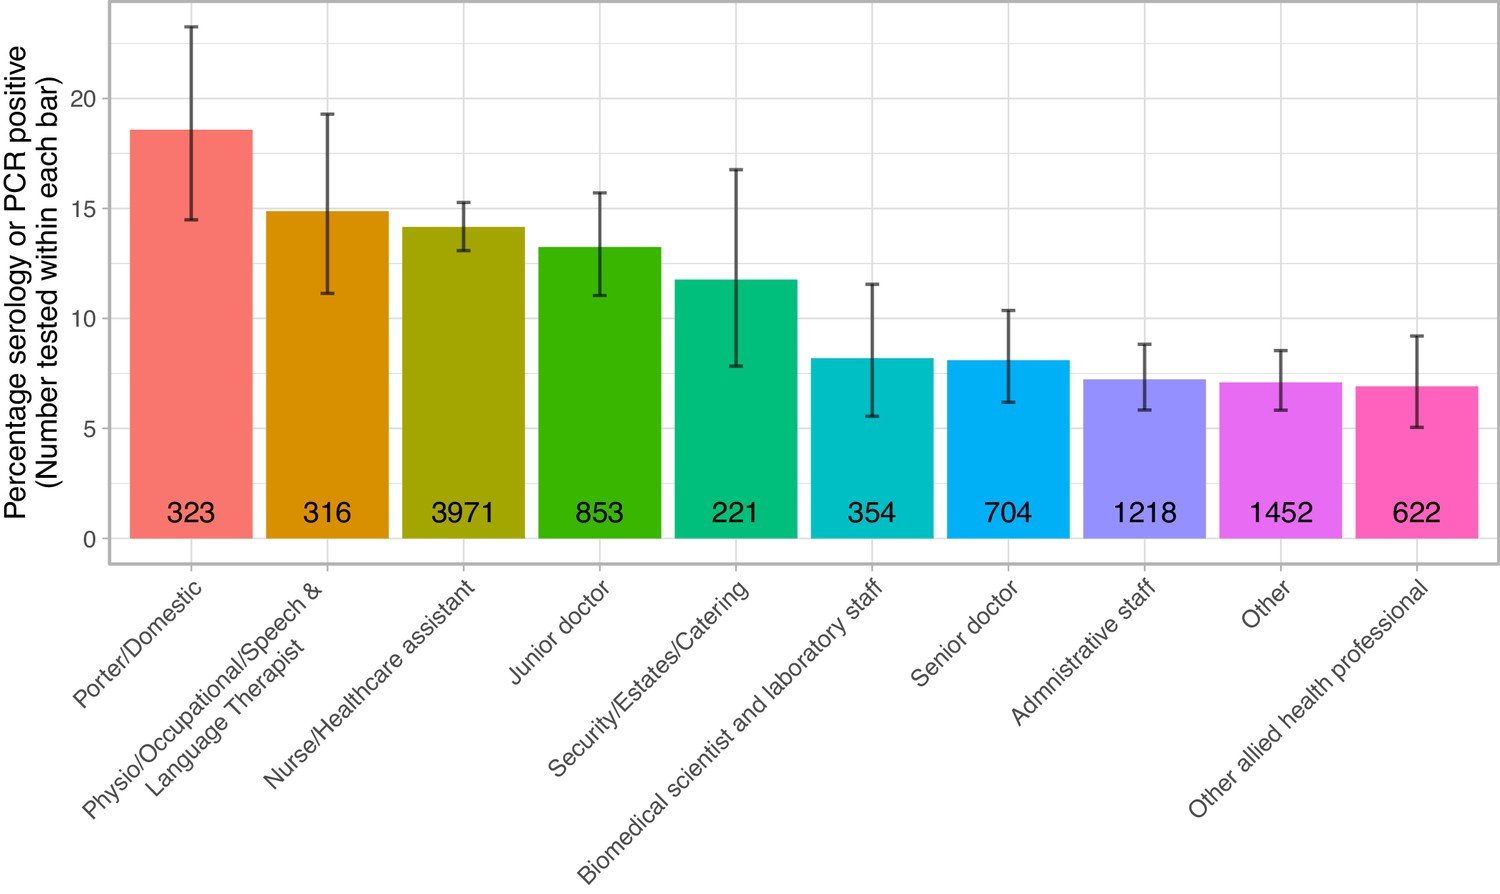
Proportion of staff testing positive by role.
The number of staff tested within each role is shown within each bar. The error bar indicates the 95% confidence interval.
Figure 6

Relationship between age and Covid-19 infection in hospital staff.
Panel A shows a histogram of staff ages for those attending asymptomatic screening, staff with a positive SARS-CoV-2 IgG antibody and/or PCR test at their first asymptomatic clinic attendance as shown in blue and those who were both PCR and antibody negative are shown in red. Panel B shows the univariable modelled percentage of staff positive by age, the solid line shows the expected value and the ribbon the 95% confidence interval.
Figure 7
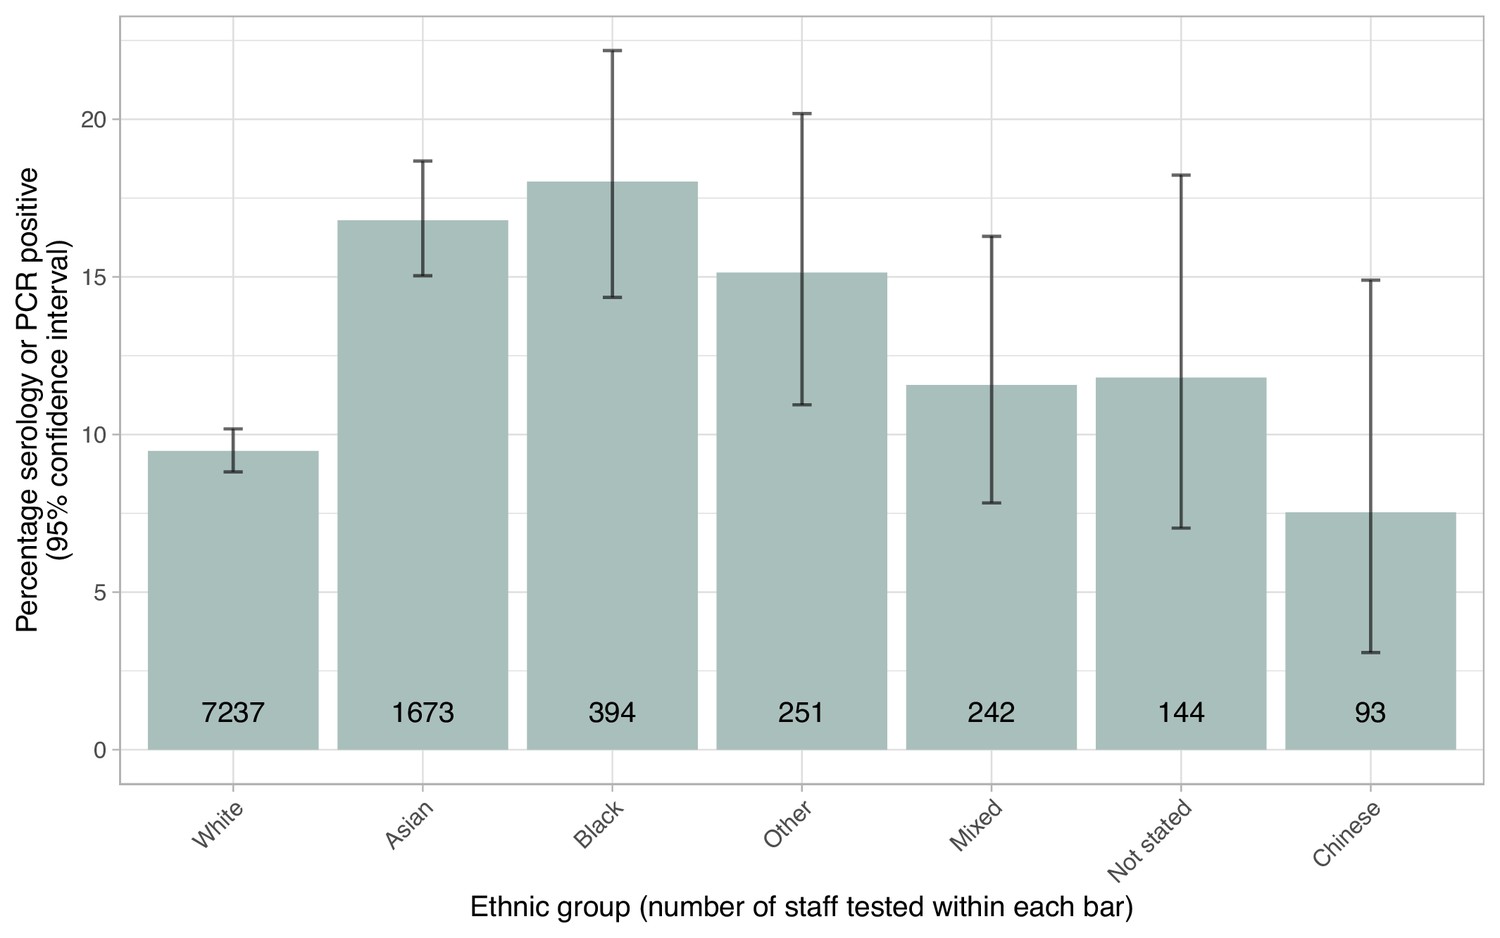
Proportion of staff testing positive by self-described ethnicity.
The number of staff tested within each group is shown within each bar. The error bar indicates the 95% confidence interval.
Figure 8
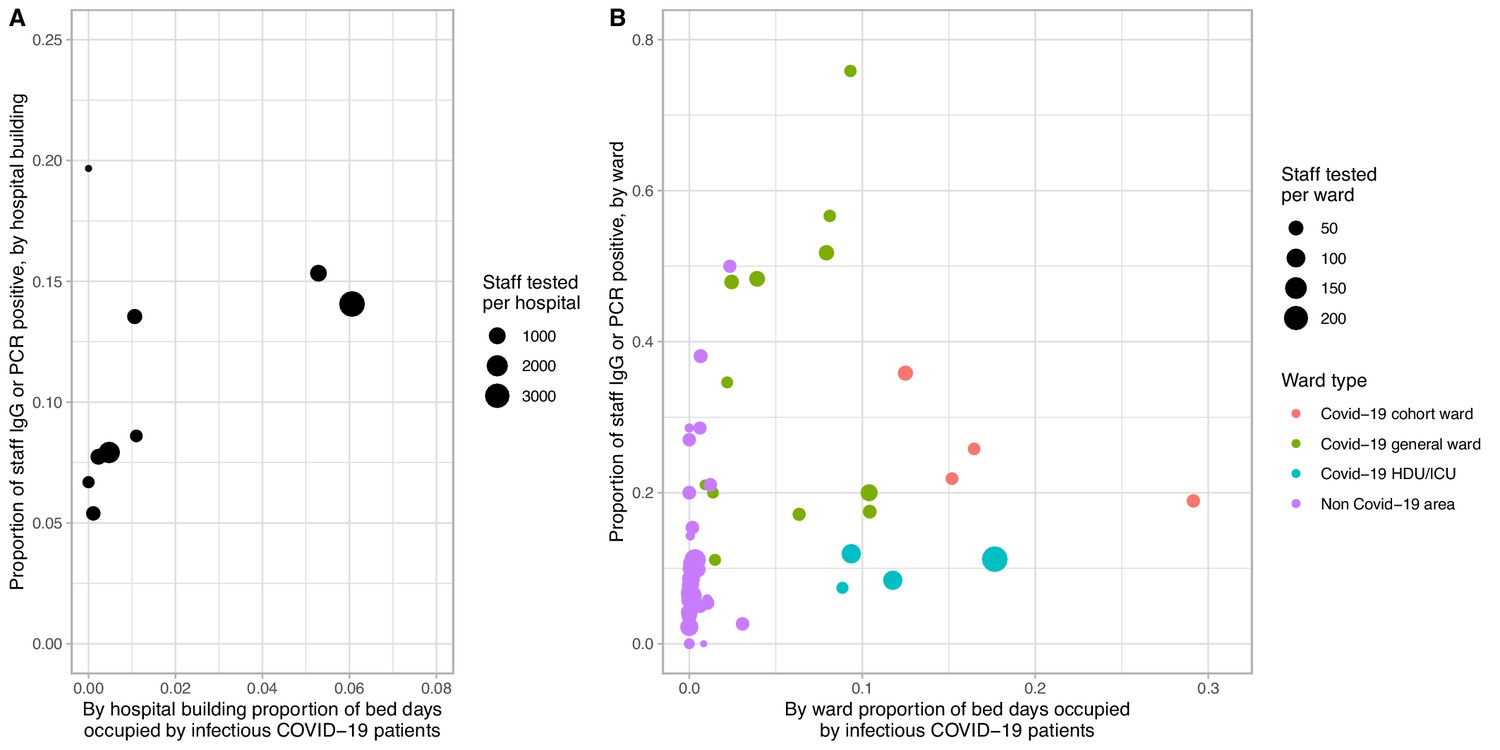
Proportion of staff infected by extent of Covid-19 infectious pressure from patients, by eight hospital buildings across four hospitals (panel A) and by ward (panel B).
Covid-19 infectious pressure was calculated by considering each patient infectious from −2 to +7 days around the date of their first positive SARS-CoV-2 PCR test. Only staff working in a single hospital or ward are included in the plot. Wards with fewer than 10 staff tested are not plotted. Covid-19 cohort wards admitted only patients with suspected or known Covid-19, whereas Covid-19 general wards were acute medical wards receiving new admissions and acute medical patients initially believed not to have Covid-19. Non Covid-19 areas did not admit suspected Covid-19 patients and any suspected or confirmed Covid-19 patients were transferred off these wards as soon as possible.
Tables
Table 1
Association of self-reported symptoms and Covid-19 in hospital staff.
| Symptom | Symptom reported | Symptom not reported | Univariable | Multivariable | ||||||||
|---|---|---|---|---|---|---|---|---|---|---|---|---|
| n | Covid-19 positive | Covid-19 negative | % positive | N | Covid-19 positive | Covid-19 negative | % positive | Or (95% CI) | P value | Or (95% CI) | P value | |
| Anosmia or loss of taste | 858 | 489 | 369 | 57.0 | 9174 | 637 | 8537 | 6.9 | 17.7 (15.1–20.8) | <0.001 | 17.7 (14.1–22.2) | <0.001 |
| Myalgia | 1796 | 501 | 1295 | 27.9 | 8236 | 625 | 7611 | 7.6 | 4.7 (4.1–5.4) | <0.001 | 2.1 (1.7–2.6) | <0.001 |
| Fever | 1465 | 406 | 1059 | 27.7 | 8567 | 720 | 7847 | 8.4 | 4.2 (3.6–4.8) | <0.001 | 1.5 (1.2–1.8) | <0.001 |
| Nausea or vomiting | 417 | 130 | 287 | 31.2 | 9615 | 996 | 8619 | 10.4 | 3.9 (3.1–4.9) | <0.001 | 1.2 (0.9–1.6) | 0.18 |
| Fatigue | 2718 | 591 | 2127 | 21.7 | 7314 | 535 | 6779 | 7.3 | 3.5 (3.1–4) | <0.001 | 1.0 (0.8–1.2) | 0.81 |
| Cough | 1813 | 403 | 1410 | 22.2 | 8219 | 723 | 7496 | 8.8 | 3 (2.6–3.4) | <0.001 | 1.2 (1.0–1.5) | 0.04 |
| Shortness of breath | 1022 | 245 | 777 | 24.0 | 9010 | 881 | 8129 | 9.8 | 2.9 (2.5–3.4) | <0.001 | 1.2 (0.9–1.5) | 0.30 |
| Diarrhoea | 607 | 147 | 460 | 24.2 | 9425 | 979 | 8446 | 10.4 | 2.8 (2.2–3.4) | <0.001 | 1.1 (0.9–1.5) | 0.30 |
| Hoarseness | 645 | 136 | 509 | 21.1 | 9387 | 990 | 8397 | 10.5 | 2.3 (1.8–2.8) | <0.001 | 1.2 (0.9–1.7) | 0.23 |
| Nasal congestion | 1871 | 355 | 1516 | 19.0 | 8161 | 771 | 7390 | 9.4 | 2.2 (2–2.6) | <0.001 | 1.0 (0.8–1.2) | 0.63 |
| Sore throat | 2248 | 356 | 1892 | 15.8 | 7784 | 770 | 7014 | 9.9 | 1.7 (1.5–2) | <0.001 | 0.6 (0.5–0.8) | <0.001 |
| *Hoarseness + Anosmia or loss of taste | 0.5 (0.3–0.8) | 0.002 | ||||||||||
| *Shortness of breath + Anosmia or loss of taste | 0.5 (0.3–0.7) | <0.001 | ||||||||||
-
*All interactions with an interaction Wald p values < 0.01 are shown.
Table 2
Local recommendations for PPE and testing, based on contemporaneous national Public Health England guidance.
| PPE | Testing | |
|---|---|---|
| Until 25th February 2020 | Full length gown, gloves, correctly fitted FFP3 mask and full face visor (level-2 PPE) Side room isolation | Clinical syndrome with relevant travel history |
| 25th February | As above for suspected cases with travel history For severe community acquired pneumonia without travel history: gown/apron, gloves, and fluid repellent mask (FFP3 for aerosol generating procedures); no need to isolate pending test | Clinical syndrome with relevant travel history Severe community acquired pneumonia |
| 8th March | Fluid resistant surgical masks, gloves, apron and optional eye protection for symptomatic but unconfirmed inpatients (level-1 PPE). Eye protection to be worn if risk of eye contamination. Full level-2 PPE for confirmed cases and Aerosol Generating Procedures (AGPs). | Clinical syndrome with relevant travel history Severe community acquired pneumonia |
| 13th March | Fluid resistant surgical masks, gloves, apron and risk assessment for eye protection for suspected and confirmed Covid-19 inpatients (level-1 PPE) Surgical masks on entry to Covid-19 cohort wards Apron, gloves and FFP3 mask on intensive care FFP3 mask, disposable gown, eye protection and gloves for AGPs | Any respiratory illness requiring admission to hospital and either radiological evidence of pneumonia or ARDS or influenza-like illness with fever > 37.8C |
| 14-16th March | As above All suspected Covid-19 patients admitted directly via acute medicine (bypassing the emergency department) | Any influenza like illness |
| 1st April | Universal minimum level-1 PPE across all wards Level-2 PPE for AGPs as above | |
| 6th April | AGPs: gloves, disposable gown, FFP3 mask, eye protection Working in higher risk area (ICU/High Dependency Unit) with confirmed cases: gloves, apron, gown, FFP3 mask and eye protection Level-1 PPE elsewhere | Diagnosis based on either positive swab or ‘Covid-19 syndrome’ (influenza like illness and compatible radiology and no alternative explanation) |
| 24th April | Universal admission testing for all patients irrespective of clinical syndrome |
Additional files
-
Supplementary file 1
Tables.
(A) Comparison of serology results by two methods, the Abbott Architect i2000 and Target Discovery Institute ELISA. (B) Univariable and multivariable relationships between risk factors and staff infection with SARS-CoV-2 in 10,032 healthcare workers. (C) Multivariable relationships between risk factors and SARS-CoV-2 IgG positivity in 9956 healthcare workers. (D) Multivariable linear regression, relationship between the percentage of staff with Covid-19 and ward-based Covid-19 pressure and ward type. (E) Rates of self-reported exposure without PPE by staff specialty.
- https://cdn.elifesciences.org/articles/60675/elife-60675-supp1-v2.docx
-
Transparent reporting form
- https://cdn.elifesciences.org/articles/60675/elife-60675-transrepform-v2.docx
Download links
A two-part list of links to download the article, or parts of the article, in various formats.
Downloads (link to download the article as PDF)
Open citations (links to open the citations from this article in various online reference manager services)
Cite this article (links to download the citations from this article in formats compatible with various reference manager tools)
Differential occupational risks to healthcare workers from SARS-CoV-2 observed during a prospective observational study
eLife 9:e60675.
https://doi.org/10.7554/eLife.60675


