Mendelian randomization analysis provides causality of smoking on the expression of ACE2, a putative SARS-CoV-2 receptor
- Biomedical Research Center, Zhejiang Provincial Key Laboratory of Laparoscopic Technology, Sir Run Run Shaw Hospital, School of Medicine, Zhejiang University, China
- Department of Environmental Genomics, Jiangsu Key Laboratory of Cancer Biomarkers, Prevention and Treatment, Collaborative Innovation Center for Cancer Personalized Medicine, School of Public Health, Nanjing Medical University, China
- Institute of Drug Metabolism and Pharmaceutical Analysis, Zhejiang Province Key Laboratory of Anti-Cancer Drug Research, Zhejiang University, China
- Department of Clinical Neuroscience, Center for Molecular Medicine, Karolinska Institute, Sweden
Figures
Figure 1
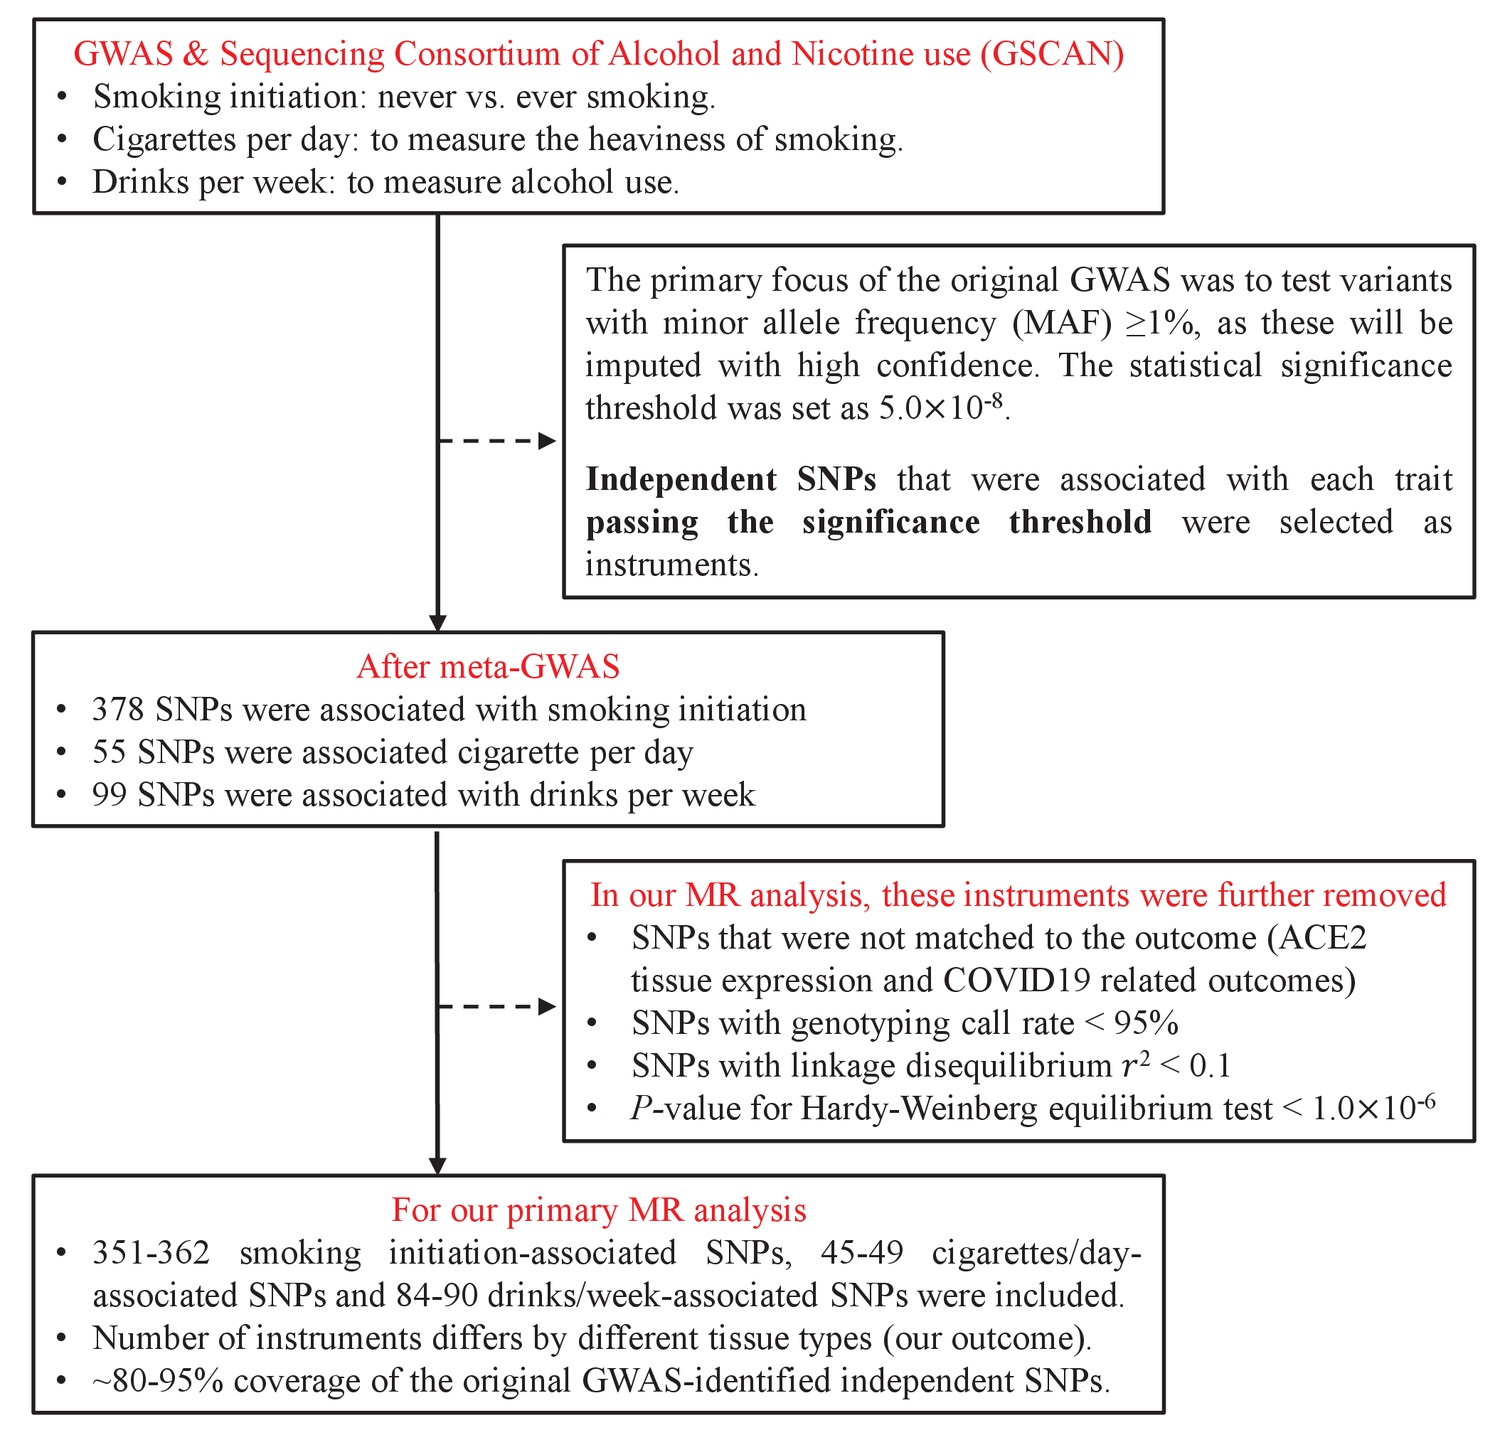
Flowchart on the selection of instrumental variables.
Appendix 1—figure 1
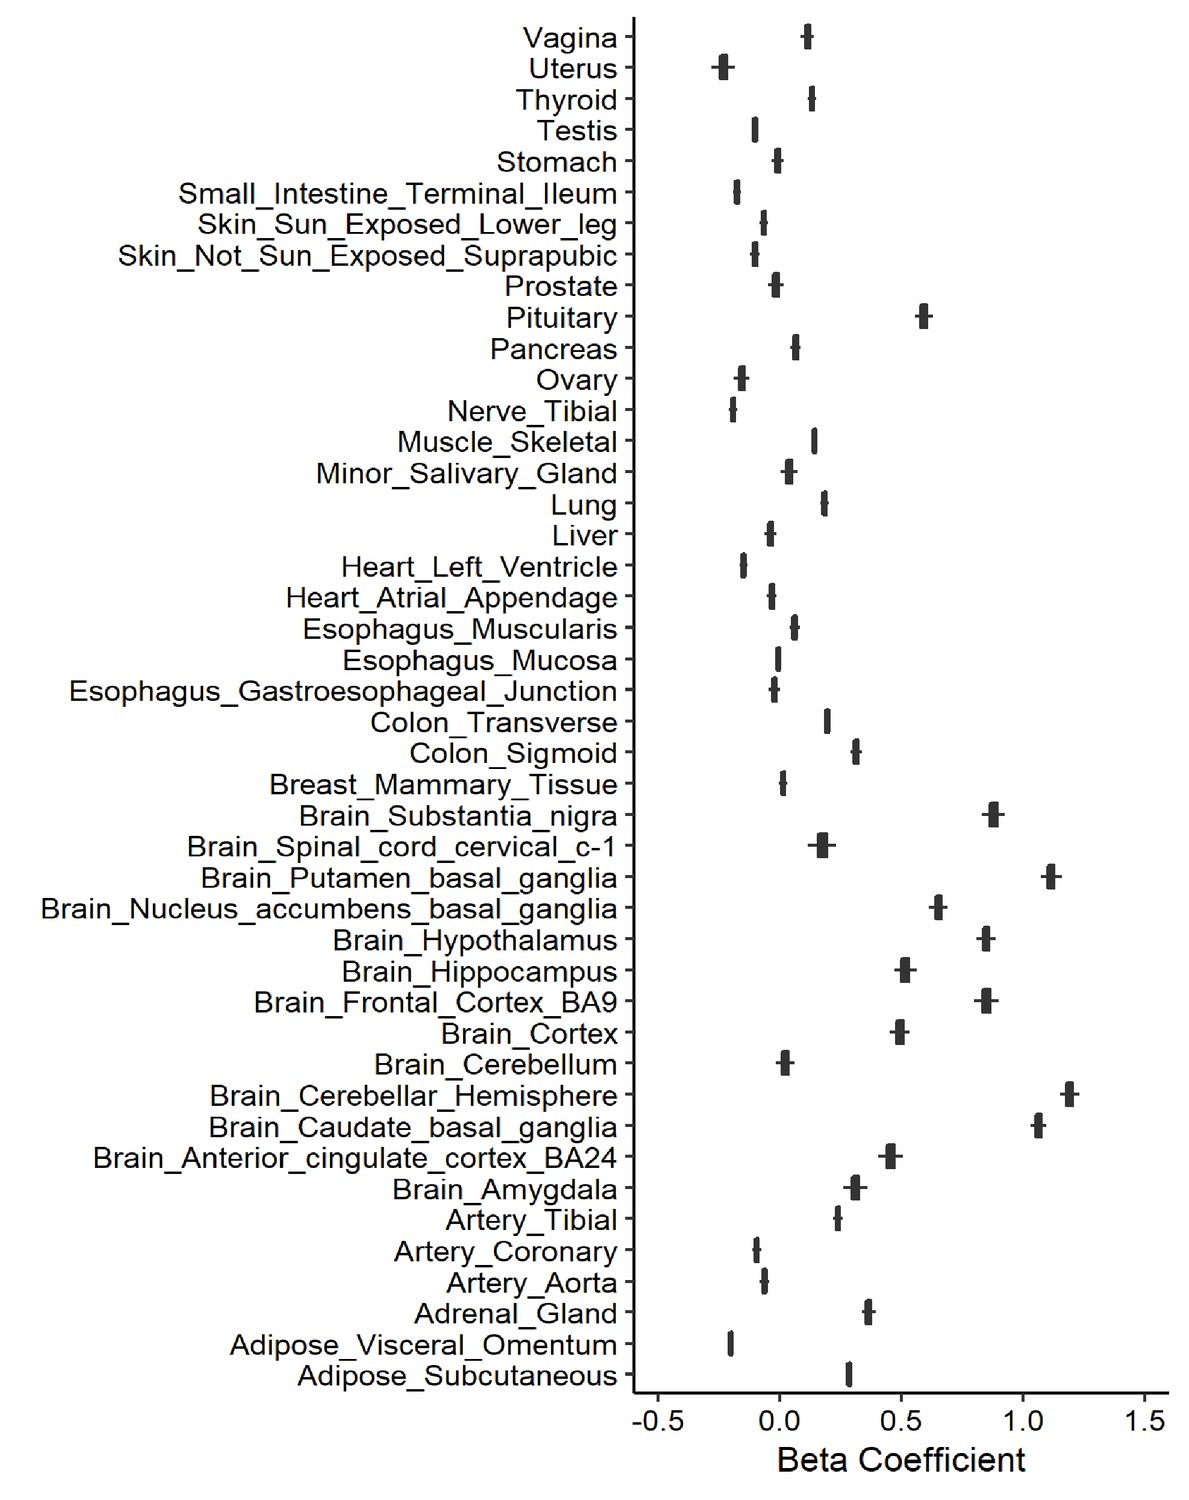
Leave-one-out analysis of causal association of smoking initiation with angiotensin-converting enzyme 2 (ACE2) expression.
Each boxplot represents the centralized tendency of effect sizes (beta coefficients) of smoking initiation on tissue-specific ACE2 expression based on the results of leave-one-out analysis where we excluded one single nucleotide polymorphism (SNP) at a time and performed inverse-variance weighted (IVW) using the remaining SNPs.
Appendix 1—figure 2
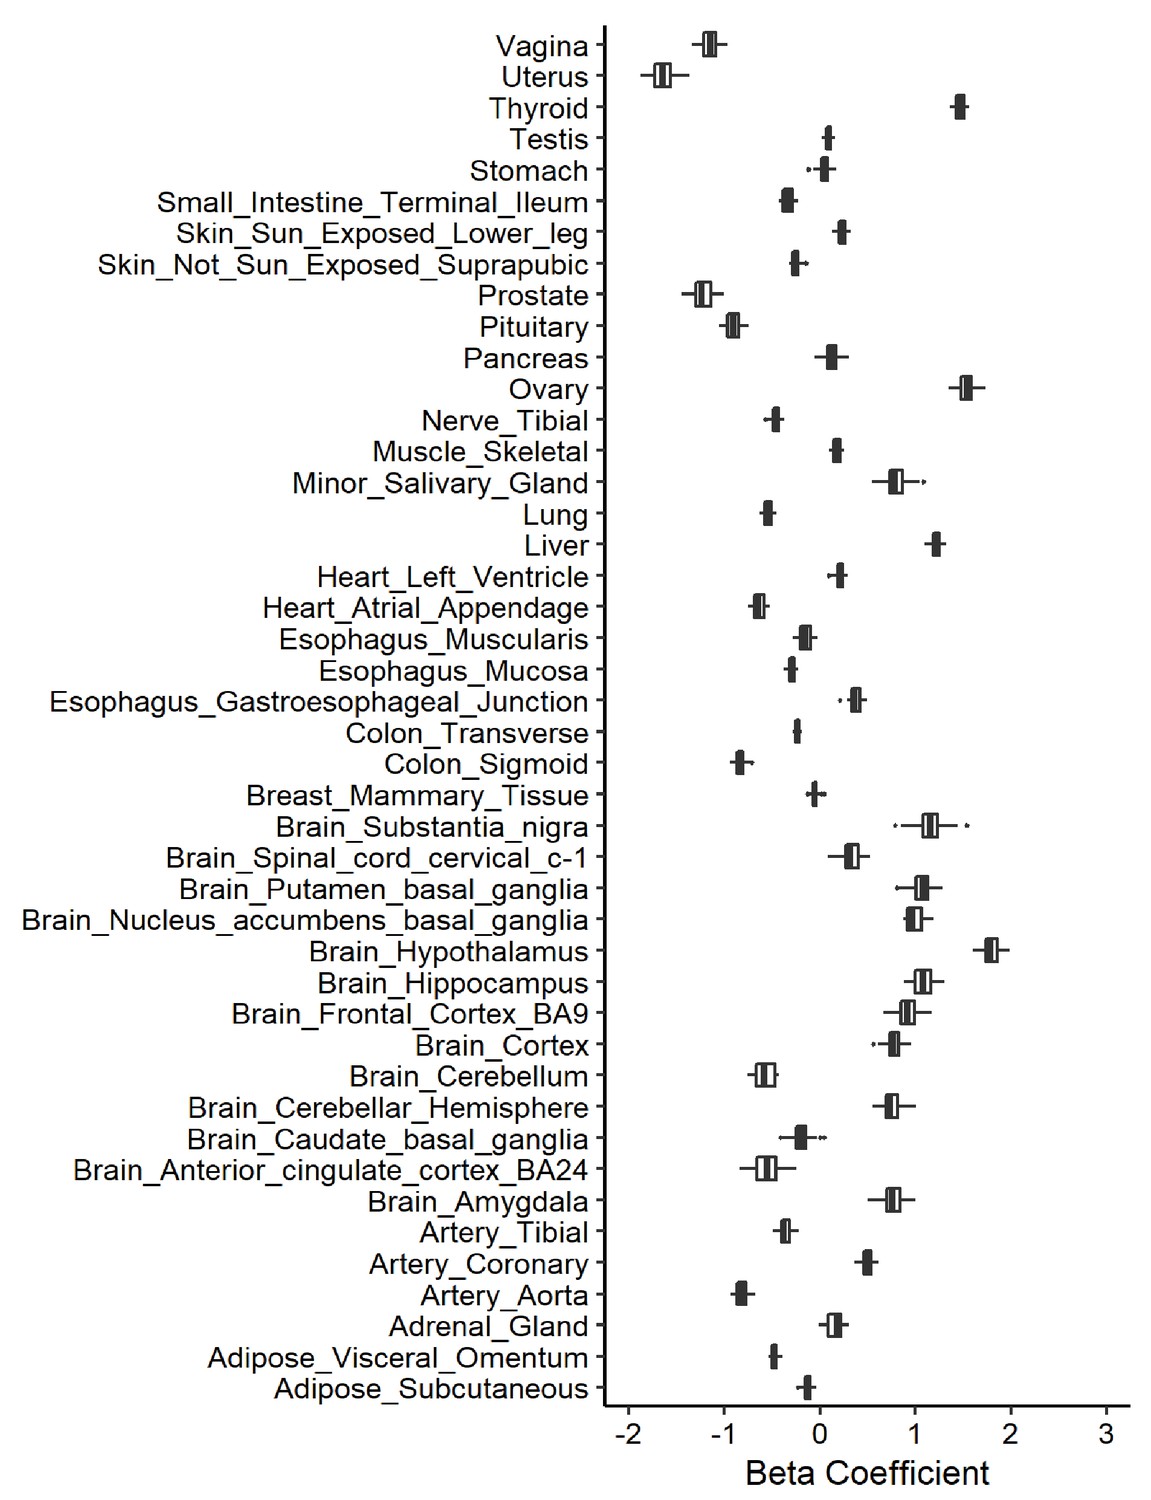
Leave-one-out analysis of causal association of cigarettes per day with angiotensin-converting enzyme 2 (ACE2) expression.
Each boxplot represents the centralized tendency of effect sizes (beta coefficients) of cigarettes per day on tissue-specific ACE2 expression based on the results of leave-one-out analysis where we excluded one single nucleotide polymorphism (SNP) at a time and performed inverse-variance weighted (IVW) using the remaining SNPs.
Appendix 1—figure 3

Leave-one-out analysis of causal association of drinks per week with angiotensin-converting enzyme 2 (ACE2) expression.
Each boxplot represents the centralized tendency of effect sizes (beta coefficients) of drinks per week on tissue-specific ACE2 expression based on the results of leave-one-out analysis where we excluded one single nucleotide polymorphism (SNP) at a time and performed inverse-variance weighted (IVW) using the remaining SNPs.
Appendix 1—figure 4
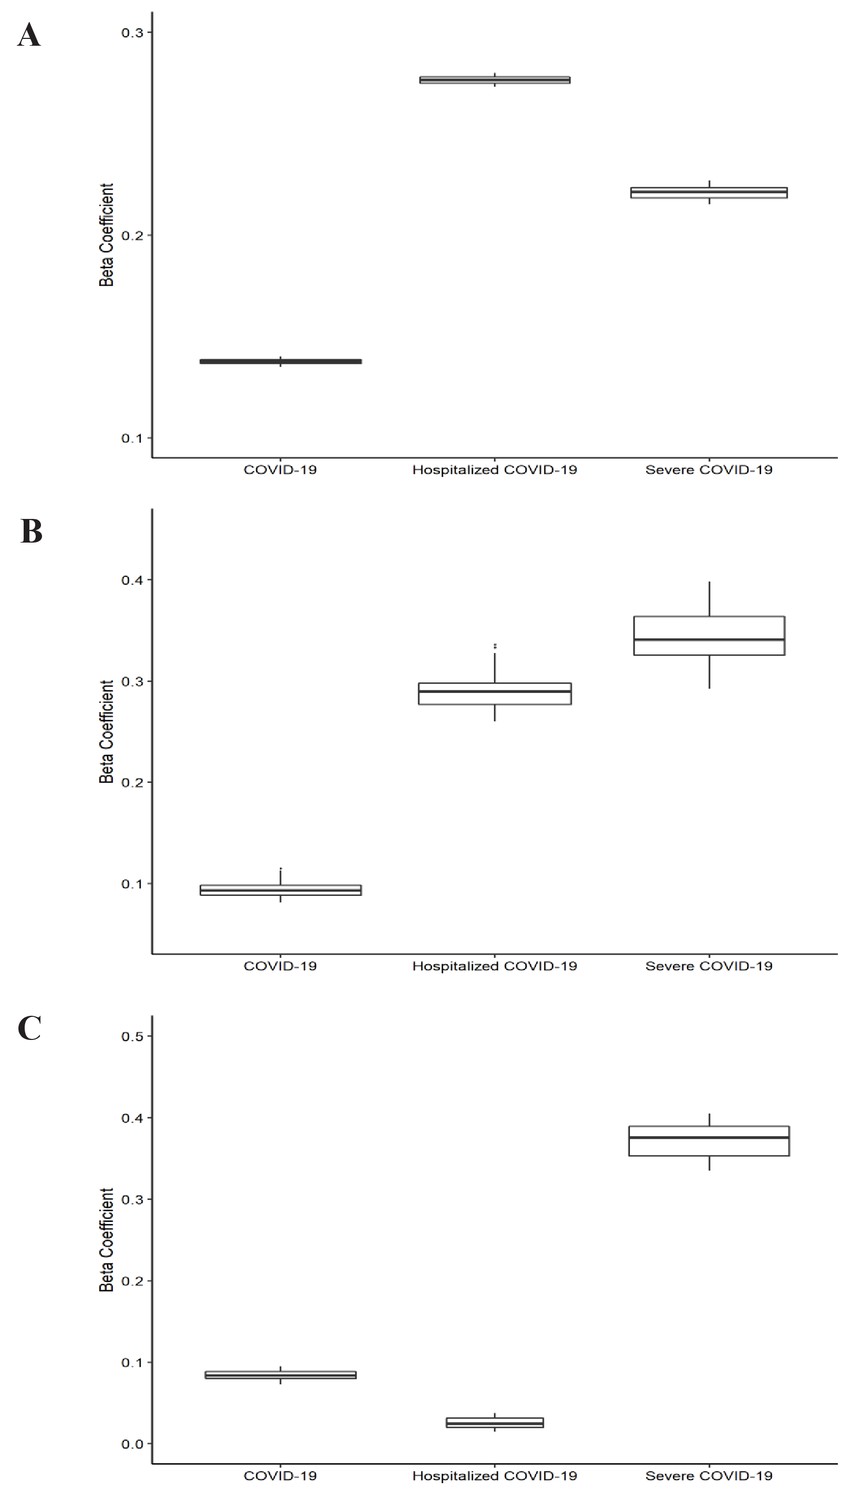
Leave-one-out analysis of causal association of smoking and alcohol consumption with coronavirus disease 2019 (COVID-19) related adverse outcomes.
(A) Leave-one-out analysis of causal association of smoking initiation with COVID-19 related adverse outcomes. (B) Leave-one-out analysis of causal association of cigarettes per day with COVID-19 related adverse outcomes. (C) Leave-one-out analysis of causal association of drinks per week with COVID-19 related adverse outcomes. Each boxplot represents the centralized tendency of effect sizes (beta coefficients) of exposure (including smoking and alcohol consumption) on COVID-19 related adverse outcomes based on the results of leave-one-out analysis where we excluded one single nucleotide polymorphism (SNP) at a time and performed inverse-variance weighted (IVW) using the remaining SNPs. COVID-19 indicates susceptibility to COVID-19. Severe COVID-19 indicates very severe respiratory confirmed COVID-19.
Tables
Table 1
Causal association of smoking initiation and angiotensin-converting enzyme 2 (ACE2) expression.
| Organ/tissue | Method | N of IVs | Beta | SE | p | p* |
|---|---|---|---|---|---|---|
| Adipose – subcutaneous | Inverse-variance weighted | 358 | 0.285 | 0.118 | 0.016 | 0.834 |
| MR-Egger | 358 | 0.663 | 0.522 | 0.205 | 0.456 | |
| Weighted median | 358 | 0.142 | 0.186 | 0.444 | ||
| MR-PRESSO | 358 | 0.285 | 0.118 | 0.017 | 0.846 | |
| Brain – hypothalamus | Inverse-variance weighted | 356 | 0.848 | 0.369 | 0.022 | 0.614 |
| MR-Egger | 356 | 0.963 | 1.588 | 0.545 | 0.941 | |
| Weighted median | 356 | 0.549 | 0.566 | 0.332 | ||
| MR-PRESSO | 356 | 0.848 | 0.369 | 0.022 | 0.655 | |
| Brain – putamen (basal ganglia) | Inverse-variance weighted | 357 | 1.117 | 0.406 | 0.006 | 0.334 |
| MR-Egger | 357 | 1.667 | 1.724 | 0.334 | 0.743 | |
| Weighted median | 357 | 1.256 | 0.607 | 0.039 | ||
| MR-PRESSO | 357 | 1.117 | 0.406 | 0.006 | 0.321 | |
| Colon – sigmoid | Inverse-variance weighted | 359 | 0.314 | 0.214 | 0.143 | 0.887 |
| MR-Egger | 359 | 1.925 | 0.945 | 0.042 | 0.080 | |
| Weighted median | 359 | 0.473 | 0.334 | 0.156 | ||
| MR-PRESSO | 359 | 0.314 | 0.214 | 0.144 | 0.904 | |
| Colon – transverse | Inverse-variance weighted | 359 | 0.193 | 0.113 | 0.088 | 0.348 |
| MR-Egger | 359 | 1.129 | 0.471 | 0.017 | 0.041 | |
| Weighted median | 359 | 0.262 | 0.165 | 0.114 | ||
| MR-PRESSO | 359 | 0.193 | 0.113 | 0.089 | 0.362 |
-
*p indicates p-value of heterogenous from inverse-variance weighted (IVW) approach, or p-value of intercept from MR-Egger regression, or p-value from Mendelian randomization pleiotropy residual sum and outlier (MR-PRESSO) global test.
Table 2
Causal association of cigarettes per day and angiotensin-converting enzyme 2 (ACE2) expression.
| Organ/tissue | Method | N of IVs | Beta | SE | p | p* |
|---|---|---|---|---|---|---|
| Brain – hypothalamus | Inverse-variance weighted | 48 | 1.789 | 0.730 | 0.014 | 0.959 |
| MR-Egger | 48 | 0.041 | 1.920 | 0.983 | 0.310 | |
| Weighted median | 48 | 2.182 | 1.347 | 0.105 | ||
| MR-PRESSO | 48 | 1.789 | 0.730 | 0.018 | 0.964 | |
| Colon – sigmoid | Inverse-variance weighted | 47 | −0.832 | 0.439 | 0.058 | 0.652 |
| MR-Egger | 47 | −1.971 | 0.807 | 0.019 | 0.092 | |
| Weighted median | 47 | −1.182 | 0.747 | 0.114 | ||
| MR-PRESSO | 47 | −0.832 | 0.439 | 0.064 | 0.701 | |
| Liver | Inverse-variance weighted | 47 | 1.216 | 0.468 | 0.009 | 0.807 |
| MR-Egger | 47 | 1.132 | 0.922 | 0.226 | 0.913 | |
| Weighted median | 47 | 1.058 | 0.850 | 0.213 | ||
| MR-PRESSO | 47 | 1.216 | 0.468 | 0.012 | 0.843 | |
| Ovary | Inverse-variance weighted | 48 | 1.545 | 0.693 | 0.026 | 0.837 |
| MR-Egger | 48 | 1.658 | 1.745 | 0.347 | 0.943 | |
| Weighted median | 48 | 2.545 | 1.217 | 0.037 | ||
| MR-PRESSO | 48 | 1.545 | 0.693 | 0.031 | 0.844 | |
| Thyroid | Inverse-variance weighted | 47 | 1.468 | 0.392 | 1.8×10⁻⁴ | 0.604 |
| MR-Egger | 47 | 1.739 | 0.907 | 0.062 | 0.739 | |
| Weighted median | 47 | 1.435 | 0.641 | 0.025 | ||
| MR-PRESSO | 47 | 1.468 | 0.392 | 5.0×10⁻⁴ | 0.670 | |
| Vagina | Inverse-variance weighted | 48 | −1.150 | 0.688 | 0.094 | 0.055 |
| MR-Egger | 48 | −3.271 | 1.574 | 0.043 | 0.142 | |
| Weighted median | 48 | −2.644 | 0.916 | 0.004 | ||
| MR-PRESSO | 48 | −1.150 | 0.688 | 0.101 | 0.057 |
-
*p indicates p-value of heterogenous from inverse-variance weighted (IVW) approach, or p-value of intercept from MR-Egger regression, or p-value from Mendelian randomization pleiotropy residual sum and outlier (MR-PRESSO) global test.
Table 3
Causal link of smoking initiation with the risk of coronavirus disease 2019 (COVID-19) related adverse outcomes.
| Outcome | Method | N of IVs | OR (95% CI) | p | p* |
|---|---|---|---|---|---|
| COVID-19 susceptibility | Inverse-variance weighted | 352 | 1.15 (1.07–1.23) | 8.7×10⁻⁵ | 6.7×10⁻⁵ |
| MR-Egger | 352 | 1.11 (0.83–1.49) | 0.489 | 0.821 | |
| Weighted median | 352 | 1.18 (1.08–1.29) | 2.9×10⁻⁴ | ||
| MR-PRESSO | 352 | 1.15 (1.07–1.23) | 1.0×10⁻⁴ | 5.0×10⁻⁵ | |
| Hospitalized COVID-19 | Inverse-variance weighted | 351 | 1.32 (1.16–1.50) | 3.7×10⁻⁵ | 0.009 |
| MR-Egger | 351 | 0.78 (0.44–1.36) | 0.383 | 0.059 | |
| Weighted median | 351 | 1.37 (1.14–1.66) | 0.001 | ||
| MR-PRESSO | 351 | 1.32 (1.16–1.50) | 4.6×10⁻⁵ | 0.011 | |
| Very severe respiratory confirmed COVID-19 | Inverse-variance weighted | 352 | 1.25 (1.03–1.51) | 0.025 | 0.114 |
| MR-Egger | 352 | 0.83 (0.37–1.89) | 0.658 | 0.318 | |
| Weighted median | 352 | 1.17 (0.89–1.55) | 0.267 | ||
| MR-PRESSO | 352 | 1.25 (1.03–1.51) | 0.025 | 0.119 |
-
*p indicates p-value of heterogeneous from inverse-variance weighted (IVW) approach, or p-value of intercept from MR-Egger regression, or p-value from Mendelian randomization pleiotropy residual sum and outlier (MR-PRESSO) global test.
Additional files
-
Supplementary file 1
Supplementary results of the causality of smoking and alcohol consumption on angiotensin-converting enzyme 2 (ACE2) expression and coronavirus disease 2019 (COVID-19) related outcomes.
(a) Information of genome-wide significant single nucleotide polymorphisms (SNPs) associated with smoking initiation. (b) Information of genome-wide significant SNPs associated with cigarettes per day. (c) Information of genome-wide significant SNPs associated with drinks per week. (d) Sample size of ACE2 expression in 44 tissues/organs from GTEx database. (e) Statistical power in Mendelian randomization study on causal association of smoking and alcohol consumption with ACE2 expression andCOVID-19 related adverse outcomes. (f) Causal association of smoking initiation and ACE2 expression. (g) Causal association of cigarettes per day and ACE2 expression. (h) Causal association of drinks per week and ACE2 expression. (i) Causal association of smoking initiation and ACE2 expression excluding palindromic SNPs. (j) Causal association of cigarettes per day and ACE2 expression excluding palindromic SNPs. (k) Causal association of drinks per week and ACE2 expression excluding palindromic SNPs. (l) Causal association of smoking initiation and ACE2 expression excluding pleiotropic SNPs. (m) Causal association of cigarettes per day and ACE2 expression excluding pleiotropic SNPs. (n) Causal association of drinks per week and ACE2 expression excluding pleiotropic SNPs. (o) Causal association of cigarettes per day with the risk of COVID-19 related adverse outcomes. (p) Causal association of drinks per week with the risk of COVID-19 related adverse outcomes. (q) Causal association of smoking and alcohol consumption with the risk of COVID-19 related adverse outcomes excluding palindromic SNPs. (r) Causal association of smoking and alcohol consumption with the risk of COVID-19 related adverse outcomes excluding pleiotropic SNPs.
- https://cdn.elifesciences.org/articles/64188/elife-64188-supp1-v2.xlsx
-
Transparent reporting form
- https://cdn.elifesciences.org/articles/64188/elife-64188-transrepform-v2.docx
Download links
A two-part list of links to download the article, or parts of the article, in various formats.
Downloads (link to download the article as PDF)
Open citations (links to open the citations from this article in various online reference manager services)
Cite this article (links to download the citations from this article in formats compatible with various reference manager tools)
Mendelian randomization analysis provides causality of smoking on the expression of ACE2, a putative SARS-CoV-2 receptor
eLife 10:e64188.
https://doi.org/10.7554/eLife.64188


