Neural correlates of ingroup bias for prosociality in rats
- Sagol School of Neuroscience, Tel-Aviv University, Israel
- School of Psychological Sciences, Tel-Aviv University, Israel
- Department of Integrative Biology, University of California, Berkeley, United States
- Helen Wills Neuroscience Institute, University of California, Berkeley, United States
- The Hospital for Sick Children, Toronto, Neuroscience and Mental Health Program, Canada
- Physiology Department, University of Toronto, Canada
- Canadian Institute for Advanced Research, Canada
- Department of Psychiatry and Behavioral Sciences, Stanford University, United States
- Department of Bioengineering, Stanford University, United States
- Department of Psychiatry, Stanford University, United States
- Howard Hughes Medical Institute, Stanford University, United States
- Department of Psychology, University of California, Berkeley, United States
Figures
Figure 1
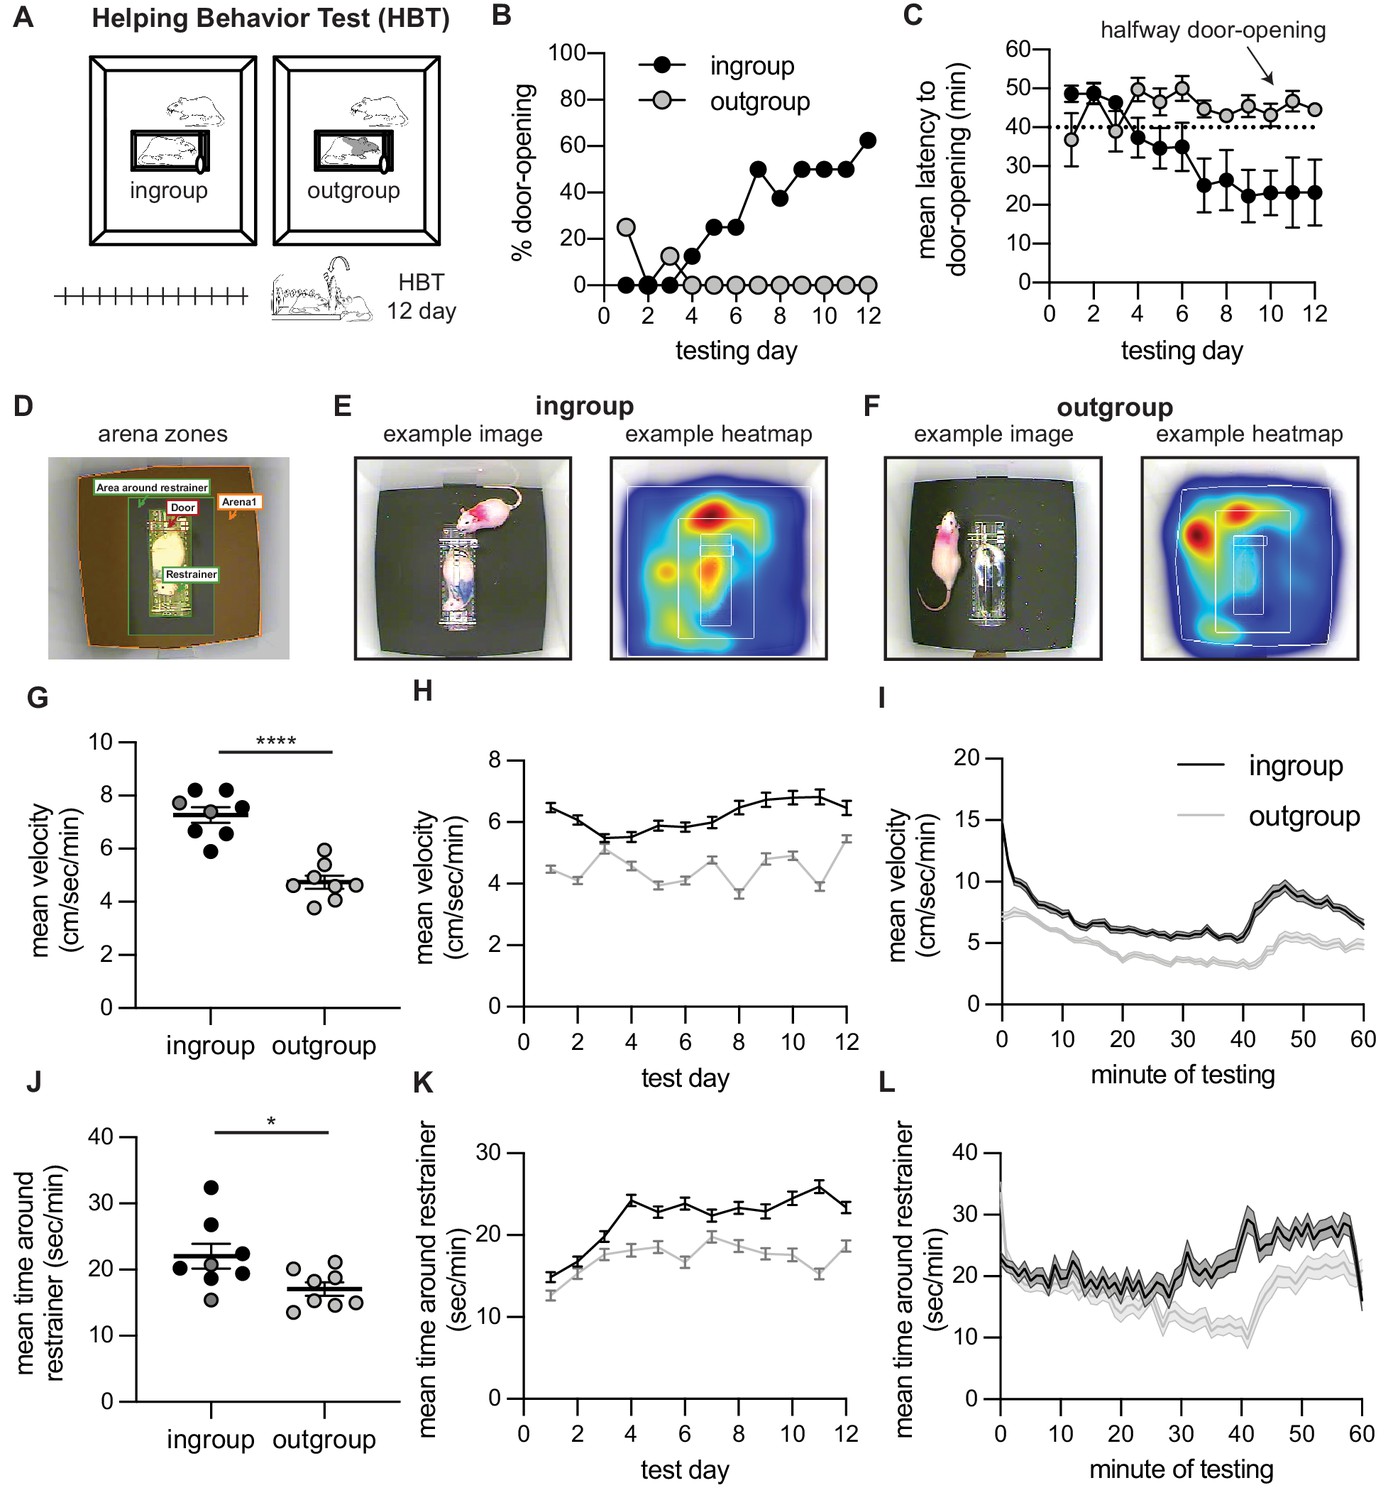
Helping behavior for adult rats tested with ingroup and outgroup members.
Adult rats selectively helped ingroup members. (A) Diagram of the helping behavior test (HBT) with a trapped rat. The trapped rat was either a cagemate of the same strain (ingroup, left) or a stranger of an unfamiliar strain (outgroup, right). (B, C) Rats released ingroup members but not outgroup members, as expressed by % door-openings (B) and mean (± SEM) latency to open (C) across testing sessions. The dashed line indicates the half-way door-opening by the experimenter. (D–F) Representative movement patterns of rats tested with an ingroup or outgroup member, depicted by a heatmap of the rat’s location along the session. Rats were more active (G–I) and spent more time around the restrainer (J–L) in the presence of a trapped ingroup member than an outgroup member. Lighter dots indicate non-openers, dark dots are openers.
Figure 2 with 6 supplements
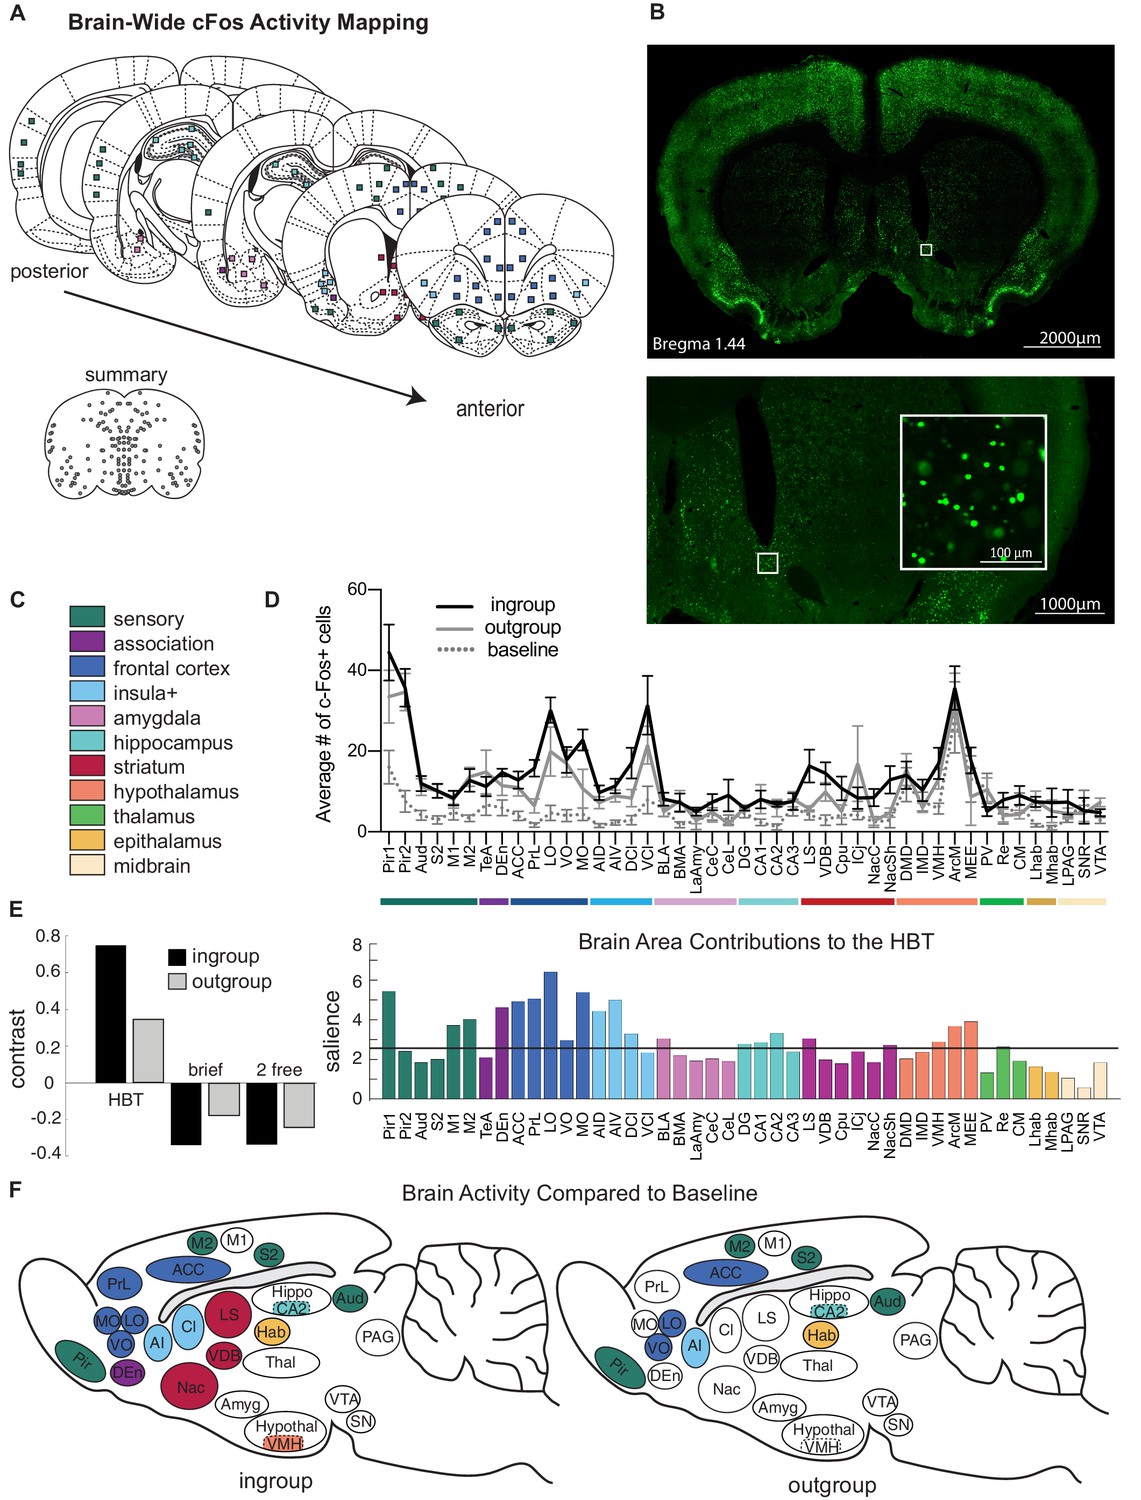
Neural activity associated with the helping test.
Brain-wide patterns of neural activity associated with the helping behavior test (HBT). (A) Diagram of brain regions sampled for c-Fos expression. (B) A representative image of c-Fos signal sampled in the nucleus accumbens. (C) Legend of brain region categories coded by color. (D) Number of c-Fos+ cells per region (mean ± SEM) for rats tested with ingroup members, outgroup members, and an untested baseline. (E) Partial least square (PLS) task analysis of all social conditions. On left, the HBT ingroup and outgroup conditions showed a common pattern of neural activity, which contrasts with the other social conditions, including a brief exposure to a trapped rat (brief), and exposure to a non-trapped rat separated by a wire mesh (2 free). On right, regions that contributed to this contrast display increased activity in the HBT compared to the other conditions. The black line marks a significance threshold at p<0.01. (F) Diagram of rat brains showing regions significantly active (in color) for the HBT ingroup (left) or outgroup (right) conditions compared to baseline.
Figure 2—figure supplement 1
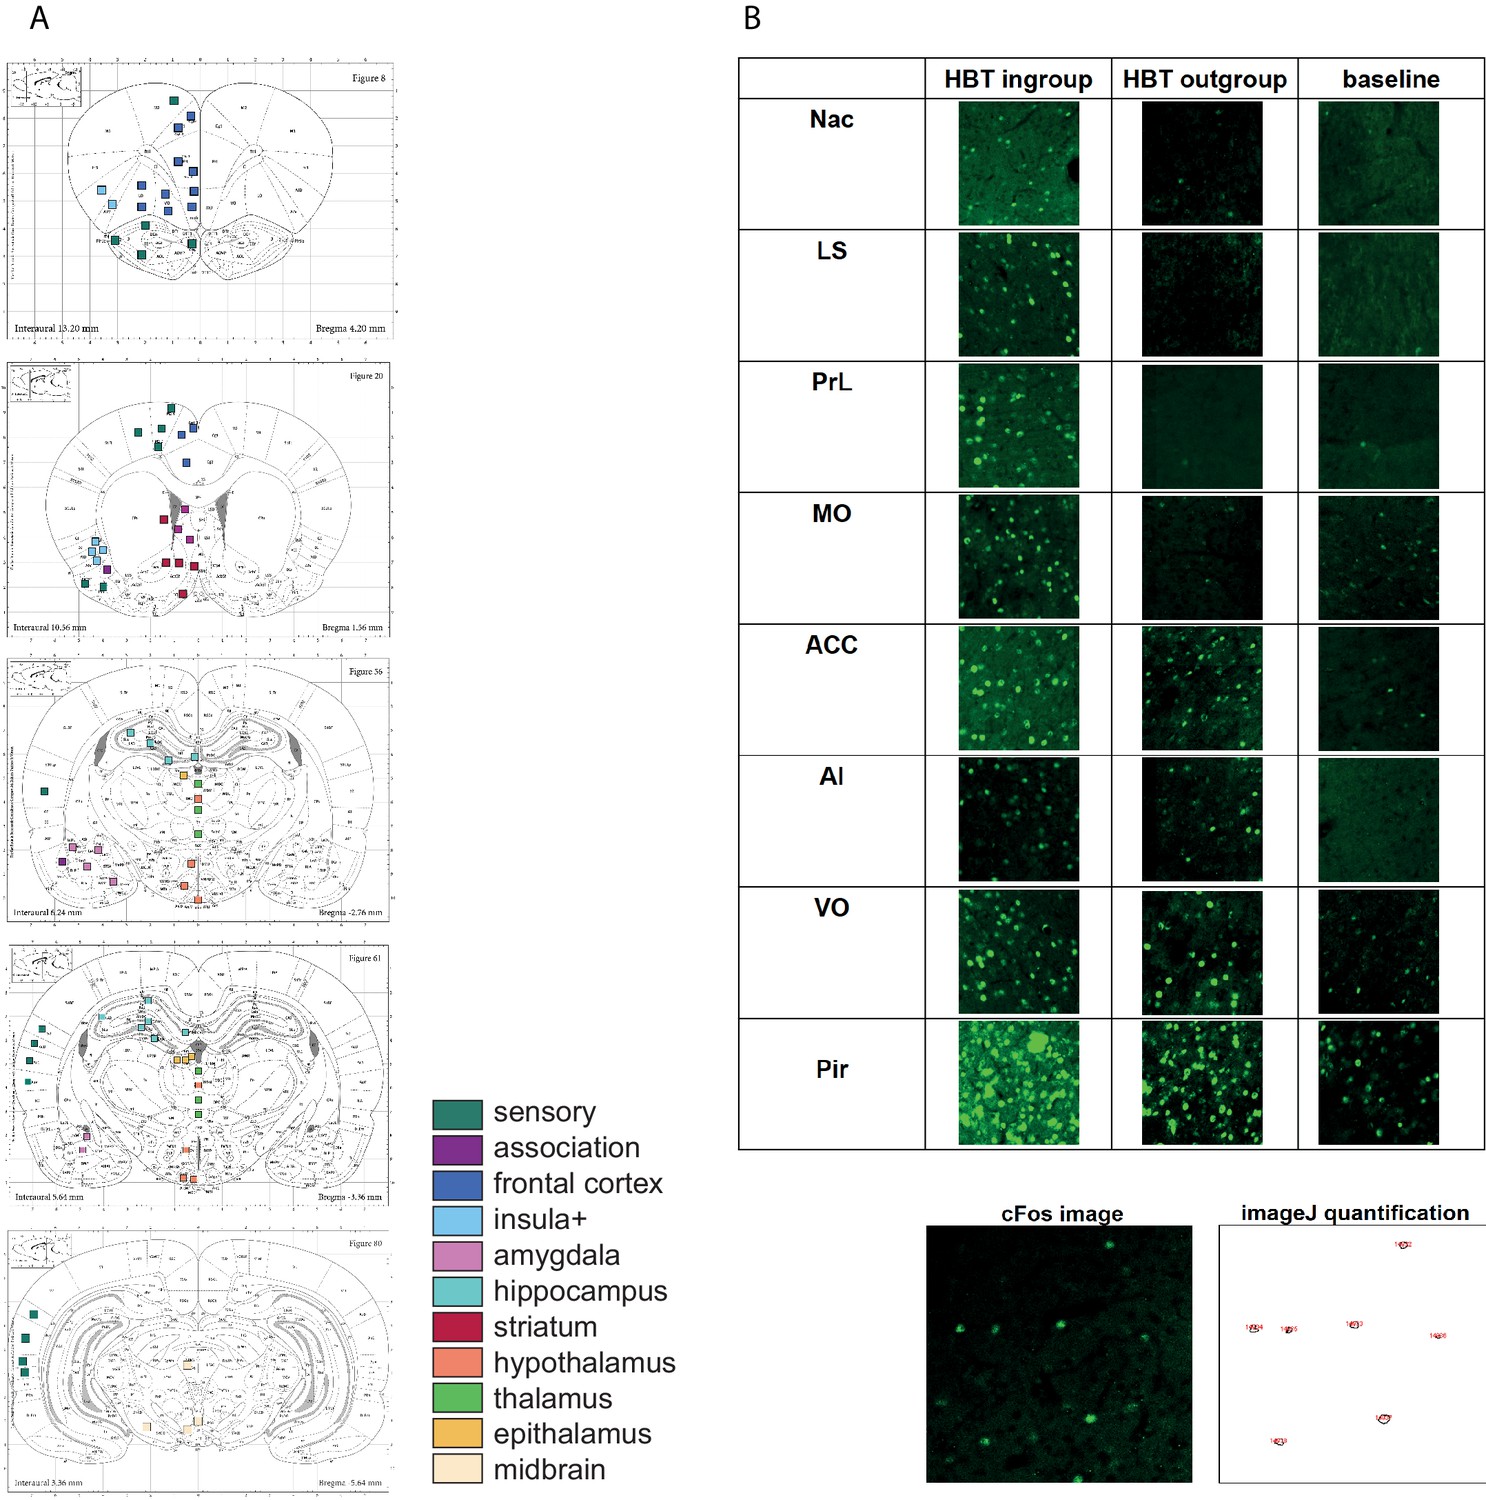
c-Fos acquisition.
(A) Regions of interest (ROIs) for c-Fos analysis. Rat Atlas map with 84 sampled brain regions (according to the Paxinos and Watson Rat Brain Atlas). ROIs are color coded based on the legend in Figure 2. Some ROIs (e.g., multiple samples of the same region on different slices) were merged into the final list of 45 areas depicted in Figure 2. (B) Representative c-Fos samples (250 × 250 µm) from brain ROIs. Quantification of c-Fos+ cell numbers (in fluorescent green) was performed by ImageJ (see image on bottom), followed by visual validation.
Figure 2—figure supplement 2
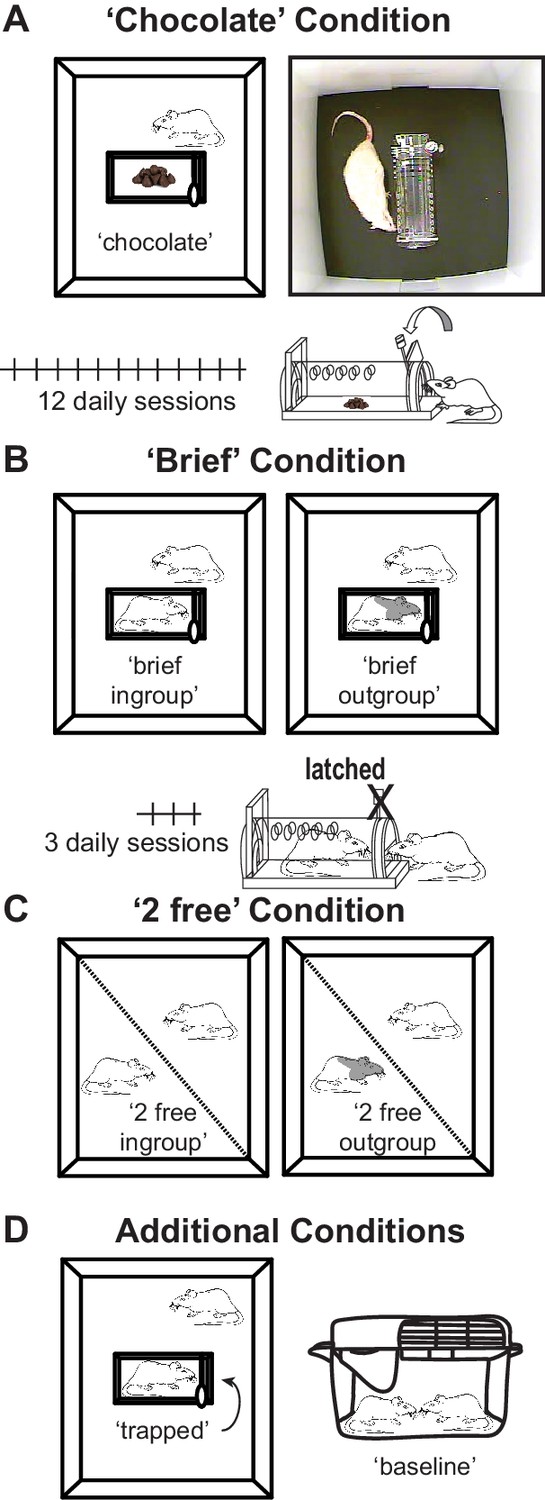
Outline of control conditions.
(A) Rats in the ‘chocolate’ condition were tested with five chocolate chips in the restrainer for 12 daily sessions. (B) Rats in the ‘brief’ condition were exposed to a trapped ingroup or outgroup rat for three daily sessions without being able to open the restrainer. (C) Rats in the ‘2 free’ condition were exposed to a freely moving ingroup or outgroup rat across a wire mesh. (D) Rats in other control conditions included the trapped rat, and untested rats left in their homecage as a ‘baseline’ group.
Figure 2—figure supplement 3
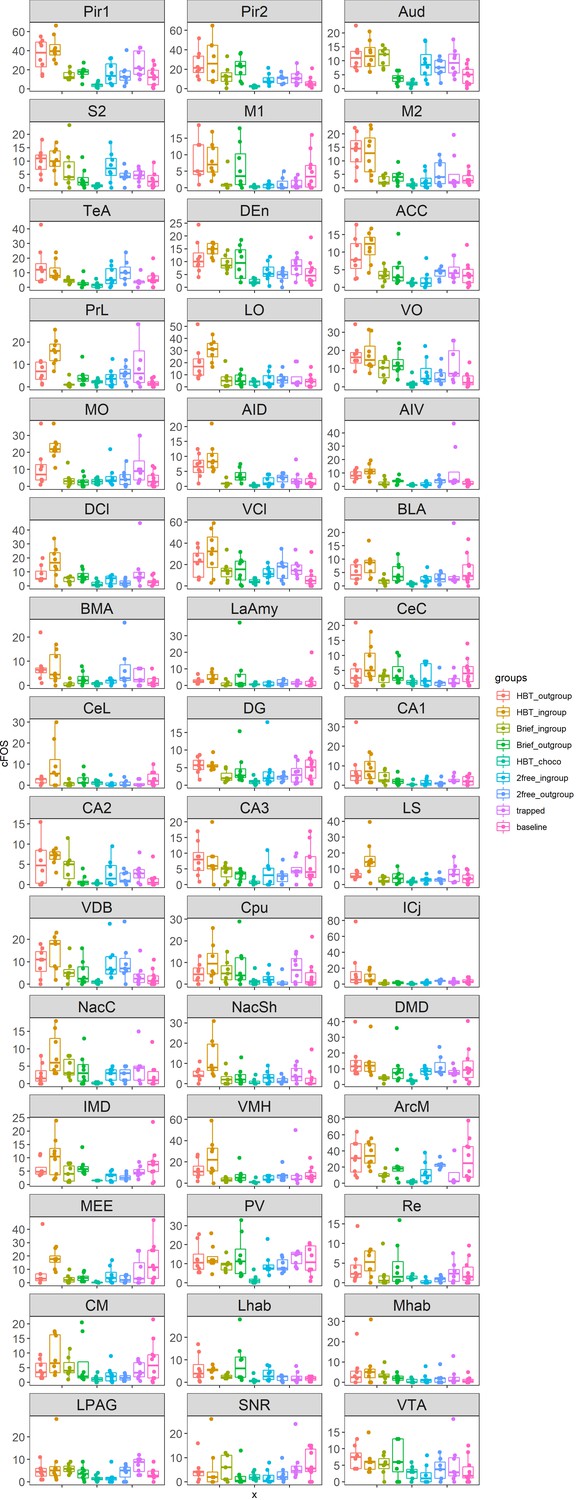
Box plots of c-Fos data in all brain regions across all test groups.
Center bars mark the median. Lower and upper edges correspond to the 25th and 75th percentiles. Descriptions of the brain region abbreviations can be found in Supplementary file 1. Data points are jittered along the x-axis to avoid overlaps. X: experimental groups; Y: c-Fos+ cell numbers.
Figure 2—figure supplement 4
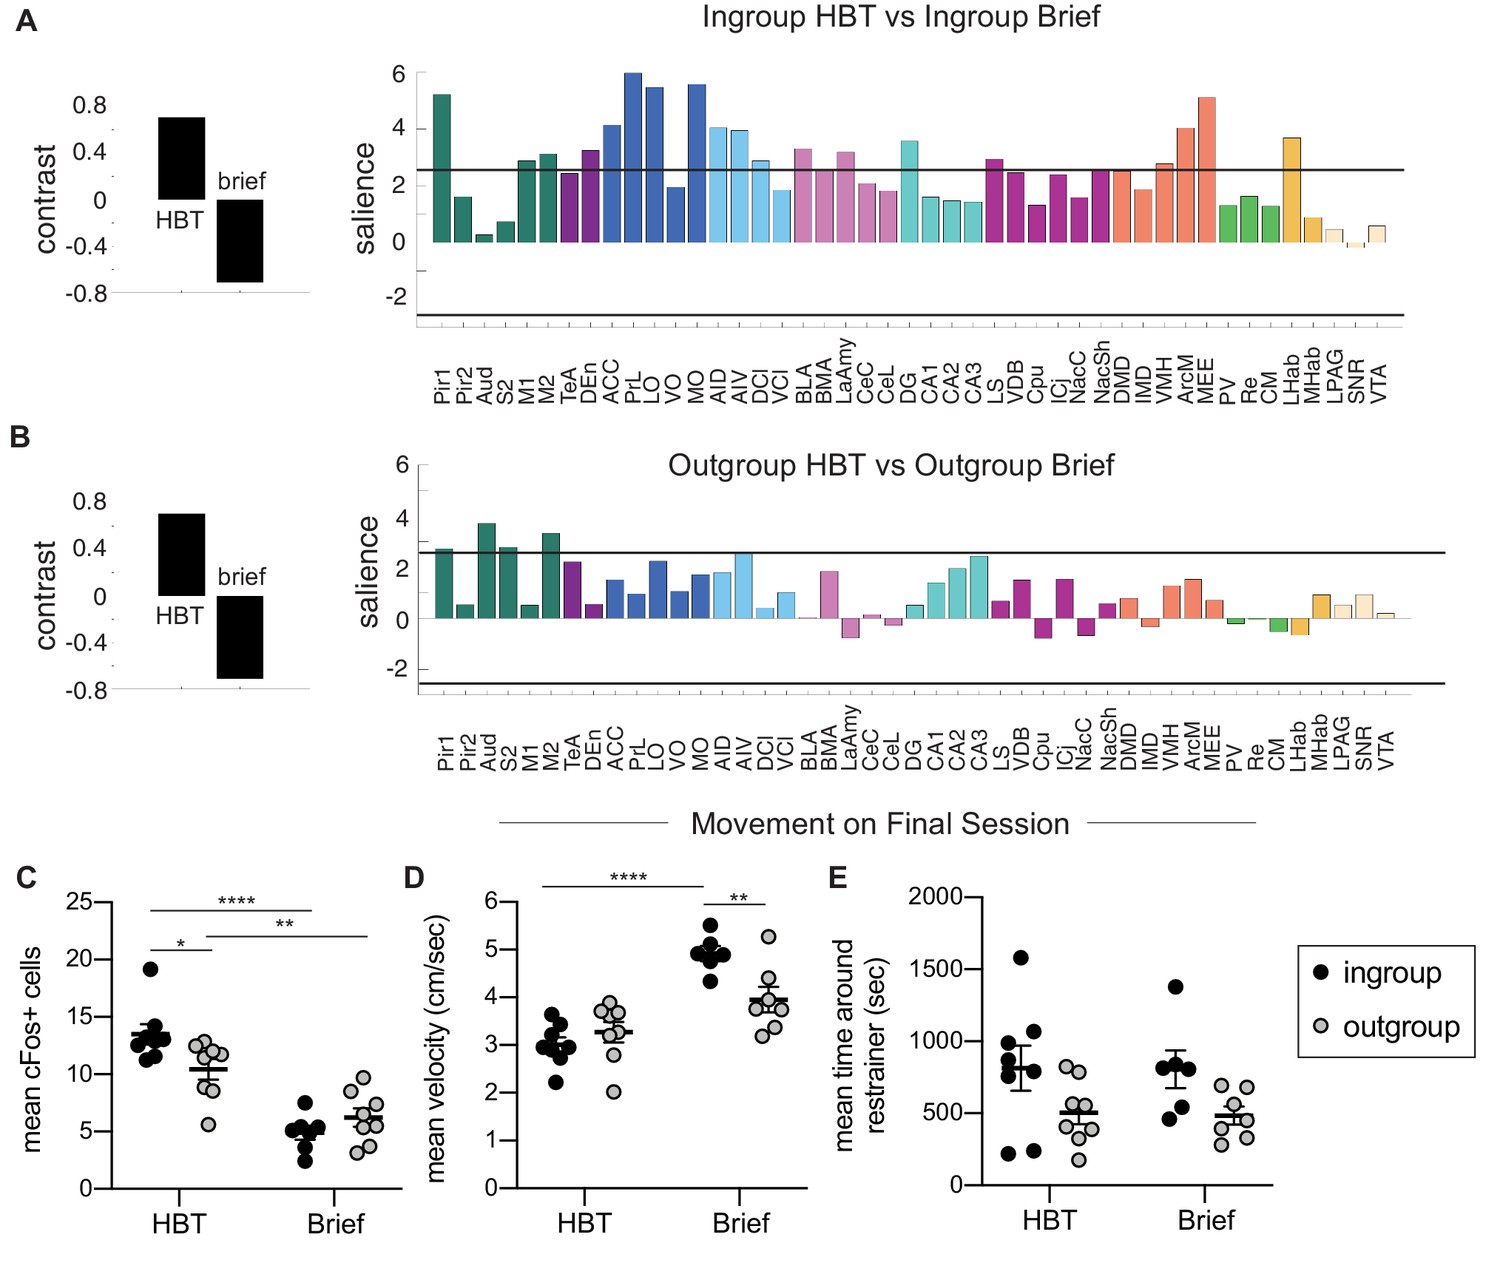
Comparison of the helping behavior test (HBT) to the brief conditions.
Task partial least square (PLS) was used to compare rats in the ingroup (A) and outgroup (B) conditions. Regions contributing significantly to the contrast (left) are shown on the right. The solid black line marks the significance threshold (p<0.01). (C) The average number of c-Fos+ cells was greater in the HBT ingroup and outgroup conditions compared to their respective brief controls, and ingroup rats showed higher c-Fos than the outgroup in the HBT but not in the brief condition. Movement on the final session (D, E) showed higher mean velocity in the brief conditions (D) and no difference in time spent around the restrainer for any group (E).
Figure 2—figure supplement 5
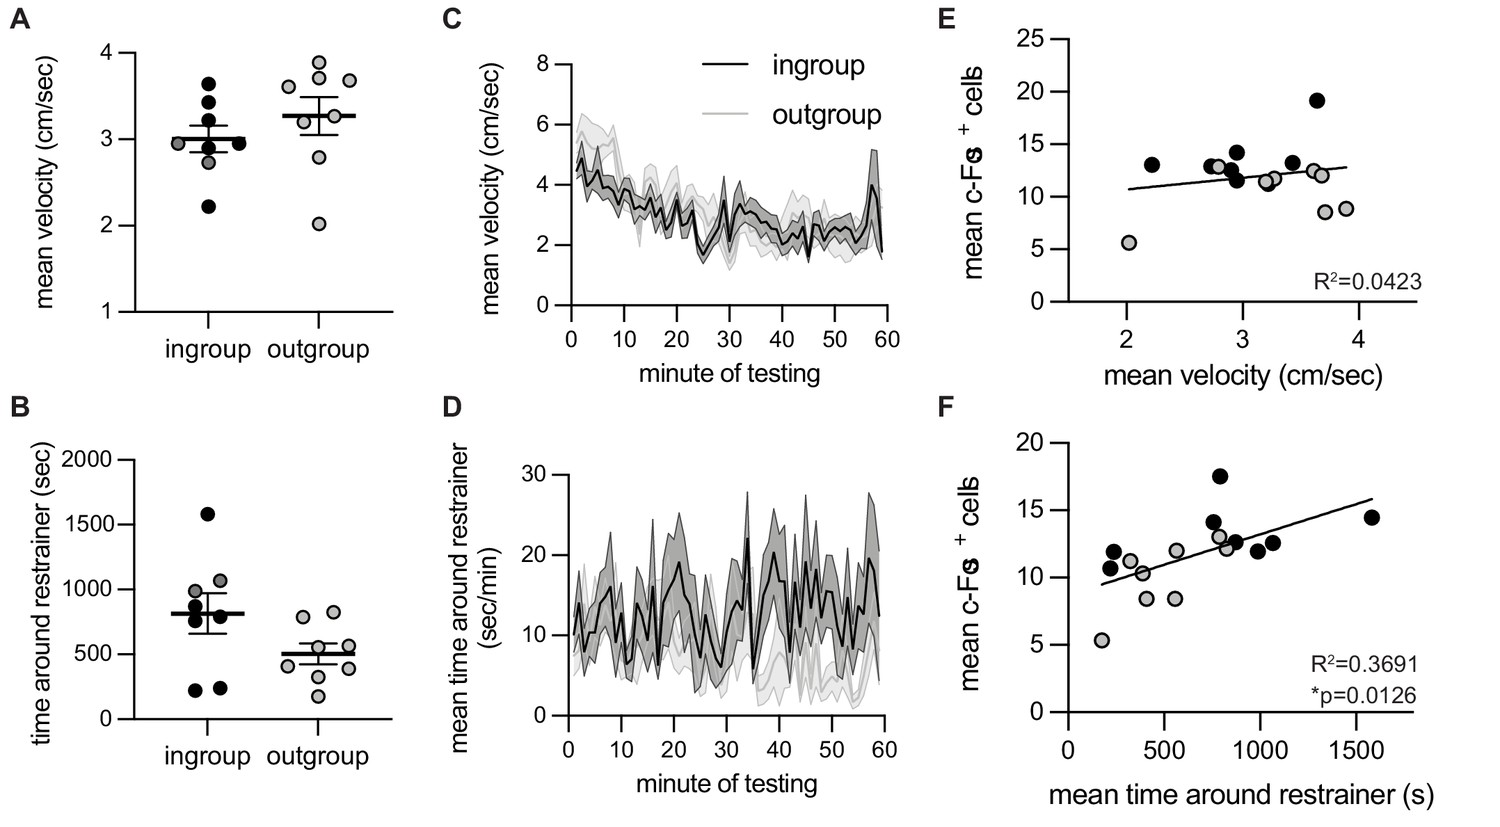
c-Fos-associated movement patterns on the final testing session.
Correlation between neural activity and time spent around the restrainer. For rats tested with ingroup or outgroup members, velocity (A, C) and time around the restrainer (B, D) were similar across the final testing session on which c-Fos was measured. Velocity was not correlated with c-Fos numbers (E). Time spent in the area around the restrainer was significantly correlated with c-Fos+ cell numbers (F). Light dots indicate non-openers, dark dots are openers.
Figure 2—figure supplement 6
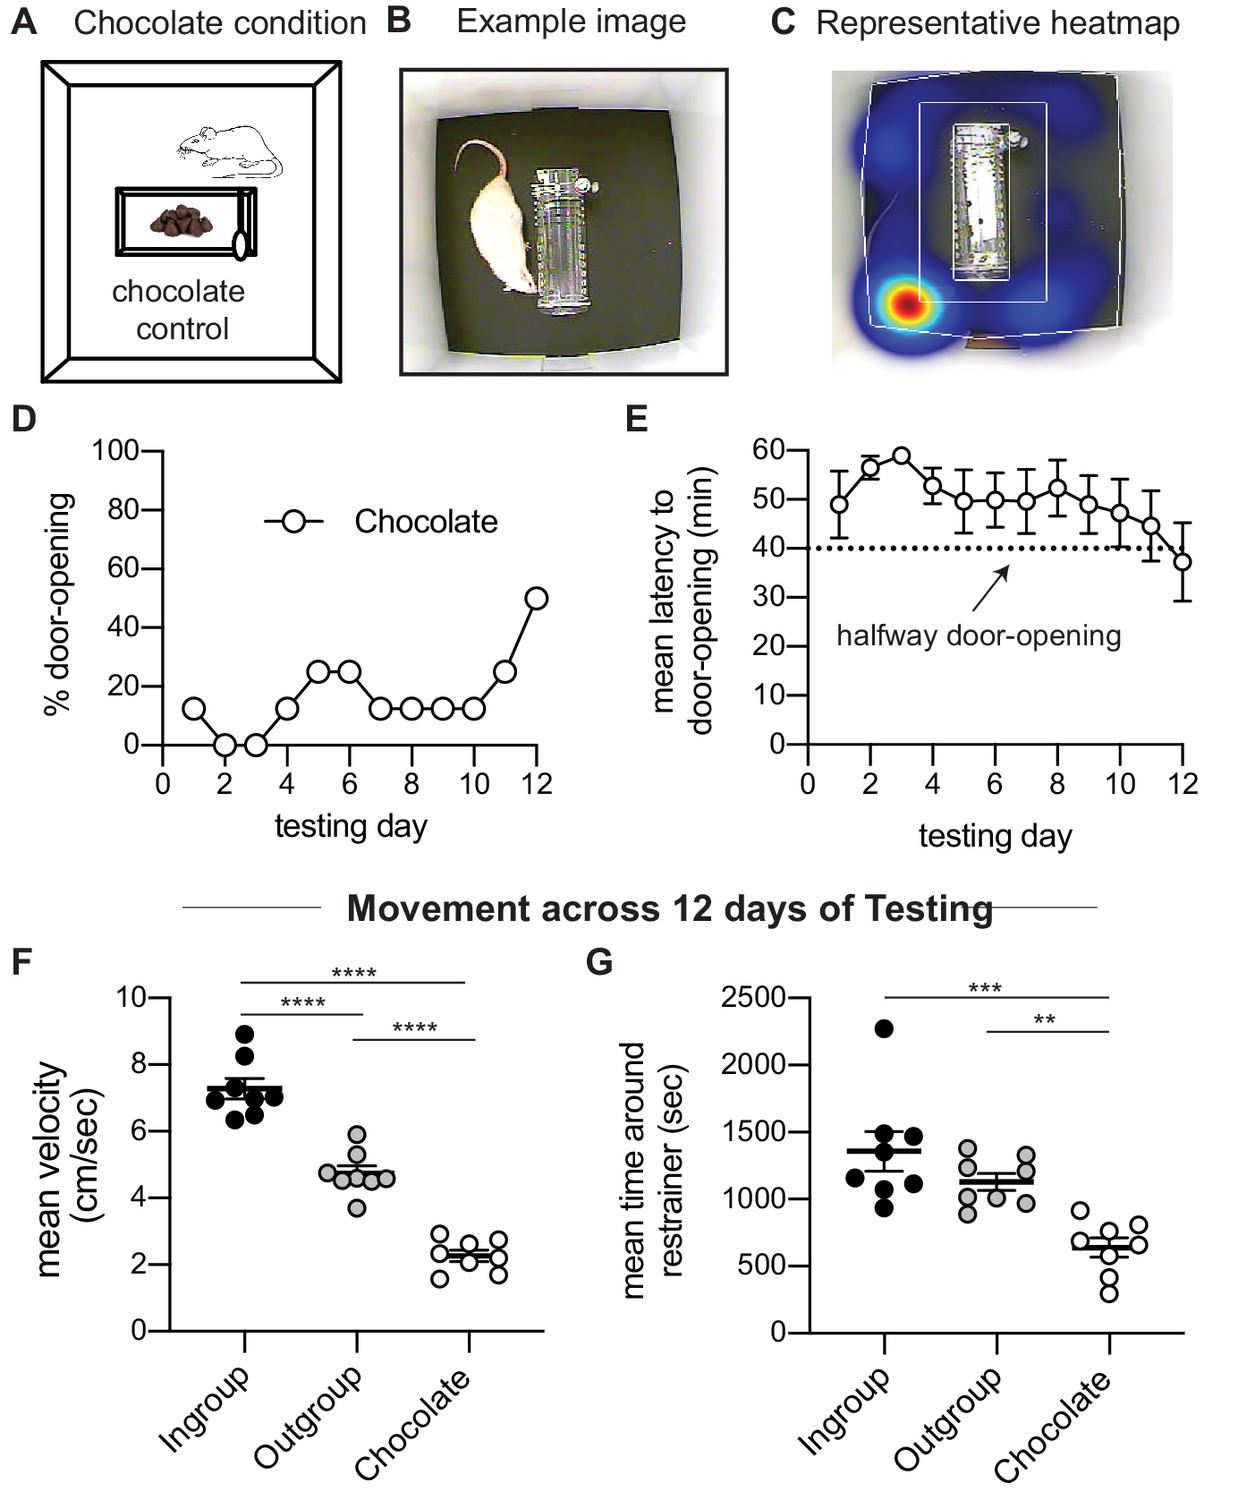
Rats tested in the helping behavior test (HBT) with chocolate chips display little door-opening.
(A) Diagram of the chocolate chip control condition. (B, C) Example image and representative heatmap of activity across one session. (D, E) Rats showed low levels of door-opening behavior as expressed by percent of door-openings and mean latency to door-opening across testing sessions. The dashed line indicates the half-way door-opening by the experimenter. (F, G) Rats in the chocolate condition showed lower levels of movement across the 12 days of testing relative to the other two HBT conditions, as presented by the average velocity and average time rats spent near the restrainer.
Figure 3 with 1 supplement
The nucleus accumbens (Nac) is selectively active for the helping behavior test (HBT) ingroup condition.
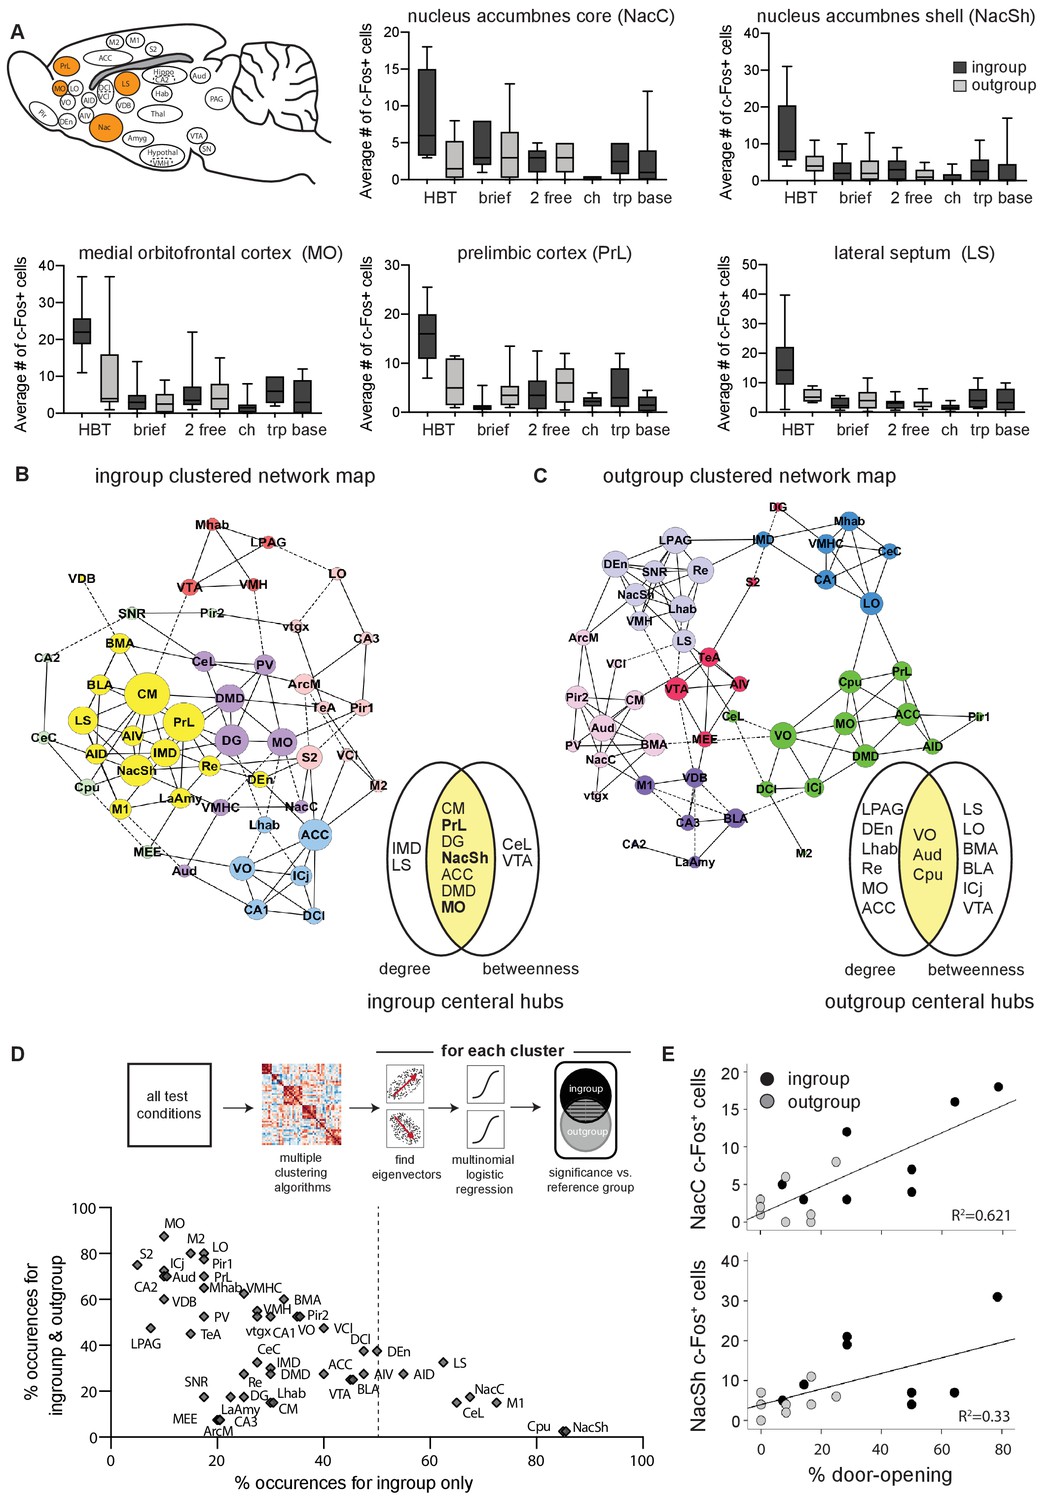
The Nac was activated selectively for trapped ingroup members. (A) Several brain regions (in orange) were significantly more active in the HBT ingroup compared to the HBT outgroup condition (p<0.05). c-Fos numbers are also shown for the brief, 2 free, chocolate (ch), trapped (trp), and baseline (base) conditions. (B, C) Network graph depicting the top 10% inter-region correlations for the HBT ingroup and outgroup conditions. Positive correlations are shown in solid lines, negative correlations in dashed lines. Central hubs were determined as the top 20% of regions with highest in both degree and betweenness (yellow). In bold, regions that were more active in the HBT ingroup condition than the outgroup. Circle color represents clusters identified via a Louvain algorithm, circle size represents the number of degrees for each region. (D) A series of multiple logistical regression tests on all test conditions identified clusters of brain regions that aligned with the distinct brain activity in the helping test conditions. The figure contrasts regions uniquely observed for the ingroup condition (x-axis) with regions observed for both ingroup and outgroup conditions (y-axis). The nucleus accumbens shell (NacSh) and nucleus accumbens core (NacC) were present uniquely in the ingroup condition in 85 and 67.5% of tests, respectively. Dashed line represents the boundary for the regions that are required to identify the ingroup condition based on brain activity. Diagram describes how the graph was derived. (E) Activity in the NacC and NacSh was positively correlated with door-opening behavior. No other regions were significantly correlated with helping.
Figure 3—figure supplement 1
Network analyses.
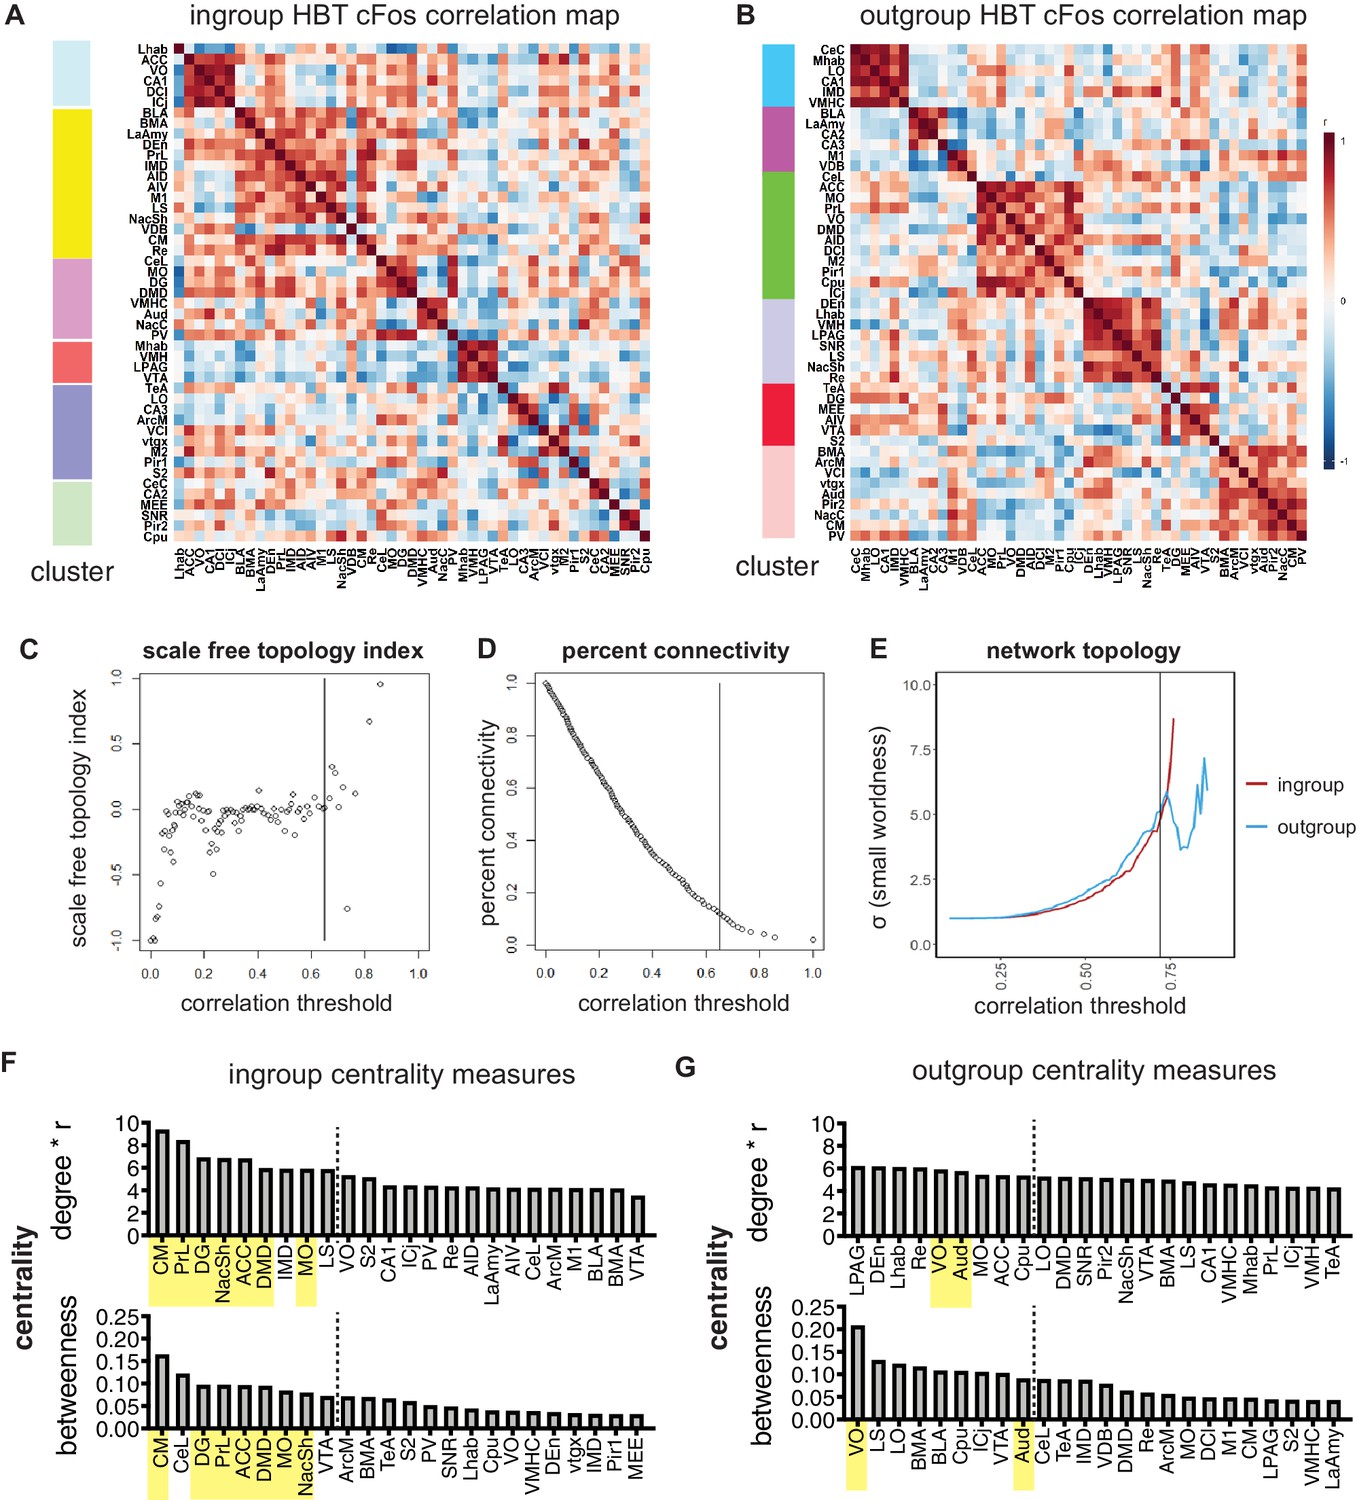
(A, B) Louvain clustered heatmap of pairwise correlation values for the helping behavior test (HBT) ingroup and outgroup conditions. Bar on left visualizes the identified clusters. (C–E) Network parameters used for selecting a threshold. The 10% top-ranking correlation values were used in the network map. This threshold was determined according to the network parameters. Increasing the threshold results in a fragmented network, that is, overly scale-free and reduced in connectivity. Decreasing the threshold undermines the small-worldness of the network. (C) Scale-free topology index shows the correlation threshold cutoff of the transition to scale-free network. (D) The percent connectivity graph represents the correlation threshold for 10% connectivity. (E) The small-worldness of the network for the HBT ingroup and outgroup condition is displayed for each correlation threshold. (F, G) Central hubs of the HBT ingroup and outgroup networks. To identify central hubs, brain regions were ranked by degree and betweenness. The top 20% of regions are shown for each parameter. Brain areas appearing in the top 20% of both parameters were classified as central hubs (in yellow).
Figure 4 with 1 supplement
In vivo neural activity in the nucleus accumbens (Nac) corresponds with approach towards an ingroup member.
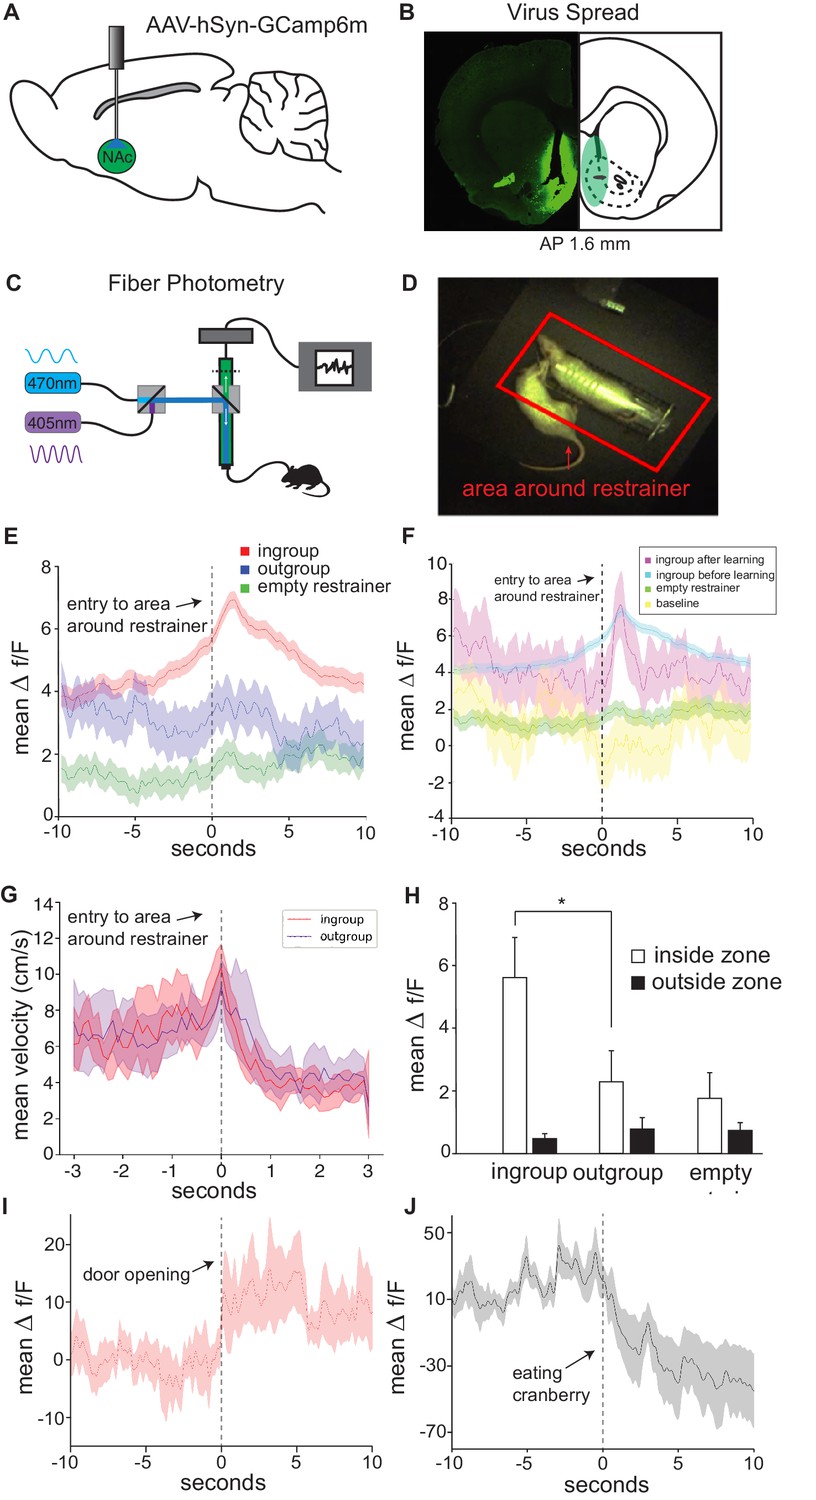
Approaching a trapped ingroup member was associated with increased calcium signal in the Nac. (A) A diagram depicting location of virus injection and optic-fiber implant used for fiber photometry recordings. (B) Example of virus spread in one animal (left) and overlay summary of all animals (right). (C) Diagram of setup used for photometry recordings. (D) Top view of testing arena. The area around the restrainer is depicted by the red rectangle. Entry into the area, defined as when the rat’s body was detected moving from outside this zone to inside this zone, was the point used in the analyses below. (E) Mean neural activity (Δf/F) across rats and testing sessions increased when rats approached a trapped ingroup member (red) but not a trapped outgroup member (blue) or empty restrainer (green). (F) Activity increased both during sessions before (cyan) and after (magenta) rats learned to open the restrainer. No increase was observed while rats were recorded in an empty arena (yellow). (G) Velocity during entry into the zone was not different across conditions (mean ± STDEV). Point of entry into the area around the restrainer is indicated by the dashed line. (H) Neural activity averaged across the whole session (mean ± SEM) was higher for the ingroup when the rat was in the area around the restrainer compared to outside this zone. Activity is also shown around the moment of door-opening (I) or when rats started eating a cranberry on the final session (J).
Figure 4—figure supplement 1
Summary of fiber photometry injections and implants.
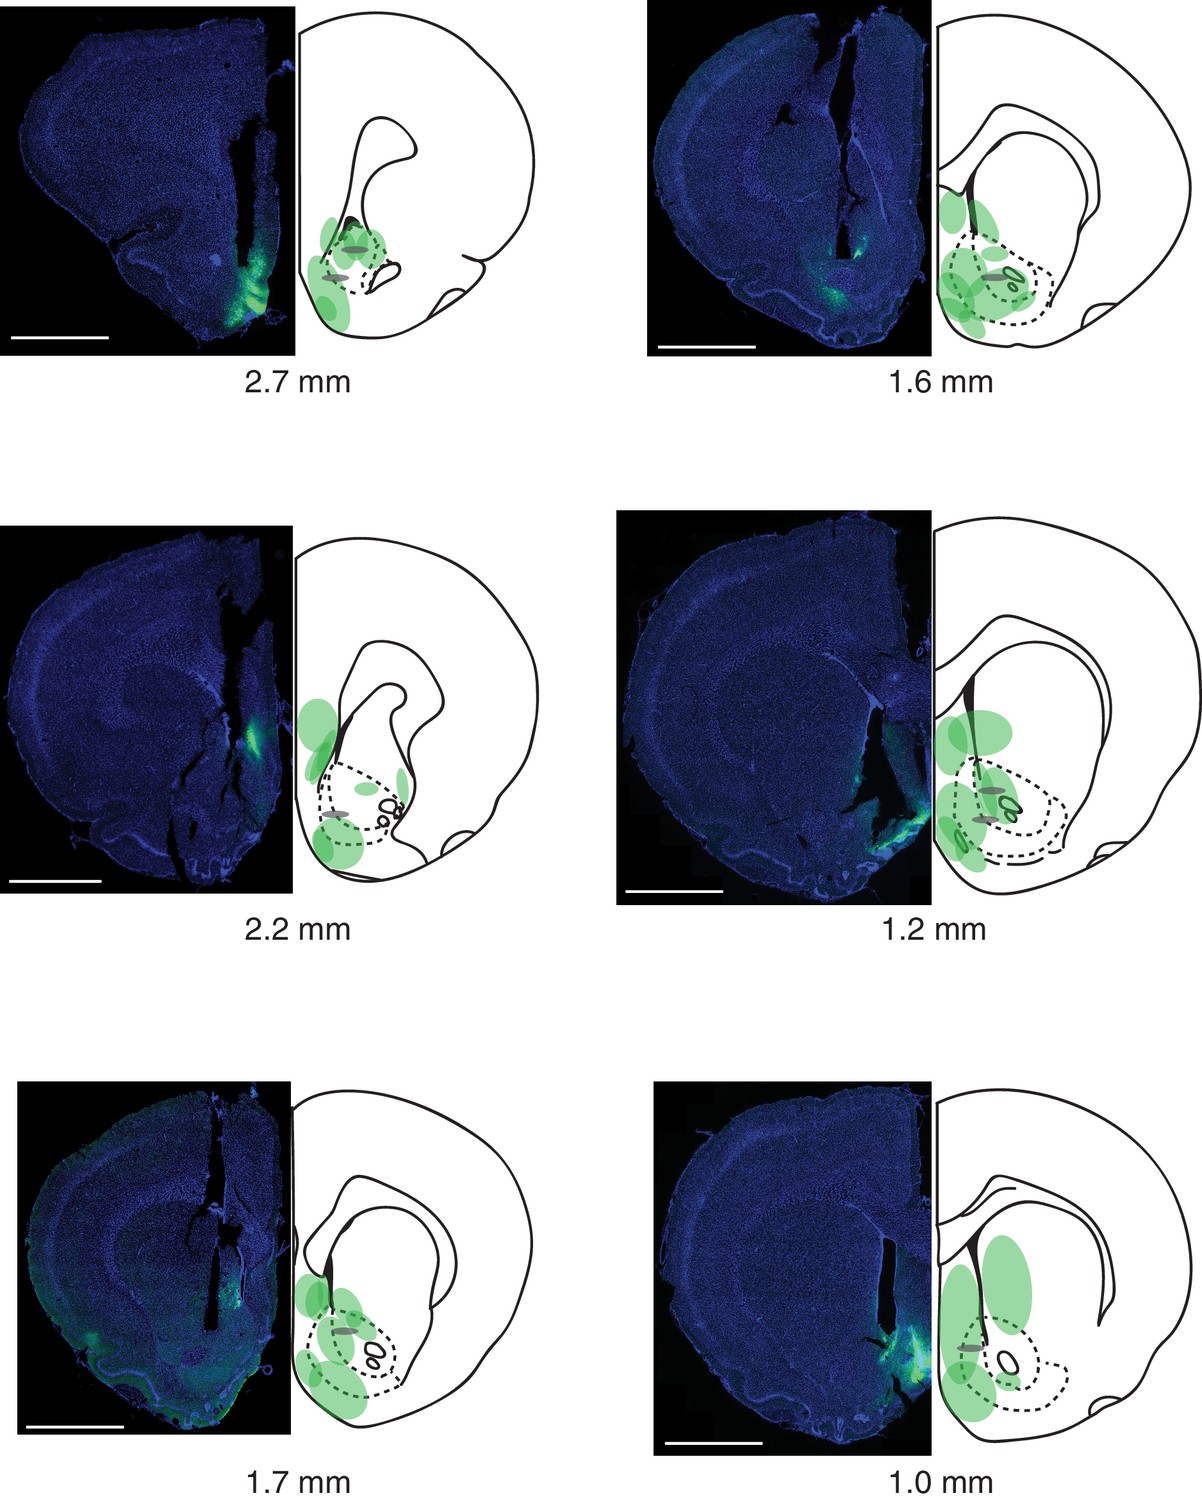
Virus infection, spread, and optical fiber placements are shown for all eight animals, across the anterior-posterior (AP) extent of the nucleus accumbens (AP coordinates are from Paxinos and Watson, 1998). Representative images are shown on the left, while the summaries are shown on the right. DAPI is in blue, GCaMP6m virus in green. The ends of the fibers are represented by gray ovals. Scale bar: 2 mm.
Figure 5
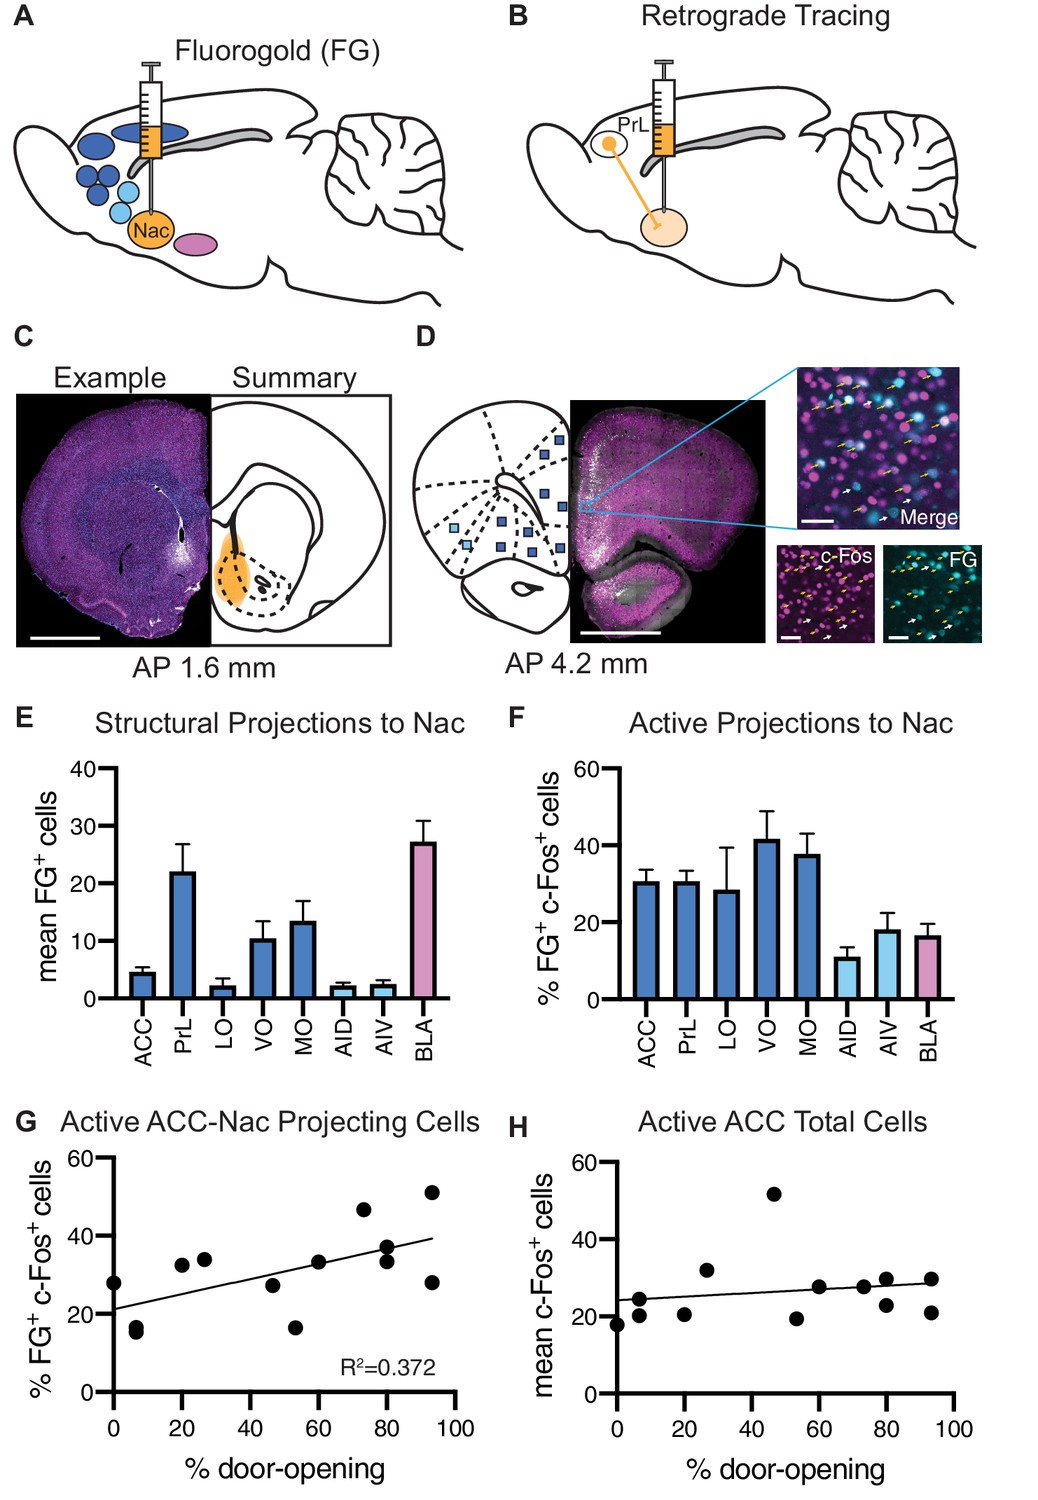
Analysis of structural projections to the nucleus accumbens (Nac) co-labeled for c-Fos.
Structural inputs to the Nac and their corresponding activity during the helping behavior test (HBT). (A) Schematic of a retrograde injection into the Nac and the input regions that were analyzed. (B) Diagram of retrograde tracing labeling cells in the prelimbic cortex (PrL) that project to the Nac. (C) On left: example Fluoro-Gold (FG) injection. FG is in blue, c-Fos in magenta. On right: summary of all FG injections. Scale bar: 2 mm. Coordinates are anterior-posterior from Bregma Paxinos and Watson, 1998. (D) On left: an example coronal section containing regions of interest (ROIs) that to project to the Nac. On right: a fluorescent image of a PrL ROI containing FG+ cells (blue) and c-Fos+ cells (magenta). ROI scale bar: 50 µm. (E) Average number of FG+ cells for each brain ROI. (F) Percent of FG+ cells that were co-localized with c-Fos, for each region. (G) The percent of FG+ cells co-localized with c-Fos in the anterior cingulate cortex (ACC) positively correlated with the percent of door-openings across testing sessions. (H) The average number of c-Fos+ cells in the ACC did not correlate with the percent of door-openings.
Figure 6
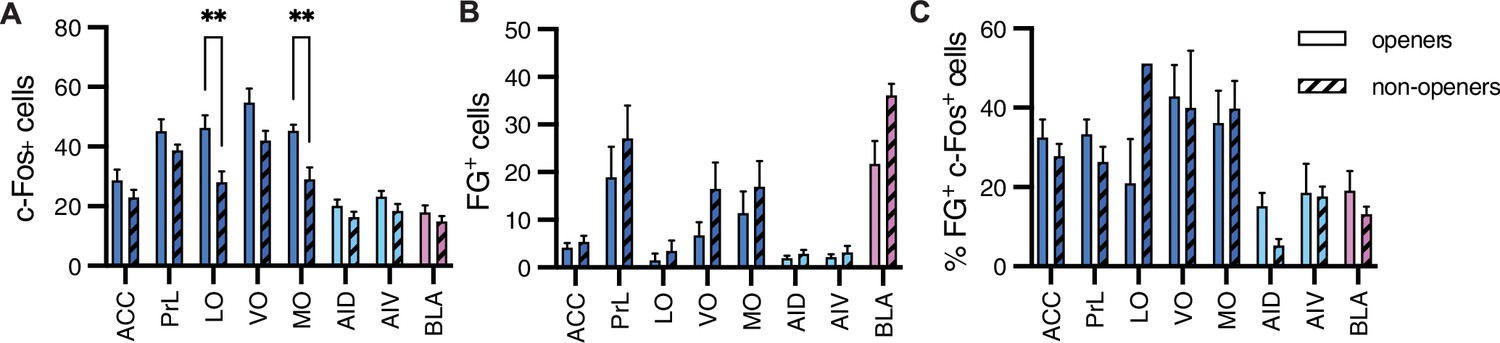
Comparison between openers and non-openers.
Higher c-Fos levels in the orbitofrontal cortex were observed for openers than for non-openers. (A) A comparison of total c-Fos numbers between five non-openers and eight openers in the retrograde experiment for rats tested with ingroup members. No difference was significant for the total FG+ numbers signifying structural connections (B) or the percent of co-labeled c-Fos+/FG+ cells (C) for these populations.
Videos
Video 1
Video demonstrating fiber photometry recording of a rat tested with an ingroup member.
The video shows nucleus accumbens (Nac) activity increases when the free rat approaches a trapped ingroup member.
Tables
Key resources table
| Reagent type (species) or resource | Designation | Source or reference | Identifiers | Additional information |
|---|---|---|---|---|
| Strain, strain background (Rattus norvegicus) | Sprague–Dawley Rat | Charles River Labs | Charles River 001; RRID:RGD_10395233 | |
| Strain, strain background (Rattus norvegicus) | Long–Evans Rat | Envigo | Envigo: HsdBlue:LE; RRID:RGD_5508398 | |
| Recombinant DNA reagent (virus strains) | AAV-hSyn-GCaMP6m | Addgene | Addgene: 131004; RRID:Addgene_131004 | |
| Antibody | Rabbit anti-cFos primary antibody | Millipore Sigma | Millipore: ABE457; RRID:AB_2631318 | IHC (1:1000) |
| Antibody | Donkey anti-rabbit IgG Alexa Fluor 488 secondary antibody | Jackson ImmunoResearch Labs | Cat#: 711-545-152; RRID:AB_2313584 | IHC (1:500) |
| Chemical compound, drug | Fluoro-Gold | Fluorochrome | RRID:AB_2314408 | |
| Software, algorithm | MATLAB | MathWorks | RRID:SCR_001622 | |
| Software, algorithm | Zen | Zeiss | RRID:SCR_013672 | |
| Software, algorithm | Fiji | NIH | RRID:SCR_002285 |
Additional files
-
Supplementary file 1
Detailed list of brain regions used in the figures.
- https://cdn.elifesciences.org/articles/65582/elife-65582-supp1-v1.docx
-
Supplementary file 2
Means and confidence intervals for brain-wide c-Fos numbers across conditions.
- https://cdn.elifesciences.org/articles/65582/elife-65582-supp2-v1.docx
-
Supplementary file 3
Means and confidence intervals for c-Fos numbers per brain region.
- https://cdn.elifesciences.org/articles/65582/elife-65582-supp3-v1.docx
-
Supplementary file 4
Set of parameters used in a series of multinomial regression tests.
Combinations of clustering algorithms, parameters, and subsets of data used in Figure 3D. ‘Cluster group’ was used to obtain the cluster assignments for each brain region. ‘Reference group’ was the control group in the multinomial logistic regression. The ‘weighted’ column indicates whether weights (correlations) between brain regions were taken into account while performing clustering. ‘All’: all groups; ‘rest’: all conditions except ingroup and outgroup; ‘baseline’: untested baseline condition. The thresholds of percentile rank, p-value, and absolute r value in the parameter column were applied to the covariance matrix of the c-Fos data in the cluster group before feeding it into the selected clustering algorithm.
- https://cdn.elifesciences.org/articles/65582/elife-65582-supp4-v1.docx
-
Transparent reporting form
- https://cdn.elifesciences.org/articles/65582/elife-65582-transrepform-v1.docx
Download links
A two-part list of links to download the article, or parts of the article, in various formats.
Downloads (link to download the article as PDF)
Open citations (links to open the citations from this article in various online reference manager services)
Cite this article (links to download the citations from this article in formats compatible with various reference manager tools)
Neural correlates of ingroup bias for prosociality in rats
eLife 10:e65582.
https://doi.org/10.7554/eLife.65582


