Tiled-ClickSeq for targeted sequencing of complete coronavirus genomes with simultaneous capture of RNA recombination and minority variants
- Department of Biochemistry and Molecular Biology, The University of Texas Medical Branch, United States
- ClickSeq Technologies LLC, United States
- World Reference Center for Emerging Viruses and Arboviruses, University of Texas Medical Branch, United States
- Department of Microbiology and Immunology, The University of Texas Medical Branch, United States
- Department of Pediatrics, University of Texas Medical Branch, United States
- Department of Pathology, University of Texas Medical Branch, United States
- Institute for Human Infections and Immunity, University of Texas Medical Branch, United States
- Next-Generation Sequencing Core, The University of Texas Medical Branch, United States
- Sealy Centre for Structural Biology and Molecular Biophysics, University of Texas Medical Branch, United States
Figures
Figure 1
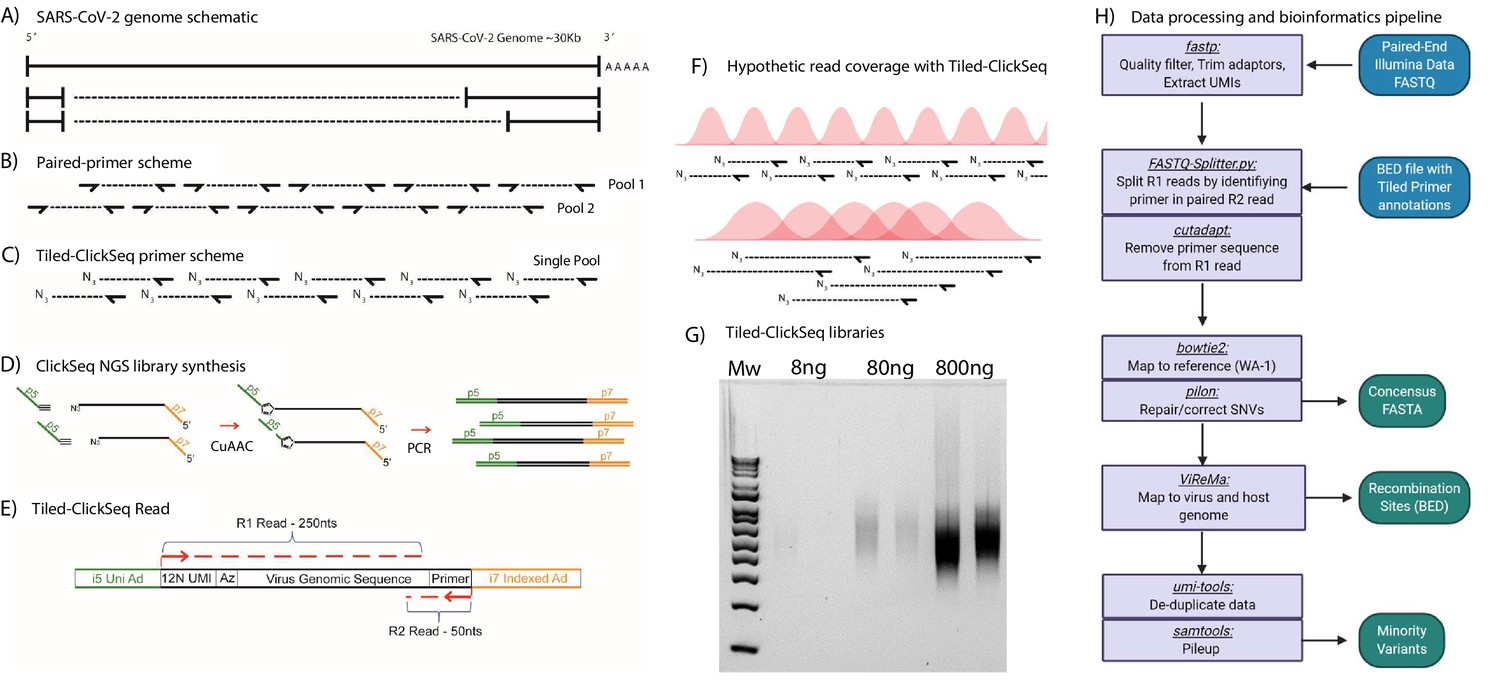
Schematic of Tiled-ClickSeq and computational pipeline: (A) Schematic of SARS-CoV-2 genome with two examples of sub-genomic mRNAs.
(B) Paired-primer approaches typically generate short amplicons flanked by upstream and downstream primers that are PCR amplified in non-overlapping pools. (C) Tiled-ClickSeq uses a single pool of primers at the reverse-transcription step with the upstream site generated by stochastic termination by azido-nucleotides. (D) 3’-Azido-blocked single-stranded cDNA fragments are ‘click-ligated’ using copper-catalyzed azide alkyne cycloaddition (CuAAC) to hexynyl functionalized Illumina i5 sequencing adaptors. Triazole-linked ssDNA is PCR amplified to generate a final cDNA library. (E) The structure of the final cDNA is illustrated indicating the presence of the i5 and i7 adaptors, the 12 N unique molecular identifier (UMI), the expected location of the triazole linkage, and the origins of the cDNA in the reads including the tiled primer-derived DNA, which is captured using paired-end sequencing. (F) The hypothetical read coverage over a viral genome is indicated in red, yielding overlapping ‘saw-tooth’ patterns of sequencing coverage. Longer fragment lengths with more extensive overlapping can be obtained using decreased AzNTP:dNTP ratios. (G) Final cDNA libraries are analyzed and size-selected by gel electrophoresis (2 % agarose gel). Duplicates of libraries synthesized from 8, 80, and 800 ng of input SARS-CoV-2 RNA input are shown. (H) Flowchart of the data processing and bioinformatic pipeline. Input data is in Blue, output data are in Green, scripts/processes are Purple.
Figure 2 with 2 supplements
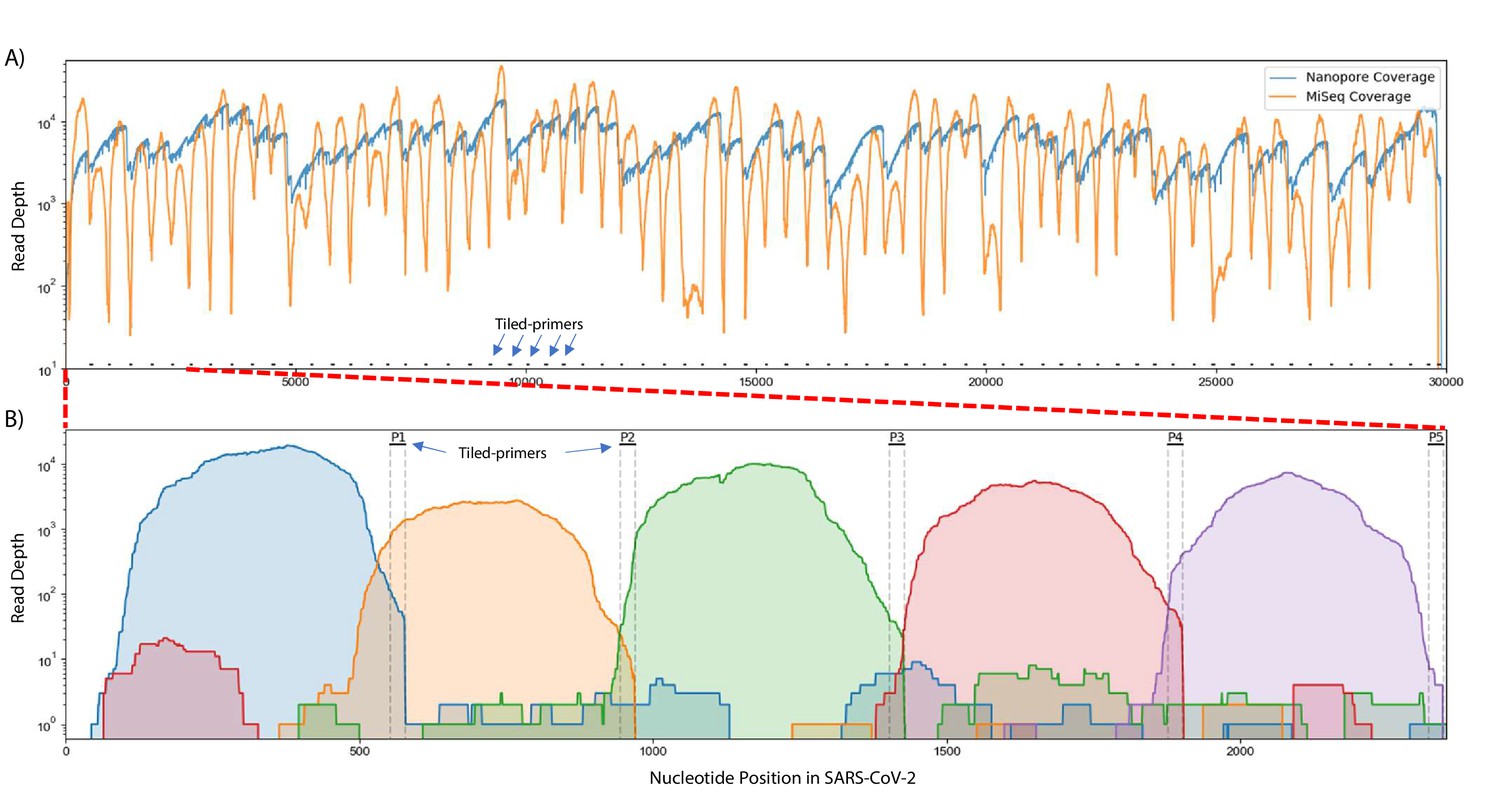
Read coverage over the SARS-CoV-2 genome using Tiled-ClickSeq.
(A) Read coverage obtained from Tiled-ClickSeq over the whole viral genome is depicted when sequencing using an Illumina MiSeq (orange) or on an Oxford Nanopore Technologies MinION device (blue). A ‘saw-tooth’ pattern of coverage is observed with ‘teeth’ upstream of tiled-primers, indicated at the bottom of the plot by short black lines. (B) Zoomed in read coverage of nts 1–2400 of the SARS-CoV-2 genome with coverage of Illumina MiSeq reads from five individual primers coloured to illustrate coverage from downstream amplicons overlapping the primer-binding sites of upstream tiled-primers (Blue: Read coverage from primer 1; Orange: coverage from primer 2; Green: coverage from primer 3; Red: coverage from primer 4; Purple: coverage from primer 5).
Figure 2—figure supplement 1
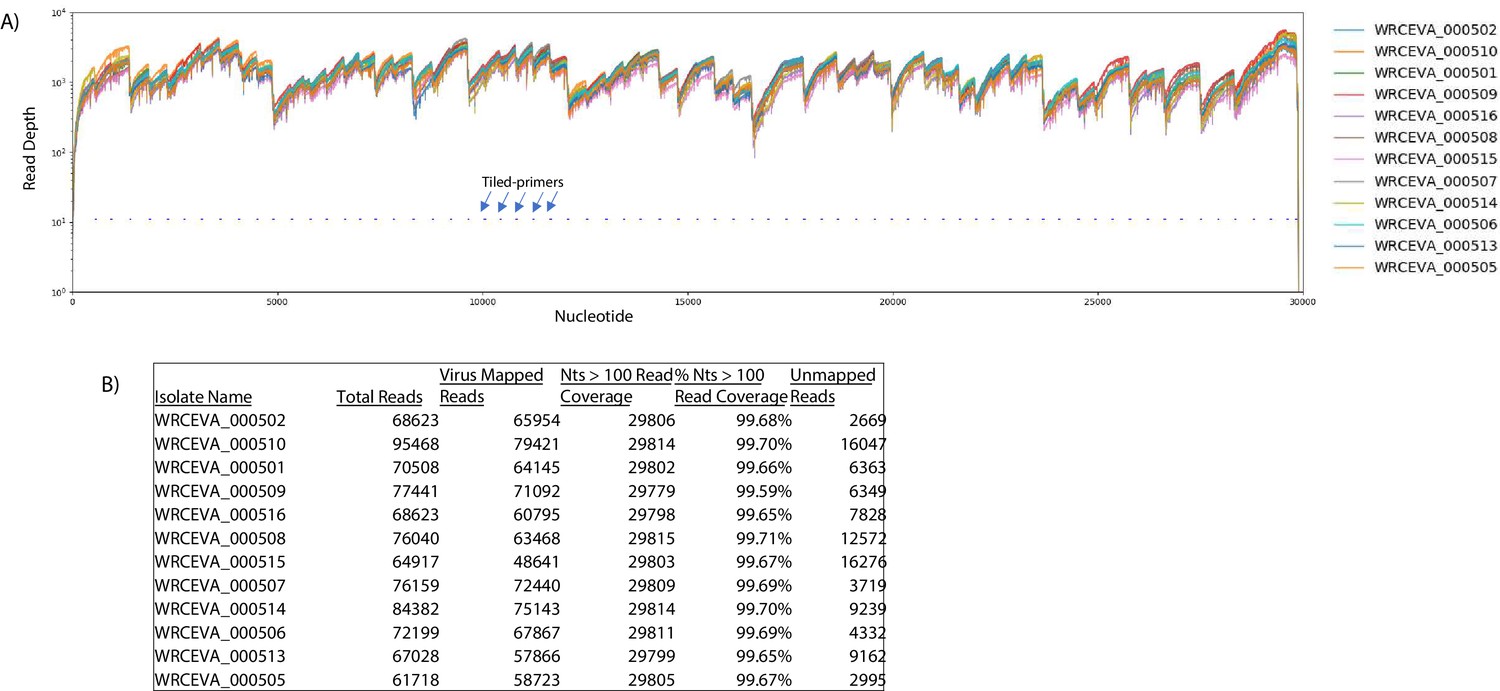
Read coverage of tiled nanopore data over 12 SARS-CoV-2 isolates.
(A) Read coverage obtained from Tiled-ClickSeq over the whole viral genome for 12 World Reference Center for Emerging Viruses and Arboviruses (WRCEVA) isolates is depicted when using an Oxford Nanopore Technologies MinION device. Tiled-primers (v1) are indicated at the bottom of the plot by short blue lines. (B) Read count mapping statistics for each isolate are shown in the table.
Figure 2—figure supplement 2
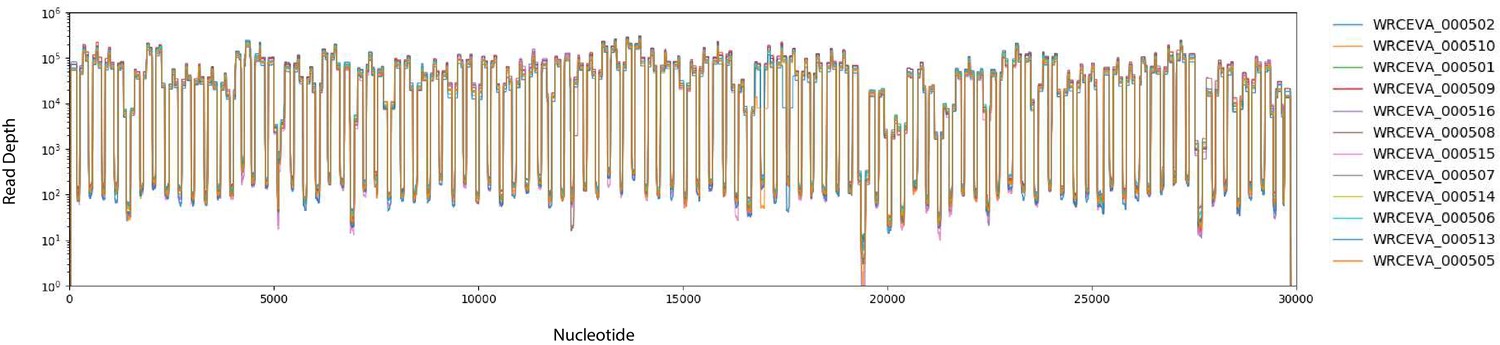
Read coverage of tiled ARTIC data over 12 SARS-CoV-2 isolates: (A) Read coverage obtained from ARTIC sequencing protocol over the whole viral genome for 12 WRCEVA isolates is depicted when sequenced on an Illumina NextSeq.
Figure 3
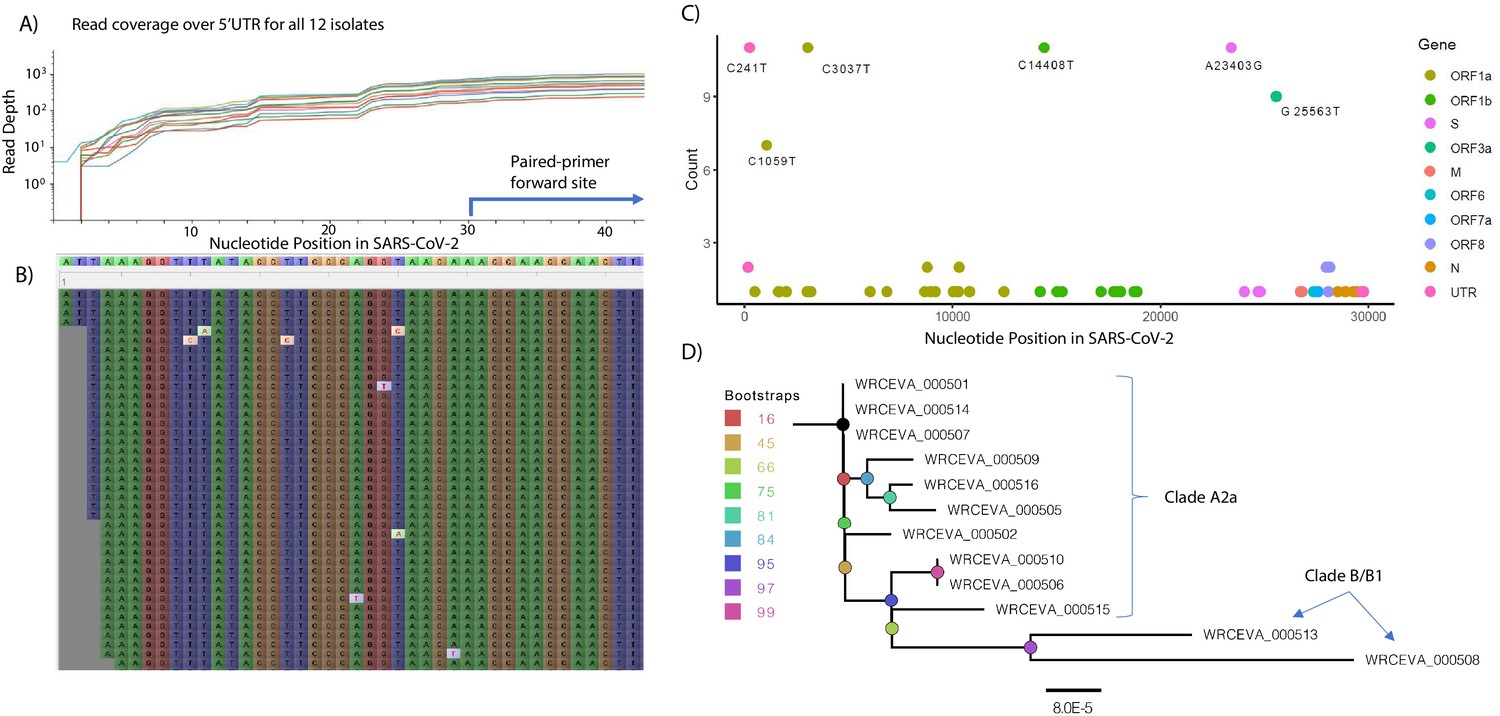
Genome Reconstruction of 12 SARS-CoV-2 isolates deposited at the World Reference Center for Emerging Viruses and Arboviruses (WRCEVA).
(A) Read coverage is depicted over the 5’ UTR of the SARS-CoV-2 genome for each isolate revealing capture of this region. The 5’-most primer from the ARTICv3 protocol at nts-30–54 is illustrated. (B) Snapshot of read data from Tiled-ClickSeq is depicted using the Tablet Sequencing Viewer from WRCEVA_000508 over the same region of the 5’UTR as A. (C) The most common single-nucleotide variants (SNVs) found in complete genome reconstructions from all 12 isolates are illustrated and colour-coded to depict the underlying viral protein. (D) Phylogenetic tree of 12 WRCEVA isolates with their corresponding clade indicated.
Figure 4
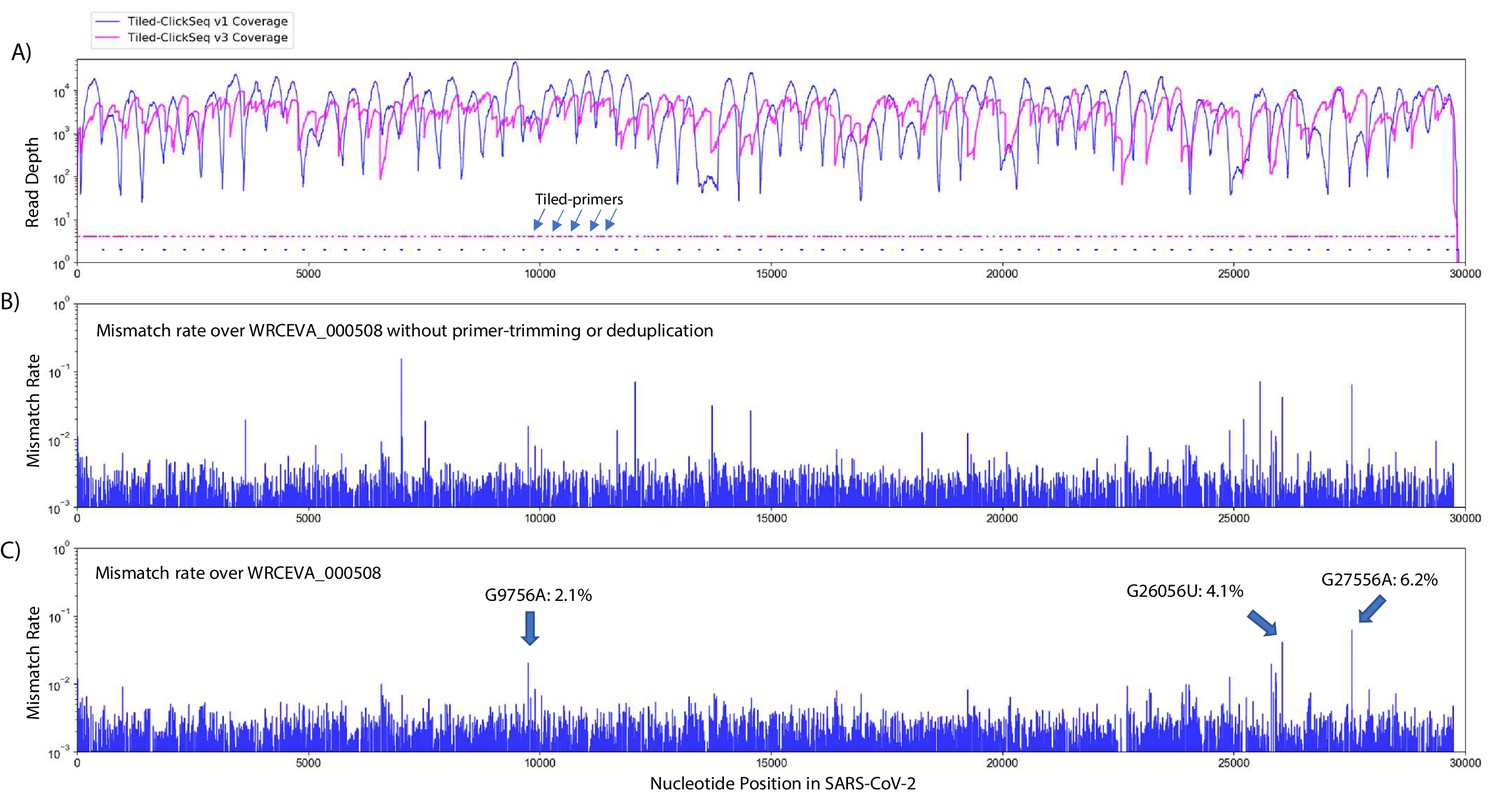
Additional tiled-primers improves read coverage and allows identification of minority variants.
(A) Read coverage obtained from Tiled-ClickSeq over the whole viral genome is depicted using an Illumina MiSeq when using the original primers as in Figure 2 (v1 - blue) or with an additional 326 tiled-primers (v3 - pink). Tiled-primers are indicated at the bottom of the plot by short blue (v1) or pink (v3) lines. (B) The rates of mismatching nucleotides found in mapped NGS reads is depicted across the SARS-CoV-2 genome for isolate WRECVA_000508 prior to trimming the tiled primers from forward/‘R1’ reads and without PCR deduplication. (C) The rates of mismatching is also depicted after data quality processing to remove PCR duplicates and primer-derived nucleotides in the reads, revealing three minority variants in this sample with frequencies > 2%.
-
Figure 4—source data 1
The frequency of all mapped nucleotides at each genome coordinate for each WRCEVA isolate is provided.
The reference genome, nucleotide coordinate and expected reference Nucleotide is provided. Total read coverage and the numbers of each non-reference nucleotide are also shown. Finally, the mismatch/error rate at each site is provided which reveals minority variants in each isolate.
- https://cdn.elifesciences.org/articles/68479/elife-68479-fig4-data1-v1.xlsx
Figure 5 with 1 supplement

Tiled-ClickSeq identifies sub-genomic mRNAs, structural variants, and defective-RNAs.
(A) A table of the most common RNA recombination events found using Tiled-ClickSeq to study ‘World Reference Center for Emerging Viruses and Arboviruses’ (WRCEVA) isolates. The recombination junctions are indicated on the left of the table, with their relative frequencies indicated in the table and colour-matched for each sample analyzed. All canonical sgmRNAs are found with their open-reading frame (ORF) indicated, in addition to one non-canonical sgmRNA (*). Three common structural variants including two deletions in spike protein and a deletion in ORF7a were also detected. (B) Unique RNA recombination events are plotted for 16 WRCEVA isolates as a scatter plots whereby the upstream ‘donor’ site is plotted on the y-axis and a downstream ‘acceptor’ site is plotted on x-axis. The read count for each unique RNA recombination event is indicated by the size of the point, while the number of samples in which this each RNA recombination event is found is indicated by the colour-bar. Insertions/duplication/back-splicing events are found above the x = y axis, while deletions and RNA recombination events yielding sgmRNAs are found below.
-
Figure 5—source data 1
Snapshot of Tiled-ClickSeq reads from icSARS-CoV-2 delta-PRRA.
- https://cdn.elifesciences.org/articles/68479/elife-68479-fig5-data1-v1.zip
Figure 5—figure supplement 1

Integrative Genomics Viewer (IGV) snapshot of Tiled-ClickSeq data over icSARS-CoV-2 delta PRRA: A full-view of the SARS-CoV-2 genome with mapped Tiled-ClickSeq reads is depicted using Integrative Genomics Viewer.
Individual reads are illustrated with short grey lines. Recombination events mapped by ViReMa are illustrated by light-blue lines. Common variants engineered into the icSARS clone are indicated by vertical coloured striations.
Figure 6 with 1 supplement
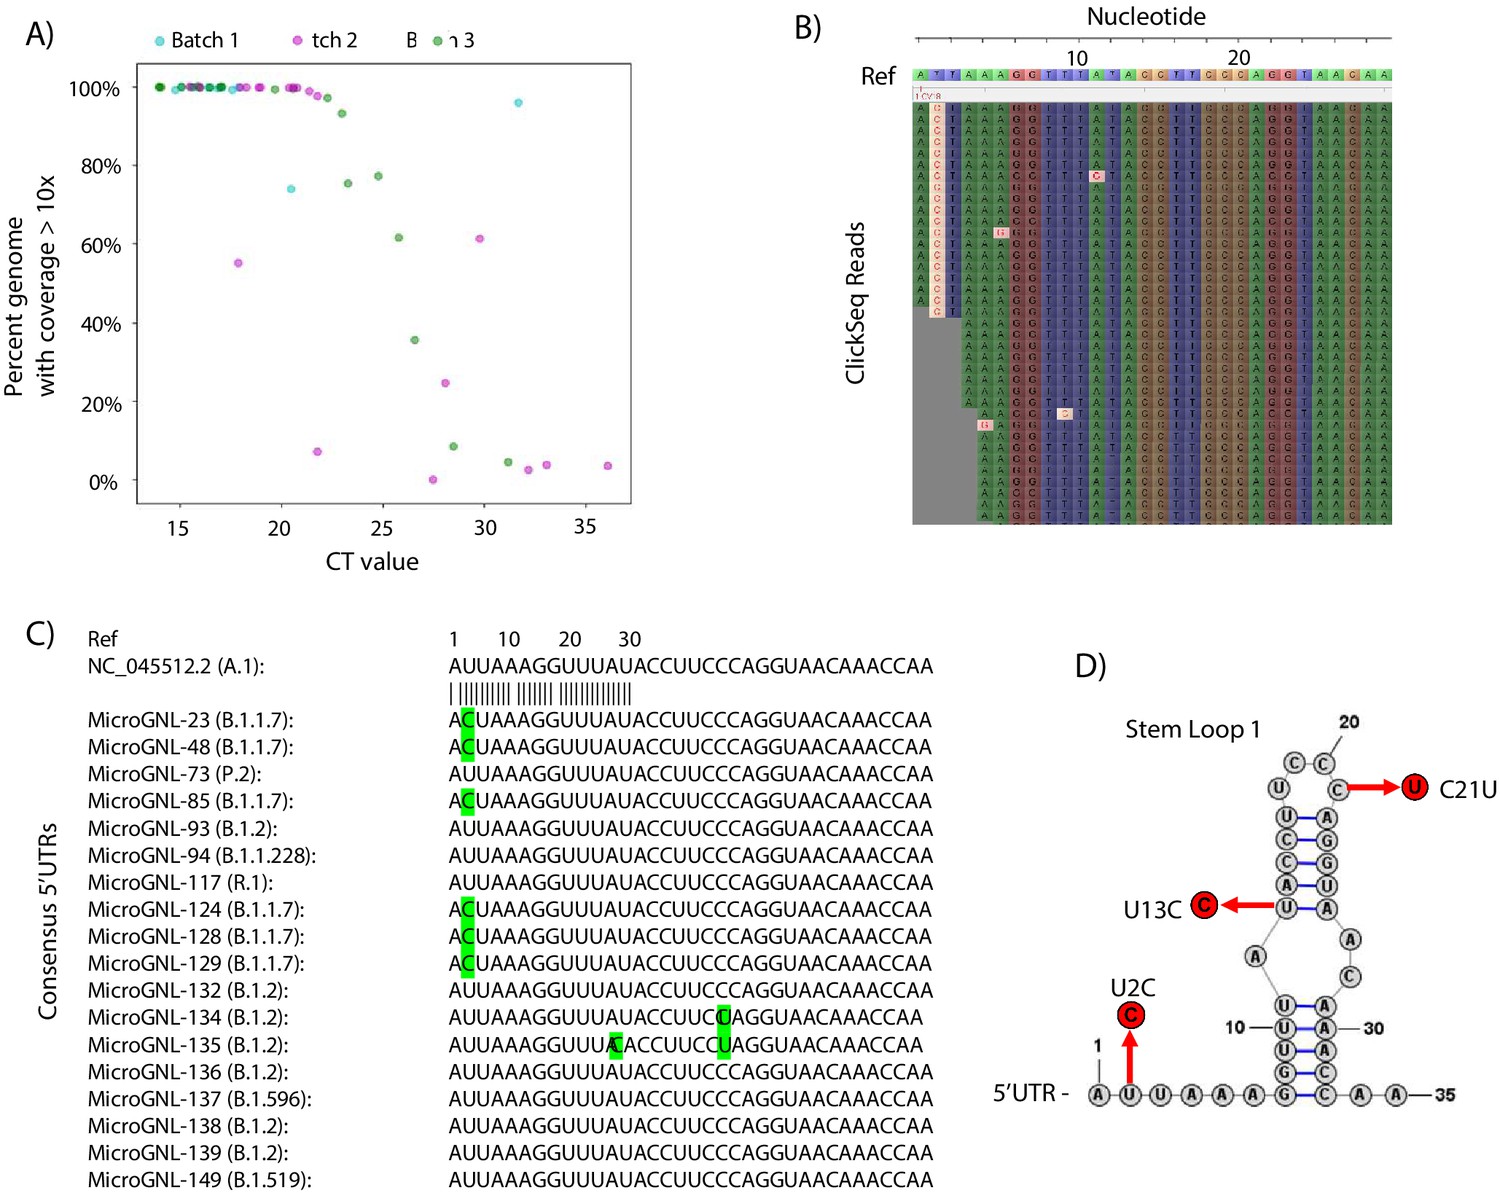
Tiled-ClickSeq for surveillance of SARS-CoV-2 from nasopharyngeal (NP) swabs collected during routine diagnostics of COVID19 at UTMB.
(A) The percent genome coverage with greater than 10 reads is plotted as a function of the measured CT value (x-axis) for each clinical sample sequenced. Each point is colour-coded according to the batch of NGS libraries synthesized. (B) Sequence reads for one of the SARS-CoV-2 samples from the B.1.1.7 lineage are illustrated using Tablet sequence viewer to indicate the U to C transition at nt 2 (U2C) of the SARS-CoV-2 genome. (C) Sequence alignments of the 5’UTR of the consensus genomes of 18 clinical samples assayed illustrates the U2C SNVs found in each B.1.1.7 variant as well as a U13C and C21U in two other B.1.2 variants. (D) The structure of the first 35 nts of the SARS-CoV-2 5’UTR is illustrated which contains Stem Loop 1. The three SNVs identified in the consensus genomes of clinical samples are indicated.
Figure 6—figure supplement 1
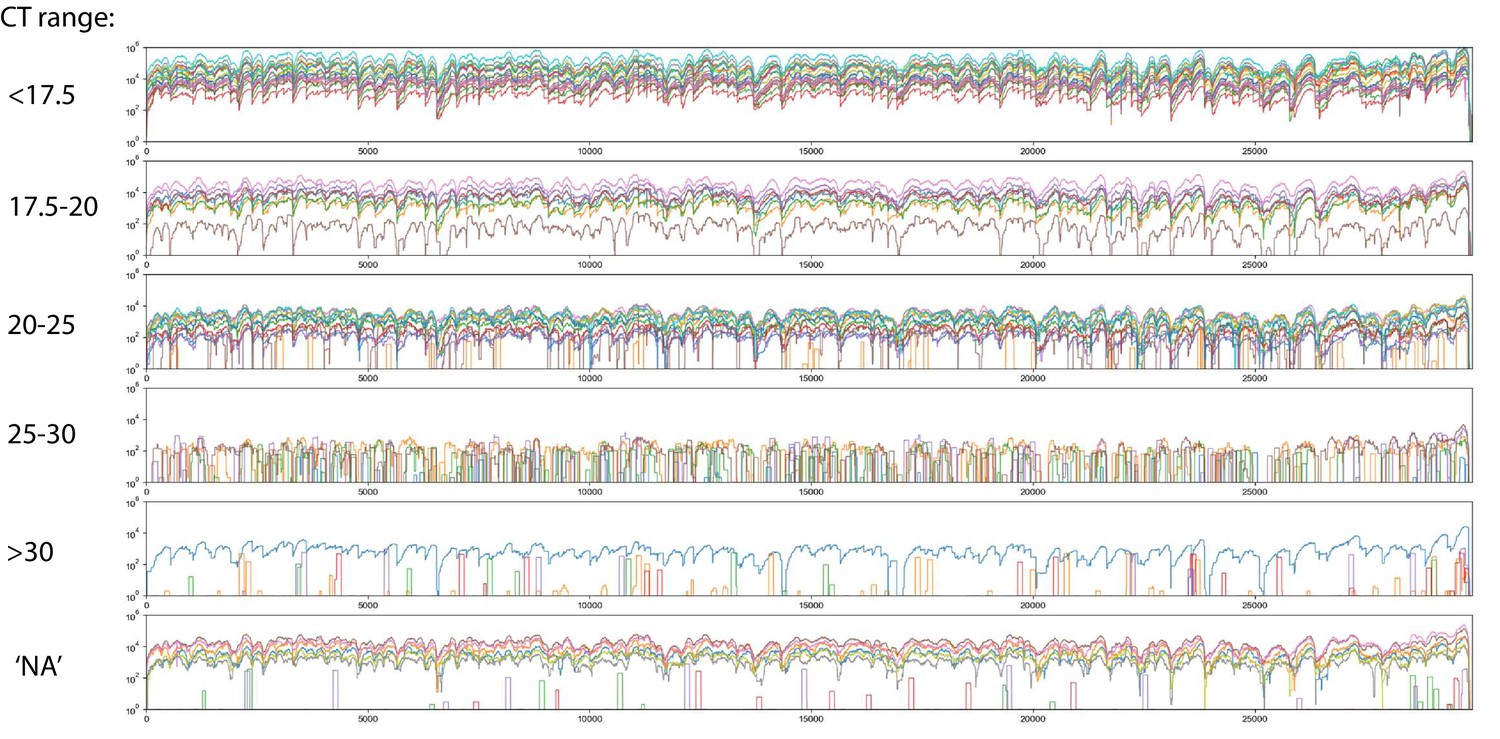
Read coverage of Tiled-ClickSeq data over 60 SARS-CoV-2 clinical specimens: Read coverage obtained from Tiled-ClickSeq over the whole viral genome for 60 SARS-CoV-2 clinical specimens is depicted when sequenced on an Illumina NextSeq.
Samples are batched depending upon their measure CT value, ( < 17.5, 17.5–20, 20–25, 25–30, > 30, and unmeasured: ‘NA’) and plotted separately in a colour-coded manner.
Figure 7 with 1 supplement
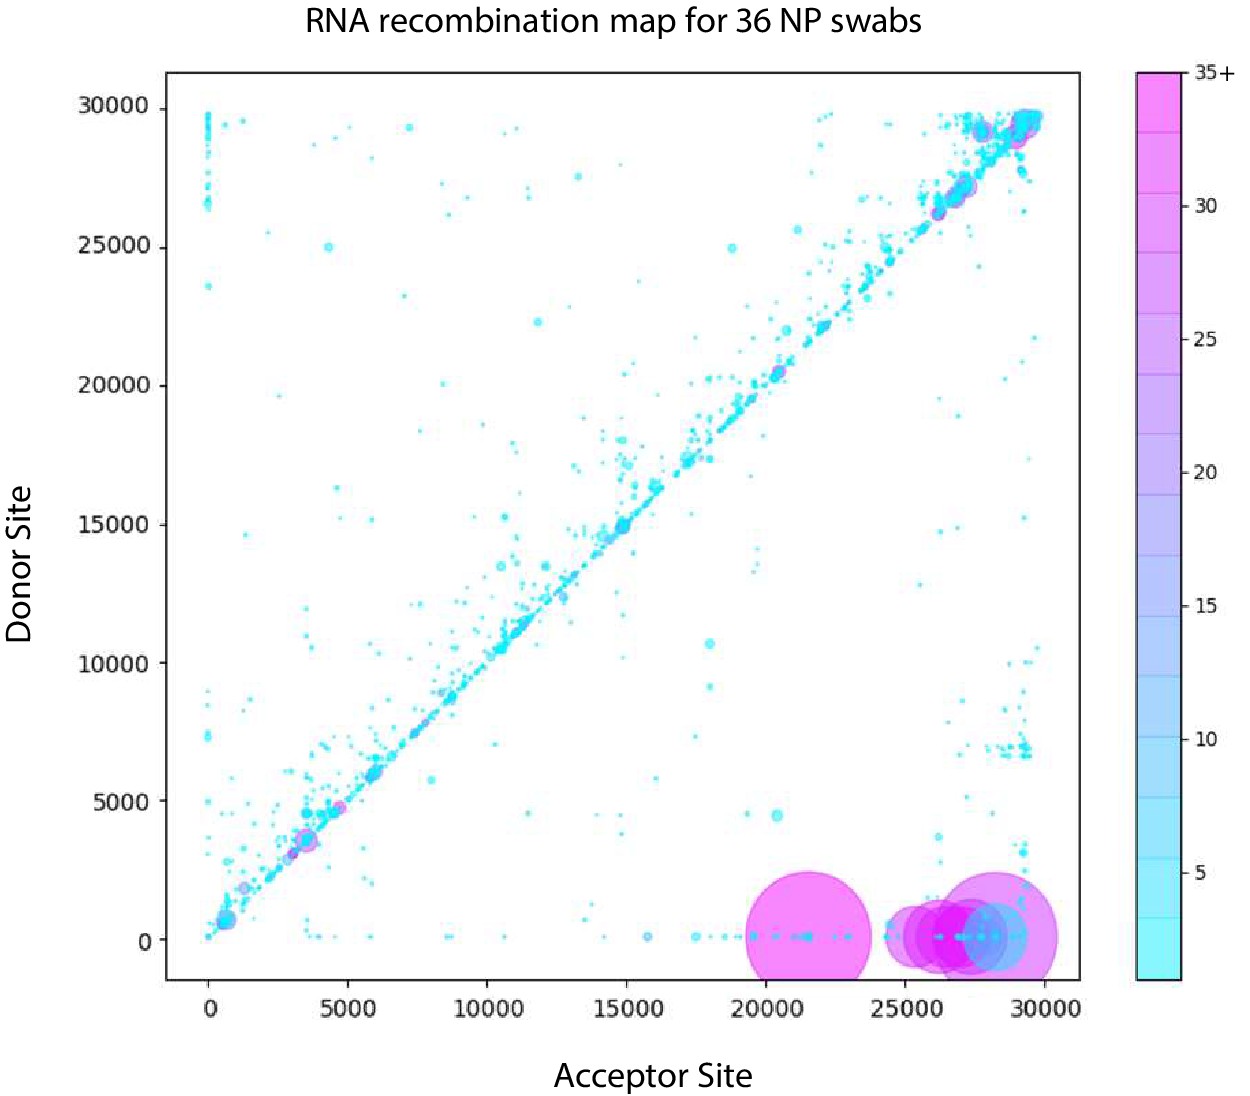
Tiled-ClickSeq identifies sub-genomic mRNAs, structural variants and Defective-RNAs in clinical samples of SARS-CoV-2.
Similarly to Figure 5B, unique RNA recombination events are plotted for 36 clinical samples as a scatterplot whereby the upstream ‘donor’ site is plotted on the y-axis and a downstream ‘acceptor’ site is plotted on x-axis using the WA-1 reference coordinates for each sample. The read count for each unique RNA recombination event is indicated by the size of the point, while the number of samples in which this each RNA recombination event is found is indicated by the colour-bar. Insertions/duplication/back-splicing events are found above the x = y axis, while deletions and RNA recombination events yielding sgmRNAs are found below.
-
Figure 7—source data 1
BED files of RNA recombination events detected by ViReMa in the Tiled-ClickSeq data from each WRCEVA isolate and clinical sample.
- https://cdn.elifesciences.org/articles/68479/elife-68479-fig7-data1-v1.zip
Figure 7—figure supplement 1
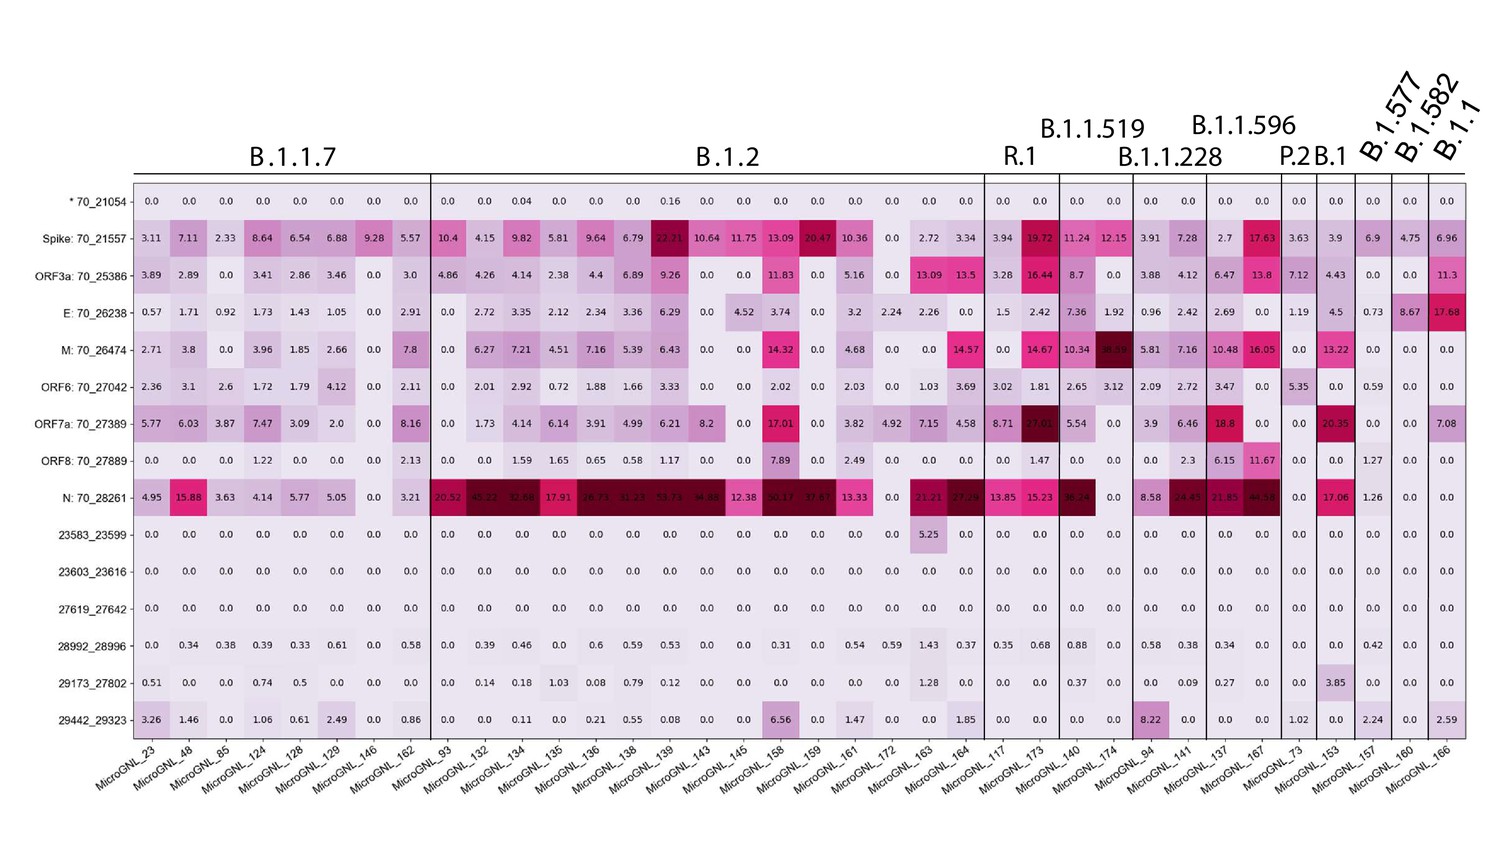
Tiled-ClickSeq identifies sub-genomic mRNAs, structural variants of clinical samples of SARS-CoV-2.
A table of the most common RNA recombination events found using Tiled-ClickSeq in this study, analogues to Figure 5A. The recombination junctions are indicated on the left of the table, with their relative frequencies indicated in the table and colour-matched for each sample analyzed. All canonical sgmRNAs are found with their open-reading frame (ORF) indicated, in addition to one non-canonical sgmRNAs (*). Three common structural variants including two deletions in spike protein and a deletion in ORF7a are also shown.
Author response image 1
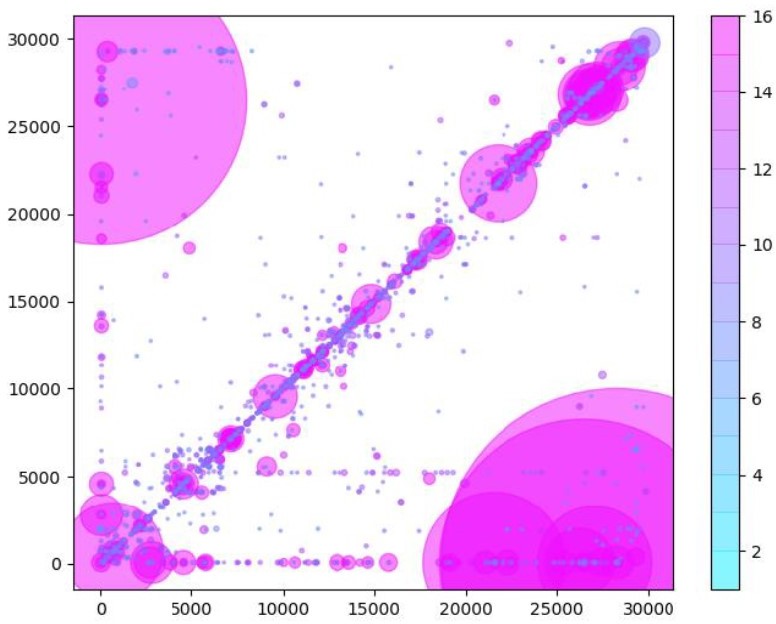
Similarly to Figure 5B in the manuscript, unique RNA recombination events are plotted for WRCEVA samples as a scatter plots whereby the upstream ‘donor’ site is plotted on the y-axis and a downstream ‘acceptor’ site is plotted on x-axis.
The read count for each unique RNA recombination event is indicated by the size of the point, while the number of samples in which this each RNA recombination event is found is indicated by the colour-bar. Insertions/duplication/back-splicing events are found above the x=y axis, while deletions and RNA recombination events yielding sgmRNAs are found in Author response image 2.
Author response image 2
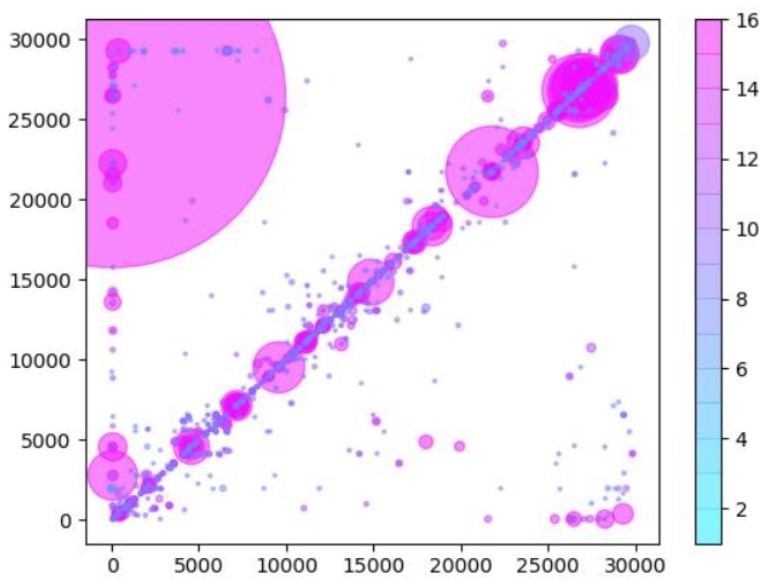
Same as Author response image 1, except that read data used in the analysis have been trimmed by 25nts to remove any potential primer-derived sequences that may give rise to artifactual chimeric reads.
Tables
Table 1
Read counts and mapping rates for random-primed versus Tiled-ClickSeq approaches.
| Sample | CT | ClickSeq reads | Virus mapped | % Viral Reads | Tiled v1 reads | Virus mapped | % Viral Reads |
|---|---|---|---|---|---|---|---|
| WRCEVA_00501 | 12.9 | 4,665,869 | 116,036 | 2.5% | 2,359,795 | 2,204,750 | 93.4% |
| WRCEVA_00502 | 12.9 | 4,989,513 | 118,260 | 2.4% | 1,962,581 | 1,820,925 | 92.8% |
| WRCEVA_00505 | 12.7 | 3,894,325 | 71,809 | 1.8% | 2,779,672 | 2,482,854 | 89.3% |
| WRCEVA_00506 | 12.5 | 4,979,989 | 108,532 | 2.2% | 2,395,750 | 2,148,256 | 89.7% |
| WRCEVA_00507 | 12.9 | 5,659,073 | 161,059 | 2.8% | 2,056,670 | 1,867,012 | 90.8% |
| WRCEVA_00508 | 16.8 | 3,987,009 | 91,452 | 2.3% | 1,787,418 | 1,433,005 | 80.2% |
| WRCEVA_00509 | 17.1 | 4,057,928 | 57,424 | 1.4% | 2,202,661 | 1,856,633 | 84.3% |
| WRCEVA_00510 | 16.2 | 5,328,829 | 65,281 | 1.2% | 2,040,332 | 1,601,544 | 78.5% |
| WRCEVA_00513 | 16.0 | 4,391,175 | 69,169 | 1.6% | 1,641,213 | 1,455,991 | 88.7% |
| WRCEVA_00514 | 12.9 | 4,340,084 | 84,211 | 1.9% | 2,089,241 | 1,902,748 | 91.1% |
| WRCEVA_00515 | 15.7 | 5,416853 | 102,179 | 1.9% | 2,205,166 | 1,915,129 | 86.8% |
| WRCEVA_00516 | 17.4 | 4,290,929 | 61,017 | 1.4% | 1,988,939 | 1,715,448 | 86.2% |
Table 2
Minority variants and rates ( > 2%) found across 16 WRCEVA isolates.
| Sample | Nt | Nuc | ReadDepth | A | U | G | C | VariantRate | Location | Result |
|---|---|---|---|---|---|---|---|---|---|---|
| WRCEVA_000501 | 12,049 | C | 2,116 | 0 | 95 | 1 | 2020 | 4.5% | ORF1ab | N3928K |
| WRCEVA_000502 | 10,207 | C | 2,240 | 0 | 118 | 0 | 2,122 | 5.3% | - | - |
| WRCEVA_000502 | 16,050 | U | 3,853 | 0 | 3,322 | 0 | 531 | 13.8% | - | - |
| WRCEVA_000502 | 17,489 | A | 4,597 | 4,433 | 162 | 1 | 1 | 3.6% | ORF1ab | E5742V |
| WRCEVA_000502 | 21,526 | A | 8,749 | 6,508 | 0 | 2,240 | 1 | 25.6% | ORF1ab | I7088V |
| WRCEVA_000503 | 14,220 | C | 1,638 | 1 | 463 | 0 | 1,174 | 28.3% | - | - |
| WRCEVA_000504 | 1,556 | A | 2,828 | 2,499 | 0 | 328 | 1 | 11.6% | ORF1ab | I431V |
| WRCEVA_000504 | 27,925 | C | 2,857 | 0 | 134 | 0 | 2,723 | 4.7% | ORF8 | T11I |
| WRCEVA_000507 | 19,515 | A | 2,393 | 2,295 | 1 | 97 | 0 | 4.1% | - | - |
| WRCEVA_000508 | 9,756 | G | 1,376 | 28 | 0 | 1,348 | 0 | 2.1% | ORF1ab | R3164H |
| WRCEVA_000508 | 26,056 | G | 2092 | 0 | 86 | 2006 | 0 | 4.1% | ORF3a | D222Y |
| WRCEVA_000508 | 27,556 | G | 2066 | 128 | 0 | 1938 | 0 | 6.2% | ORF7a | A55T |
| WRCEVA_000509 | 11,956 | C | 1962 | 0 | 199 | 0 | 1,763 | 10.1% | - | - |
| WRCEVA_000509 | 17,245 | C | 4,062 | 2 | 470 | 0 | 3,590 | 11.6% | ORF1ab | R5661C |
| WRCEVA_000509 | 18,005 | U | 5,408 | 1 | 4,949 | 458 | 0 | 8.5% | ORF1ab | L5915R |
| WRCEVA_000509 | 25,569 | U | 3,448 | 4 | 3,326 | 113 | 5 | 3.5% | - | - |
| WRCEVA_000509 | 27,919 | U | 839 | 0 | 809 | 0 | 30 | 3.6% | ORF8 | I9T |
| WRCEVA_000509 | 28,767 | C | 2011 | 0 | 109 | 0 | 1902 | 5.4% | N | T165I |
| WRCEVA_000511 | 3,003 | U | 2,880 | 79 | 2,787 | 1 | 13 | 2.7% | ORF1ab | V913E |
| WRCEVA_000511 | 10,738 | U | 4,580 | 0 | 4,440 | 0 | 140 | 3.1% | - | - |
| WRCEVA_000511 | 25,892 | U | 133 | 0 | 130 | 0 | 3 | 2.3% | ORF3a | I167T |
| WRCEVA_000511 | 28,001 | G | 1,414 | 1 | 29 | 1,384 | 0 | 2.1% | - | - |
| WRCEVA_000513 | 27,046 | C | 5,539 | 0 | 138 | 0 | 5,401 | 2.5% | M | T175M |
| WRCEVA_000514 | 11,603 | A | 5,405 | 5,075 | 0 | 330 | 0 | 6.1% | ORF1ab | M3780V |
| WRCEVA_000514 | 26,526 | G | 525 | 0 | 20 | 505 | 0 | 3.8% | M | A2S |
Table 3
Micro-indels and rates ( > 2%) found across 16 WRCEVA isolates.
| Sample | MicroInDel | Nucs | VariantRate | Location | Result | |
|---|---|---|---|---|---|---|
| WRCEVA_000502 | Δ519^523 | UGGUU | 2.2% | ORF1AB | Frameshift | |
| WRCEVA_000504 | Δ29686^29,693 | CAGUGUGU | 3.5% | 3’UTR | - | |
| WRCEVA_000505 | Δ519^523 | UGGUU | 2.9% | ORF1AB | Frameshift | |
| WRCEVA_000506 | Δ519^523 | UGGUU | 3.8% | ORF1AB | Frameshift | |
| WRCEVA_000509 | Δ1237^1,239 | UCA | 2.9% | ORF1AB | ΔH325 | |
| WRCEVA_000510 | Δ686^694 | AAGUCAUUU | 5.1% | ORF1ab | ΔLSF141-143 | |
| WRCEVA_000511 | Δ519^523 | UGGUU | 3.7% | ORF1AB | Frameshift | |
| WRCEVA_000511 | Δ10811^10,813 | CUU | 3.1% | ORF1AB | ΔL3516 | |
| WRCEVA_000512 | Δ29750^29,759 | GAUCGAGUG | 10.0% | 3’UTR | - |
Key resources table
| Reagent type (species) or resource | Designation | Source or reference | Identifiers | Additional information |
|---|---|---|---|---|
| Chemical compound, drug | AzNTPs | BaseClick |
| |
| Sequence-based reagent | 5’-hexynyl-functionalized i5 oligo | IDT |
| |
| Sequence-based reagent | TCSv3 | This Paper | PCR Primers | Source data 1 |
| Software, algorithm | Bash and python3 text files | This Paper | .txt and.py files | Source data 2 |
Additional files
-
Transparent reporting form
- https://cdn.elifesciences.org/articles/68479/elife-68479-transrepform1-v1.docx
-
Source data 1
Annotations and sequences of tiled-primers used in this manuscript are provided in BED format.
- https://cdn.elifesciences.org/articles/68479/elife-68479-supp1-v1.zip
-
Source data 2
Batch scripts provided all computational tools and parameters used and python3 scripts used in this study are provided.
- https://cdn.elifesciences.org/articles/68479/elife-68479-supp2-v1.zip
-
Source data 3
A summary of all Single-Nucleotide Variants (SNVs) detected for all samples sequenced in this study are provided.
Each unique sample/isolate is listed, together with the SNVs relative to the WA-1 (NC_045512.2) strain in different NGS library preparation methods and sequencing platforms. The accession number for each reconstructed genome deposited in GenBank is also indicated.
- https://cdn.elifesciences.org/articles/68479/elife-68479-supp3-v1.xlsx
Download links
A two-part list of links to download the article, or parts of the article, in various formats.
Downloads (link to download the article as PDF)
Open citations (links to open the citations from this article in various online reference manager services)
Cite this article (links to download the citations from this article in formats compatible with various reference manager tools)
Tiled-ClickSeq for targeted sequencing of complete coronavirus genomes with simultaneous capture of RNA recombination and minority variants
eLife 10:e68479.
https://doi.org/10.7554/eLife.68479


