Rewiring of liver diurnal transcriptome rhythms by triiodothyronine (T3) supplementation
- Institute of Neurobiology, Center of Brain Behavior & Metabolism, University of Lübeck, Germany
- Department of Medical Biochemistry and Biophysics, Karolinska Institute, Sweden
- Department of Physiology, Institute of Bioscience, University of Sāo Paulo, Brazil
- Australian Centre for Health Services Innovation and Centre for Healthcare Transformation, School of Public Health and Social Work, Faculty of Health, Queensland University of Technology, Australia
- Institute of Experimental and Clinical Pharmacology, University Hospital Schleswig-Holstein, Germany
- School of Biomedical Sciences, Faculty of Medicine, University of Queensland, Australia
- Center of Brain Behavior & Metabolism, Institute for Endocrinology and Diabetes – Molecular Endocrinology, University of Lübeck, Germany
Figures
Figure 1 with 1 supplement
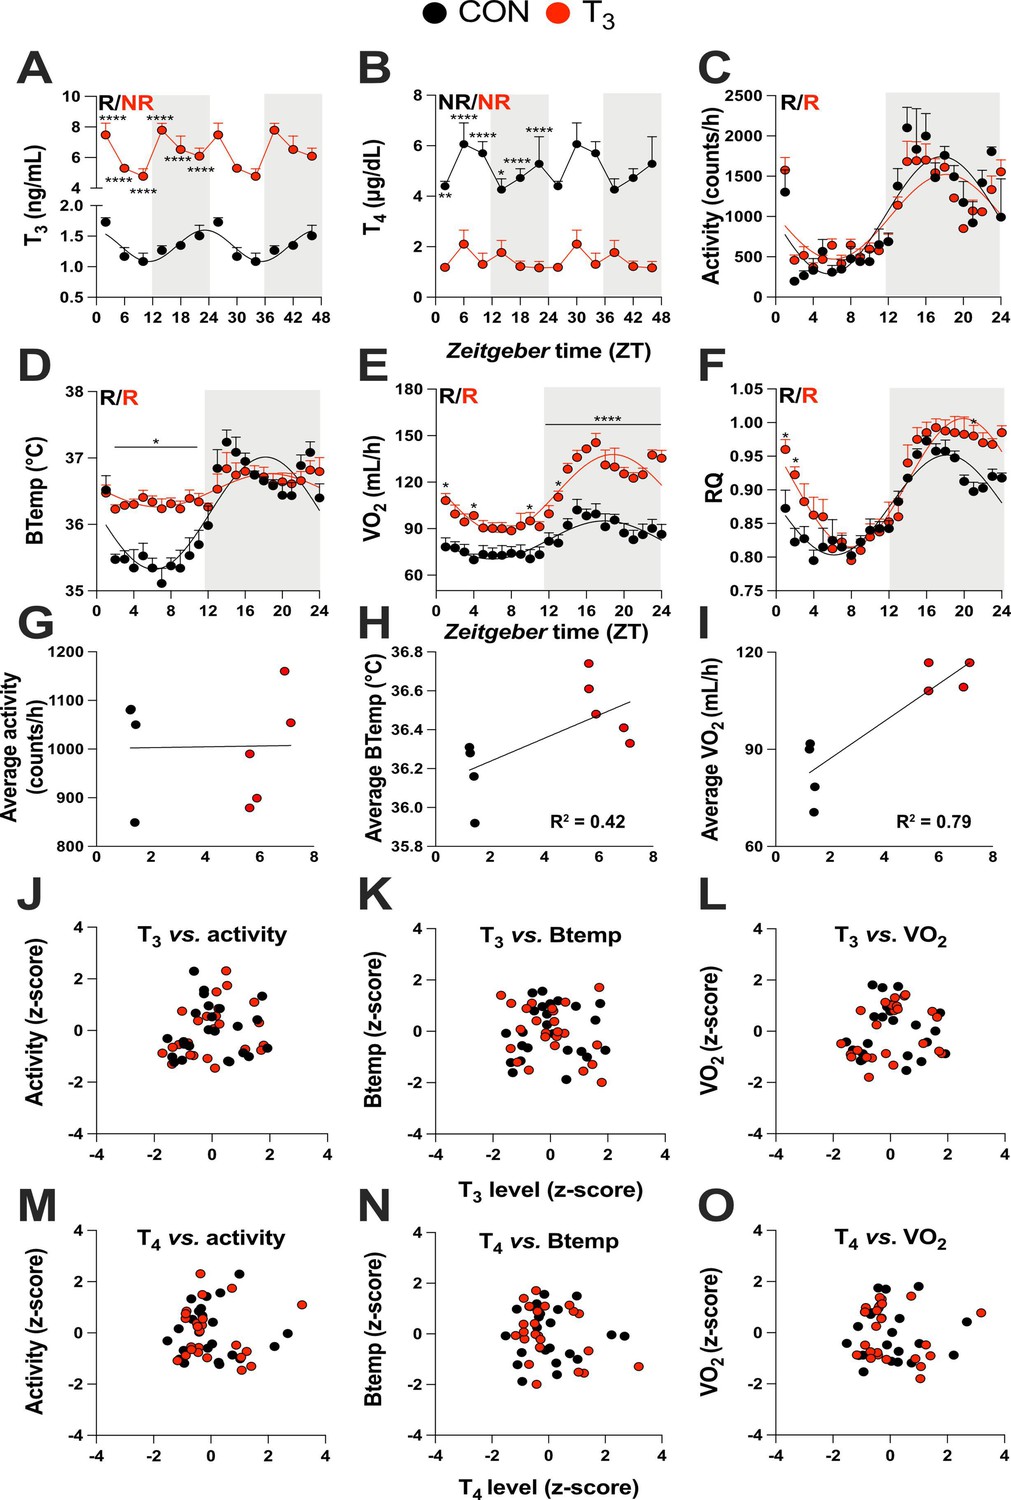
Triiodothyronine (T3)-treated mice show classic effects of high thyroid hormone levels compared to control mice (CON).
(A–F) Serum levels of T3 and thyroxine (T4), 24 hr profiles of locomotor activity, body temperature, O2 consumption, and respiratory quotient are shown. Rhythm evaluation was performed by JTK_CYCLE (p<0.01, Supplementary file 1). Presence (R) or absence of circadian rhythm (NR) is depicted. In the presence of significant 24 hr rhythmicity, a sine curve was fit. In (A) and (B), data are double plotted to emphasize the absence or presence of rhythms. (G–I) Linear regression of T3 average levels with average of locomotor activity, temperature, and O2 consumption. (J–O) Correlation between thyroid hormone levels and normalized levels of metabolic outputs is shown as z-scores (additional information is described in Supplementary file 2). In (A) and (B), n = 4–6 animals per group and/or timepoint. In (C) and (D), n = 4 and 5 for CON and T3 groups, respectively. In (E) and (F), n = 4 for each group.
Figure 1—figure supplement 1

Metabolic evaluation of control (CON) and triiodothyronine (T3) mice.
(A–D) Assessment of body temperature, food and water intake (per cage, n = 8), and body weight. (E–I) Metabolic parameters (described in the y-axis) were obtained from the third week of experiment (days 19/20). Day and night data were obtained by averaging values from Zeitgeber time (ZT) 0–12 (day) and from ZT 12–24 (night) and plot accordingly. Letters represent a difference between the same group in day vs. night comparisons. Asterisks represent significant differences between CON and T3 mice. In (H), 95% confidence intervals are shown. Comparison of the slope and elevations/intercept between the groups was performed: p=0.30 and 0.01, respectively. Data are shown either as mean ± SEM or by boxplot. n = 24 for (A) and (D). (E–I) n = 4–5 per group.
Figure 2
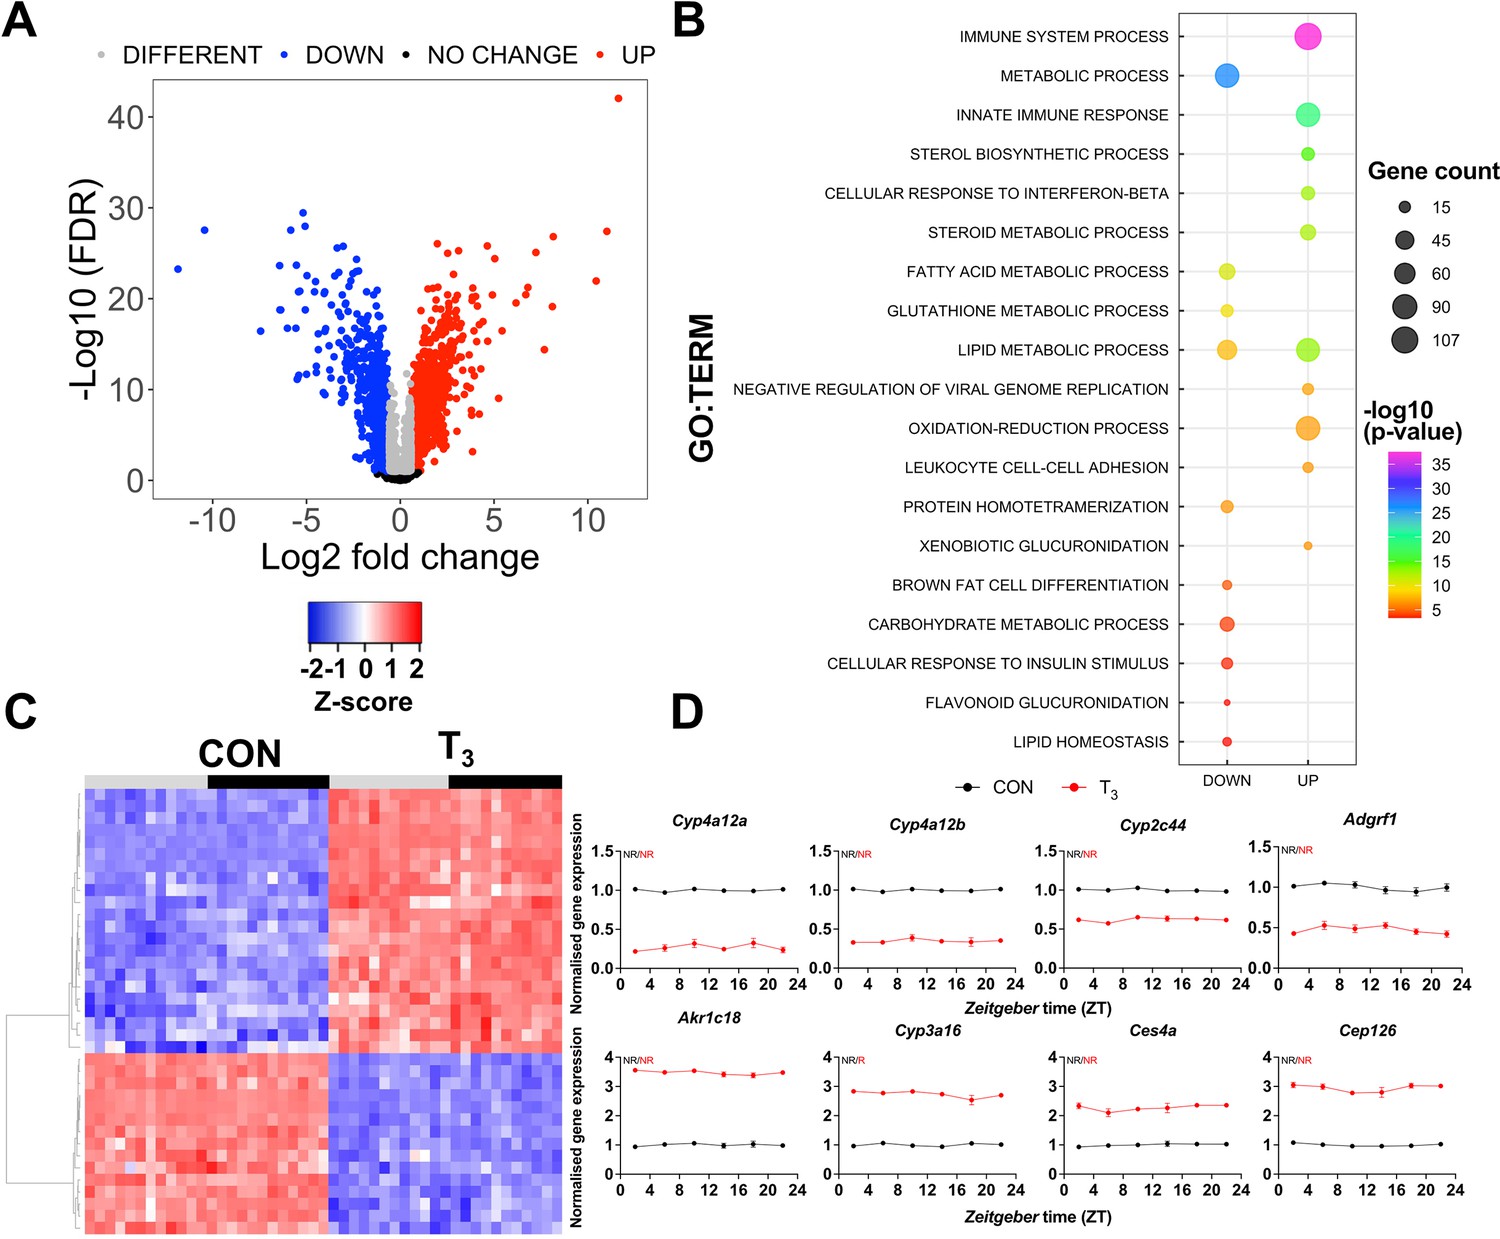
Identification of daytime-independent differentially expressed genes (DEGs) in the liver of triiodothyronine (T3) mice.
(A) Global (all Zeitgeber times [ZTs] included) evaluation of liver transcriptomes revealed 2336 DEGs of which 1391 and 945 were considered as up- or downregulated, respectively, using a false discovery rate (FDR) < 0.1. Genes with an FDR <0.1 were classified as different irrespectively of fold change values. (B) Top 10 list of biological processes from gene set enrichment analysis (GSEA) of up- and downregulated DEGs is represented. Additional processes can be found in Supplementary file 3. (C) Heatmap of liver DEGs showing significant T3-dependent regulation across all timepoints. Light and dark phases are shown as gray and black, respectively. (D) Diurnal expression profiles of most robustly regulated DEGs. Gene expression of all groups was normalized by CON mesor. Additional information is described in Supplementary file 4. None of these genes showed rhythmic regulation across the day (NR). n = 4 samples per group and timepoint, except for the T3 group at ZT 22 (n = 3).
Figure 3 with 2 supplements
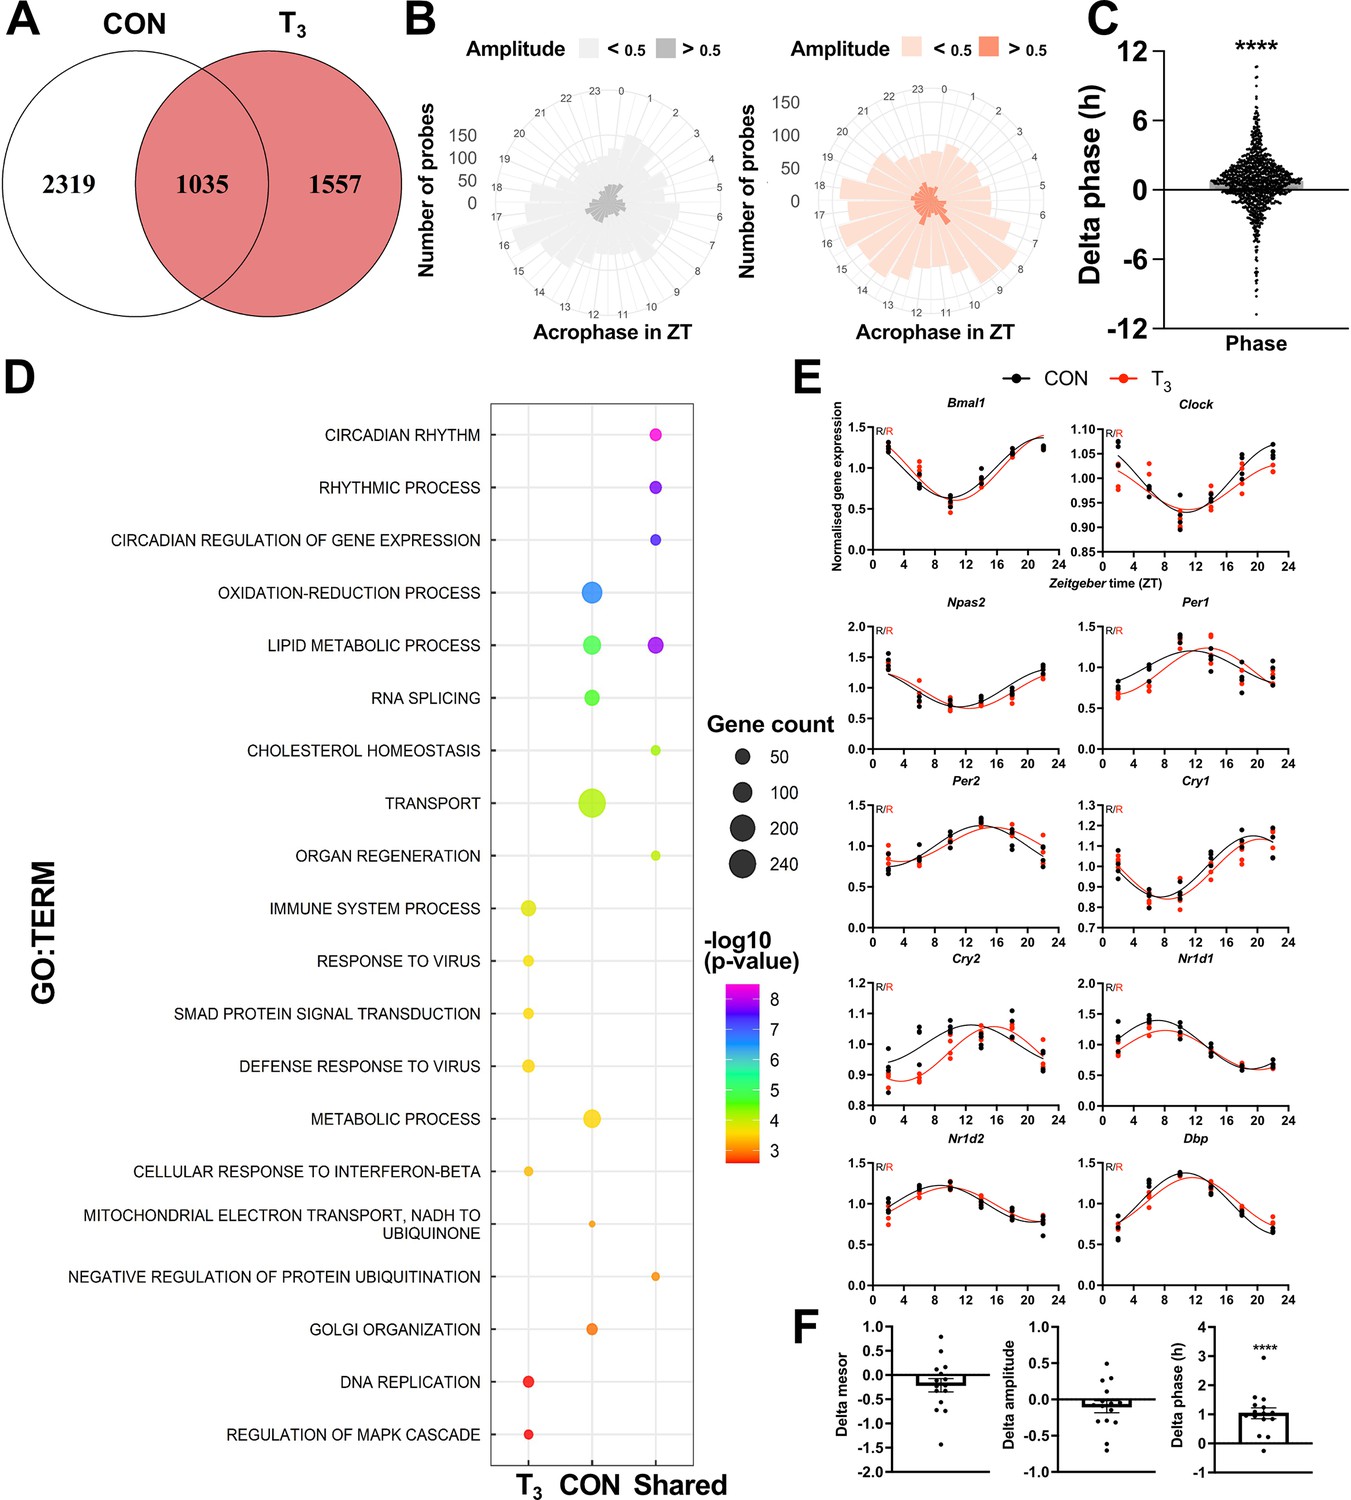
Diurnal evaluation of liver transcriptome of triiodothyronine (T3) mice.
(A) Rhythmic probes were identified using the JTK_CYCLE algorithm (Supplementary file 5). Venn diagram represents the distribution of rhythmic probes for each group. (B) Rose plot of all rhythmic genes from control (CON) (gray) and T3 (red) are represented by the acrophase and amplitude. Phase estimation was obtained from CircaSingle algorithm. (C) Phase difference between shared rhythmic genes. Each dot represents a single gene. One-sample t-test against zero value was performed and a significant interaction (mean 0.7781, p<0.001) was found. (D) Top 7 gene set enrichment analysis (GSEA) of exclusive genes from CON, T3, and shared are depicted. Additional processes are shown in Supplementary file 5. (E) Sine curve was fitted for the selected clock genes. Gene expression of all groups was normalized by CON mesor. (F) For mesor, amplitude, and phase delta assessment, CircaCompare algorithm was used. The CON group was used as baseline. Additional genes (Per3, Rorc, Tef, Hif1a, and Nfil3) were used for these analyses. One-sample t-test against zero value was used and only phase was different from zero (mean 1.036, p<0.001). n = 4 samples per group and timepoint, except for the T3 group at Zeitgeber time (ZT) 22 (n = 3).
Figure 3—figure supplement 1
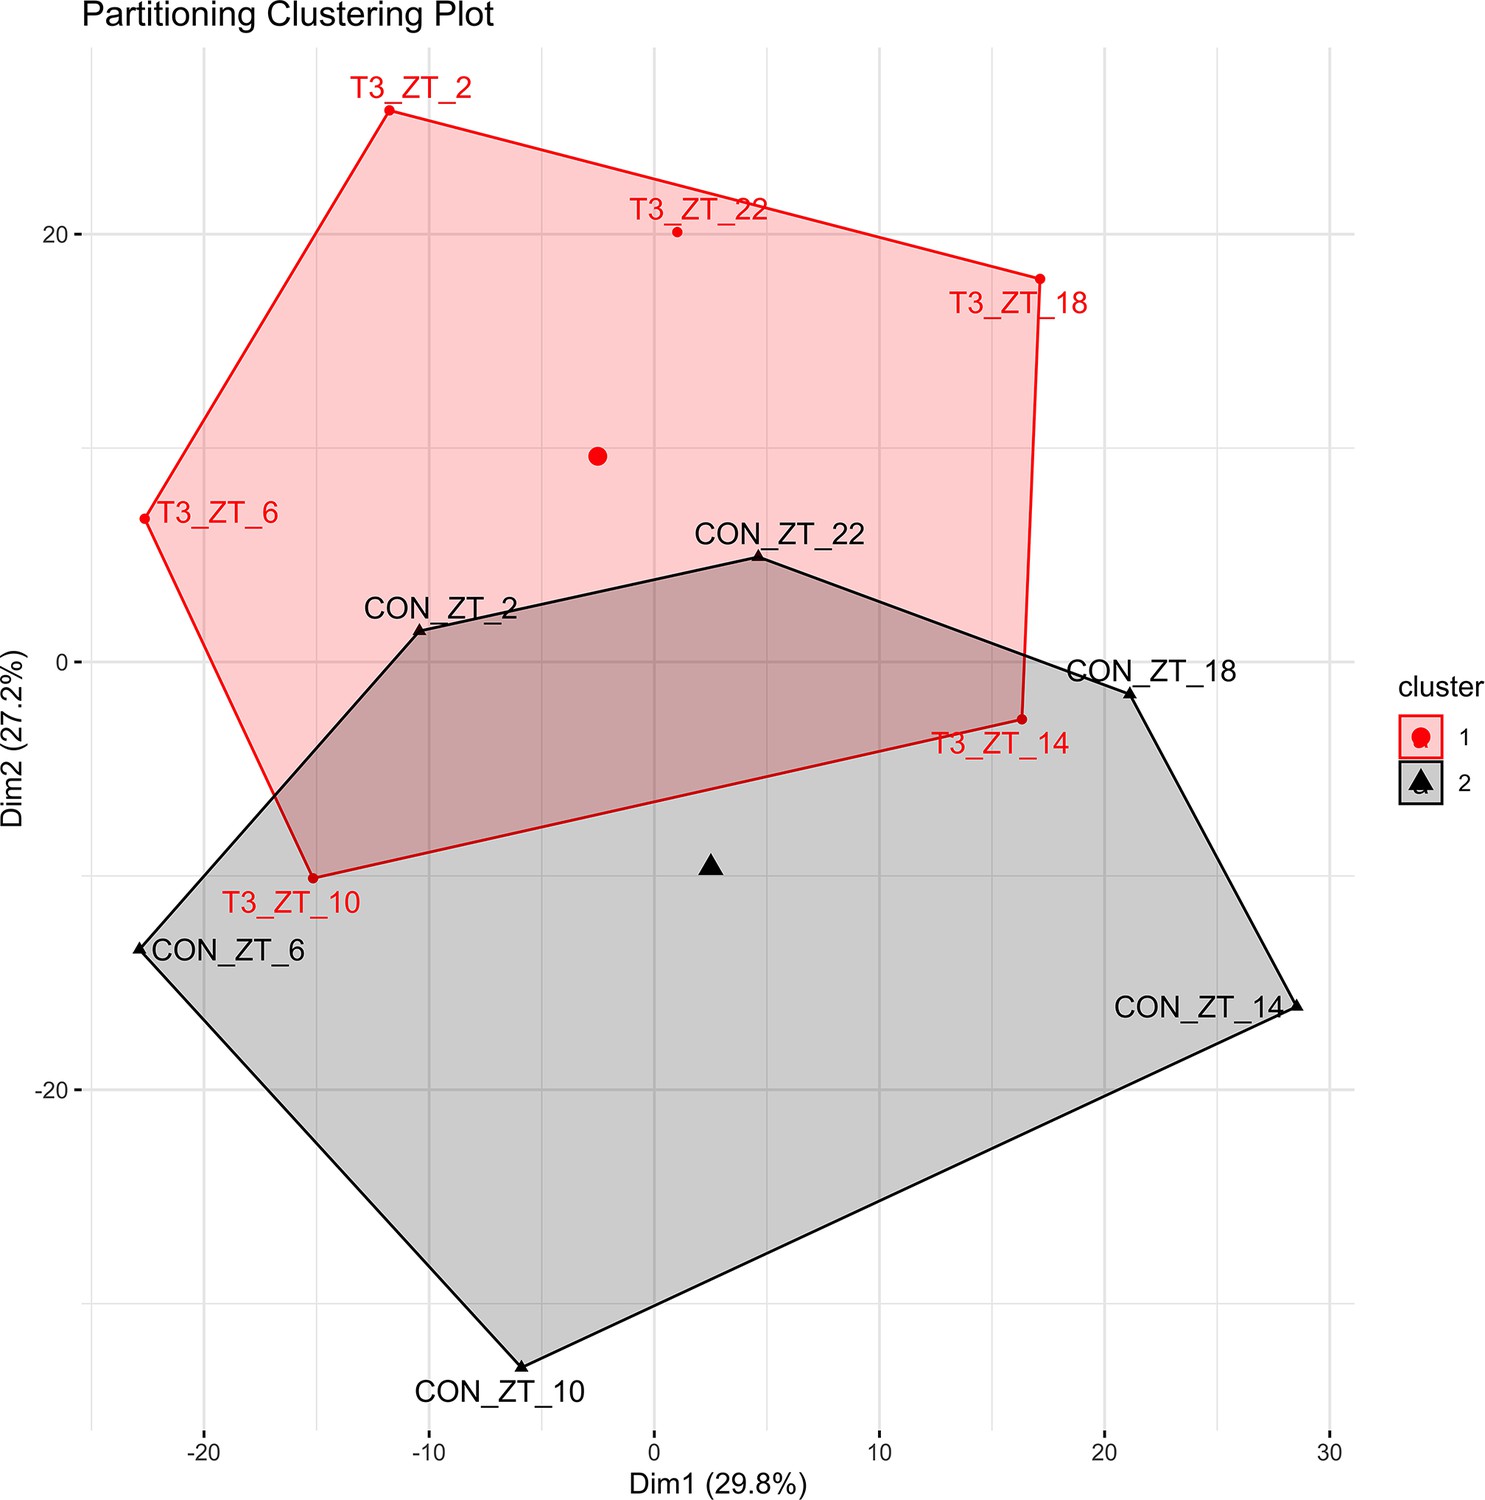
Principal component analysis (PCA) plots of shared rhythmic genes.
Each timepoint was averaged into a single replicate, and PCA were performed using the factoextra package in R and Hartigan-Wong, Lloyd, and Forgy MacQueen algorithms.
Figure 3—figure supplement 2

Validation of clock gene diurnal profile by qPCR.
CircaCompare was used to evaluate the difference in rhythmic parameters, and one-sample t-test against zero value was performed (mean 0.9069 hr, p=0.0221). Sine curve was fitted for rhythmic genes (R). n = 3–4 samples per group and timepoint.
Figure 4
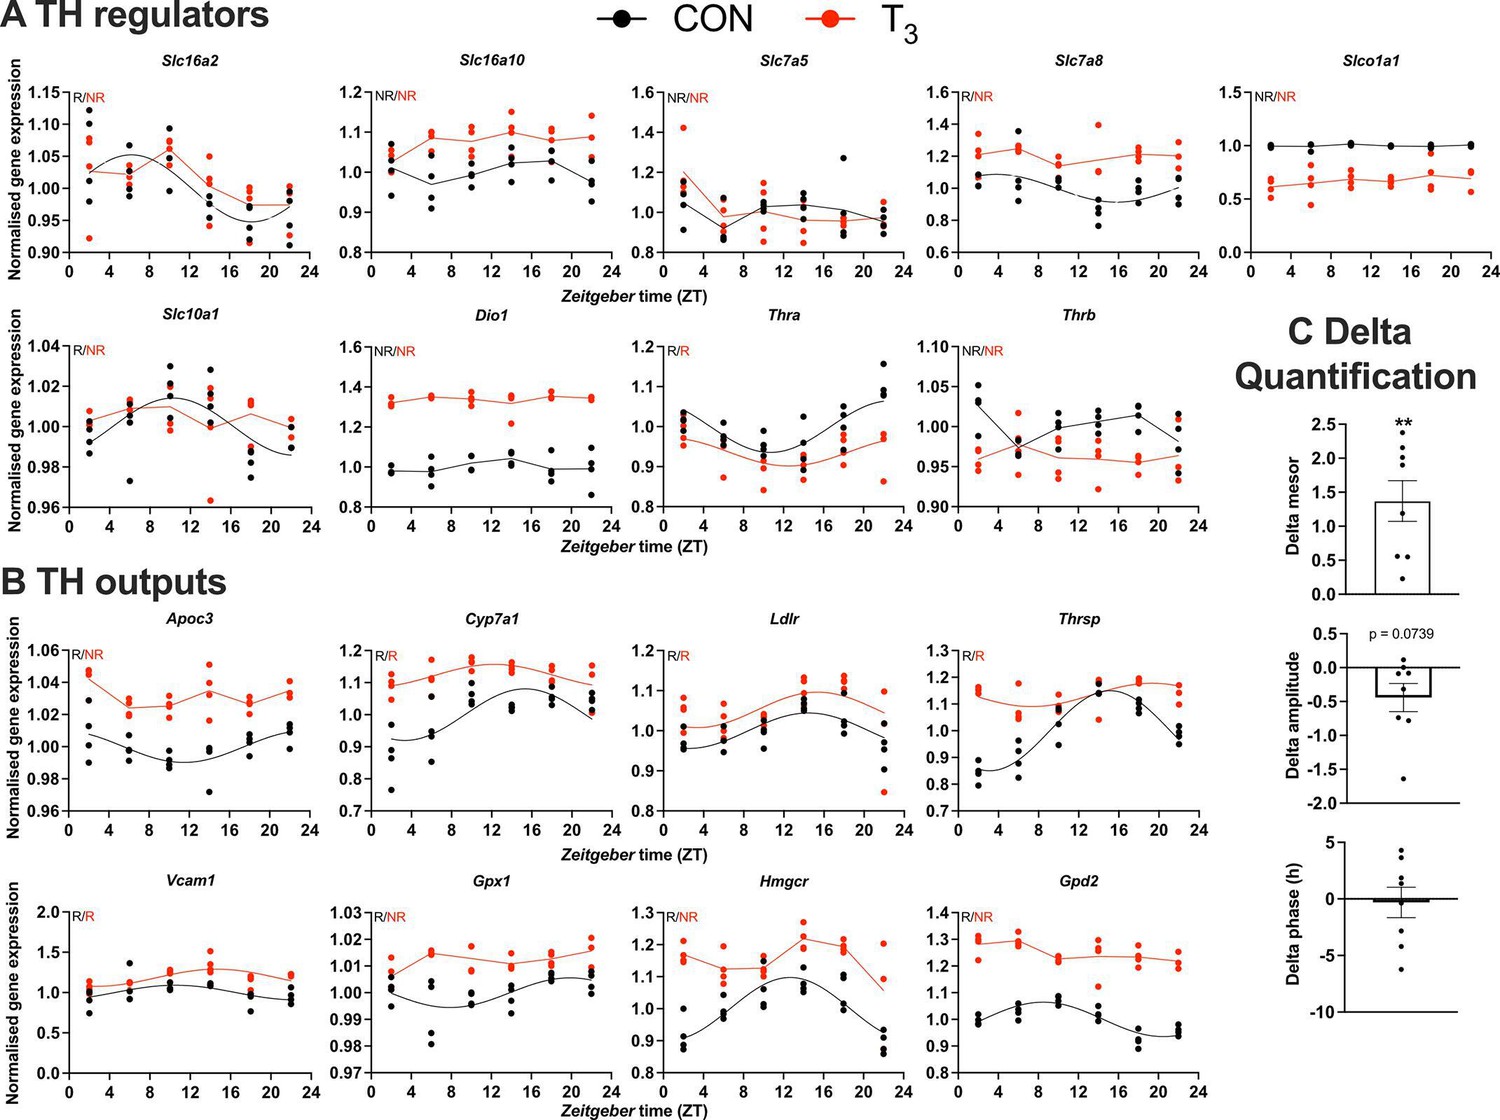
Gene expression evaluation of thyroid hormone (TH) regulators and metabolic outputs in triiodothyronine (T3) compared to control (CON).
(A, B) Genes involved in TH regulation, including transporters, Dio1, TH receptors, and well-known T3 outputs are presented. Presence (R) or absence of circadian rhythm (NR) detected by CircaCompare is depicted. Sine curve was fitted for rhythmic genes. Gene expression of all groups was normalized by CON mesor. (C) Evaluation of rhythmic parameters from genes described in (B) was performed by CircaCompare using CON group as baseline. One-sample t-test against zero value was used and only mesor was different from zero (mean 1.371, p<0.01). n = 4 samples per group and timepoint, except for the T3 group at Zeitgeber time (ZT) 22 (n = 3).
Figure 5 with 1 supplement
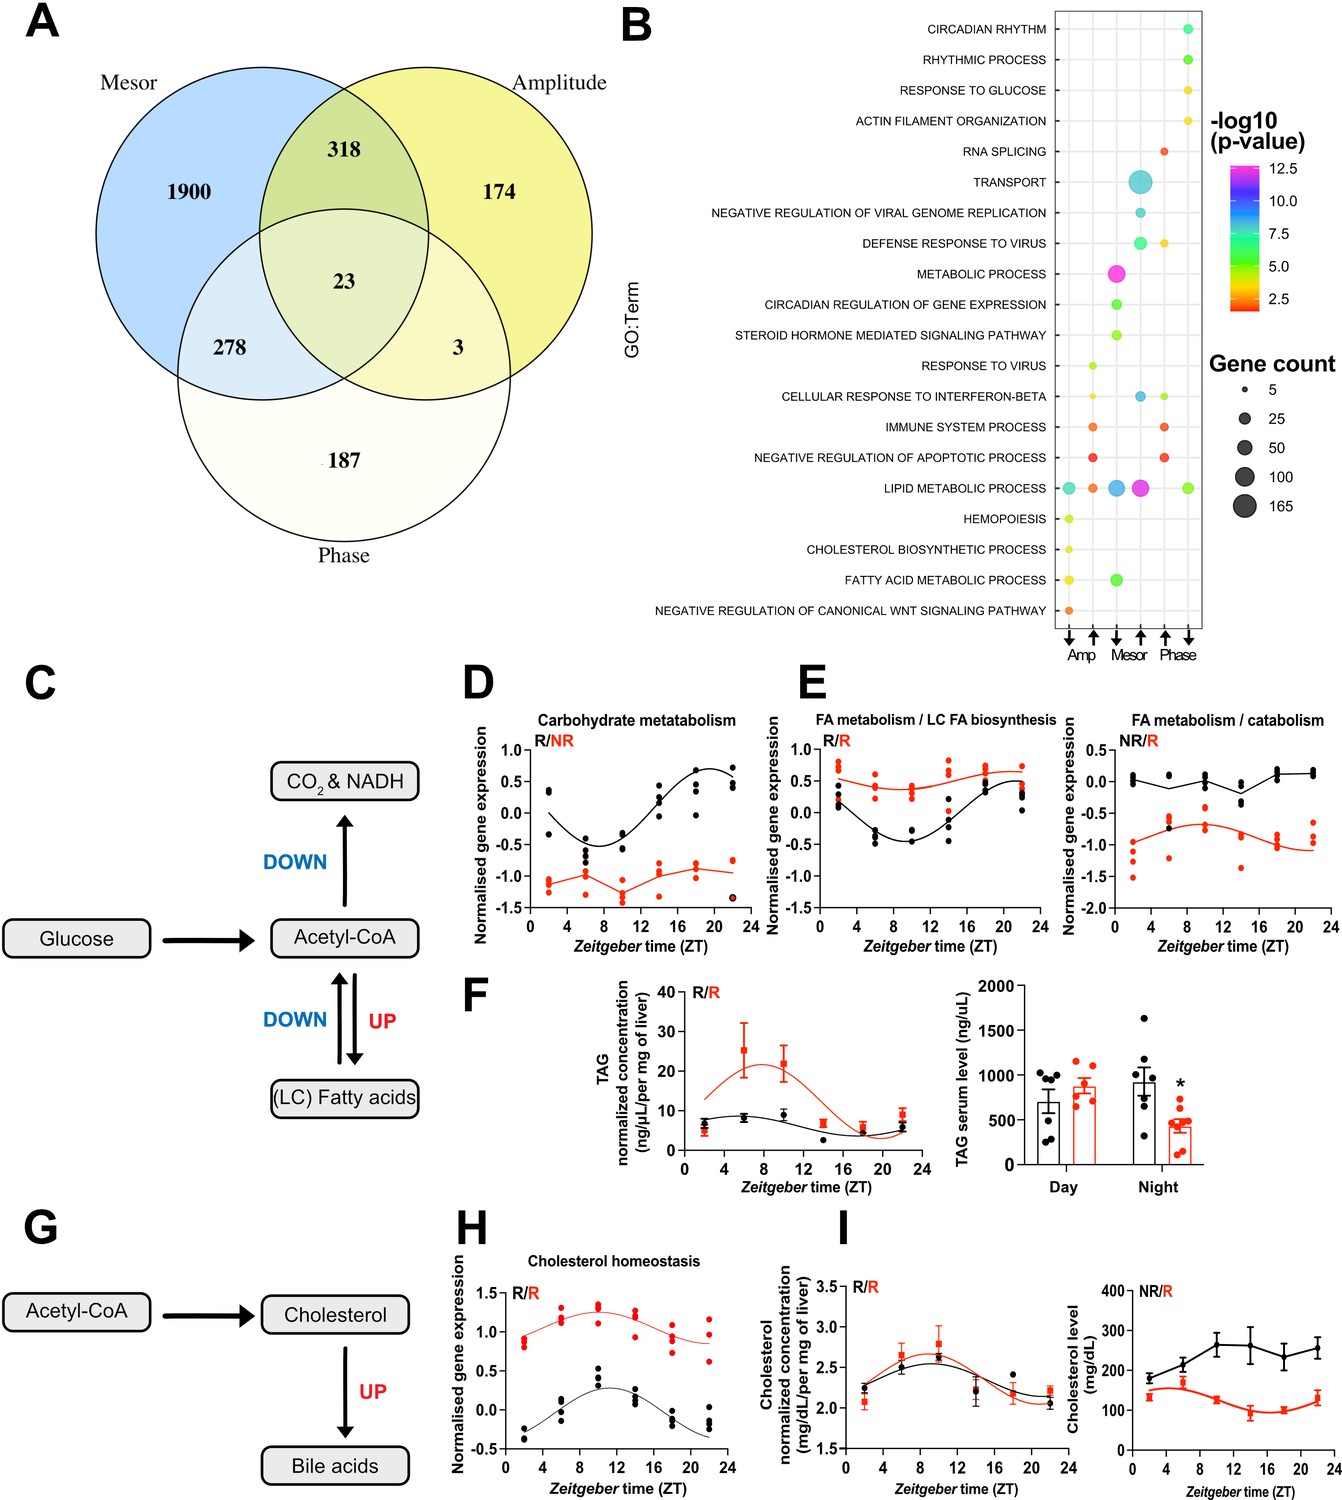
CircaCompare analyses of triiodothyronine (T3) (red) mice compared to control (CON) (black).
(A) Venn diagram demonstrates the number of probes that displayed differences in each rhythmic parameter (mesor, amplitude, and phase). (B) Top 5 enriched biological processes for each rhythmic parameter category. (C) Summary of the CircaCompare analyses regarding glucose and fatty acid (FA) metabolism. (D, E) Representation of glucose and FA metabolism biological processes obtained from transcriptome data. (F) Diurnal rhythm evaluation of liver triacylglyceride (TAG) and day (Zeitgeber time [ZT] 2–6) vs. night (ZT18–22) serum TAG levels comparisons. (G) Summary of the CircaCompare analyses regarding cholesterol metabolism. (H) Representation of cholesterol homeostasis obtained from transcriptome data. (I) Diurnal rhythm evaluation of liver and serum cholesterol. Gene expression from each biological process was averaged per ZT and plotted. The reader should refer to the text for detailed information regarding the changes found at the gene level of these processes. Sine curve was fitted for each rhythmic biological process. Individual gene expression pertaining to these processes is found in Figure 5—figure supplement 1. n = 4 samples per group and timepoint, except for the T3 group at ZT 22 (n = 3).
Figure 5—figure supplement 1

Expression profile of the selected genes pertaining to biological processes identified in CircaCompare.
Diurnal profile of genes from glucose (A), fatty acid (B), and cholesterol metabolism (C). Diurnal overall gene expression was normalized by CON mesor and plotted. Sine curve was fitted for rhythmic genes (R). Absence of rhythmic is represented by connected lines and NR symbol. n = 4 samples per group and timepoint, except for the T3 group at Zeitgeber time (ZT) 22 (n = 3). CircaCompare data is provided in Supplementary file 6.
Tables
Key resources table
| Reagent type (species) or resource | Designation | Source or reference | Identifiers | Additional information |
|---|---|---|---|---|
| Gene (Mus musculus) | C57BL/6J | Janvier Labs, Germany | C57BL6JRj | |
| Strain, strain background (C57BL6JRj, male) | C57BL/6JRj | Janvier Labs, Germany | 2–3-month-old male | |
| Biological sample (M. musculus) | Liver and serum | Collected and immediately frozen in dry ice | ||
| Sequence-based reagent | RNA extraction | TRIzol, Thermo Fisher Scientific | ||
| Sequence-based reagent | RNA isolation | RNA Miniprep kit Zymo Research | ||
| Sequence-based reagent | cDNA synthesis | High-Capacity Complementary DNA Reverse Transcription Kit, Thermo Fisher | ||
| Sequence-based reagent | qPCR | GoTaq, Promega, USA | ||
| Sequence-based reagent | Microarray | WT Plus Kit, Thermo Fisher Scientific | ||
| Sequence-based reagent | qPCR primers | Integrated DNA Technologies (IDT) | Sequences are provided in the supplementary information | |
| Chemical compound, drug | T3 hormone | T6397, Sigma-Aldrich | ||
| Chemical compound, drug | BSA | A7906-50G, Sigma-Aldrich | ||
| Commercial assay or kit | T3 detection kit | DNOV053, NovaTec | ||
| Commercial assay or kit | T4 detection kit | EIA-1781, DRG Diagnostics | ||
| Commercial assay or kit | Triglycerides quantification kit | MAK266, Sigma-Aldrich | ||
| Commercial assay or kit | Cholesterol quantification kit | STA 384, Cell Biolabs | ||
| Software, algorithm | RStudio | R 4.0.3 | ||
| Software, algorithm | Prisma 9 | GraphPad |
Additional files
-
Supplementary file 1
Metabolic output rhythmic evaluation by JTK_CYCLE.
- https://cdn.elifesciences.org/articles/79405/elife-79405-supp1-v4.xlsx
-
Supplementary file 2
Metabolic output correlation.
- https://cdn.elifesciences.org/articles/79405/elife-79405-supp2-v4.xlsx
-
Supplementary file 3
Global differentially expressed genes (DEGs).
- https://cdn.elifesciences.org/articles/79405/elife-79405-supp3-v4.xlsx
-
Supplementary file 4
Differentially expressed genes (DEGs) per Zeitgeber time (ZT).
- https://cdn.elifesciences.org/articles/79405/elife-79405-supp4-v4.xlsx
-
Supplementary file 5
Rhythmic evaluation by JTK_CYCLE.
- https://cdn.elifesciences.org/articles/79405/elife-79405-supp5-v4.xlsx
-
Supplementary file 6
Rhythmic analyses by CircaCompare.
- https://cdn.elifesciences.org/articles/79405/elife-79405-supp6-v4.xlsx
-
MDAR checklist
- https://cdn.elifesciences.org/articles/79405/elife-79405-mdarchecklist1-v4.docx
Download links
A two-part list of links to download the article, or parts of the article, in various formats.
Downloads (link to download the article as PDF)
Open citations (links to open the citations from this article in various online reference manager services)
Cite this article (links to download the citations from this article in formats compatible with various reference manager tools)
Rewiring of liver diurnal transcriptome rhythms by triiodothyronine (T3) supplementation
eLife 11:e79405.
https://doi.org/10.7554/eLife.79405


