Antibody levels following vaccination against SARS-CoV-2: associations with post-vaccination infection and risk factors in two UK longitudinal studies
- Department of Twin Research and Genetic Epidemiology, King’s College London, United Kingdom
- Population Health Sciences, Bristol Medical School, University of Bristol, United Kingdom
- Department of Applied Mathematics and Theoretical Physics, University of Cambridge, United Kingdom
- MRC Unit for Lifelong Health and Ageing, University College London, United Kingdom
- Centre for Longitudinal Studies, University College London, United Kingdom
- Department of Medical Epidemiology and Biostatistics, Karolinska Institutet, Sweden
- MRC/CSO Social and Public Health Sciences Unit, University of Glasgow, United Kingdom
- Department of Health Sciences, University of Leicester, United Kingdom
- Department of Epidemiology and Public Health, University College London, United Kingdom
- AI for Science and Government, The Alan Turing Institute, United Kingdom
- Department of Infectious Diseases, King's College London, United Kingdom
- Division of Psychiatry, University of Edinburgh, United Kingdom
- Guy’s & St Thomas’s NHS Foundation Trust, United Kingdom
Figures
Figure 1 with 4 supplements

Anti-Spike antibody levels stratified by cohort and vaccination status at Q2 and Q4 antibody testing.
Dot and box plots showing distribution of anti-Spike antibody levels within Avon Longitudinal Study of Parents and Children (ALSPAC) and TwinsUK, for those not vaccinated or individuals single-, double- or triple-vaccinated at time of sampling. Data shown for individuals sampled at least 4 weeks after first vaccination, and at least 2 weeks after second or third vaccination to allow time for antibody generation. Length of box plot whiskers are limited to 1.5 times the interquartile range. Red lines show 10th percentile levels. Assay upper limit is shown by black dotted lines, with 0.4–250 BAU/mL range for Q2 results and 0.4–25000 BAU/mL for Q4 results, with a positive threshold of 0.8 BAU/mL. Percentage of values above assay upper limit is given on right side of plots.
Figure 1—figure supplement 1

Flow chart showing identification of analysis samples from Q2 antibody testing within TwinsUK.
The use of groups of individuals in various analyses is highlighted with symbols. Unknown vaccination status included a small number of individuals with contradictory vaccination dates (e.g., first vaccination dated after second vaccination), in addition to those who did not complete vaccination status questions.
Figure 1—figure supplement 2

Flow chart showing identification of analysis samples from Q4 antibody testing within TwinsUK.
The use of groups of individuals in various analyses is highlighted with symbols. Unknown vaccination status included a small number of individuals with contradictory vaccination dates (e.g., first vaccination dated after second vaccination), in addition to those who did not complete vaccination status questions.
Figure 1—figure supplement 3

Flow chart showing identification of analysis samples from Q2 antibody testing within Avon Longitudinal Study of Parents and Children (ALSPAC).
The use of groups of individuals in various analyses is highlighted with symbols. Unknown vaccination status included a small number of individuals with contradictory vaccination dates (e.g., first vaccination dated after second vaccination), in addition to those who did not complete vaccination status questions.
Figure 1—figure supplement 4
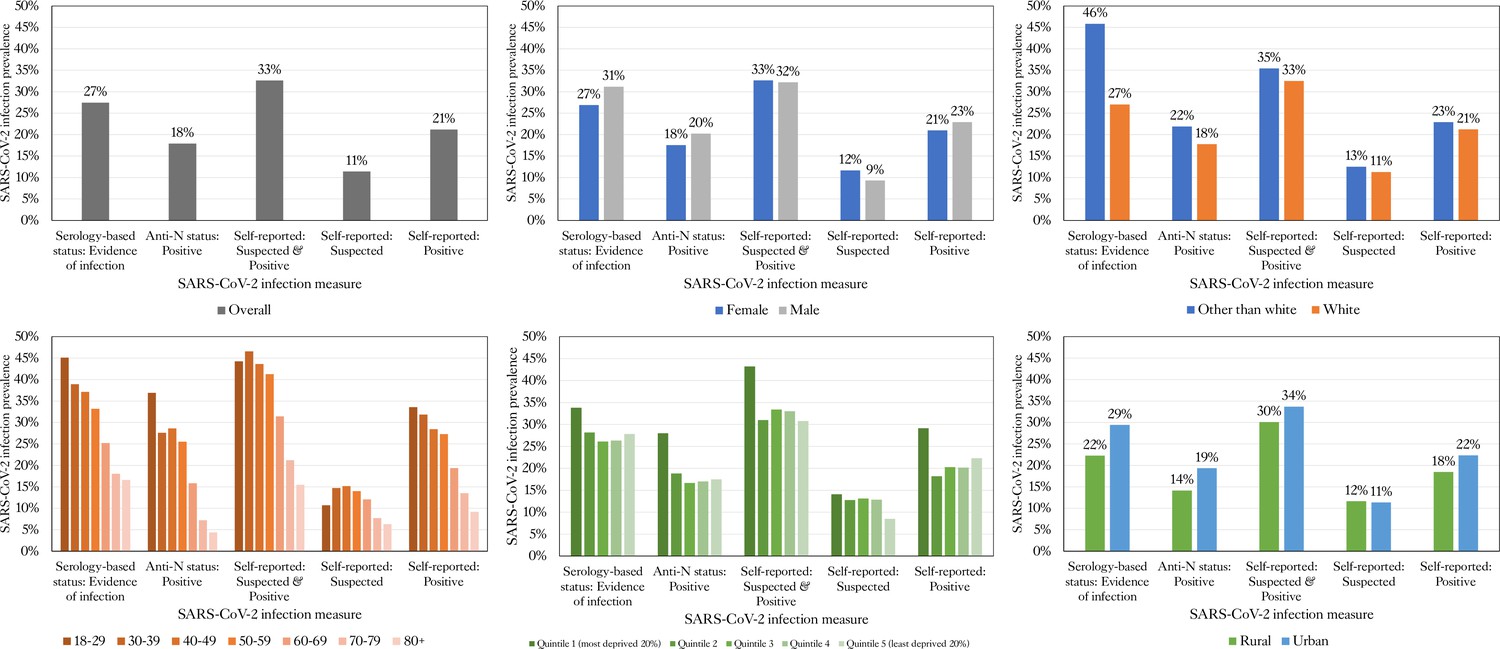
SARS-CoV-2 infection prevalence by socio-demographic factors in TwinsUK.
Prevalence of severe acute respiratory syndrome coronavirus 2 (SARS-CoV-2) infection for serology-based and self-reported measures of infection, for all individuals sampled in TwinsUK Q4 antibody testing, overall and split by socio-demographic variables: age, sex, ethnicity, local area deprivation (IMD), and rural-urban classification. Anti-N: anti-Nucleocapsid.
Figure 2
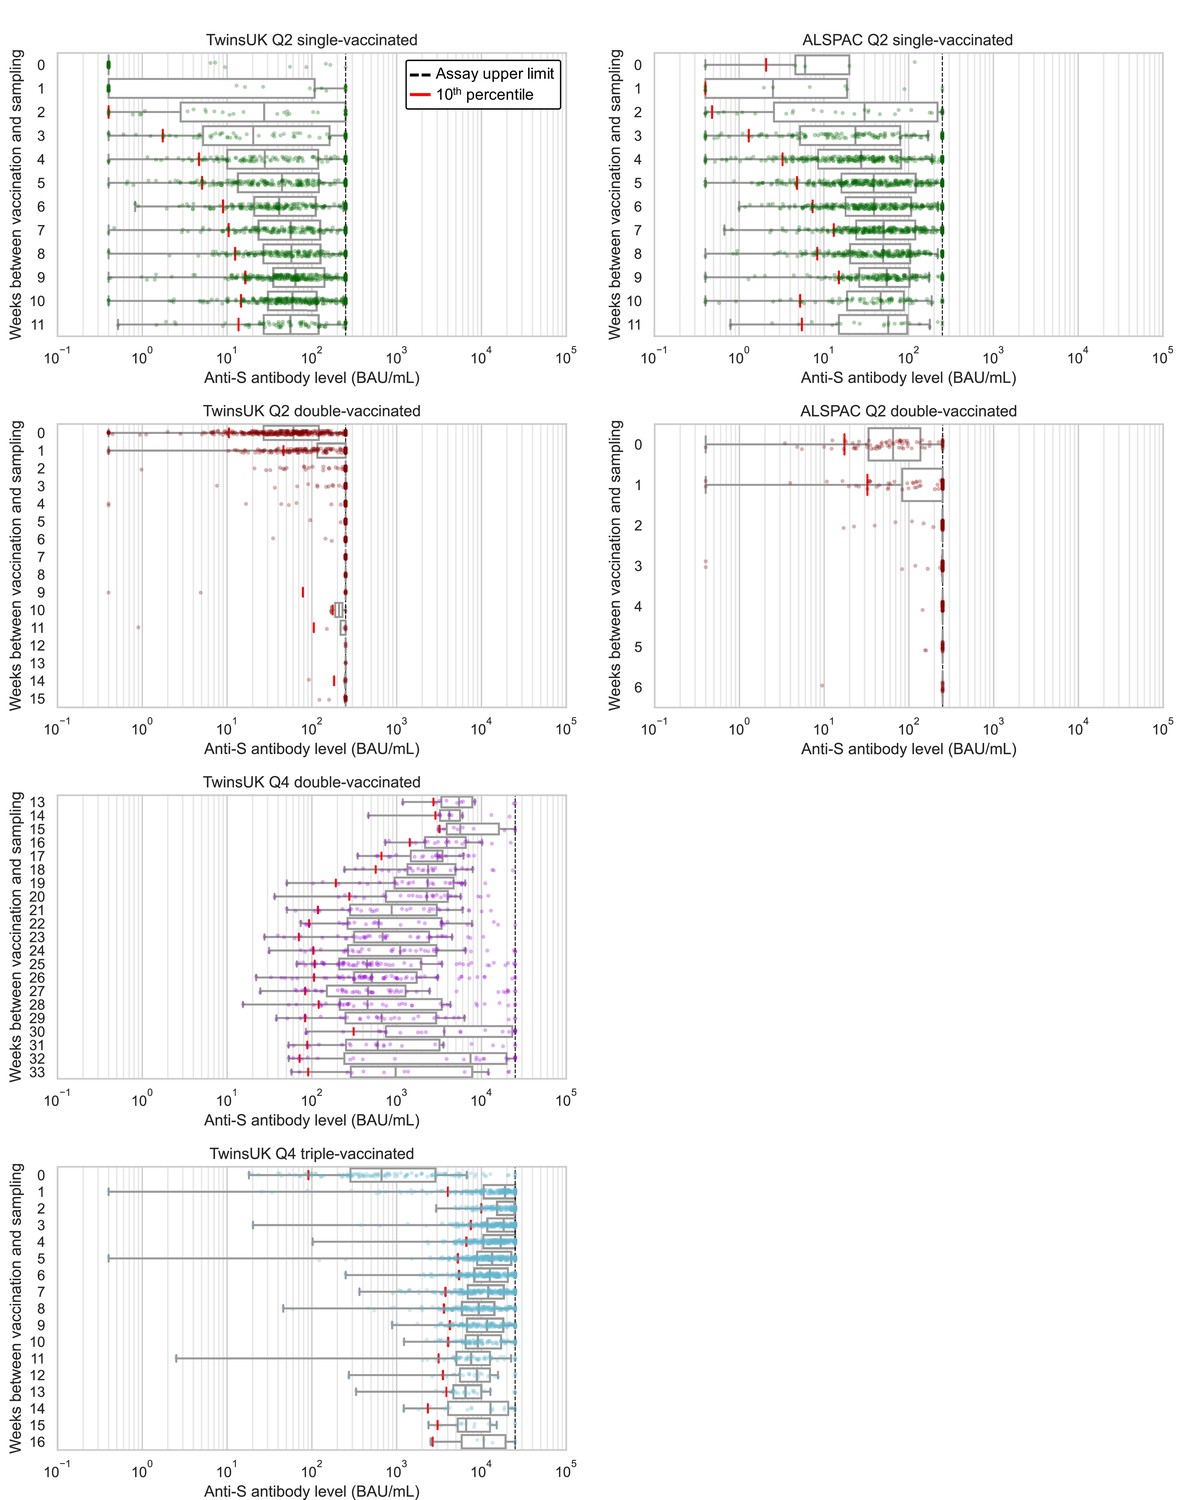
Anti-Spike antibody levels versus time since most recent vaccination, stratified by cohort and vaccination status at Q2 and Q4 antibody testing.
Dot and box plots showing distribution of anti-Spike (anti-S) antibody levels within unvaccinated, single-, double- and triple-vaccinated individuals within Avon Longitudinal Study of Parents and Children (ALSPAC) (Q2 testing) and TwinsUK (Q2 and Q4 testing), plotted against the number of weeks since most recent vaccination at time of sampling. Length of box plot whiskers are limited to 1.5 times the interquartile range. Red lines show 10th percentile levels. Assay upper limit is shown by black dotted lines, with 0.4–250 BAU/mL range for Q2 results and 0.4–25000 BAU/mL for Q4 results, with a positive threshold of 0.8 BAU/mL. X-axes are limited to weeks with results for five or more individuals, noting TwinsUK Q4 second vaccination sub-plot begins at 13 weeks since vaccination.
Figure 3 with 1 supplement
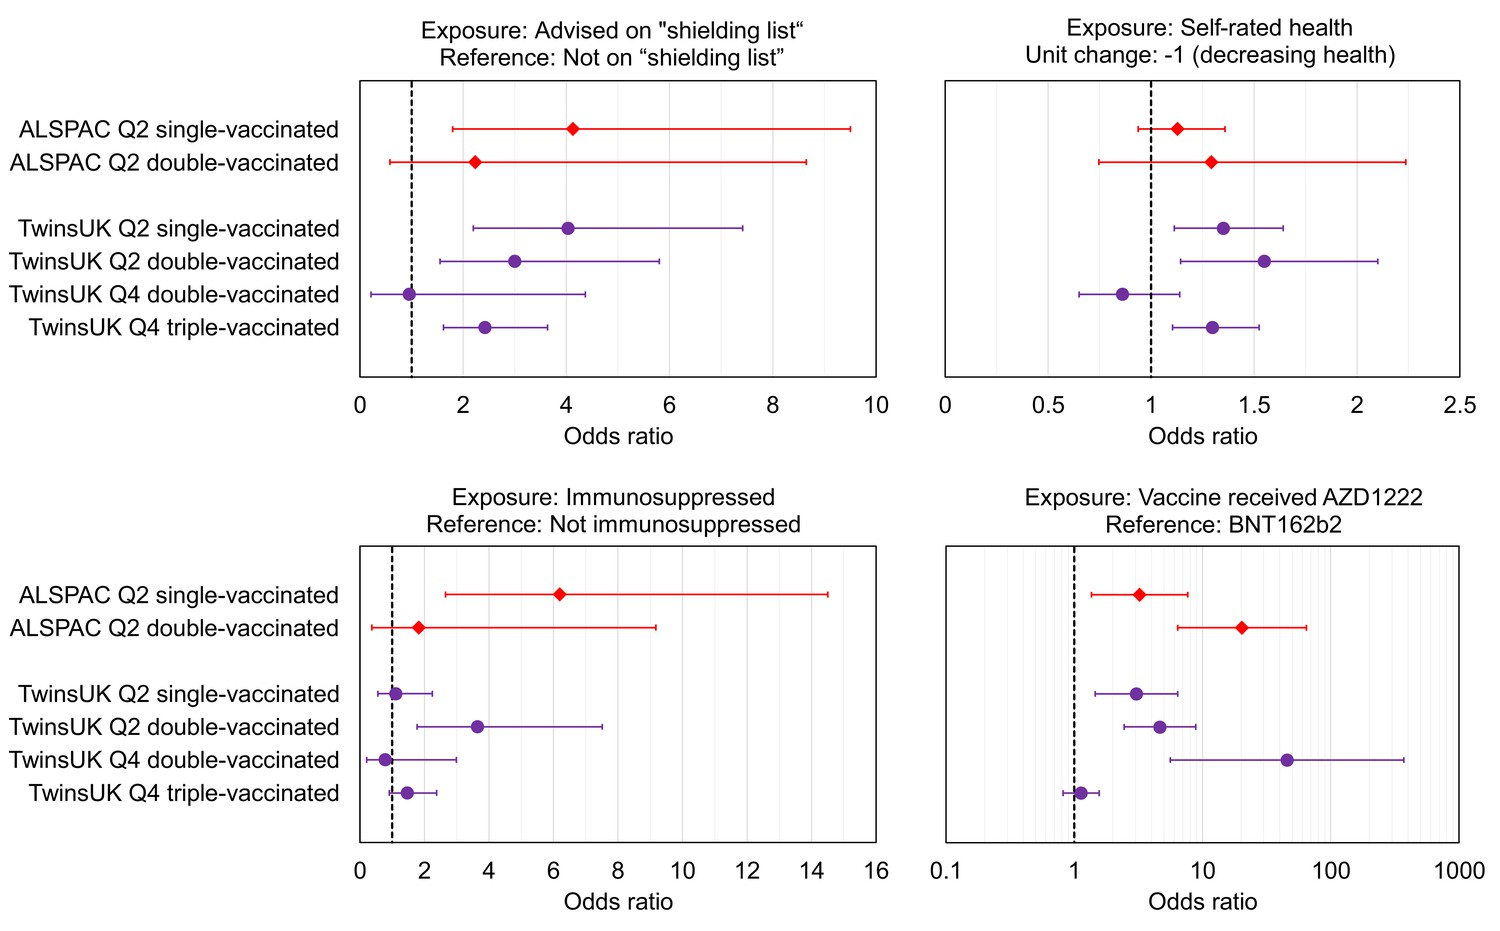
Associations with low relative anti-Spike antibody levels within TwinsUK and Avon Longitudinal Study of Parents and Children (ALSPAC).
Odds ratios with unadjusted 95% confidence intervals for selected exposure variables, testing associations with low anti-Spike antibody levels, for sub-samples of TwinsUK (purple circles) and ALSPAC (red diamonds) individuals tested in Q2 or Q4, while single-, double-, or triple- vaccinated. Low antibody levels were defined as the lowest 10% within the given sub-sample, except for ALSPAC and TwinsUK Q2 double-vaccinated sub-samples where lowest 8% is used due to assay upper limit. Each point estimate originates from a distinct multivariate logistic regression model, including the exposure variable of interest and adjustment variables of age, sex, name of most recent vaccine received and weeks since most recent vaccination. Note x-axis ranges on sub-plots vary, and vaccine received panel uses a logarithmic x-axis. Odds ratio = 1 is indicated with a dashed black line.
Figure 3—figure supplement 1
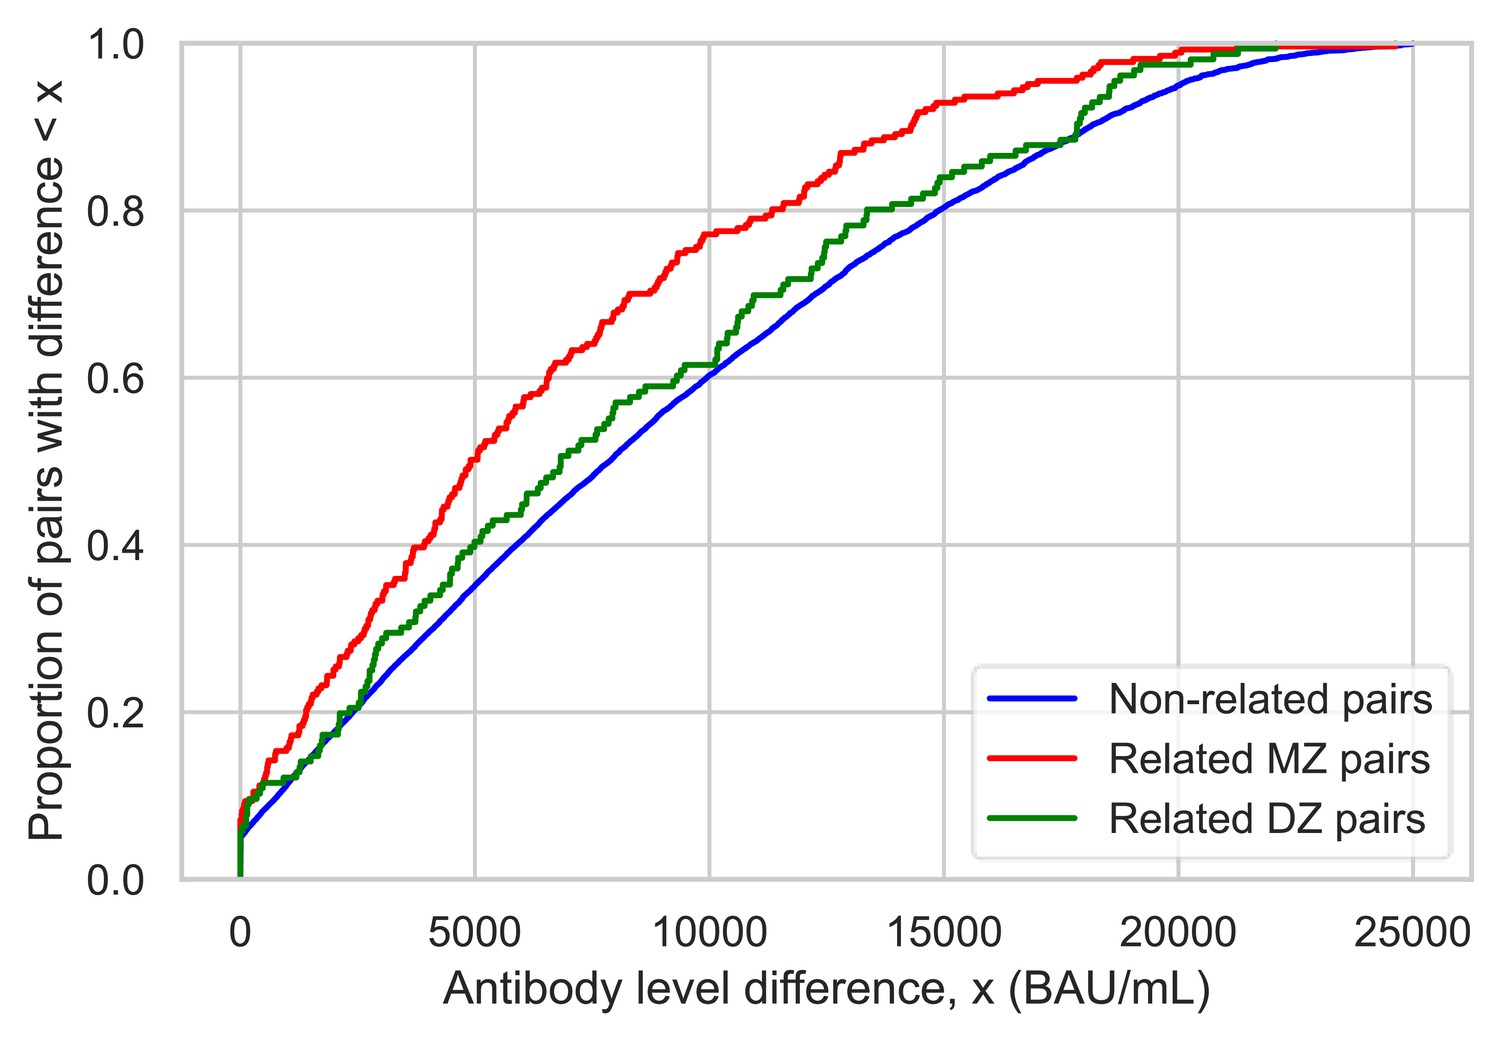
Antibody level differences after third vaccination between related twins and non-related pairs.
Empirical cumulative distribution functions describing the difference in anti-Spike antibody levels after third severe acute respiratory syndrome coronavirus 2 (SARS-CoV-2) vaccination within TwinsUK, with pair differences calculated between all complete pairs of related monozygotic (MZ) twins, dizygotic (DZ) twins, and all combinations of non-related pairs.
Tables
Table 1
Phenotypic variables used in analyses.
Variables marked with an asterisk were outcome variables in logistic regression analyses; all other variables were adjustment or exposure variables. Variables only available in TwinsUK are notated as [TUK], and those only in ALSPAC as [ALSPAC].
| Variable group | Variable |
|---|---|
| Antibody levels | Anti-Spike level* |
| Socio-demographic | Age Sex Ethnicity Local area deprivation (index of multiple deprivation, IMD [using national IMD rank decile/quintile]) (GOV.UK, 2019; Northern Ireland Statistics and Research Agency, 2017; Gov.scot, 2020; GOV.WALES, 2021) Rural-urban classification [TUK] (GOV.UK, 2022a) Highest educational attainment Employment status |
| COVID-19 infection | SARS-CoV-2 infection status (self-reported) SARS-CoV-2 infection status (serology-based) Anti-Nucleocapsid antibody status Post-vaccination SARS-CoV-2 infection [TUK]* |
| COVID-19 vaccination | Brand/manufacturer of first/second/third vaccination Number of weeks between first/second/third vaccination and antibody sampling |
| Health indicators | Body mass index Frailty index [TUK] (derived following Searle et al., 2008) Frailty (PRISMA-7 assessment; Raîche et al., 2008) [ALSPAC] Self-reported advised as on ‘Shielded Patient List’ Self-rated health (5-point scale from ‘poor’ to ‘excellent’) Prescribed immunosuppressant medication [TUK] Self-reported immunocompromised [ALSPAC] Anxiety (hospital anxiety and depression assessment scale (HADS) [TUK] Zigmond and Snaith, 1983, or 7-item generalised anxiety disorder scale (GAD-7) [ALSPAC] Spitzer et al., 2006, assessment) Depression (HADS [TUK] or short mood and feelings questionnaire (SMFQ) [ALSPAC] Turner et al., 2014 assessment) Number of comorbidities from: anxiety/depression, diabetes, cancer, hypertension, heart disease |
| Individual comorbidities | Anxiety Arthritis (any) [TUK] Asthma Atrial fibrillation [TUK] Cancer (any) Depression Diabetes (any) Heart disease High cholesterol [TUK] Hypertension Lung disease Osteoporosis [TUK] Rheumatoid arthritis [TUK] Stroke [TUK] |
| Comorbidity domains | Cardiac disease [TUK] Cardiac risk factors [TUK] Neurological disease Subjective memory impairment [TUK] |
Table 2
Sample characteristics.
Antibody level values and characteristics for TwinsUK and Avon Longitudinal Study of Parents and Children (ALSPAC) individuals sampled in Q2 and Q4 antibody collections. Individuals are stratified by vaccination status at time of sampling. Data shown for individuals sampled at least 4 weeks after first vaccination, and at least 2 weeks after second or third vaccination to allow time for antibody generation. The anti-Spike antibody level assay range is 0.4–250 BAU/mL for Q2 results and 0.4–25,000 BAU/mL for Q4 results, with a positive threshold of 0.8 BAU/mL. Categories with fewer than five individuals are suppressed.
| Cohort | TwinsUK | ALSPAC | |||||||||
|---|---|---|---|---|---|---|---|---|---|---|---|
| Testing period | Q2 | Q4 | Q2 | Q4 | Q2 | ||||||
| Vaccination status | All results | All results | Not vaccinated | Single-vaccinated | Double-vaccinated | Double-vaccinated | Triple-vaccinated | All results | Not vaccinated | Single-vaccinated | Double-vaccinated |
| n | 4256 | 3575 | 330 | 1375 | 748 | 691 | 1937 | 1779 | 36 | 1459 | 284 |
| Age (years): Median (IQR) | 63.0 (49.0, 72.0) | 63.0 (51.0, 72.0) | 38.0 (31.0, 44.0) | 63.0 (56.0, 69.0) | 70.0 (56.0, 77.0) | 49.0 (38.0, 59.0) | 69.0 (60.0, 74.0) | 60.0 (57.0, 62.0) | 57.5 (52.75, 62.25) | 60.0 (57.0, 63.0) | 59.0 (56.0, 61.0) |
| Sex: Male, n (%) | 518/4255 (12.2%) | 447/3574 (12.5%) | 48/330 (14.5%) | 178/1375 (12.9%) | 88/748 (11.8%) | 103/691 (14.9%) | 225/1937 (11.6%) | 451/1779 (25.4%) | 8/36 (22.2%) | 397/1459 (27.2%) | 46/284 (16.2%) |
| Ethnicity: Other than White, n (%) | 118/4219 (2.8%) | 96/3536 (2.7%) | 16/329 (4.9%) | 29/1368 (2.1%) | 19/739 (2.6%) | 26/686 (3.8%) | 39/1914 (2.0%) | 26/1779 (1.5%) | <5 | 20/1459 (1.4%) | 5/284 (1.8%) |
| BMI: Median (IQR) | 24.75 (22.15, 27.99) | 24.76 (22.2, 27.98) | 22.72 (20.94, 25.42) | 24.86 (22.27, 28.28) | 24.99 (22.23, 28.07) | 23.91 (21.62, 27.58) | 24.87 (22.3, 27.87) | 25.7 (23.23, 28.7) | 25.63 (23.13, 28.04) | 25.71 (23.25, 28.77) | 25.65 (23.02, 28.6) |
| Advised on ‘Shielded Patient List’: Yes, n (%) | 341/4109 (8.3%) | 279/3530 (7.9%) | 8/329 (2.4%) | 82/1374 (6.0%) | 86/748 (11.5%) | 23/691 (3.3%) | 190/1936 (9.8%) | 67/1754 (3.8%) | <5 | 45/1443 (3.1%) | 22/276 (8.0%) |
| Self-rated health: Poor, Fair, n (%) | 357/4082 (8.7%) | 290/3407 (8.5%) | 15/316 (4.7%) | 134/1364 (9.8%) | 60/737 (8.1%) | 42/656 (6.4%) | 168/1871 (9.0%) | 167/1778 (9.4%) | <5 | 137/1459 (9.4%) | 28/283 (9.9%) |
| Zygosity: Monozygotic, n (%) | 2722/4253 (64.0%) | 2280/3573 (63.8%) | 248/328 (75.6%) | 883/1375 (64.2%) | 459/748 (61.4%) | 490/689 (71.1%) | 1170/1937 (60.4%) | – | – | – | – |
| Anti-Spike antibody level value (BAU/mL): Median (IQR) | 80.78 (18.55, 250.0) | 10403.0 (3510.0, 20224.0) | 0.4 (0.4, 0.4) | 53.3 (22.72, 121.2) | 250.0 (250.0, 250.0) | 1317.0 (337.0, 5202.5) | 13694.0 (8153.0, 23543.0) | 58.93 (21.25, 247.5) | 10.53 (0.4, 48.69) | 43.42 (17.98, 106.65) | 250.0 (250.0, 250.0) |
| Anti-Spike antibody status: Positive, n (%) | 3372/3912 (86.2%) | 3423/3445 (99.4%) | 79/330 (23.9%) | 1357/1375 (98.7%) | 745/748 (99.6%) | 690/691 (99.9%) | 1936/1937 (99.9%) | 1745/1779 (98.1%) | 23/36 (63.9%) | 1440/1459 (98.7%) | 282/284 (99.3%) |
| Anti-Nucleocapsid antibody status, Q2: Positive, n (%) | 460/3893 (11.8%) | 333/2887 (11.5%) | 60/329 (18.2%) | 156/1368 (11.4%) | 87/743 (11.7%) | 85/565 (15.0%) | 160/1624 (9.9%) | 167/1757 (9.5%) | <5 | 133/1438 (9.2%) | 31/283 (11.0%) |
| Anti-Nucleocapsid antibody status, Q4: Positive, n (%) | 524/2998 (17.5%) | 618/3447 (17.9%) | 80/290 (27.6%) | 197/1130 (17.4%) | 95/602 (15.8%) | 179/691 (25.9%) | 263/1937 (13.6%) | – | – | – | – |
| Weeks since first vaccination: Median (IQR) | 10.0 (6.0, 12.0) | 42.0 (38.0, 45.0) | –5.0 (-8.0,–3.0) | 8.0 (6.0, 9.0) | – | – | – | – | – | 6.0 (5.0, 8.0) | – |
| First vaccination received: AZD1222 (Oxford/AZ), n (%) | 2124/3591 (59.1%) | 1980/3378 (58.6%) | 70/275 (25.5%) | 1103/1374 (80.3%) | – | – | – | – | – | 1235/1459 (84.6%) | – |
| First vaccination received: BNT162b2 (Pfizer BioNTech), n (%) | 1410/3591 (39.3%) | 1336/3378 (39.6%) | 170/275 (61.8%) | 266/1374 (19.4%) | – | – | – | – | – | 224/1459 (15.4%) | – |
| Weeks since second vaccination: Median (IQR) | –1.0 (-4.0, 2.0) | 32.0 (28.0, 34.0) | – | – | 3.0 (2.0, 5.0) | 25.0 (20.0, 28.0) | 33.0 (31.0, 35.0) | – | – | – | 4.0 (2.0, 6.0) |
| Second vaccination received: AZD1222 (Oxford/AZ), n (%) | 1858/3266 (56.9%) | 1888/3275 (57.6%) | – | – | 212/748 (28.3%) | 411/691 (59.5%) | 1065/1934 (55.1%) | – | – | – | 50/284 (17.6%) |
| Second vaccination received: BNT162b2 (Pfizer BioNTech), n (%) | 1357/3266 (41.5%) | 1330/3275 (40.6%) | – | – | 532/748 (71.1%) | 241/691 (34.9%) | 858/1934 (44.4%) | – | – | – | 234/284 (82.4%) |
| Weeks since third vaccination: Median (IQR) | –28.0 (-30.0,–26.0) | 5.0 (3.0, 7.0) | – | – | – | – | 5.0 (4.0, 8.0) | – | – | – | – |
| Third vaccination received: mRNA-1273 (Moderna), n (%) | 293/2149 (13.6%) | 337/2400 (14.0%) | – | – | – | – | 203/1903 (10.7%) | – | – | – | – |
| Third vaccination received: BNT162b2 (Pfizer BioNTech), n (%) | 1828/2149 (85.1%) | 2026/2400 (84.4%) | – | – | – | – | 1677/1903 (88.1%) | – | – | – | – |
| SARS-CoV-2 infection status (serology-based) at time of antibody testing: Evidence of natural infection, n (%) | 891/4190 (21.3%) | 977/3561 (27.4%) | 98/330 (29.7%) | 304/1375 (22.1%) | 157/748 (21.0%) | 245/691 (35.5%) | 464/1937 (24.0%) | 187/1757 (10.6%) | 23/36 (63.9%) | 133/1438 (9.2%) | 31/283 (11.0%) |
| SARS-CoV-2 infection status (self-reported), Q2: Suspected case, n (%) | 477/4092 (11.7%) | 399/3428 (11.6%) | 35/320 (10.9%) | 183/1365 (13.4%) | 67/739 (9.1%) | 81/662 (12.2%) | 197/1882 (10.5%) | 302/1675 (18.0%) | 5/33 (15.2%) | 240/1374 (17.5%) | 57/268 (21.3%) |
| SARS-CoV-2 infection status (self-reported), Q2: Confirmed case, n (%) | 597/4092 (14.6%) | 492/3428 (14.4%) | 57/320 (17.8%) | 218/1365 (16.0%) | 112/739 (15.2%) | 107/662 (16.2%) | 256/1882 (13.6%) | 40/1675 (2.4%) | <5 | 29/1374 (2.1%) | 11/268 (4.1%) |
| SARS-CoV-2 infection status (self-reported), Q4: Suspected case, n (%) | 478/4134 (11.6%) | 404/3543 (11.4%) | 34/330 (10.3%) | 183/1375 (13.3%) | 70/748 (9.4%) | 78/691 (11.3%) | 204/1936 (10.5%) | – | – | – | – |
| SARS-CoV-2 infection status (self-reported), Q4: Confirmed case, n (%) | 817/4134 (19.8%) | 751/3543 (21.2%) | 92/330 (27.9%) | 306/1375 (22.3%) | 145/748 (19.4%) | 202/691 (29.2%) | 357/1936 (18.4%) | – | – | – | – |
Table 3
Association between post-vaccination infection and anti-Spike antibody levels within TwinsUK.
Logistic regression model results, testing association between post-vaccination infection, and Q2 anti-Spike antibody levels in single-vaccinated individuals within TwinsUK. Reference category was a Q2 antibody level in quintile 5 (highest 20%). Results present odds ratios, unadjusted 95% confidence intervals, and p-values adjusted for multiple testing.
| Q2 antibody level | Post-vaccination infection incidence rate (%) | UnadjustedOR (95% CI), p-value | Adjusted for: Weeks since vaccinationOR (95% CI), p-value | Adjusted for: Age, sex, weeks since vaccinationOR (95% CI), p-value |
|---|---|---|---|---|
| Quintile 1 (lowest 20%): 0.4–18 BAU/mL | 32/233 (13.7%) | 3.23 (1.58–6.58), p=0.009 | 2.85 (1.39–5.86), p=0.03 | 2.93 (1.42–6.04), p=0.02 |
| Quintile 2: 18–40 BAU/mL | 20/226 (8.8%) | 1.97 (0.92–4.21), p=0.11 | 2.04 (0.94–4.43), p=0.08 | 2.15 (0.99–4.68), p=0.06 |
| Quintile 3: 40–73 BAU/mL | 21/239 (8.8%) | 1.95 (0.92–4.15), p=0.11 | 2.26 (1.04–4.92), p=0.06 | 2.41 (1.11–5.27), p=0.04 |
| Quintile 4: 73–164 BAU/mL | 21/230 (9.1%) | 2.04 (0.96–4.33), p=0.11 | 2.39 (1.10–5.22), p=0.06 | 2.55 (1.17–5.58), p=0.04 |
| Quintile 5 (highest 20%): ≥164 BAU/mL (reference) | 11/234 (4.7%) | 1.00 | 1.00 | 1.00 |
Additional files
-
Supplementary file 1
Information on origin of variables used in TwinsUK and Avon Longitudinal Study of Parents and Children (ALSPAC) analysis.
- https://cdn.elifesciences.org/articles/80428/elife-80428-supp1-v2.xlsx
-
Supplementary file 2
Anti-Spike antibody level values and characteristics for individuals from TwinsUK sampled in Q2 and Q4 antibody collections.
Individuals are stratified by vaccination status at time of sampling. Data shown for individuals sampled at least 4 (2) weeks after first (second or third) vaccination. The antibody level assay range is 0.4–250 BAU/mL for Q2 results and 0.4–25000 BAU/mL for Q4 results, with a positive threshold of 0.8 BAU/mL. Categories with fewer than five individuals are suppressed.
- https://cdn.elifesciences.org/articles/80428/elife-80428-supp2-v2.docx
-
Supplementary file 3
Severe acute respiratory syndrome coronavirus 2 (SARS-CoV-2) infection prevalence rates, split by selected socio-demographic variables, for TwinsUK Q4 antibody testing participants.
p-Values are generated from chi-square test of independence on cross tabulation of counts for the socio-demographic variable of interest and all categories (including those not presented) of the SARS-CoV-2 infection variable.
- https://cdn.elifesciences.org/articles/80428/elife-80428-supp3-v2.docx
-
Supplementary file 4
Anti-Spike antibody levels and weeks since most recent vaccination within TwinsUK and Avon Longitudinal Study of Parents and Children (ALSPAC) individuals, stratified by vaccination status at Q2 and Q4 antibody testing, split by various variables.
The antibody level assay range is 0.4–250 BAU/mL for Q2 results and 0.4–25000 BAU/mL for Q4 results, with a positive threshold of 0.8 BAU/mL.
- https://cdn.elifesciences.org/articles/80428/elife-80428-supp4-v2.docx
-
Supplementary file 5
Descriptive statistics relating to post-vaccination infections within TwinsUK, within groups of individuals with varying vaccination status at Q2 and Q4 testing.
- https://cdn.elifesciences.org/articles/80428/elife-80428-supp5-v2.docx
-
Supplementary file 6
Logistic regression model results, testing for association between post-vaccination infection and socio-demographic, severe acute respiratory syndrome coronavirus 2 (SARS-CoV-2) vaccination, and SARS-CoV-2 infection variables for TwinsUK individuals who participated in antibody testing at Q2 and one or both of Q4 antibody testing and Q4 questionnaire, who reported one or more vaccination reported by Q4.
Results present odds ratios, unadjusted 95% confidence intervals, and p-values adjusted for multiple testing. Results based on fewer than three individuals having post-vaccination infection are suppressed. Variables with adjusted p-values <0.05 are highlighted in bold.
- https://cdn.elifesciences.org/articles/80428/elife-80428-supp6-v2.docx
-
Supplementary file 7
Logistic regression model results, testing for association with low anti-Spike antibody levels after first, second, and third severe acute respiratory syndrome coronavirus 2 (SARS-CoV-2) vaccination within TwinsUK and Avon Longitudinal Study of Parents and Children (ALSPAC) at Q2 or Q4 testing.
Results present odds ratios, unadjusted 95% confidence intervals, and p-values adjusted for multiple testing. Results based on fewer than three individuals being in the low antibody level group are suppressed. Sets of adjustment variables included in addition to the exposure variable in each model were age, sex, most recent vaccine received and weeks since most recent vaccination, aside from cases where the effect of adjustment variables were themselves tested. In these cases, all other adjustment variables within the given set were included in addition to the adjustment variable being tested. Variables with adjusted p-values <0.05 are highlighted in bold.
- https://cdn.elifesciences.org/articles/80428/elife-80428-supp7-v2.docx
-
Supplementary file 8
Descriptive statistics of differences in anti-Spike antibody levels between pairs after third severe acute respiratory syndrome coronavirus 2 (SARS-CoV-2) vaccination within TwinsUK.
Pair differences are calculated between all complete pairs of monozygotic (MZ) twins and/or dizygotic (DZ) twins, and all combinations of non-related pairs.
- https://cdn.elifesciences.org/articles/80428/elife-80428-supp8-v2.docx
-
Supplementary file 9
Results of generalised linear mixed effects models testing association with anti-Spike antibody levels after third severe acute respiratory syndrome coronavirus 2 (SARS-CoV-2) vaccination within and between twin-pairs within TwinsUK.
Coefficients with unadjusted 95% confidence intervals and unadjusted p-values are presented. Family structure is included as a random effect, allowing intercepts to vary between twin-pairs. Models are adjusted for age, sex, weeks since third vaccination, third vaccine received, and serology-based infection status. Variables with (two-sided) p-values <0.05 are highlighted in bold.
- https://cdn.elifesciences.org/articles/80428/elife-80428-supp9-v2.docx
-
MDAR checklist
- https://cdn.elifesciences.org/articles/80428/elife-80428-mdarchecklist1-v2.pdf
Download links
A two-part list of links to download the article, or parts of the article, in various formats.
Downloads (link to download the article as PDF)
Open citations (links to open the citations from this article in various online reference manager services)
Cite this article (links to download the citations from this article in formats compatible with various reference manager tools)
Antibody levels following vaccination against SARS-CoV-2: associations with post-vaccination infection and risk factors in two UK longitudinal studies
eLife 12:e80428.
https://doi.org/10.7554/eLife.80428


