Structure of SARS-CoV-2 M protein in lipid nanodiscs
- Biophysics Graduate Group, University of California, Berkeley, United States
- Department of Molecular and Cell Biology, Helen Wills Neuroscience Institute, and California Institute for Quantitative Biosciences (QB3), University of California, Berkeley, United States
- Department of Chemistry, Chicago Center for Theoretical Chemistry, Institute for Biophysical Dynamics, and James Franck Institute, The University of Chicago, United States
- Materials and Structural Analysis Division, Thermo Fisher Scientific, Netherlands
Figures
Figure 1 with 4 supplements
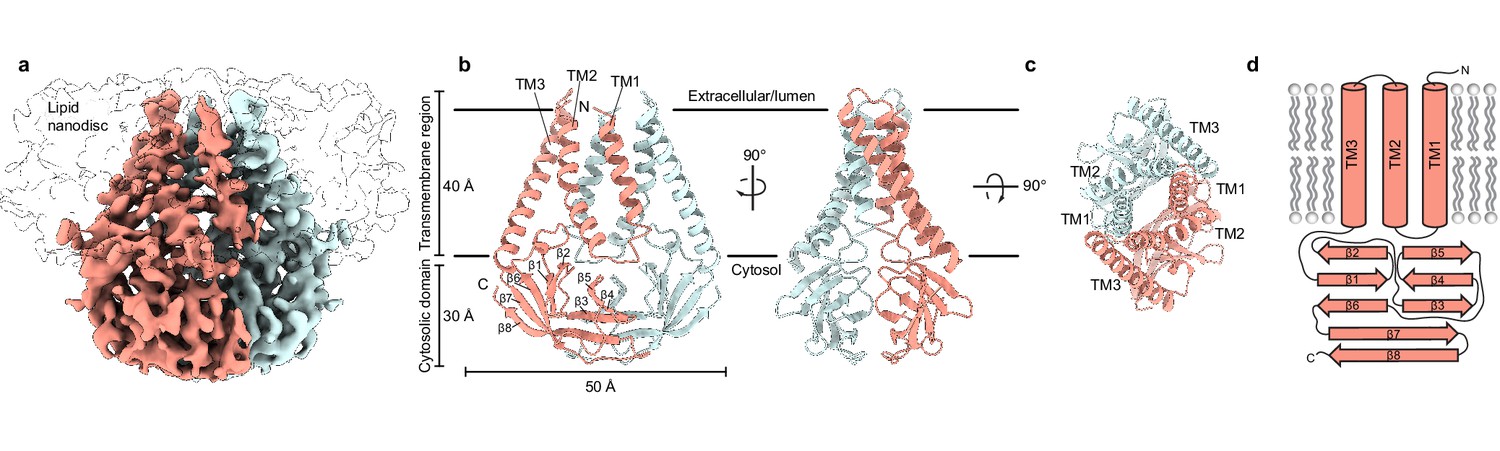
Structure of SARS-CoV-2 membrane (M) in lipid nanodiscs.
(a) A 3.5 Å resolution cryo-EM map of SARS-CoV-2 M in MSP1E3D1 nanodiscs viewed from the membrane. One subunit is colored pink, and the second subunit is colored blue. Density corresponding to the lipid nanodisc is shown transparent. (b,c) Model of M viewed (b) from the membrane in two rotations and (c) from the extracellular or lumenal side. (d) Cartoon schematic of an M monomer with secondary structure elements indicated.
Figure 1—figure supplement 1
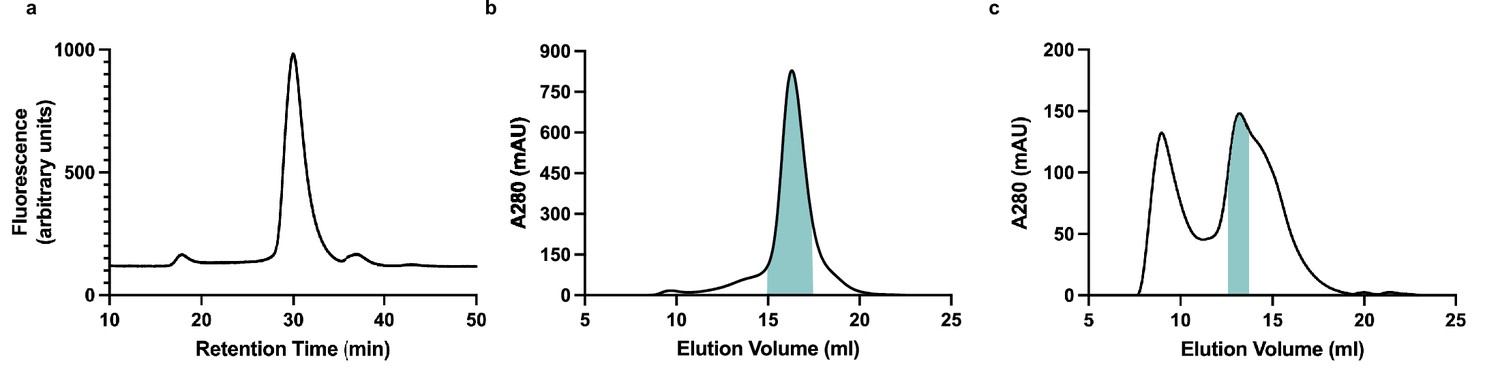
Purification and reconstitution of membrane (M).
(a) Fluorescence size exclusion chromatogram of M expressed in insect cells and extracted in DDM/CHS. (b) Size exclusion chromatogram of M expressed in insect cells and extracted and purified in DDM/CHS. (c) Size exclusion chromatogram of M reconstituted into MSP1E3D1 lipid nanodiscs. Samples were run on Superose 6 columns. Blue bars indicate pooled fractions.
Figure 1—figure supplement 2
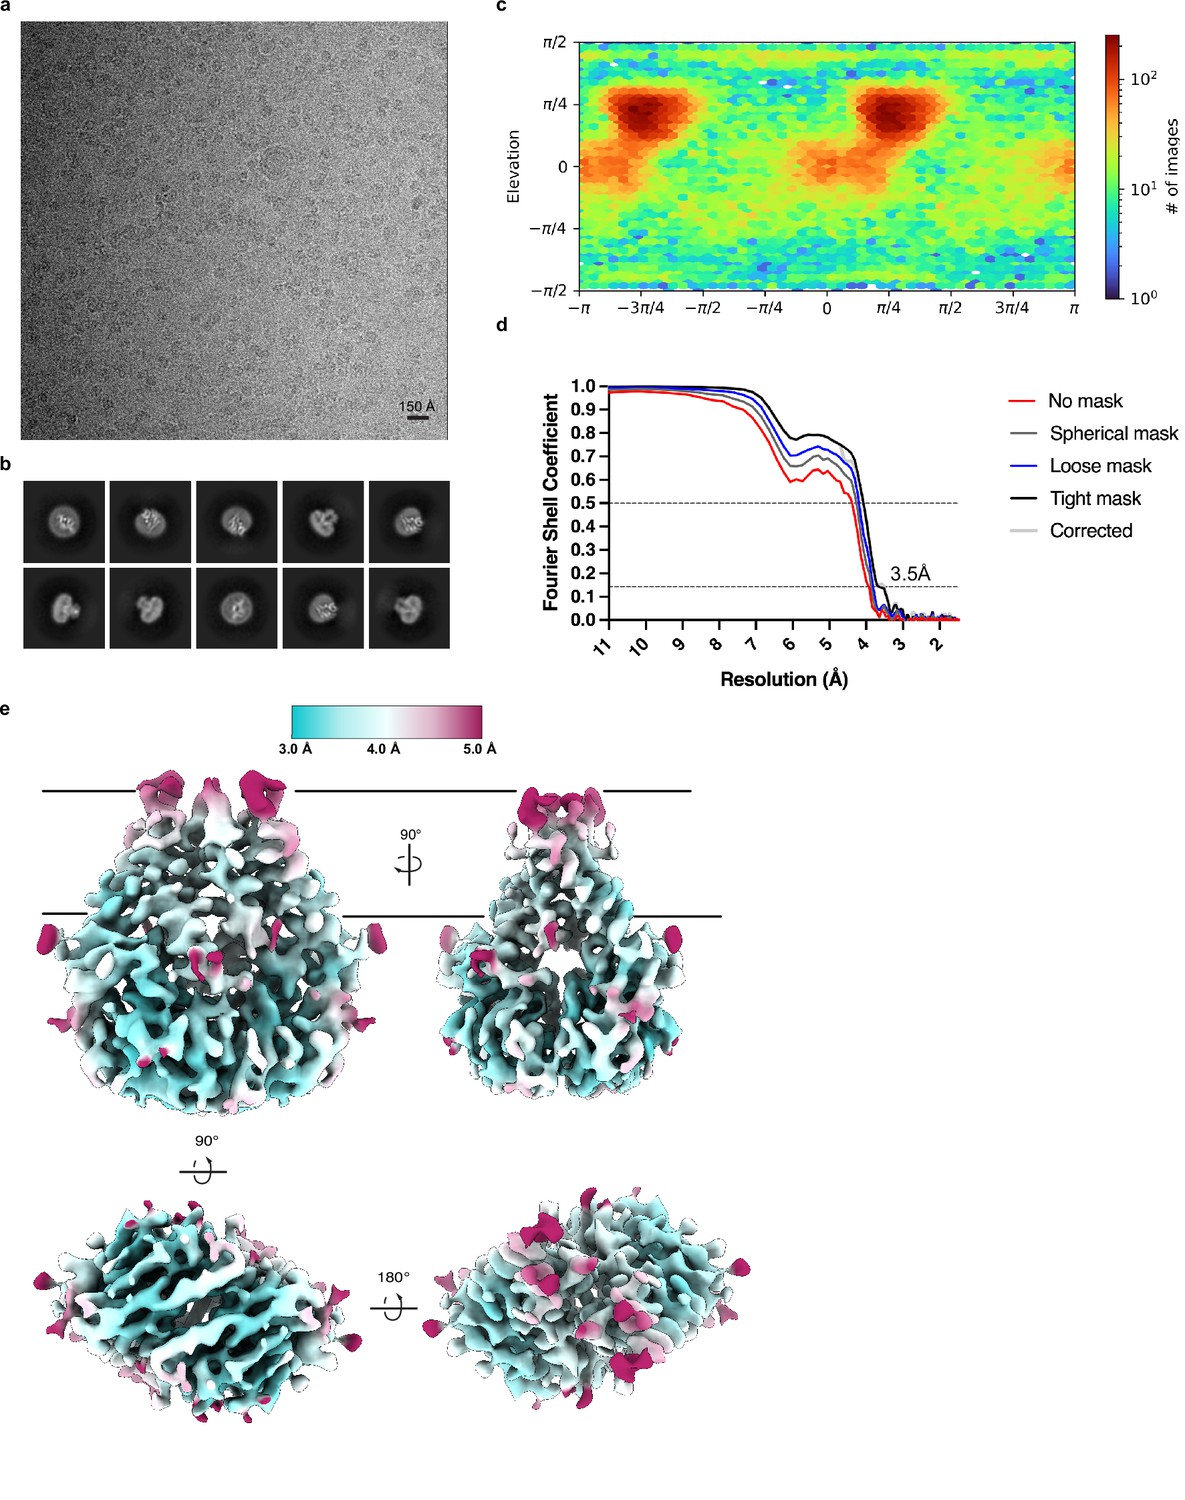
Cryo-EM processing and validation.
(a) Representative micrograph, (b) selected 2D class averages, (c) angular distribution of particles used in final refinement, (d) Fourier shell correlation (FSC) relationships, and (e) local resolution estimated in cryoSPARC colored as indicated on the final map. Side, top, and bottom views are shown.
Figure 1—figure supplement 3
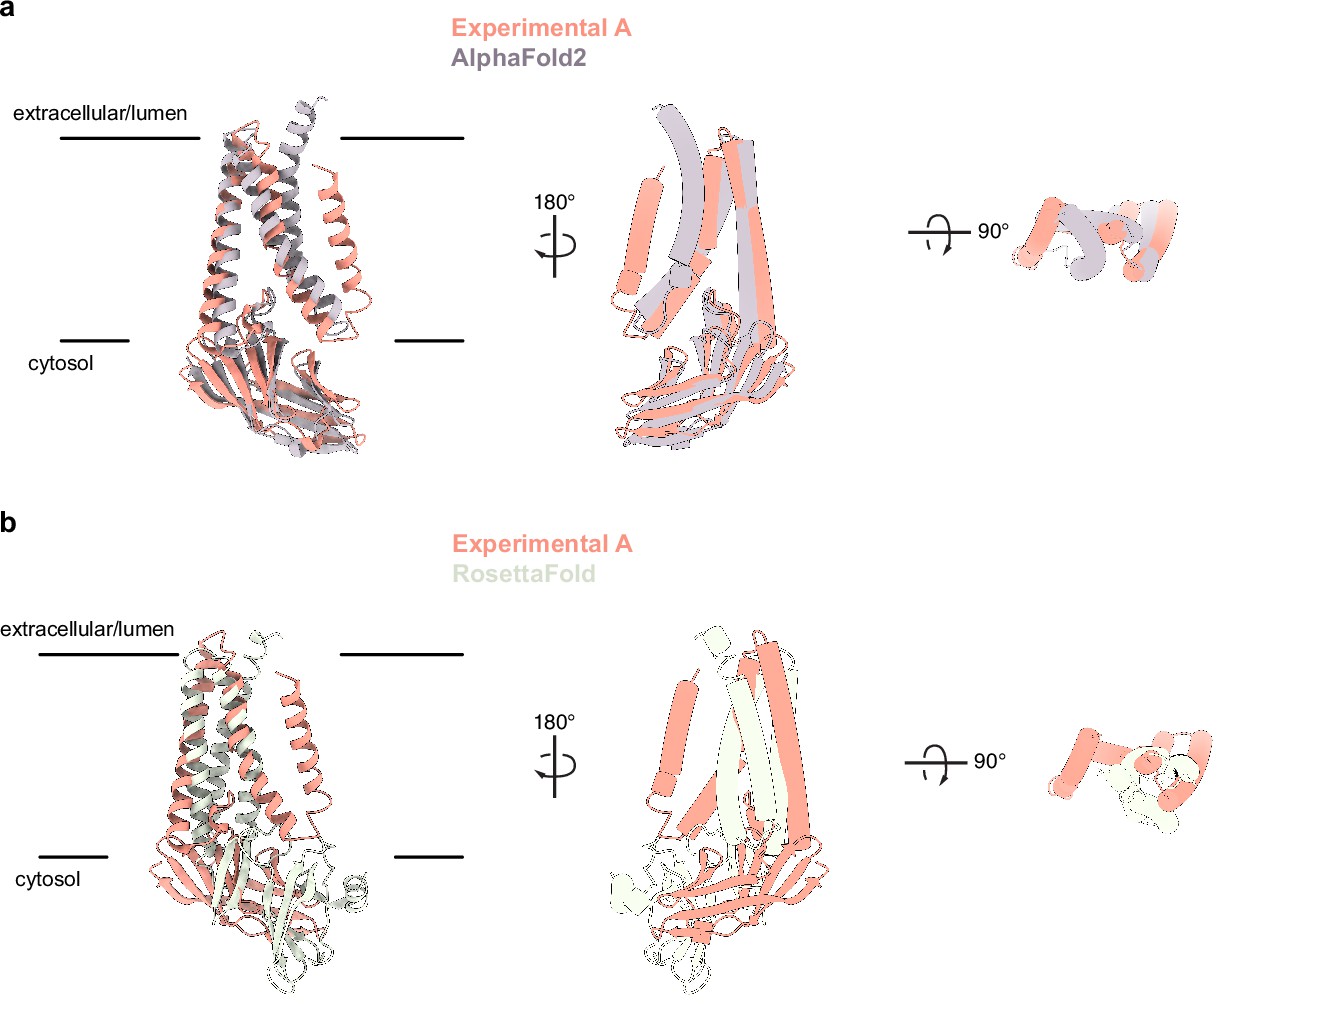
Comparison of experimentally determined and predicted membrane (M) protein structures.
(a) Overlay of the experimental and AlphaFold2 predicted M structures (Jumper et al., 2021). (b) Overlay of experimental and one RoseTTAfold predicted M structure (Heo and Feig, 2020). Major differences are observed in chain topology in the transmembrane region and relative orientation of transmembrane and cytosolic domains.
Figure 1—figure supplement 4
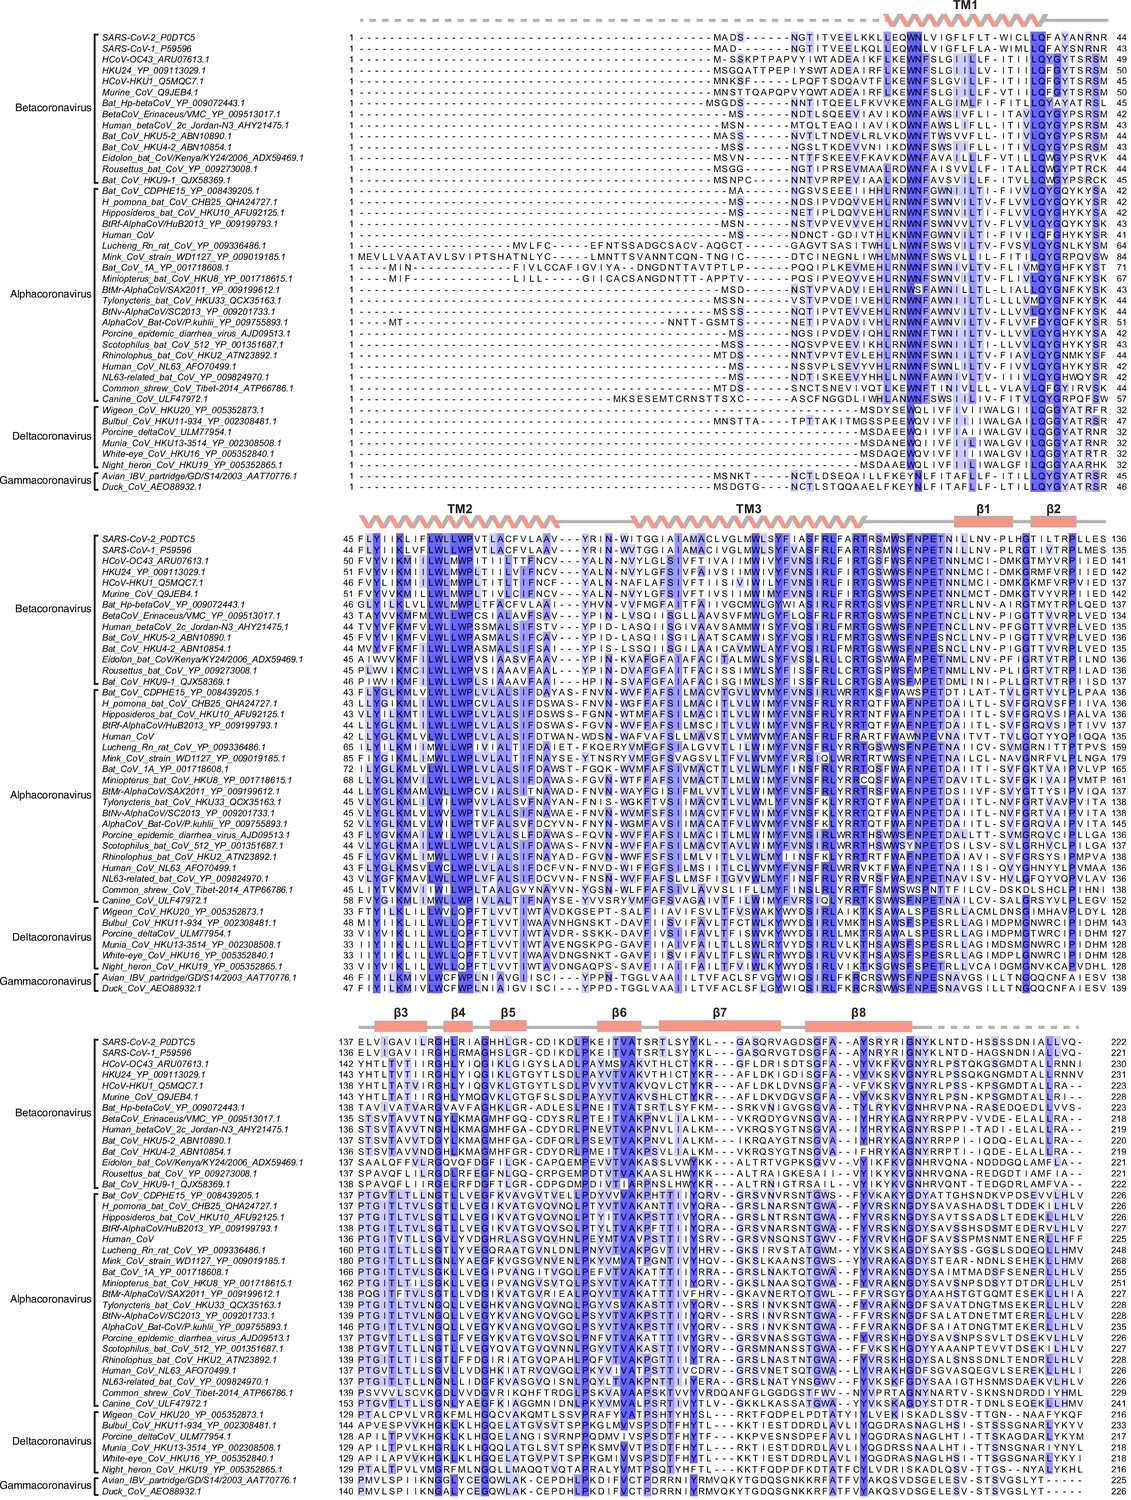
Sequence alignment of membrane (M) proteins across Coronaviridae.
(A) Alignment of 42 M protein sequences colored by conservation in a ramp from white (not conserved) to dark blue (highly conserved). Accession numbers are indicated. Sequences were selected from representative species from each Coronavirus subgenus. Secondary structure from SARS-CoV-2 M is drawn above the alignment.
Figure 2
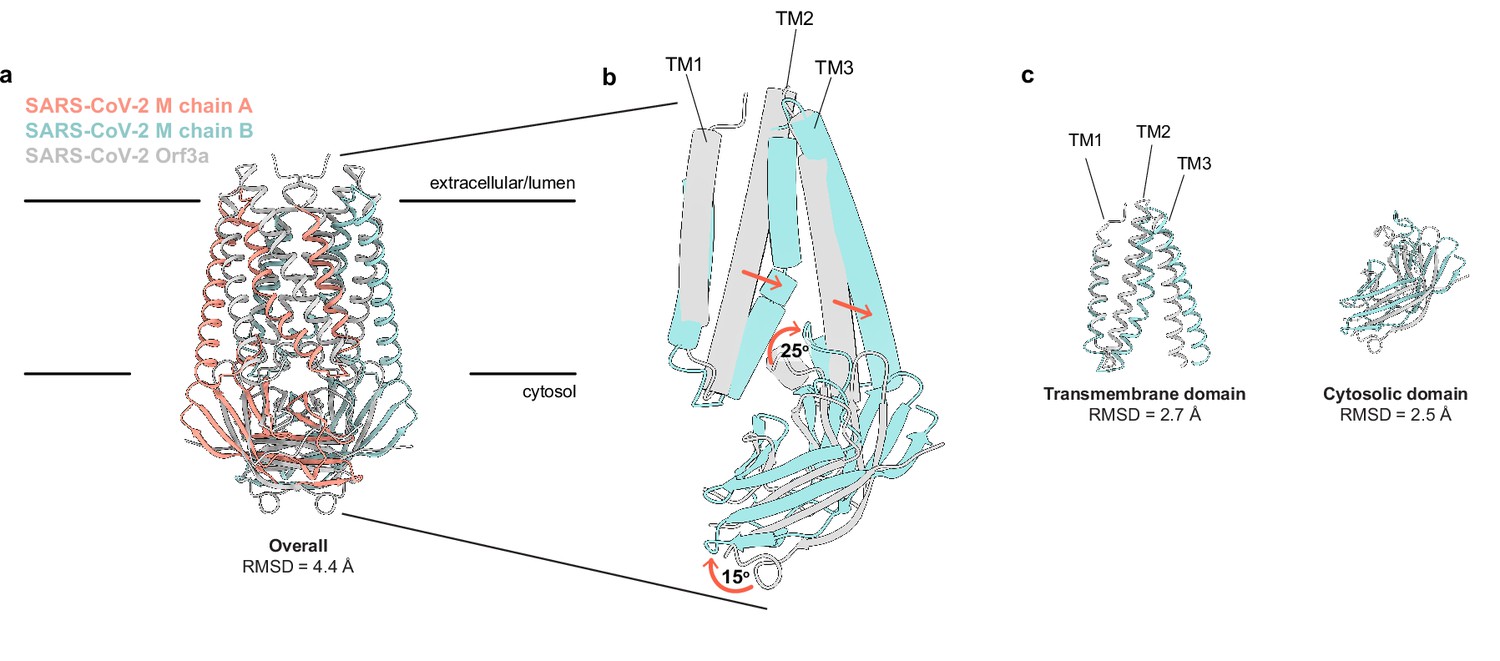
SARS-CoV-2 membrane (M) and ORF3a proteins are structurally homologous.
(a) Overlay of M and ORF3a structures. M is colored with one subunit pink and the second subunit blue and ORF3a is white. (b) Overlay of a single subunit indicating major conformational rearrangements. (c) Overlay of isolated transmembrane and cytosolic domains from each protein.
Figure 3
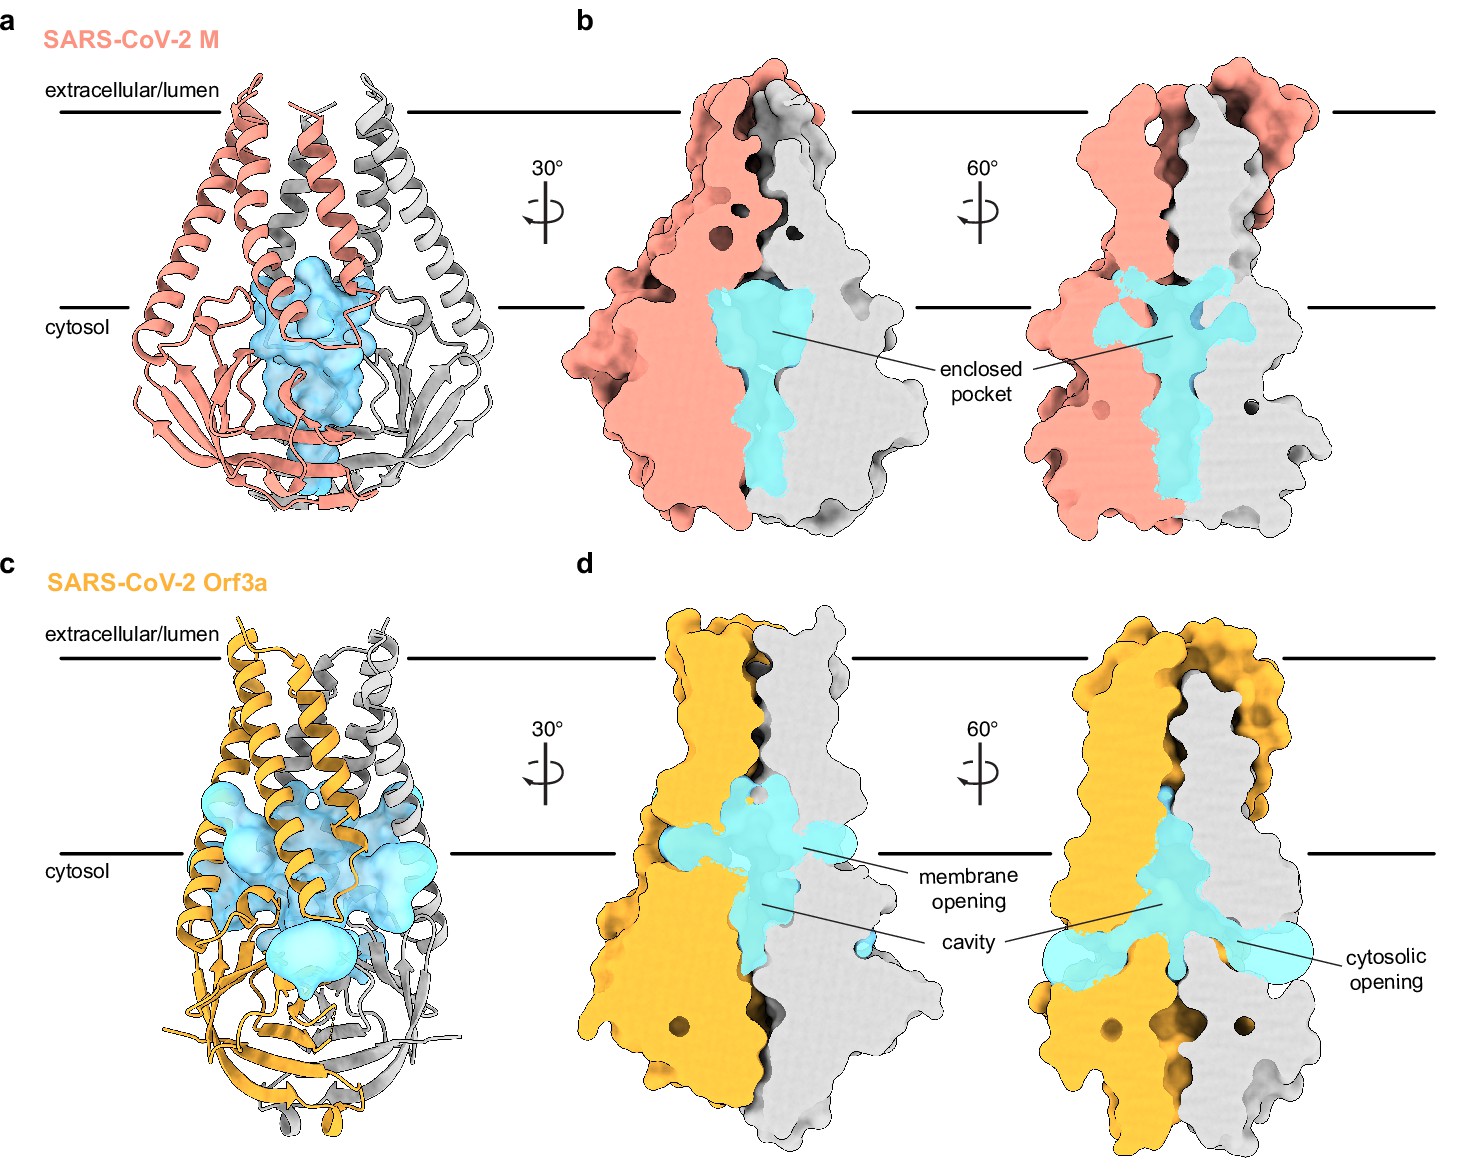
An enclosed polar pocket between cytosolic domains in membrane (M).
(a) M shown as a cartoon and (b) surface with enclosed pocket volume calculated with CASTp36 shown as a blue surface. The enclosed pocket in M is formed between cytosolic domains and is sealed to the surrounding solution by protein. (c,d) Same as (a,b), but for SARS-CoV-2 ORF3a. The cavity in ORF3a begins closer to the lipid bilayer, extends approximately halfway across the membrane, and is open to surrounding solution and lipids through multiple openings (Kern et al., 2021).
Figure 4
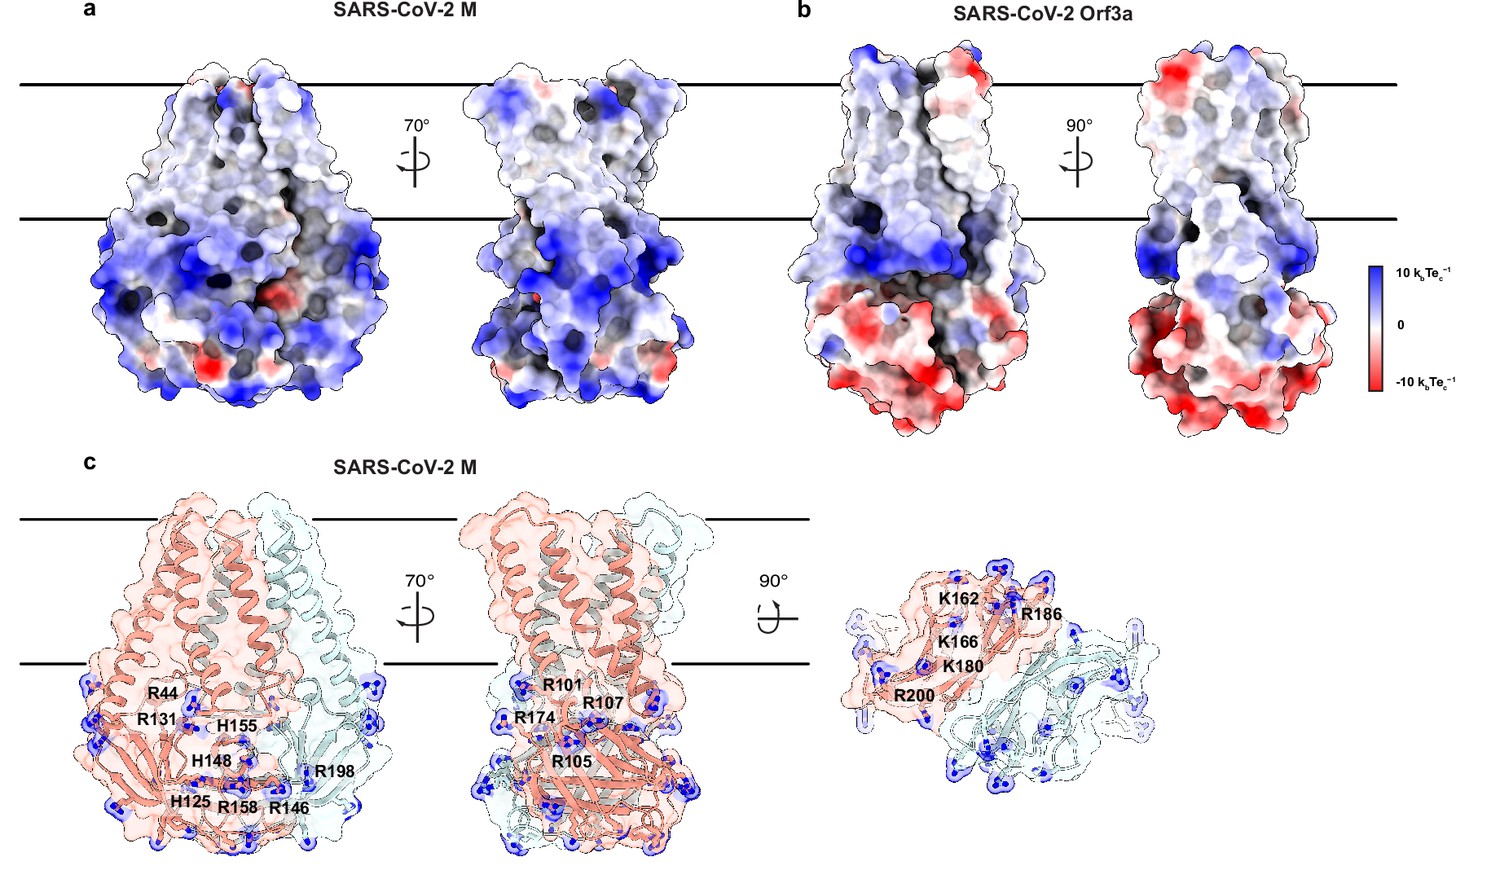
An electropositive cytosolic surface in membrane (M).
(a,b) Views of the wide and narrow faces of (a) M and (b) ORF3a colored according to electrostatic surface potential from red (electronegative, –10 kbTec-1) to blue (electropositive, +10 kbTec-1). (c) Views of three electropositive surface patches on M cytosolic domains with basic residues labeled and shown as sticks with blue nitrogen atoms.
Figure 5 with 1 supplement
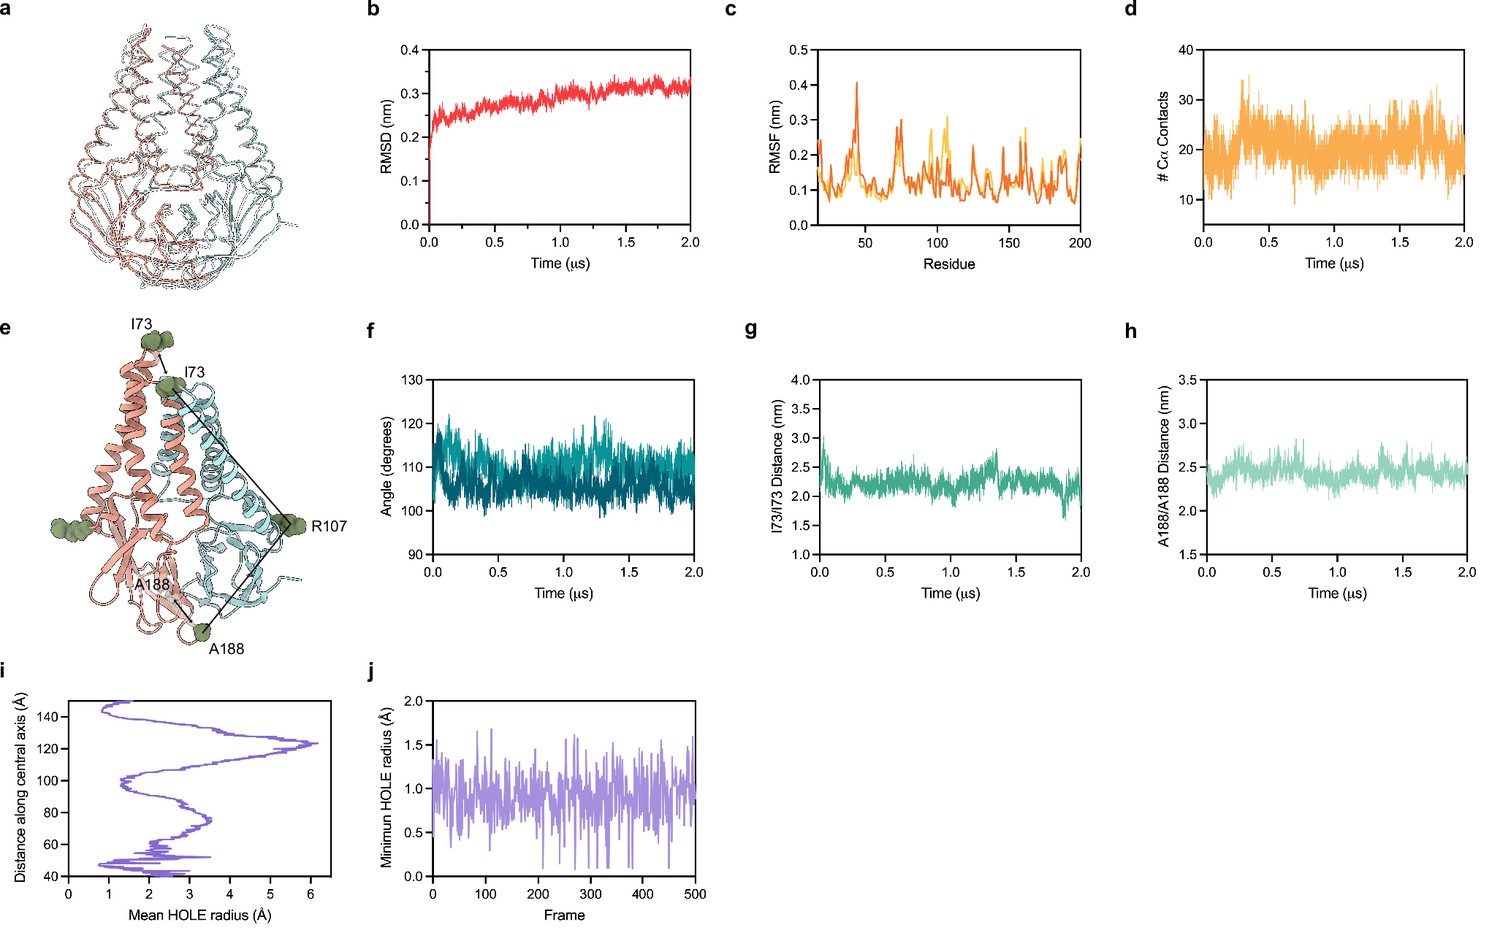
Molecular dynamics simulation of membrane (M).
(a) Overlay of M cryo-EM structure (colored in pink and blue) and final structure (in white) following 2.0 μs all-atom molecular dynamics simulation. (b) Overall RMSD between simulated and initial structure during simulation. (c) Root mean square fluctuation of protein residues in the simulation. Orange and yellow colors correspond to individual M protein chains. (d) Number of C-alpha contacts between two monomers. (e) Structural representation of distances and angles used for calculations in (f–h). (f) A188-R107-I73 angle plot for each monomer. One monomer has slightly higher values than the other. (g) Center of mass distance between I73 residues at the top of the TM2-TM3 linker. (h) Center of mass distance between A188 residues at the base of the cytosolic domains. (i) Mean radius of the enclosed pocket in M over the simulation trajectory versus distance along the symmetry axis. At its widest positions, the pocket is wide enough to accommodate two water molecules. (j) Minimum hole radius versus the frame number in the simulation. The lack of substantial changes in radius indicates a stable pocket size and shape that does not open to solution during the simulation.
Figure 5—figure supplement 1
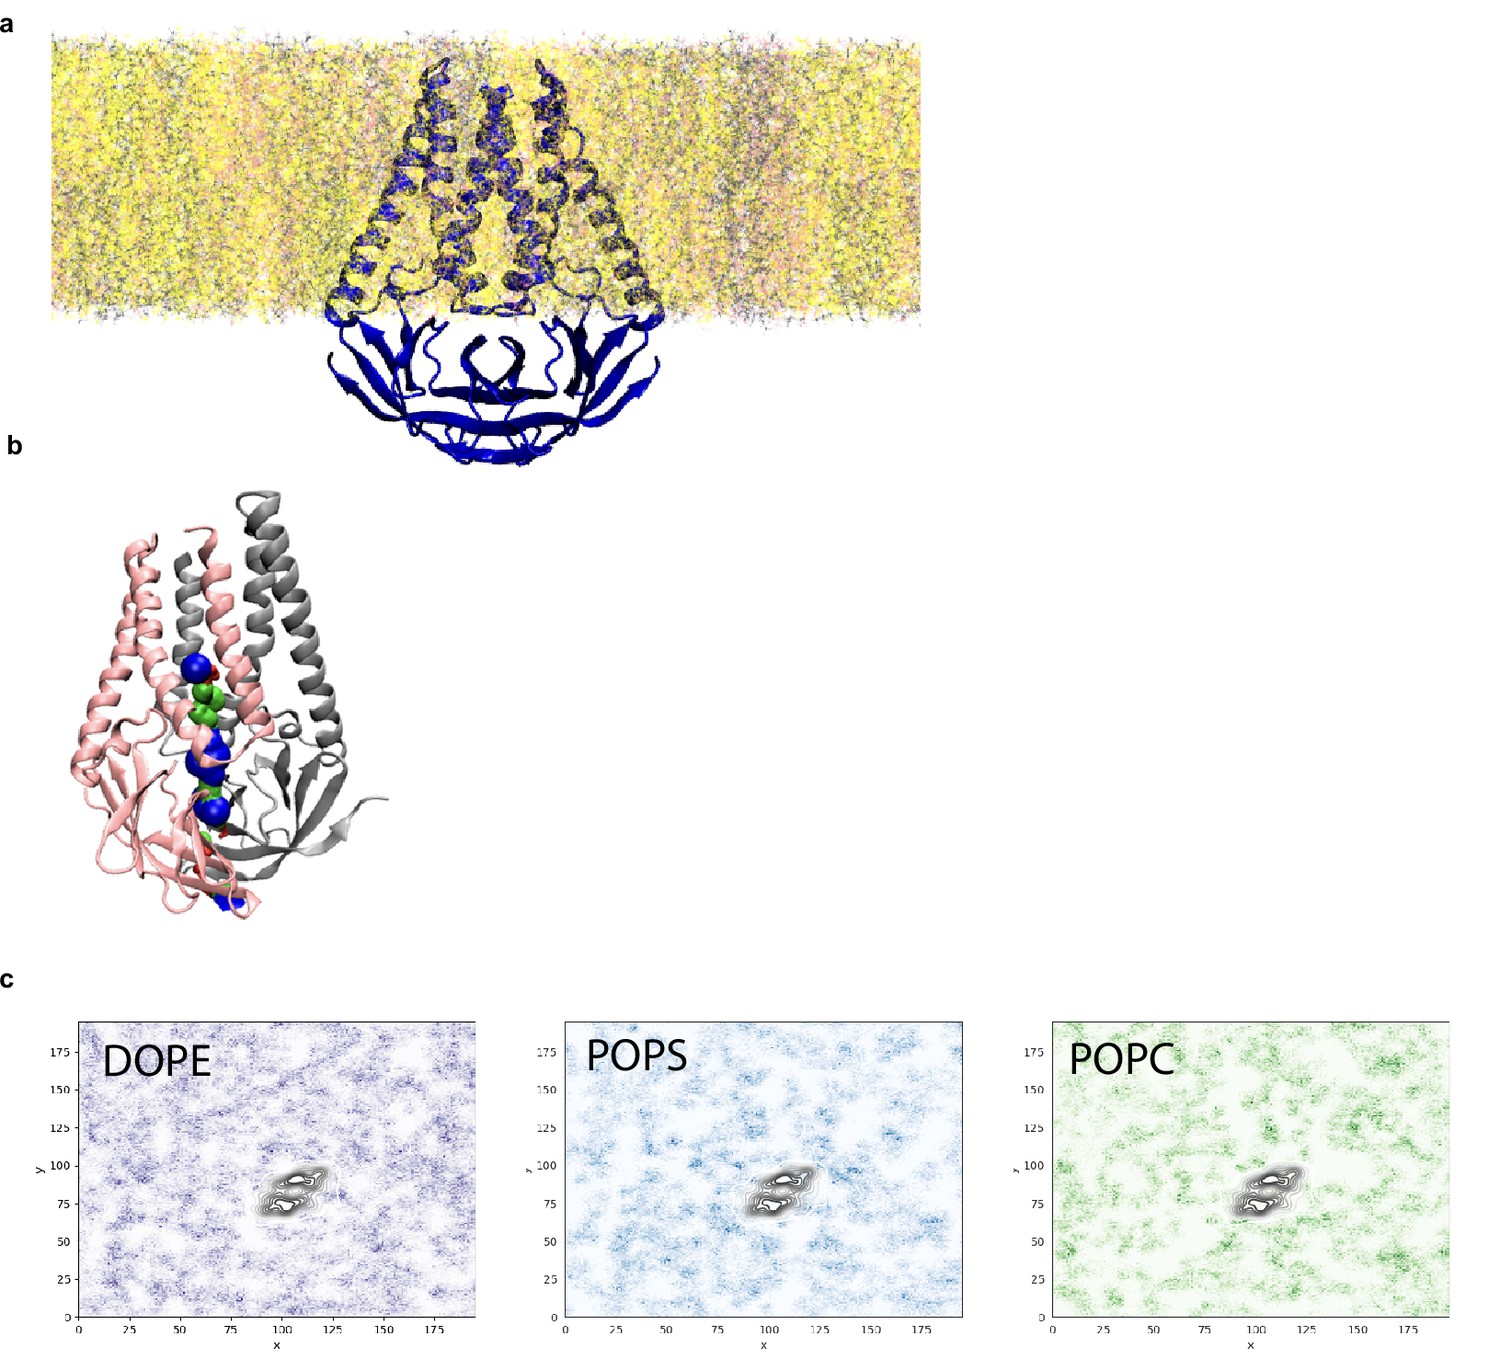
Analysis of pocket size and lipid interactions from molecular dynamics simulation.
(a) Equilibrated membrane (M) structure in lipid membrane consisting of DOPE:POPS:POPC in a 2:1:1 mass ratio. (b) Final M structure of the simulation shown with the pocket colored red where the radius is too small for a water molecule, green where it can accommodate a single water molecule, and blue where it can accommodate two water molecules. (c) Lipid sorting patterns. Darker regions indicate higher density of the lipids. Black color is the average location of the M dimer. No obvious pattern of enrichment is observed.
Additional files
-
Supplementary file 1
Cryo-EM data collection, processing, refinement, and modeling data.
- https://cdn.elifesciences.org/articles/81702/elife-81702-supp1-v2.docx
-
MDAR checklist
- https://cdn.elifesciences.org/articles/81702/elife-81702-mdarchecklist1-v2.pdf
Download links
A two-part list of links to download the article, or parts of the article, in various formats.
Downloads (link to download the article as PDF)
Open citations (links to open the citations from this article in various online reference manager services)
Cite this article (links to download the citations from this article in formats compatible with various reference manager tools)
Structure of SARS-CoV-2 M protein in lipid nanodiscs
eLife 11:e81702.
https://doi.org/10.7554/eLife.81702


