A model-based analysis of the health impacts of COVID-19 disruptions to primary cervical screening by time since last screen for current and future disruptions
- Center for Health Decision Science, Harvard T.H. Chan School of Public Health, United States
- Department of Health Management and Health Economics, University of Oslo, Norway
- Department of Public Health, Erasmus MC, University Medical Center Rotterdam, Netherlands
- Centre for Health Policy & Management, School of Medicine, Trinity College Dublin, Ireland
- Faculty of Life Sciences & Medicine, School of Cancer & Pharmaceutical Sciences, King’s College London, United Kingdom
- Cancer Research Division, Cancer Council NSW, Australia
- Hokkaido University Center for Environmental and Health Sciences, Japan
- Daffodil Centre, University of Sydney, a joint venture with Cancer Council NSW, Australia
Figures
Figure 1
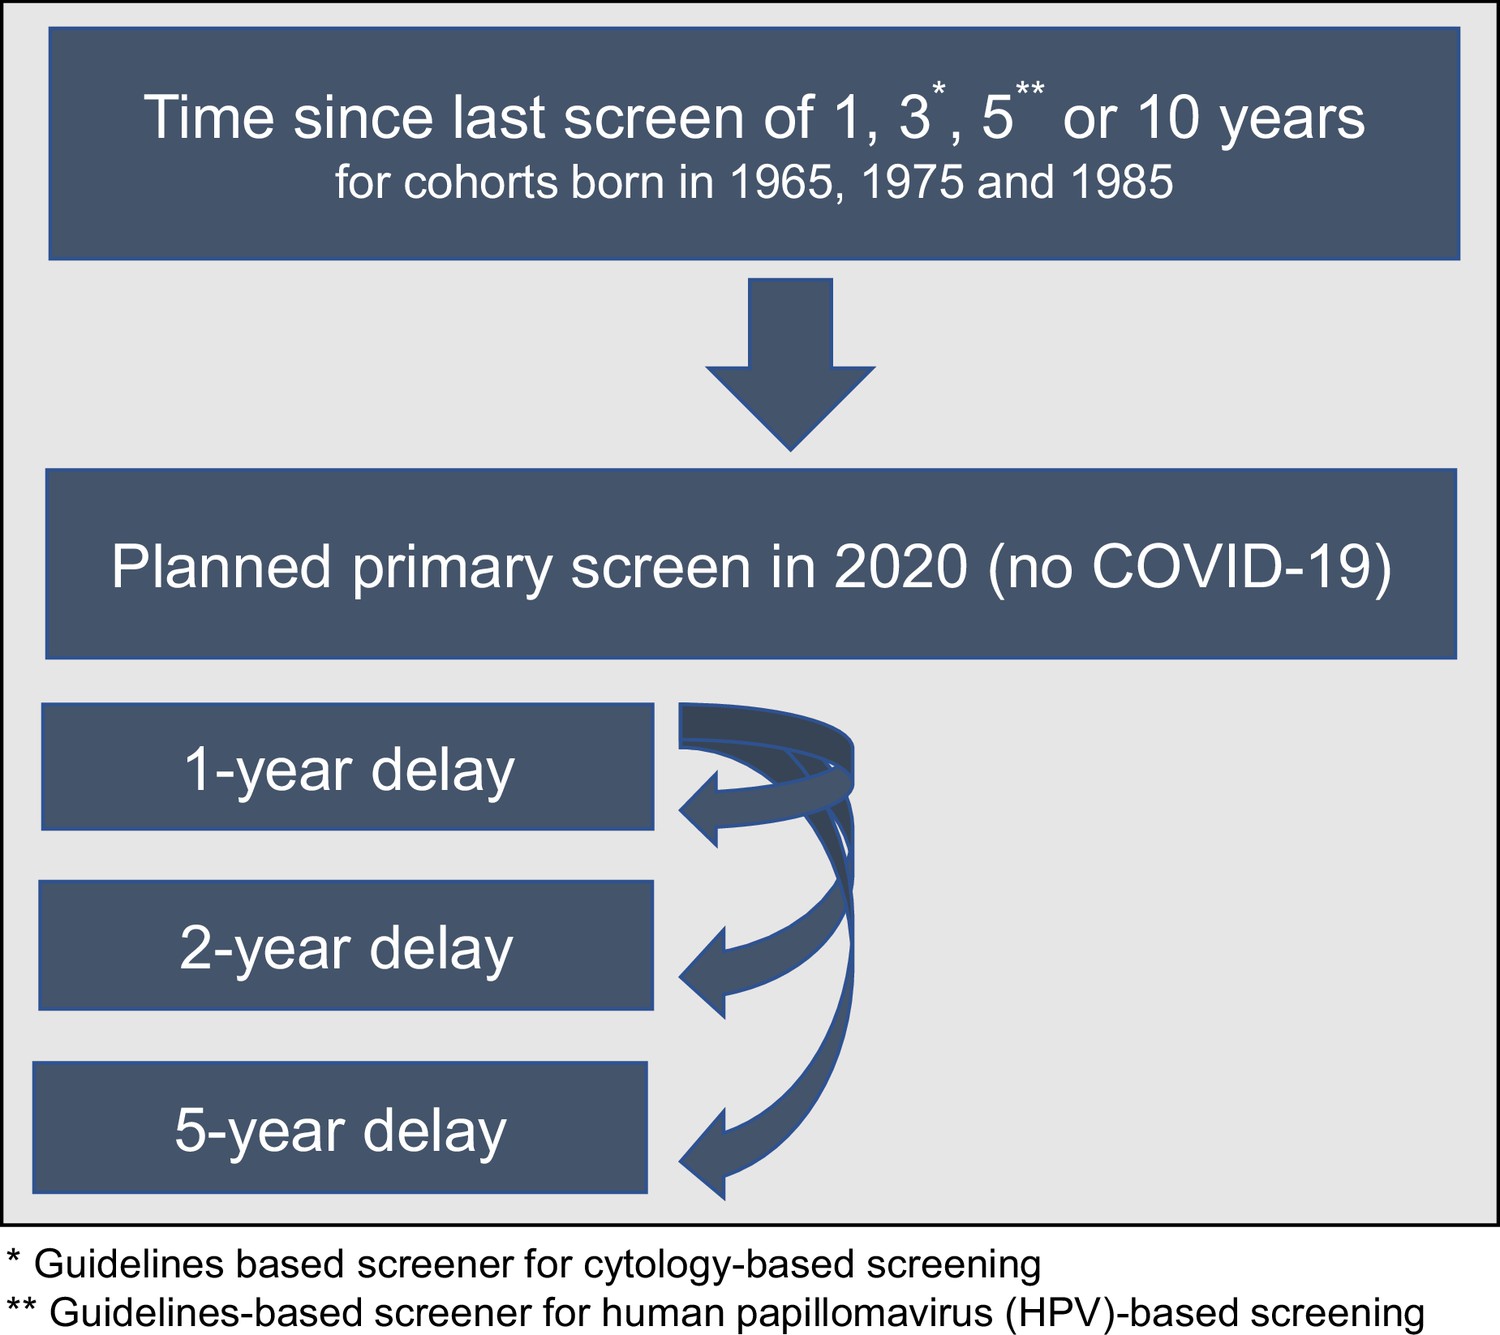
Scenario overview reflecting the heterogeneity in screening history (aligned so that 2020 was 1, 3, 5, or 10 years since their last screen) facing alternative COVID-19 delay disruptions for three birth cohorts of women.
Figure 2
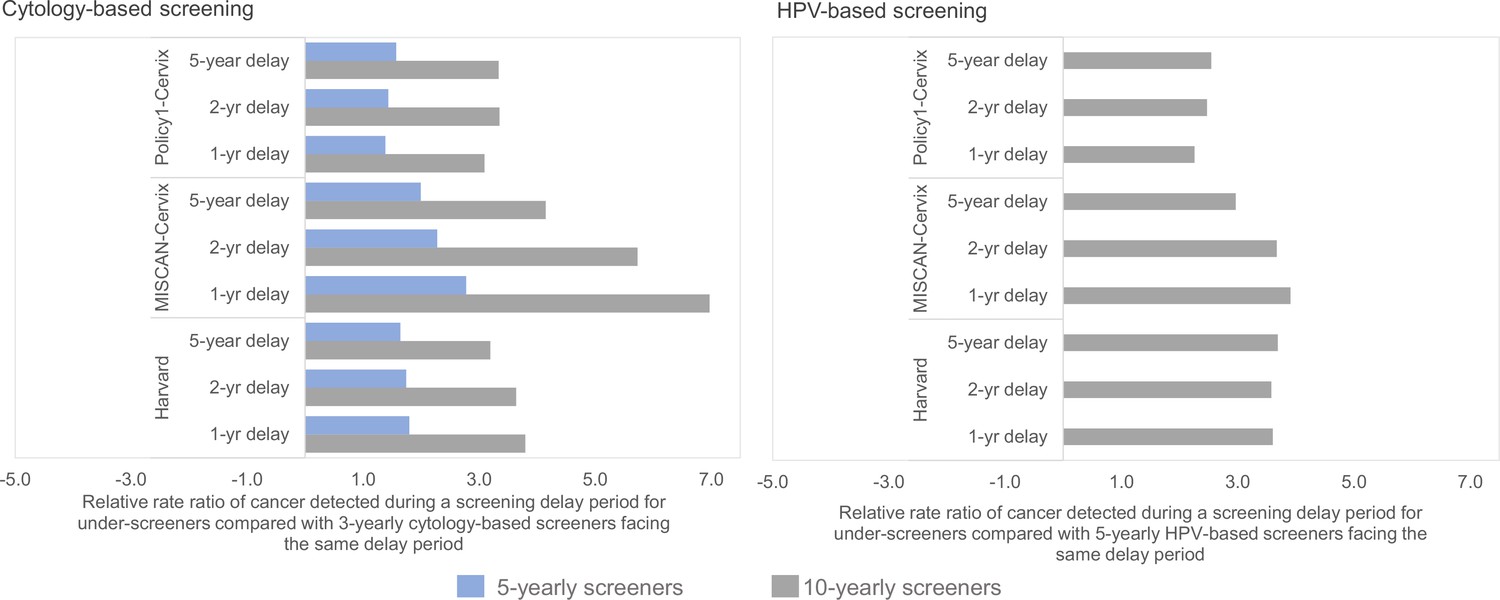
Short-term impacts: relative rate ratio of cancer detected during the screening delay period for underscreeners compared with the same delay duration for guidelines-compliant screeners.
Figure 3
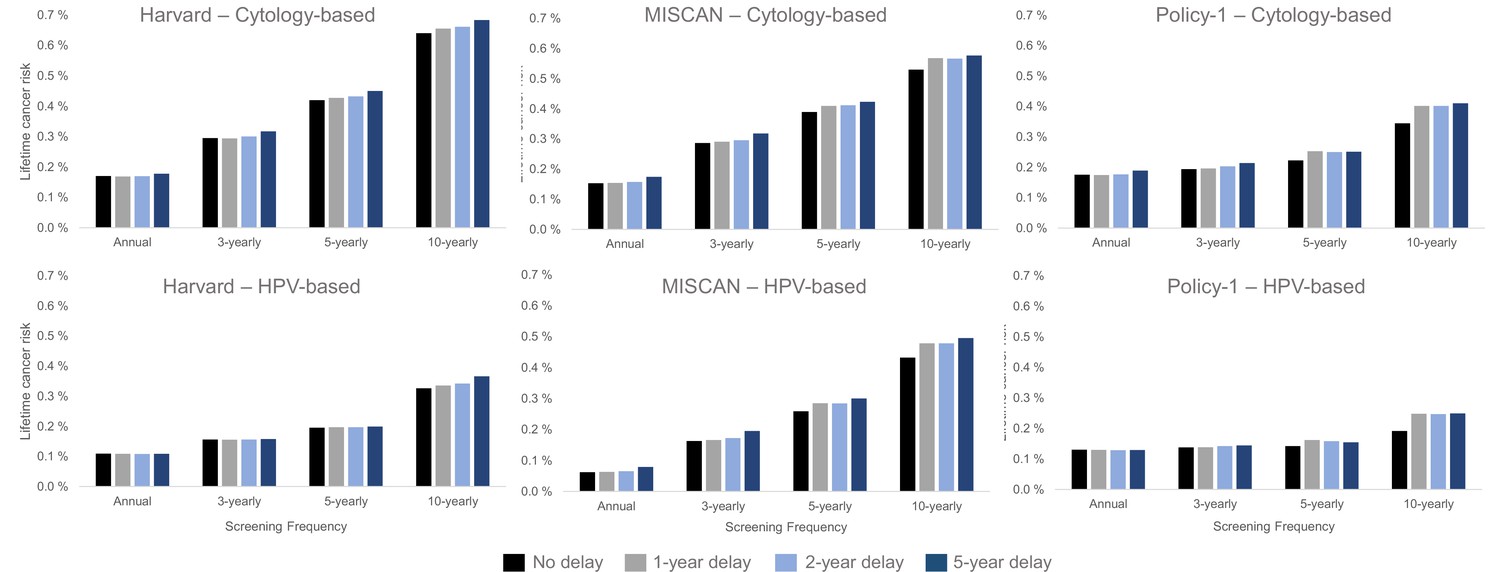
Long-term impacts: projected impact of COVID-19-related disruptions to primary cervical cancer screening on the lifetime risk of developing cervical cancer (averaged across the 1965/1975/1985 birth cohorts of women) by time since last screen for cytology-based screening (top panels) and human papillomavirus (HPV)-based screening (bottom panels) for three Cancer Intervention and Surveillance Modeling Network (CISNET-Cervical disease simulation models).
Figure 4
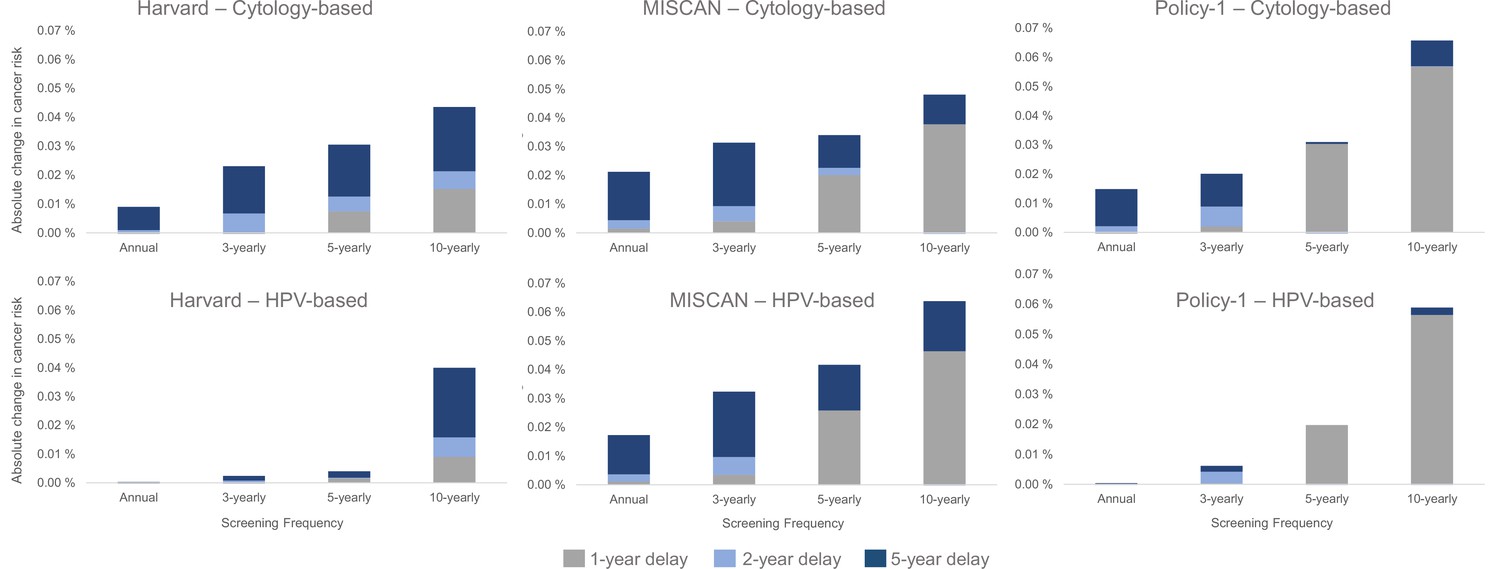
Long-term impacts: projected impact of COVID-19-related disruptions to primary cervical cancer screening on the incremental lifetime risk of developing cervical cancer (averaged across the 1965/1975/1985 birth cohorts of women) by time since last screen for cytology-based screening (top panels) and human papillomavirus (HPV)-based screening (bottom panels) for three Cancer Intervention and Surveillance Modeling Network (CISNET)-Cervical disease simulation models.
Appendix 1—figure 1
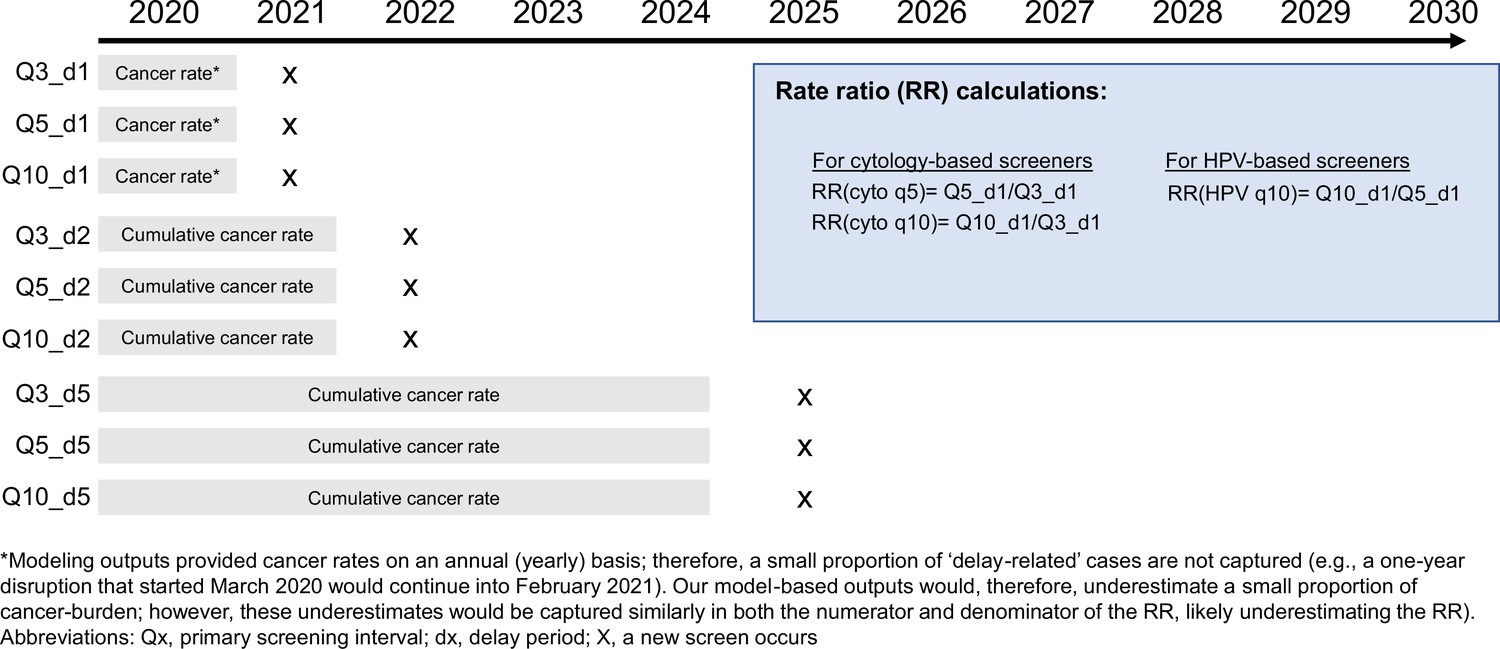
Schematic of short-term cancer burden calculations*.
Tables
Table 1
Long-term health impacts* of a 5-year temporary delay to screening compared with no delay, by screening history, that is, screening frequency.
| Screening frequency | ||||
|---|---|---|---|---|
| Annual | 3-yearly | 5-yearly | 10-yearly† | |
| Primary cytology-based screening | ||||
| Harvard | ||||
| Absolute change in lifetime risk | 0.008% | 0.022% | 0.031% | 0.044% |
| Excess cases over lifetime per 100,000 women | 8 | 22 | 31 | 44 |
| MISCAN-Cervix | ||||
| Absolute change in lifetime risk | 0.021% | 0.031% | 0.034% | 0.047% |
| Excess cases over lifetime per 100,000 women | 21 | 31 | 34 | 47 |
| Policy1-Cervix | ||||
| Absolute change in lifetime risk | 0.014% | 0.020% | 0.029% | 0.066% |
| Excess cases over lifetime per 100,000 women | 14 | 20 | 28 | 66 |
| Primary HPV-based screening | ||||
| Harvard | ||||
| Absolute change in lifetime risk | 0.000% | 0.001% | 0.004% | 0.040% |
| Excess cases over lifetime per 100,000 women | 0 | 1 | 4 | 40 |
| MISCAN-Cervix | ||||
| Absolute change in lifetime risk | 0.017% | 0.032% | 0.041% | 0.063% |
| Excess cases over lifetime per 100,000 women | 17 | 32 | 41 | 63 |
| Policy1-Cervix | ||||
| Absolute change in lifetime risk | 0.000% | 0.006% | 0.012% | 0.058% |
| Excess cases over lifetime per 100,000 women | 0 | 6 | 12 | 58 |
-
*
Risks are rounded to nearest 0.001%.
-
†
The women born in 1985 (aged 35 in 2020) received their last screen at age 25 and have not yet made the switch to primary human papillomavirus (HPV)-based screening. In the primary HPV-based analysis, these women would switch to primary HPV-based screening for their remaining lifetime either at 35 (under the no delay scenario) or aged >35 years (with a delay).
Appendix 1—table 1
Screening end age (lifetime number of screens) by birth cohort, screening frequency, and delay duration.
| Annual | 3-yearly* | 5-yearly† | 10-yearly | ||
|---|---|---|---|---|---|
| 1965 (age 55 in 2020) | No delay | 65 (45) | 64 (15) | 65 (9) | 65 (5) |
| 1-year delay | 65 (44) | 65 (15) | 61 (8) | 56 (4) | |
| 2-year delay | 65 (43) | 63 (14) | 62 (8) | 57 (4) | |
| 5-year delay | 65 (40) | 63 (13) | 65 (8) | 60 (4) | |
| 1975 (age 45 in 2020) | No delay | 65 (45) | 63 (15) | 65 (9) | 65 (5) |
| 1-year delay | 65 (44) | 64 (15) | 61 (8) | 56 (4) | |
| 2-year delay | 65 (43) | 65 (15) | 62 (8) | 57 (4) | |
| 5-year delay | 65 (40) | 65 (14) | 65 (8) | 60 (4) | |
| 1985 (age 35 in 2020) | No delay | 65 (45) | 65 (15) | 65 (8) | 65 (5) |
| 1-year delay | 65 (44) | 63 (14) | 61 (8) | 56 (4) | |
| 2-year delay | 65 (43) | 64 (14) | 62 (8) | 57 (4) | |
| 5-year delay | 65 (40) | 64 (13) | 65 (8) | 60 (4) |
-
*
Guidelines-compliant screener with primary cytology-based screening.
-
†
Guidelines-compliant screener with primary human papillomavirus (HPV) testing for women aged 30+ years.
Appendix 1—table 2
Example age at screen for the 1975 birth cohort without (highlighted in green) and with (highlighted in yellow) COVID-19-related delays by screening frequency.
Numbers under each delay are ages, bolded numbers are ages at which screening takes place, green highlight reflects no delay, and yellow highlights reflects a delay.
| No delay | 1-year delay | 2-year delay | 5-year delay | |||||||||||||||||||
|---|---|---|---|---|---|---|---|---|---|---|---|---|---|---|---|---|---|---|---|---|---|---|
| Year | Q1 | Q3 | Q5 | Q10 | Year | Q1 | Q3 | Q5 | Q10 | Year | Q1 | Q3 | Q5 | Q10 | Year | Q1 | Q3 | Q5 | Q10 | |||
| 1996 | 21 | 21 | 21 | 21 | 1996 | 21 | 21 | 21 | 21 | 1996 | 21 | 21 | 21 | 21 | 1996 | 21 | 21 | 21 | 21 | |||
| 1997 | 22 | 22 | 22 | 22 | 1997 | 22 | 22 | 22 | 22 | 1997 | 22 | 22 | 22 | 22 | 1997 | 22 | 22 | 22 | 22 | |||
| 1998 | 23 | 23 | 23 | 23 | 1998 | 23 | 23 | 23 | 23 | 1998 | 23 | 23 | 23 | 23 | 1998 | 23 | 23 | 23 | 23 | |||
| 1999 | 24 | 24 | 24 | 24 | 1999 | 24 | 24 | 24 | 24 | 1999 | 24 | 24 | 24 | 24 | 1999 | 24 | 24 | 24 | 24 | |||
| 2000 | 25 | 25 | 25 | 25 | 2000 | 25 | 25 | 25 | 25 | 2000 | 25 | 25 | 25 | 25 | 2000 | 25 | 25 | 25 | 25 | |||
| 2001 | 26 | 26 | 26 | 26 | 2001 | 26 | 26 | 26 | 26 | 2001 | 26 | 26 | 26 | 26 | 2001 | 26 | 26 | 26 | 26 | |||
| 2002 | 27 | 27 | 27 | 27 | 2002 | 27 | 27 | 27 | 27 | 2002 | 27 | 27 | 27 | 27 | 2002 | 27 | 27 | 27 | 27 | |||
| 2003 | 28 | 28 | 28 | 28 | 2003 | 28 | 28 | 28 | 28 | 2003 | 28 | 28 | 28 | 28 | 2003 | 28 | 28 | 28 | 28 | |||
| 2004 | 29 | 29 | 29 | 29 | 2004 | 29 | 29 | 29 | 29 | 2004 | 29 | 29 | 29 | 29 | 2004 | 29 | 29 | 29 | 29 | |||
| 2005 | 30 | 30 | 30 | 30 | 2005 | 30 | 30 | 30 | 30 | 2005 | 30 | 30 | 30 | 30 | 2005 | 30 | 30 | 30 | 30 | |||
| 2006 | 31 | 31 | 31 | 31 | 2006 | 31 | 31 | 31 | 31 | 2006 | 31 | 31 | 31 | 31 | 2006 | 31 | 31 | 31 | 31 | |||
| 2007 | 32 | 32 | 32 | 32 | 2007 | 32 | 32 | 32 | 32 | 2007 | 32 | 32 | 32 | 32 | 2007 | 32 | 32 | 32 | 32 | |||
| 2008 | 33 | 33 | 33 | 33 | 2008 | 33 | 33 | 33 | 33 | 2008 | 33 | 33 | 33 | 33 | 2008 | 33 | 33 | 33 | 33 | |||
| 2009 | 34 | 34 | 34 | 34 | 2009 | 34 | 34 | 34 | 34 | 2009 | 34 | 34 | 34 | 34 | 2009 | 34 | 34 | 34 | 34 | |||
| 2010 | 35 | 35 | 35 | 35 | 2010 | 35 | 35 | 35 | 35 | 2010 | 35 | 35 | 35 | 35 | 2010 | 35 | 35 | 35 | 35 | |||
| 2011 | 36 | 36 | 36 | 36 | 2011 | 36 | 36 | 36 | 36 | 2011 | 36 | 36 | 36 | 36 | 2011 | 36 | 36 | 36 | 36 | |||
| 2012 | 37 | 37 | 37 | 37 | 2012 | 37 | 37 | 37 | 37 | 2012 | 37 | 37 | 37 | 37 | 2012 | 37 | 37 | 37 | 37 | |||
| 2013 | 38 | 38 | 38 | 38 | 2013 | 38 | 38 | 38 | 38 | 2013 | 38 | 38 | 38 | 38 | 2013 | 38 | 38 | 38 | 38 | |||
| 2014 | 39 | 39 | 39 | 39 | 2014 | 39 | 39 | 39 | 39 | 2014 | 39 | 39 | 39 | 39 | 2014 | 39 | 39 | 39 | 39 | |||
| 2015 | 40 | 40 | 40 | 40 | 2015 | 40 | 40 | 40 | 40 | 2015 | 40 | 40 | 40 | 40 | 2015 | 40 | 40 | 40 | 40 | |||
| 2016 | 41 | 41 | 41 | 41 | 2016 | 41 | 41 | 41 | 41 | 2016 | 41 | 41 | 41 | 41 | 2016 | 41 | 41 | 41 | 41 | |||
| 2017 | 42 | 42 | 42 | 42 | 2017 | 42 | 42 | 42 | 42 | 2017 | 42 | 42 | 42 | 42 | 2017 | 42 | 42 | 42 | 42 | |||
| 2018 | 43 | 43 | 43 | 43 | 2018 | 43 | 43 | 43 | 43 | 2018 | 43 | 43 | 43 | 43 | 2018 | 43 | 43 | 43 | 43 | |||
| 2019 | 44 | 44 | 44 | 44 | 2019 | 44 | 44 | 44 | 44 | 2019 | 44 | 44 | 44 | 44 | 2019 | 44 | 44 | 44 | 44 | |||
| 2020 | 45 | 45 | 45 | 45 | 2020 | 45 | 45 | 45 | 45 | 2020 | 45 | 45 | 45 | 45 | 2020 | 45 | 45 | 45 | 45 | |||
| 2021 | 46 | 46 | 46 | 46 | 2021 | 46 | 46 | 46 | 46 | 2021 | 46 | 46 | 46 | 46 | 2021 | 46 | 46 | 46 | 46 | |||
| 2022 | 47 | 47 | 47 | 47 | 2022 | 47 | 47 | 47 | 47 | 2022 | 47 | 47 | 47 | 47 | 2022 | 47 | 47 | 47 | 47 | |||
| 2023 | 48 | 48 | 48 | 48 | 2023 | 48 | 48 | 48 | 48 | 2023 | 48 | 48 | 48 | 48 | 2023 | 48 | 48 | 48 | 48 | |||
| 2024 | 49 | 49 | 49 | 49 | 2024 | 49 | 49 | 49 | 49 | 2024 | 49 | 49 | 49 | 49 | 2024 | 49 | 49 | 49 | 49 | |||
| 2025 | 50 | 50 | 50 | 50 | 2025 | 50 | 50 | 50 | 50 | 2025 | 50 | 50 | 50 | 50 | 2025 | 50 | 50 | 50 | 50 | |||
| 2026 | 51 | 51 | 51 | 51 | 2026 | 51 | 51 | 51 | 51 | 2026 | 51 | 51 | 51 | 51 | 2026 | 51 | 51 | 51 | 51 | |||
| 2027 | 52 | 52 | 52 | 52 | 2027 | 52 | 52 | 52 | 52 | 2027 | 52 | 52 | 52 | 52 | 2027 | 52 | 52 | 52 | 52 | |||
| 2028 | 53 | 53 | 53 | 53 | 2028 | 53 | 53 | 53 | 53 | 2028 | 53 | 53 | 53 | 53 | 2028 | 53 | 53 | 53 | 53 | |||
| 2029 | 54 | 54 | 54 | 54 | 2029 | 54 | 54 | 54 | 54 | 2029 | 54 | 54 | 54 | 54 | 2029 | 54 | 54 | 54 | 54 | |||
| 2030 | 55 | 55 | 55 | 55 | 2030 | 55 | 55 | 55 | 55 | 2030 | 55 | 55 | 55 | 55 | 2030 | 55 | 55 | 55 | 55 | |||
| 2031 | 56 | 56 | 56 | 56 | 2031 | 56 | 56 | 56 | 56 | 2031 | 56 | 56 | 56 | 56 | 2031 | 56 | 56 | 56 | 56 | |||
| 2032 | 57 | 57 | 57 | 57 | 2032 | 57 | 57 | 57 | 57 | 2032 | 57 | 57 | 57 | 57 | 2032 | 57 | 57 | 57 | 57 | |||
| 2033 | 58 | 58 | 58 | 58 | 2033 | 58 | 58 | 58 | 58 | 2033 | 58 | 58 | 58 | 58 | 2033 | 58 | 58 | 58 | 58 | |||
| 2034 | 59 | 59 | 59 | 59 | 2034 | 59 | 59 | 59 | 59 | 2034 | 59 | 59 | 59 | 59 | 2034 | 59 | 59 | 59 | 59 | |||
| 2035 | 60 | 60 | 60 | 60 | 2035 | 60 | 60 | 60 | 60 | 2035 | 60 | 60 | 60 | 60 | 2035 | 60 | 60 | 60 | 60 | |||
| 2036 | 61 | 61 | 61 | 61 | 2036 | 61 | 61 | 61 | 61 | 2036 | 61 | 61 | 61 | 61 | 2036 | 61 | 61 | 61 | 61 | |||
| 2037 | 62 | 62 | 62 | 62 | 2037 | 62 | 62 | 62 | 62 | 2037 | 62 | 62 | 62 | 62 | 2037 | 62 | 62 | 62 | 62 | |||
| 2038 | 63 | 63 | 63 | 63 | 2038 | 63 | 63 | 63 | 63 | 2038 | 63 | 63 | 63 | 63 | 2038 | 63 | 63 | 63 | 63 | |||
| 2039 | 64 | 64 | 64 | 64 | 2039 | 64 | 64 | 64 | 64 | 2039 | 64 | 64 | 64 | 64 | 2039 | 64 | 64 | 64 | 64 | |||
| 2040 | 65 | 65 | 65 | 65 | 2040 | 65 | 65 | 65 | 65 | 2040 | 65 | 65 | 65 | 65 | 2040 | 65 | 65 | 65 | 65 | |||
| 2041 | 66 | 66 | 66 | 66 | 2041 | 66 | 66 | 66 | 66 | 2041 | 66 | 66 | 66 | 66 | 2041 | 66 | 66 | 66 | 66 | |||
Appendix 1—table 3
Relative rate ratios and accumulated incidence rates per 100,000 women for each screening frequency and delay scenario.
| Screening frequency | 1-year delay | 2-year delay | 5-year delay |
|---|---|---|---|
| Policy1-Cervix | |||
| 5-yearly screener (cytology) | 1.40 = 4.94/3.58 | 1.44 = 10.05/7.00 | 1.57 = 30.03/19.10 |
| 10-yearly screener (cytology) | 3.10 = 11.06/3.58 | 3.35 = 23.45/7.00 | 3.34 = 63.72/19.10 |
| 10-yearly screener (HPV) | 2.26 = 7.36/3.26 | 2.48 = 15.31/6.18 | 2.54 = 42.41/16.67 |
| MISCAN-Cervix | |||
| 5-yearly screener (cytology) | 2.78 = 3.00/1.08 | 2.28 = 6.41/2.81 | 1.99 = 22.09/11.08 |
| 10-yearly screener (cytology) | 6.97 = 7.54/1.08 | 5.73 = 16.11/2.81 | 4.15 = 45.97/11.08 |
| 10-yearly screener (HPV) | 3.91 = 6.08/1.55 | 3.67 = 13.08/3.56 | 2.97 = 38.84/13.09 |
| Harvard | |||
| 5-yearly screener (cytology) | 1.8 = 9.64/5.37 | 1.74 = 17.69/10.15 | 1.64 = 45.97/27.96 |
| 10-yearly screener (cytology) | 3.8 = 20.39/5.37 | 3.64 = 36.94/10.15 | 3.19 = 89.29/27.96 |
| 10-yearly screener (HPV) | 3.61 = 10.74/2.98 | 3.58 = 19.51/5.45 | 3.69 = 46.83/12.68 |
-
Relative rate ratio is calculated as the accumulated incidence rate per 100,000 women during a delay period for a give screening history divided by the accumulated incidence rate per 100,000 women during the same delay period among guidelines-compliant screeners. Incidence rates are the average across the three birth cohorts. 3-yearly cytology screening is considered guidelines-compliant screening; 5-yearly human papillomavirus (HPV) screening is considered guidelines compliant.
Appendix 1—table 4
Percentage reduction in average (across the 1965, 1975, and 1985 birth cohorts) lifetime risk of cancer compared with no screening.
| Screening frequency | ||||
|---|---|---|---|---|
| Annual (%) | 3-yearly (%) | 5-yearly (%) | 10-yearly (%) | |
| Primary cytology-based screening | ||||
| Harvard | ||||
| No delay | 88.4 | 79.9 | 71.4 | 56.3 |
| 1-year delay | 88.5 | 80.0 | 70.9 | 55.3 |
| 2-year delay | 88.4 | 79.5 | 70.5 | 54.9 |
| 5-year delay | 87.9 | 78.4 | 69.3 | 53.4 |
| MISCAN-Cervix | ||||
| No delay | 85.1 | 72.1 | 62.1 | 48.4 |
| 1-year delay | 85.0 | 71.7 | 60.2 | 44.7 |
| 2-year delay | 84.7 | 71.2 | 59.9 | 44.9 |
| 5year delay | 83.1 | 69.1 | 58.8 | 43.9 |
| Policy1-Cervix | ||||
| No delay | 87.7 | 86.5 | 84.5 | 75.9 |
| 1-year delay | 87.8 | 86.3 | 82.3 | 71.9 |
| 2-year delay | 87.7 | 85.8 | 82.5 | 71.9 |
| 5-year delay | 86.8 | 85.1 | 82.5 | 71.3 |
| Primary HPV-based screening | ||||
| Harvard | ||||
| No delay | 92.6 | 89.3 | 86.7 | 77.8 |
| 1-year delay | 92.6 | 89.4 | 86.6 | 77.1 |
| 2-year delay | 92.6 | 89.4 | 86.6 | 76.7 |
| 5-year delay | 92.6 | 89.2 | 86.4 | 75.0 |
| MISCAN-Cervix | ||||
| No delay | 94.0 | 84.2 | 74.8 | 58.0 |
| 1-year delay | 93.9 | 83.8 | 72.3 | 53.5 |
| 2-year delay | 93.6 | 83.2 | 72.3 | 53.5 |
| 5-year delay | 92.3 | 81.0 | 70.8 | 51.8 |
| Policy1-Cervix | ||||
| No delay | 90.9 | 90.4 | 90.1 | 86.6 |
| 1-year delay | 90.9 | 90.4 | 88.7 | 82.7 |
| 2-year delay | 91.0 | 90.1 | 89.0 | 82.8 |
| 5-year delay | 91.0 | 90.0 | 89.2 | 82.6 |
-
HPV, human papillomavirus.
Additional files
Download links
A two-part list of links to download the article, or parts of the article, in various formats.
Downloads (link to download the article as PDF)
Open citations (links to open the citations from this article in various online reference manager services)
Cite this article (links to download the citations from this article in formats compatible with various reference manager tools)
A model-based analysis of the health impacts of COVID-19 disruptions to primary cervical screening by time since last screen for current and future disruptions
eLife 11:e81711.
https://doi.org/10.7554/eLife.81711


