Spatiotemporal neural dynamics of object recognition under uncertainty in humans
- Neuroscience Institute, New York University Grossman School of Medicine, United States
- Department of Neurology, New York University Grossman School of Medicine, United States
- Department of Neuroscience & Physiology, New York University Grossman School of Medicine, United States
- Department of Radiology, New York University Grossman School of Medicine, United States
Figures
Figure 1
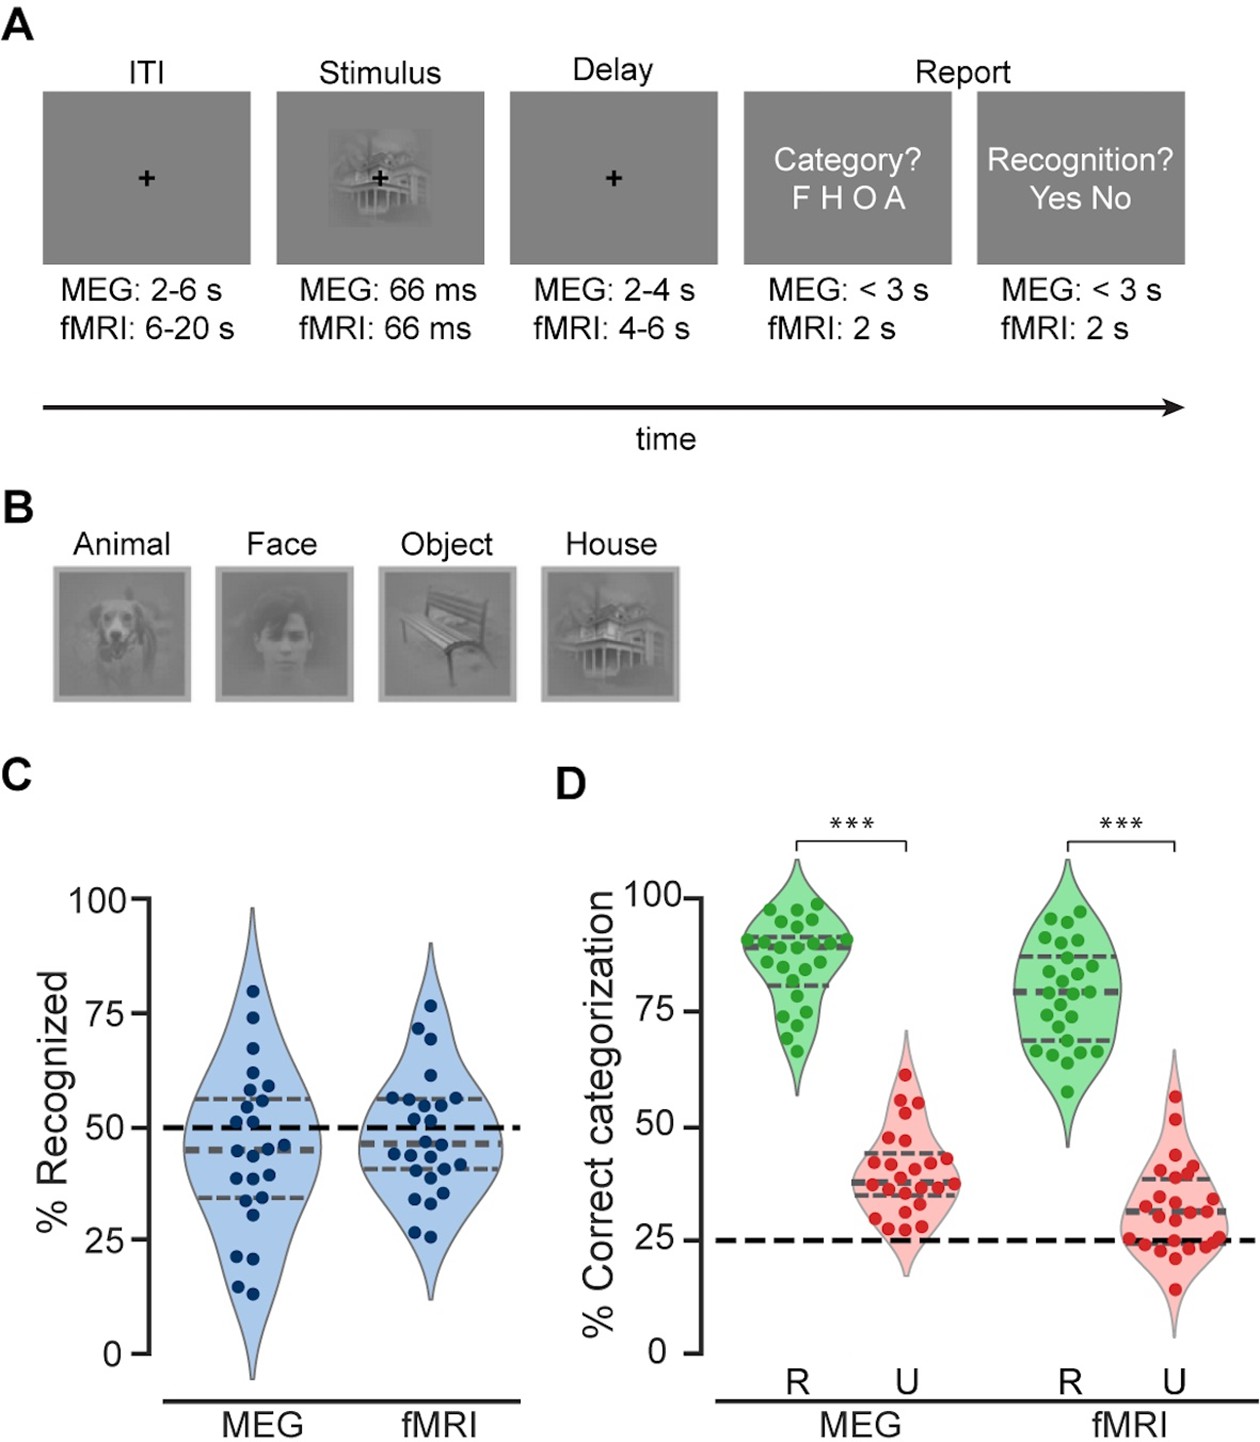
Experimental paradigm and behavioral results.
(A) Trial timeline. (B) An example real image from each category. (C) Percentage of real-image trials reported as recognized in the MEG and fMRI experiments. Recognition rates were very close to the intended threshold-level recognition rate of 50% in both experiments. (D) Categorization accuracy for real images in recognized (R) and unrecognized (U) trials. The black dashed line indicates chance level at 25%. ***: p<0.001; significant differences in categorization behavior between recognized (R) and unrecognized (U) trials (one-sided Wilcoxon signed-rank test). (C–D) The horizontal gray lines of the violin plots indicate 25th percentile, median, and 75th percentile, respectively. Dots depict individual participants’ behavioral performance in the MEG (N=24) and fMRI experiments (N=25).
Figure 2 with 1 supplement
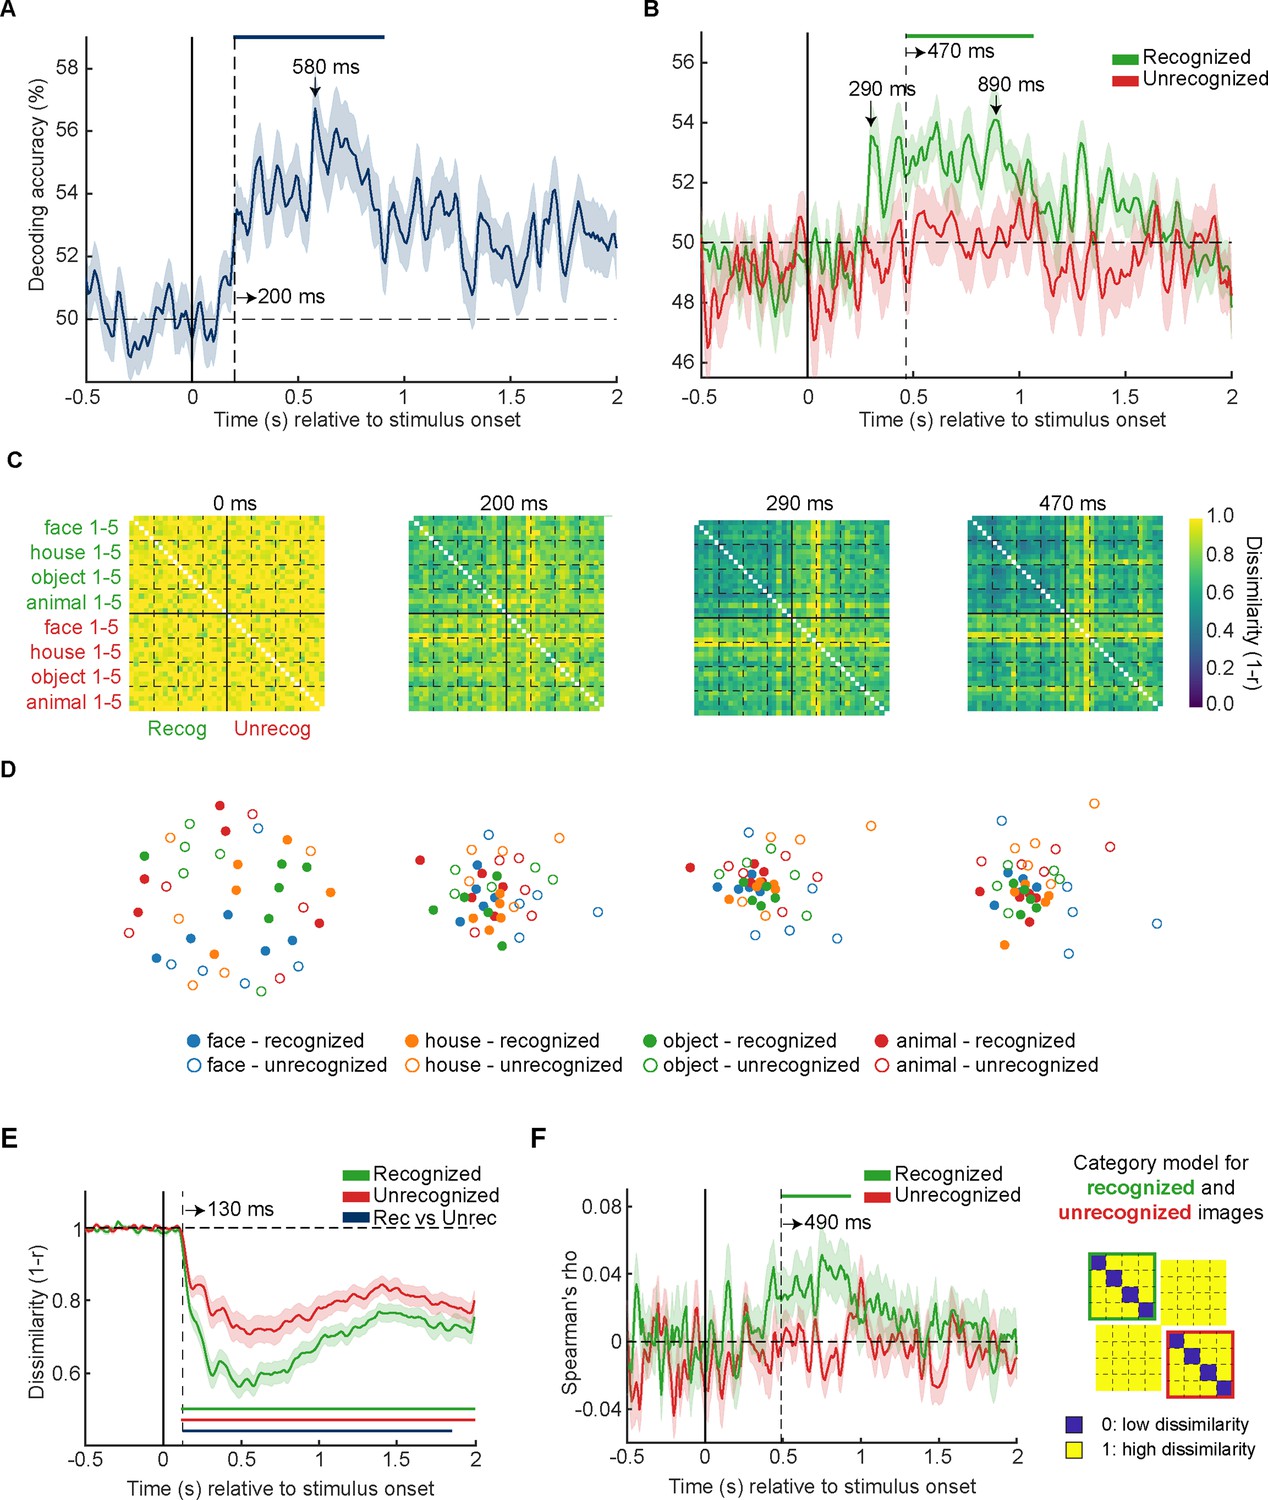
MEG multivariate pattern analysis (N=24).
(A) Recognition outcome decoding. (B) Image category decoding in recognized (green) and unrecognized trials (red). (C) Group-average MEG representational dissimilarity matrices (RDMs) (40×40) at selected time points. (D) Visualization of representational dissimilarity structure at the same time points as in (C) using the first two dimensions of the multidimensional scaling (MDS). Each of the filled circles represents an exemplar image that was reported as recognized and is color-coded according to its category membership. The unfilled points represent the physically identical exemplar images that were not recognized by participants. (E) Mean between-image representational dissimilarity in recognized (green) and unrecognized trials (red). (F) Left: Correlation between category model RDM and MEG RDMs in recognized (green) and unrecognized (red) trials. Right: Category model RDM. Blue and yellow colors indicates low and high representational dissimilarities, respectively. In (A–B) and (E–F), shaded areas represent SEM across participants; horizontal dashed lines indicate the chance level, and vertical dashed lines indicate significance onset latencies. Statistical significance is indicated by the colored horizontal bars (p<0.05, one-sided cluster-based sign permutation tests).
Figure 2—figure supplement 1

Object category decoding in the localizer task.
Figure 3 with 3 supplements
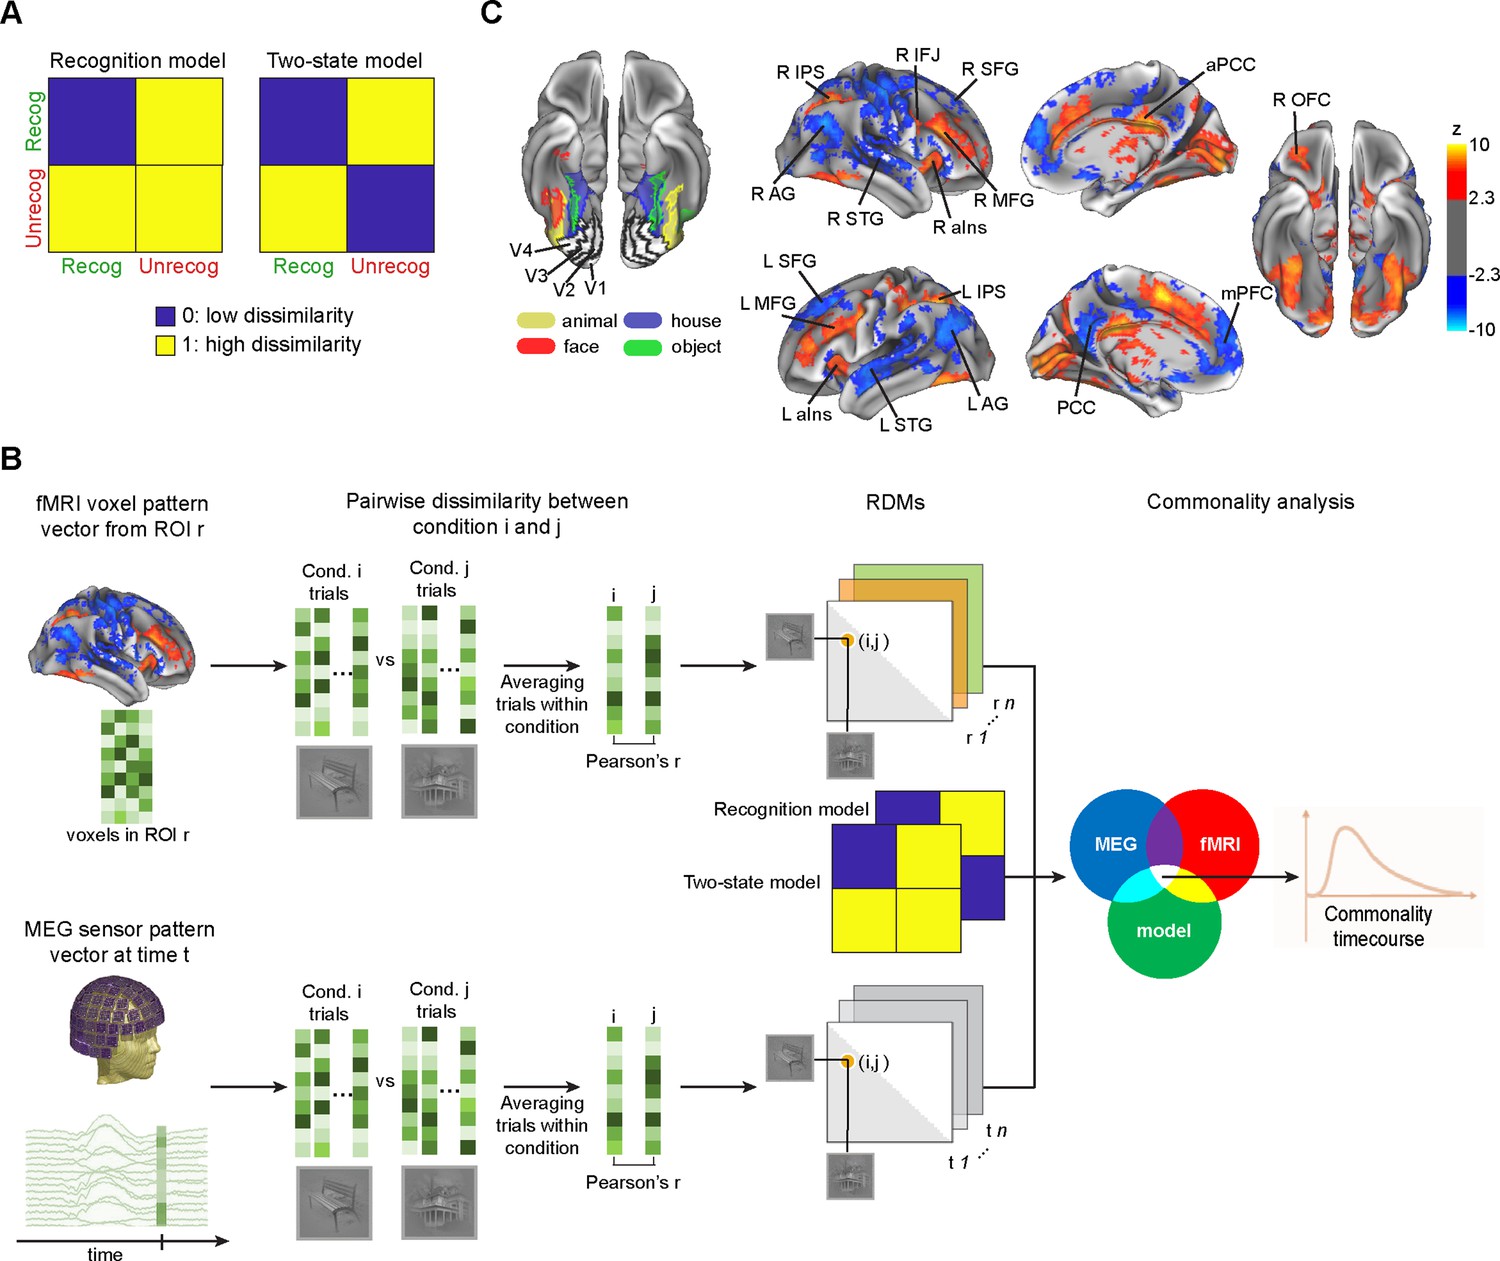
Model-based MEG-fMRI fusion procedure.
(A) Model representational dissimilarity matrices (RDMs) used for model-driven MEG-fMRI fusion. Blue and yellow colors represent low and high dissimilarities, respectively. (B) Schematic for the commonality analysis. Commonality coefficient at each time point reflects the shared variance between an MEG RDM of a given time point, fMRI RDM of a given region of interest (ROI), and a model RDM reflecting the expected dissimilarity structure based on a given hypothesis. By repeating the procedure for every single MEG time point, we obtained a commonality time course for a given ROI and a given model RDM. (C) fMRI ROIs (from Levinson et al., 2021). Left: Early visual cortex (EVC) and ventral temporal cortex (VTC) ROIs from a representative subject, defined using a functional localizer. Right: ROIs outside the visual cortices, in the task-positive network (TPN, orange-yellow colors) and default mode network (DMN, blue), were yielded from the recognized vs. unrecognized general linear model (GLM) contrast. AG: angular gyrus, aIns: anterior insula, aPCC: anterior posterior-cingulate cortex, IFJ: inferior frontal junction, IPS: intraparietal sulcus, MFG: middle frontal gyrus, mPFC: medial prefrontal cortex, OFC: orbitofrontal cortex, PCC: posterior cingulate cortex, SFG: superior frontal gyrus, STG: superior temporal gyrus.
Figure 3—figure supplement 1

Correlation between MEG and fMRI representational dissimilarity matrices (RDMs) derived from early visual cortex (EVC) and ventral temporal cortex (VTC) regions of interest (ROIs).
For this analysis, we computed Spearman’s rank correlation between MEG RDM derived from each time point and fMRI RDM derived from each ROI. For all panels: the horizontal blue bar indicates statistically significant clusters of positive correlations (p<0.05, cluster-based label permutation test). The permutation test was conducted using an analogous procedure as for model-driven MEG-fMRI fusion (see Methods).
Figure 3—figure supplement 2

Same as Figure 3—figure supplement 1, with task-positive network (TPN) regions of interest (ROIs).
Figure 3—figure supplement 3

Same as Figure 3—figure supplement 1, with default mode network (DMN) regions of interest (ROIs).
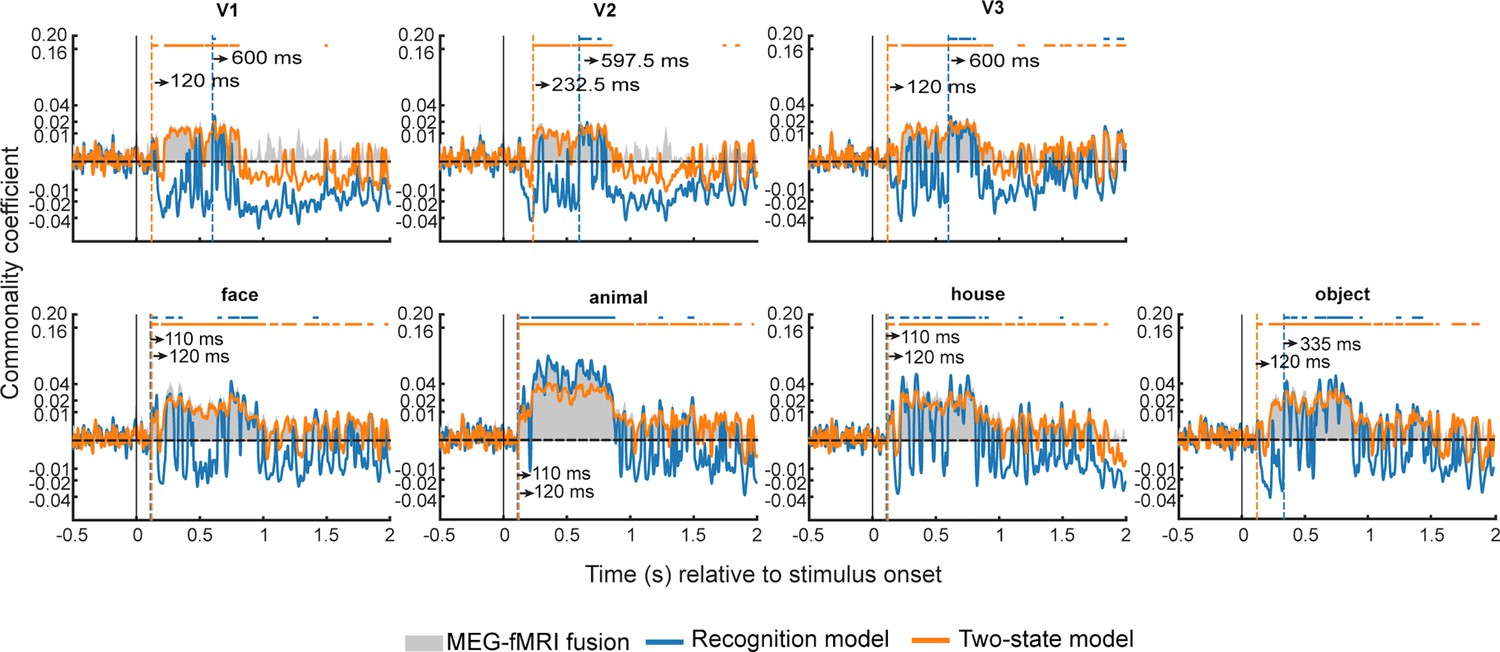
Figure 4 with 3 supplements
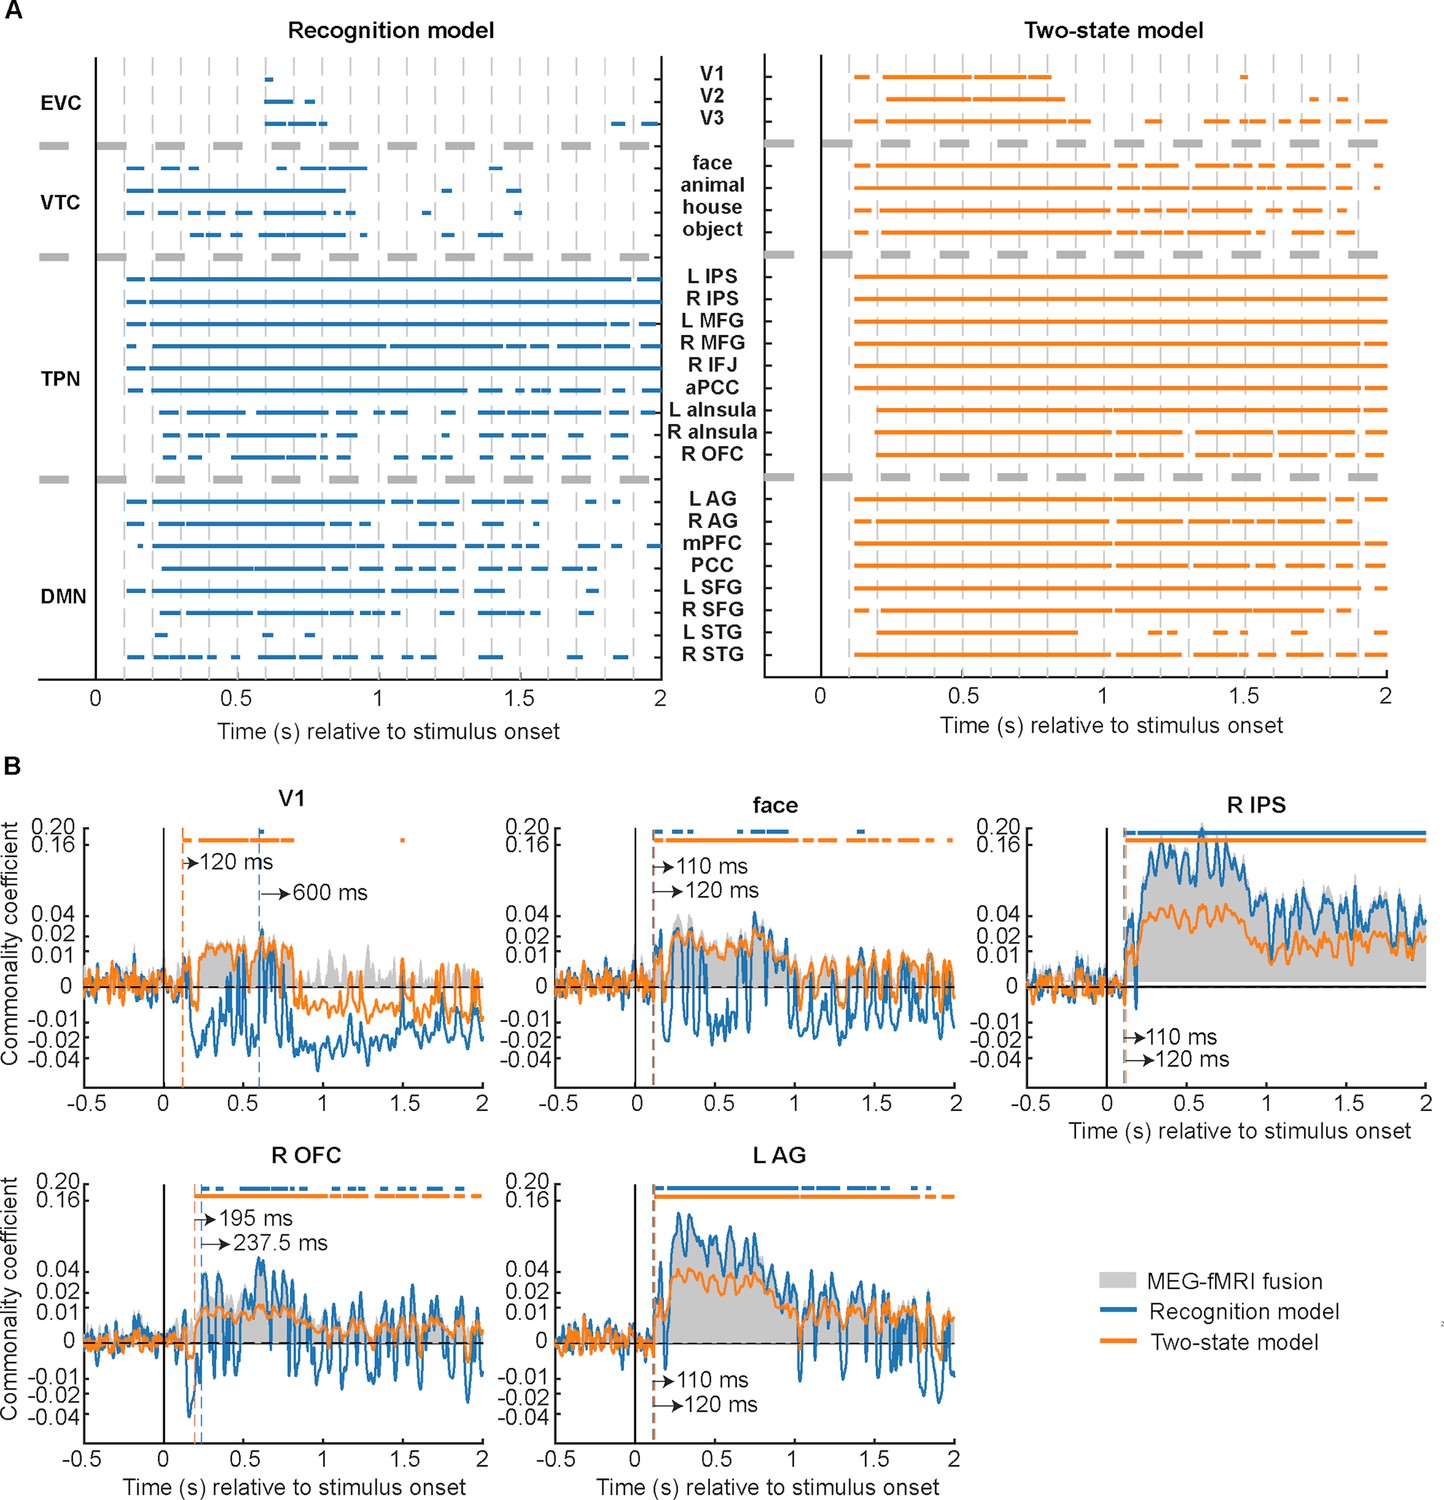
Model-based MEG-fMRI fusion results.
(A) Commonality analysis results for all regions of interest (ROIs) are shown by plotting the statistically significant time points (p<0.05, cluster-based label permutation tests). Left: Results based on the recognition model. Right: Results based on the two-state model. (B) Commonality coefficient time course for recognition model (blue) and two-state model (orange) effects in five selected ROIs. The vertical dashed lines denote onset latencies, and the horizontal bars at the top indicate statistically significant time points (p<0.05, cluster-based label permutation tests). Gray-shaded areas denote the MEG-fMRI fusion, equivalent to the total variance shared by MEG and fMRI representational dissimilarity matrices (RDMs). Results from all ROIs are shown in Figure 4—figure supplements 1–3.
Figure 4—figure supplement 1
Model-based MEG-fMRI fusion results for early visual cortex (EVC) and ventral temporal cortex (VTC) regions of interest (ROIs).
Same format as in Figure 4B.
Figure 4—figure supplement 2

Model-based MEG-fMRI fusion results for all task-positive network (TPN) regions of interest (ROIs).
Same format as in Figure 4B.
Figure 4—figure supplement 3

Model-based MEG-fMRI fusion results for all default mode network (DMN) regions of interest (ROIs).
Same format as in Figure 4B.
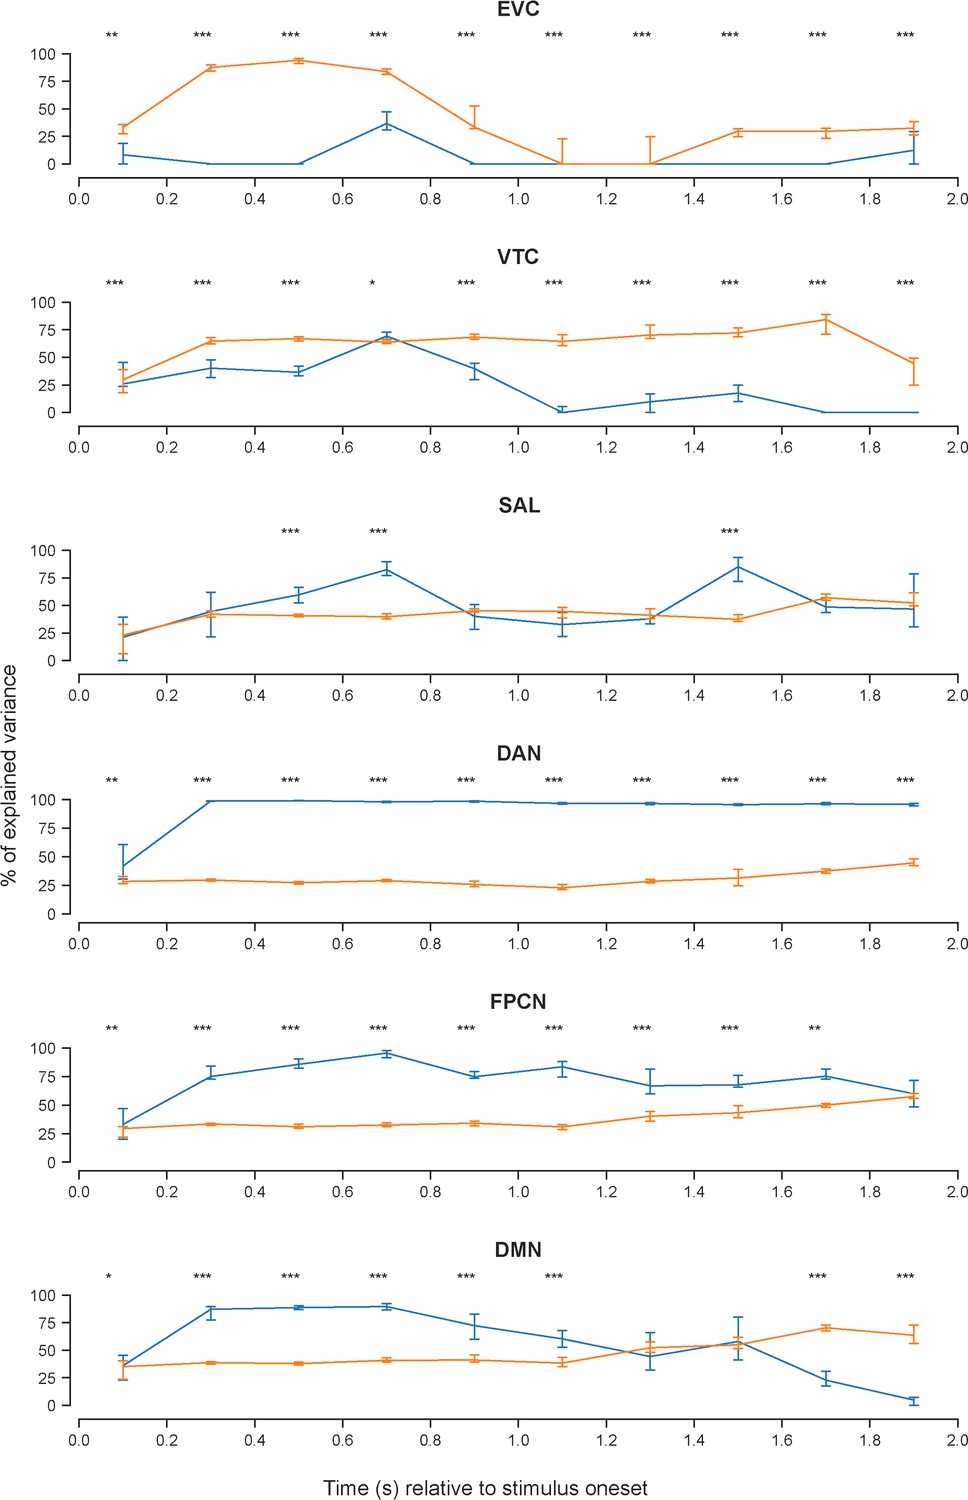
Figure 5 with 3 supplements

Percentage of shared variance between MEG and fMRI representational dissimilarity matrices (RDMs) explained by the recognition model (blue) and two-stage model (orange) in individual brain networks and two different post-stimulus time windows (early: 0–1000 ms; late: 1000–2000 ms).
In all panels: Line plots depict the median percentage of explained variance across all time points in the window. The dashed lines in the violin plots represent 25th percentile, median, and 75th percentile. Asterisks indicate significant differences between time windows (early vs. late, two-sided Mann-Whitney test) or models (recognition vs. two-state, two-sided Wilcoxon signed-rank test) at p<0.001, Bonferroni-corrected across all pairwise tests. n.s.: not significant at a level of p<0.05, Bonferroni-corrected. EVC: early visual cortex, VTC: ventral temporal cortex, SAL: salience network, DAN: dorsal attentional network, FPCN: frontoparietal control network, DMN: default mode network. Results for individual regions of interest (ROIs) are presented in Figure 5—figure supplement 3.
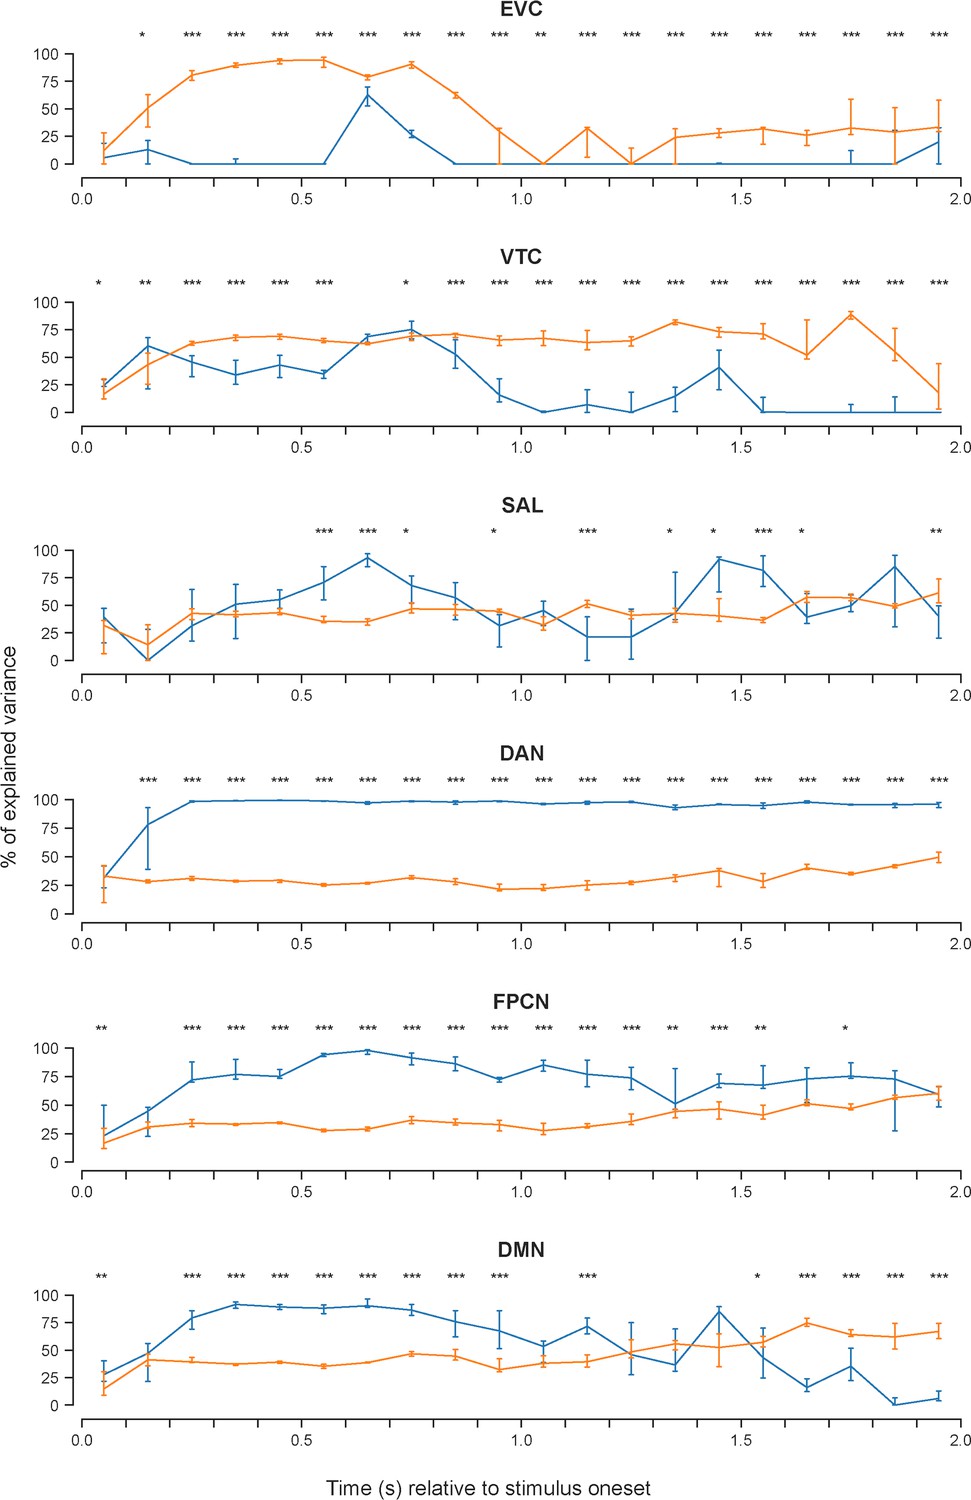
Figure 5—figure supplement 1
Percentage of shared variance between MEG and fMRI representational dissimilarity matrices (RDMs) explained by the recognition model (blue) or the two-stage model (orange) in individual brain networks computed using 200 ms sliding windows in the post-stimulus period.
EVC: early visual cortices, VTC: ventral temporal cortices, SAL: salience network, DAN: dorsal attentional network, FCPN: frontoparietal control network, DMN: default mode network. In all panels, line plots depict the median percentage of explained variance across all time points within the window. Error bars indicate the interquartile range. *: p<0.05, **: p<0.01, ***: p<0.001, all FDR-corrected for multiple comparisons across time windows.
Figure 5—figure supplement 2
Same as in Figure 5—figure supplement 1, with 100 ms sliding time windows.
Figure 5—figure supplement 3

Each model representational dissimilarity matrix (RDM’s) explanatory power in individual regions of interest (ROIs), grouped according to their brain network membership and the time window after stimulus onset (early vs. late).
In all panels, line plots depict the median percentage of explained variance across all time points in the window. Results from the recognition model are shown as solid lines; those from the two-state model are shown as dashed lines.
Figure 6
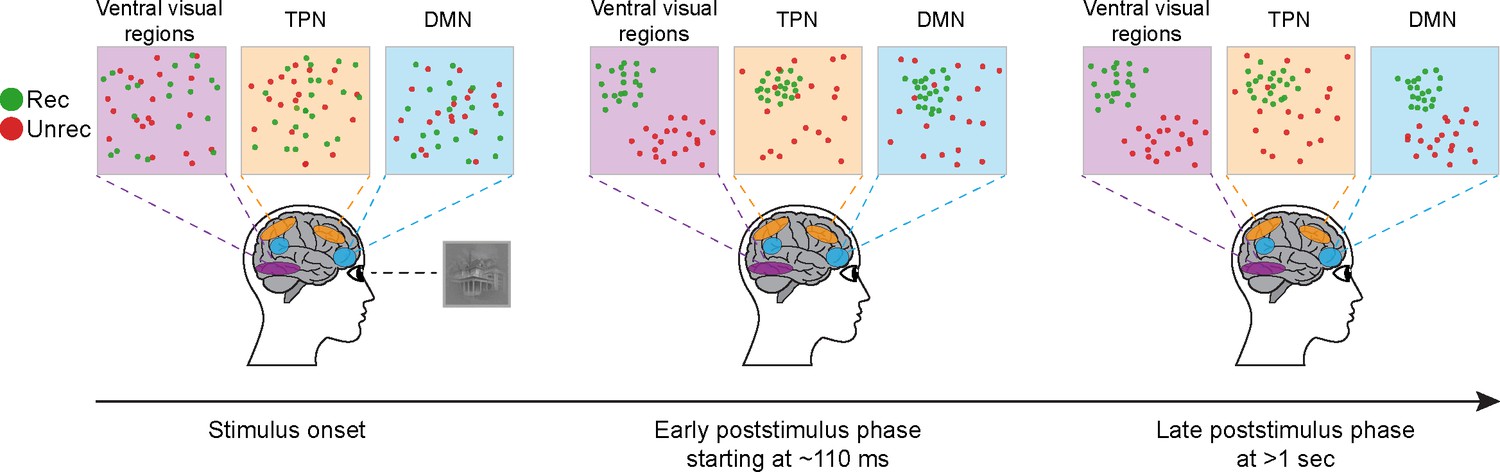
Schematic illustration of the changes in representational geometry across functional brain networks and time.
Purple, orange, and blue colors rendered on the brain indicate the ventral visual regions, task-positive network (TPN), and default mode network (DMN). Squares in the upper panel display two-dimensional representational spaces in the corresponding brain areas, respectively. Green and red circles correspond to the representations of individual recognized and unrecognized image exemplars, respectively.
Author response image 1
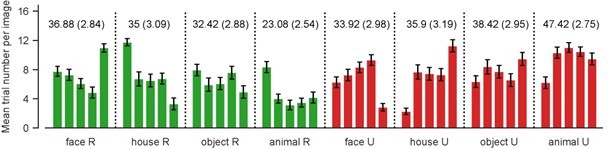
Across-subject mean number of trials for individual image exemplars, grouped by recognition outcome and image category.
Green: recognized, red: unrecognized. Error bars represent SEM. Numbers above the bars represent across-subject mean trial number and SEM for a given image category and recognition outcome.
Author response image 2
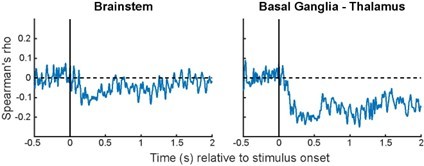
Correlations between time-varying MEG RDMs and fMRI RDMs derived from two subcortical ROIs.
Format is the same as Figure 3—figure supplements 1-3.
Tables
Table 1
Distribution of each regions of interest (ROI’s) voxels across different functional brain networks (as defined in Yeo et al., 2011), presented as percentage of voxels located in each network.
Each ROI was assigned to the brain network with the highest voxel count.
| Visual | Somato | SAL | DAN | Limbic | FCPN | DMN | ||
|---|---|---|---|---|---|---|---|---|
| SAL | ||||||||
| L aInsula | 0.00 | 0.00 | 65.17 | 0.00 | 0.00 | 24.38 | 3.09 | |
| R aInsula | 0.00 | 0.00 | 60.02 | 0.00 | 0.00 | 30.59 | 0.07 | |
| DAN | ||||||||
| R IFJ | 0.00 | 0.00 | 0.00 | 79.43 | 0.00 | 12.18 | 0.00 | |
| L IPS | 4.09 | 2.80 | 0.00 | 39.69 | 0.00 | 34.45 | 4.10 | |
| R IPS | 6.91 | 0.00 | 0.00 | 55.98 | 0.00 | 20.71 | 0.01 | |
| FCPN | ||||||||
| L MFG | 0.00 | 0.48 | 8.50 | 18.05 | 0.00 | 54.07 | 1.55 | |
| R MFG | 0.00 | 0.00 | 6.97 | 0.01 | 0.00 | 78.21 | 0.16 | |
| R OFC | 0.00 | 0.00 | 31.08 | 0.00 | 2.94 | 45.46 | 2.22 | |
| aPCC | 0.00 | 0.00 | 0.29 | 0.00 | 0.00 | 36.77 | 20.53 | |
| DMN | ||||||||
| L AG | 6.96 | 0.00 | 1.11 | 17.67 | 0.00 | 1.65 | 67.83 | |
| R AG | 0.43 | 8.78 | 7.06 | 15.91 | 0.00 | 0.20 | 64.95 | |
| PCC | 5.68 | 0.00 | 0.00 | 0.00 | 0.00 | 0.18 | 88.36 | |
| mPFC | 0.00 | 0.00 | 0.06 | 0.00 | 0.06 | 0.33 | 91.73 | |
| L SFG | 0.00 | 0.00 | 0.00 | 0.00 | 0.00 | 2.16 | 80.88 | |
| R SFG | 0.00 | 0.43 | 16.62 | 0.00 | 0.00 | 21.78 | 36.95 | |
| Somatosensory/motor network (excluded from the analysis) | ||||||||
| L STG | 0.00 | 45.35 | 7.34 | 0.76 | 0.35 | 3.63 | 38.46 | |
| R STG | 0.10 | 69.18 | 5.35 | 1.77 | 0.00 | 1.51 | 17.58 | |
Additional files
Download links
A two-part list of links to download the article, or parts of the article, in various formats.
Downloads (link to download the article as PDF)
Open citations (links to open the citations from this article in various online reference manager services)
Cite this article (links to download the citations from this article in formats compatible with various reference manager tools)
Spatiotemporal neural dynamics of object recognition under uncertainty in humans
eLife 12:e84797.
https://doi.org/10.7554/eLife.84797


