Molecular classification and tumor microenvironment characteristics in pheochromocytomas
- Department of Biochemistry and Molecular Biology, School of Basic Medical Sciences, Department of Urology, Peking University First Hospital, Peking University Health Science Center, China
- Shenzhen Institute of Ladder for Cancer Research, China
Figures
Figure 1 with 4 supplements
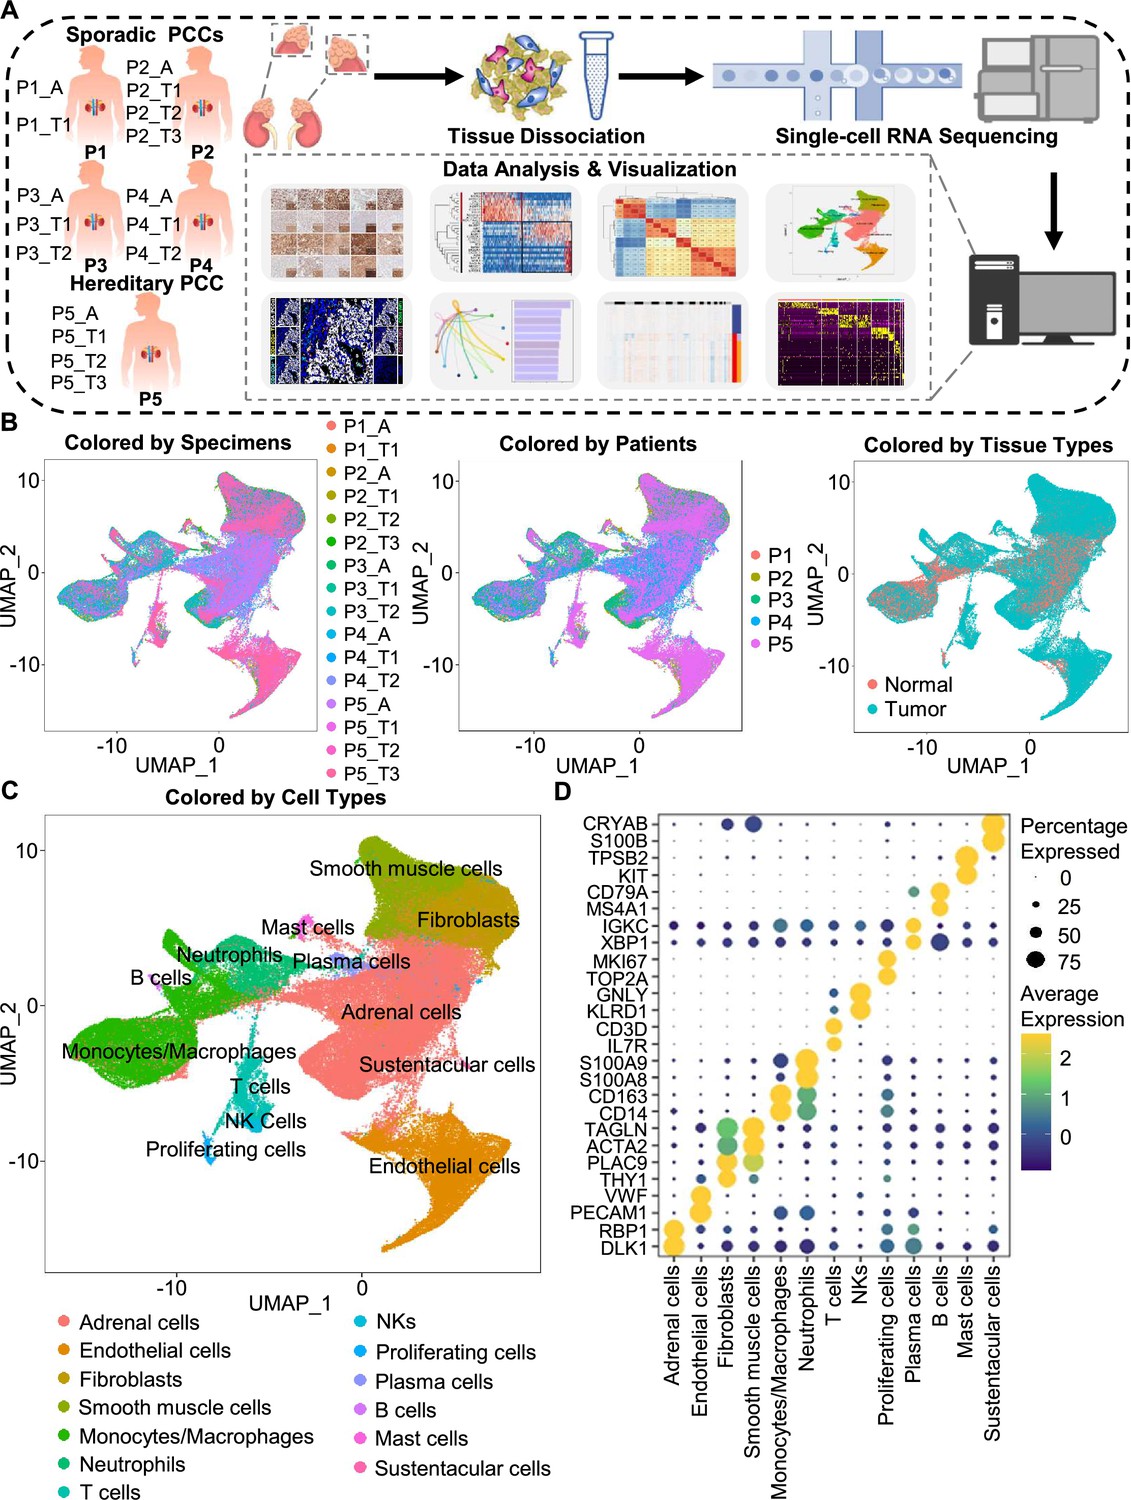
Integration analysis across 5 PCC patients revealing the cell composition of the PCC microenvironment.
(A) Schematic of the experimental pipeline. Eleven tumor specimens and 5 adjacent normal adrenal medullary specimens were isolated from 5 PCC patients, dissociated into single-cell suspensions, and analyzed using 10 x Genomics Chromium droplet scRNA-seq. (B) UMAP plots illustrating 133,894 cells from 16 specimens across 5 PCC patients. Cells color-coded by specimens, patients, and tissue types. (C) UMAP plot showing 13 main cell types from all specimens. (D) Dot plot of representative marker genes for each cell type. The color scale represents the average marker gene expression level; dot size represents the percentage of cells expressing a given marker gene.
Figure 1—figure supplement 1
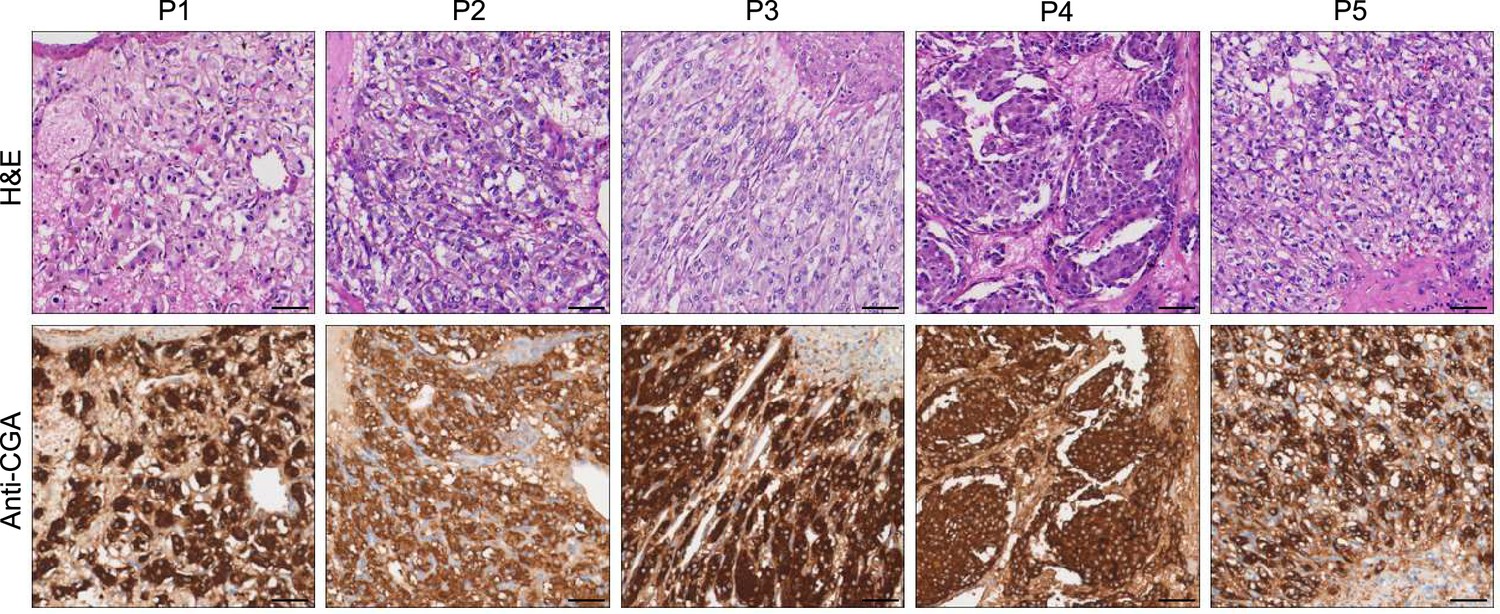
Hematoxylin-eosin staining and immunohistochemistry staining of CGA marker in formalin-fixed paraffin-embedded PCC tissue sections matched to scRNA-seq specimens.
Scale bar, 100 μm.
Figure 1—figure supplement 2

Quality control and cell clustering of scRNA-seq data.
(A, B, C) Violin plots showing the number of total RNAs (A), the number of genes (B), and the percentage of mitochondrial (mito) genes (C) for cells from 16 specimens. (D) UMAP plots of cells colored by cell clusters.
Figure 1—figure supplement 3

Correlation coefficient among cell clusters.
The color keys from blue to red indicate the correlation coefficient from low to high.
Figure 1—figure supplement 4

Integration analysis across five PCC patients revealing the cell type composition of the PCC microenvironment.
UMAP plot depicting the distribution of adrenal cells, stromal cells, and immune cells (including lymphocytes and myeloid cells) within the PCC microenvironment.
Figure 2
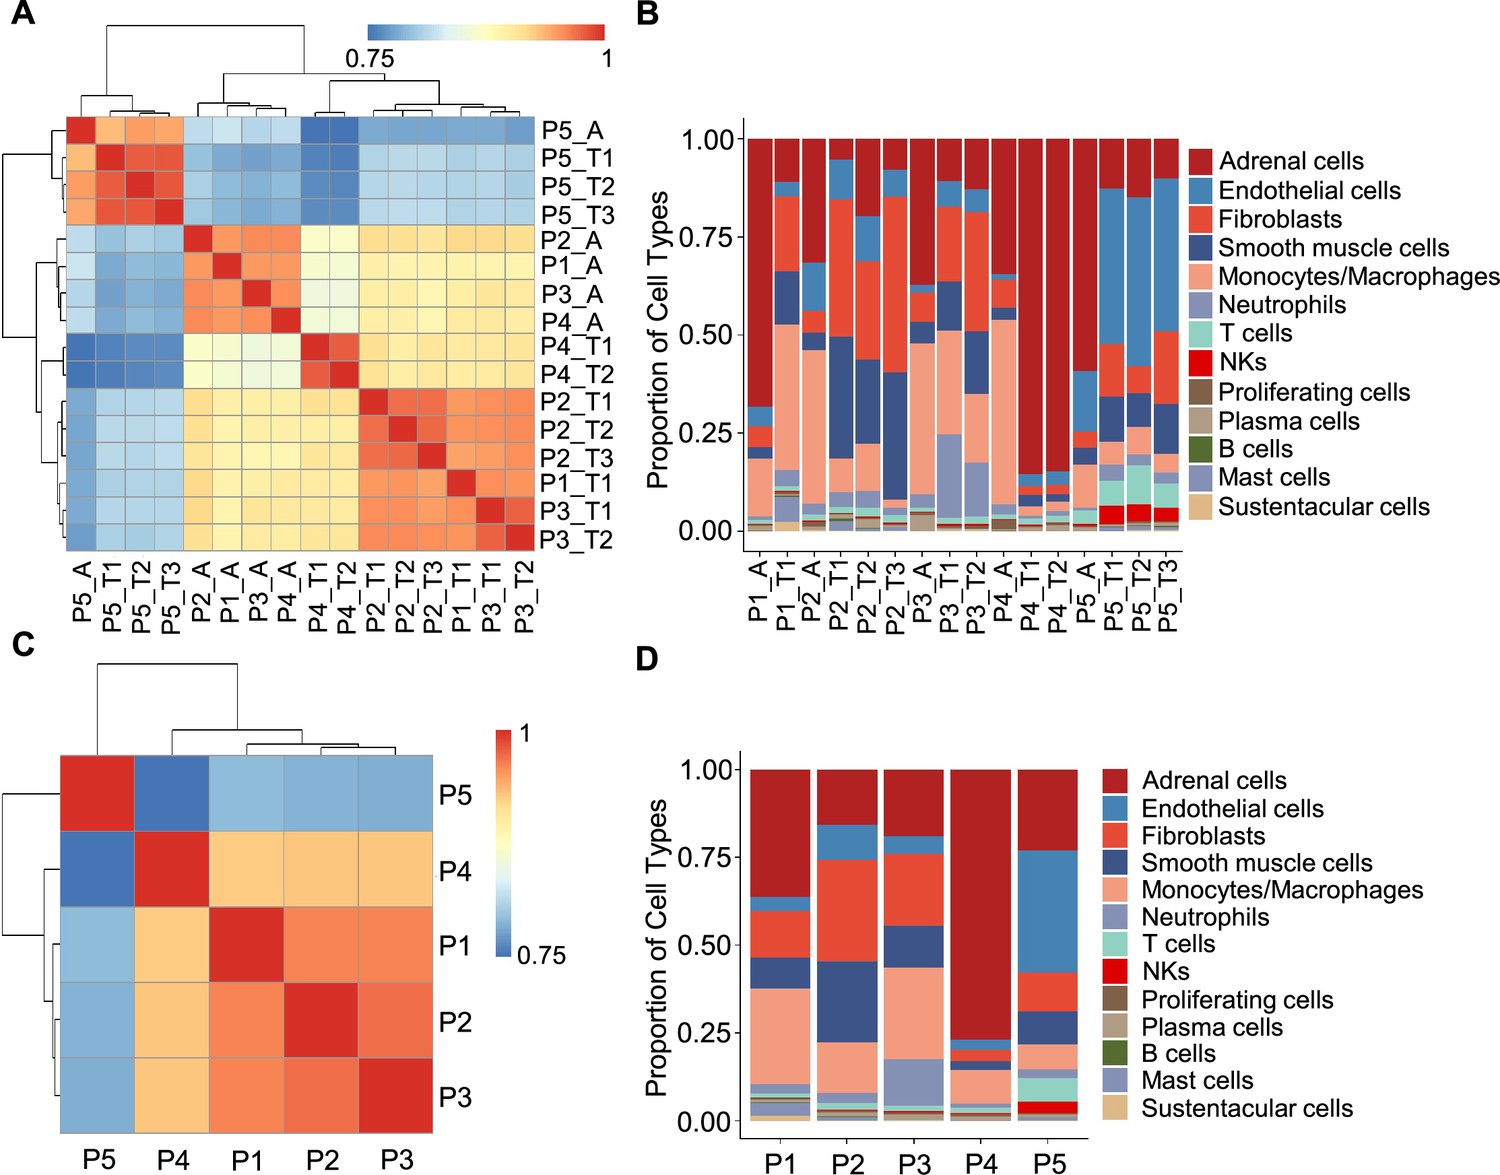
Correlation analysis reveals less intra-tumoral heterogeneity than inter-individual heterogeneity.
(A) Heatmap plotting the correlation coefficient among 16 specimens. The color keys from blue to red indicate the correlation coefficient from low to high. (B) Bar plot showing the percentage of cell types in 16 specimens. (C) Heatmap of the correlation coefficient among five PCC patients. The color keys from blue to red indicate the correlation coefficient from low to high. (D) Bar plot depicting the frequency distribution of cell types in five PCC patients.
Figure 3
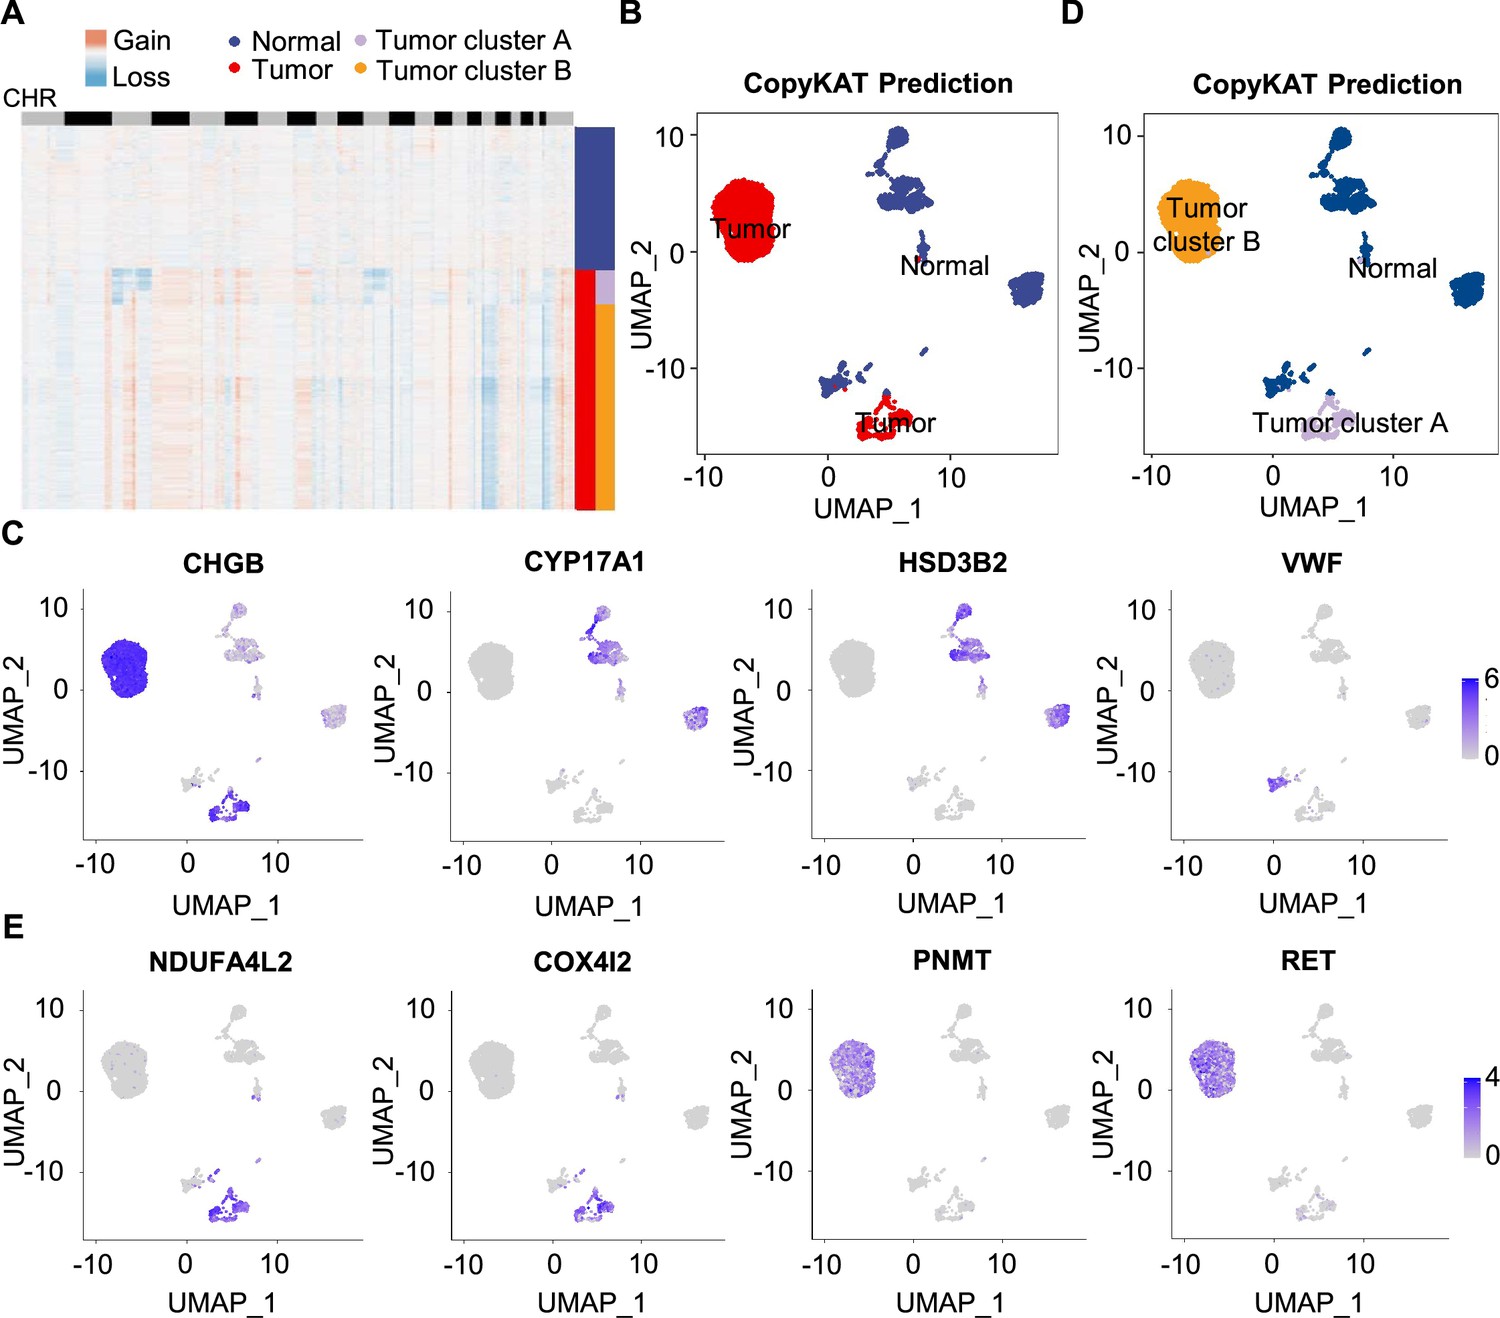
Single-cell copy number profiles in PCC clusters inferred by CopyKAT.
(A) Heatmap indicating the CNV patterns of inferred normal cells, tumor cells, tumor cluster A, and tumor cluster B. Blue, white, and red respectively indicate deletion from a chromosome, normal chromosome, and amplification on a chromosome. (B) UMAP plot of the inferred normal cells (blue) and tumor cells (red) identified by CopyKAT. (C) Feature plots showing the marker gene expression levels in inferred normal cells and tumor cells. (D) UMAP plot depicting the inferred normal cells (blue), tumor cluster A (purple), and tumor cluster B (orange) identified by CopyKAT. (E) Feature plots displaying the marker gene expression levels in inferred tumor cluster A and B.
Figure 4
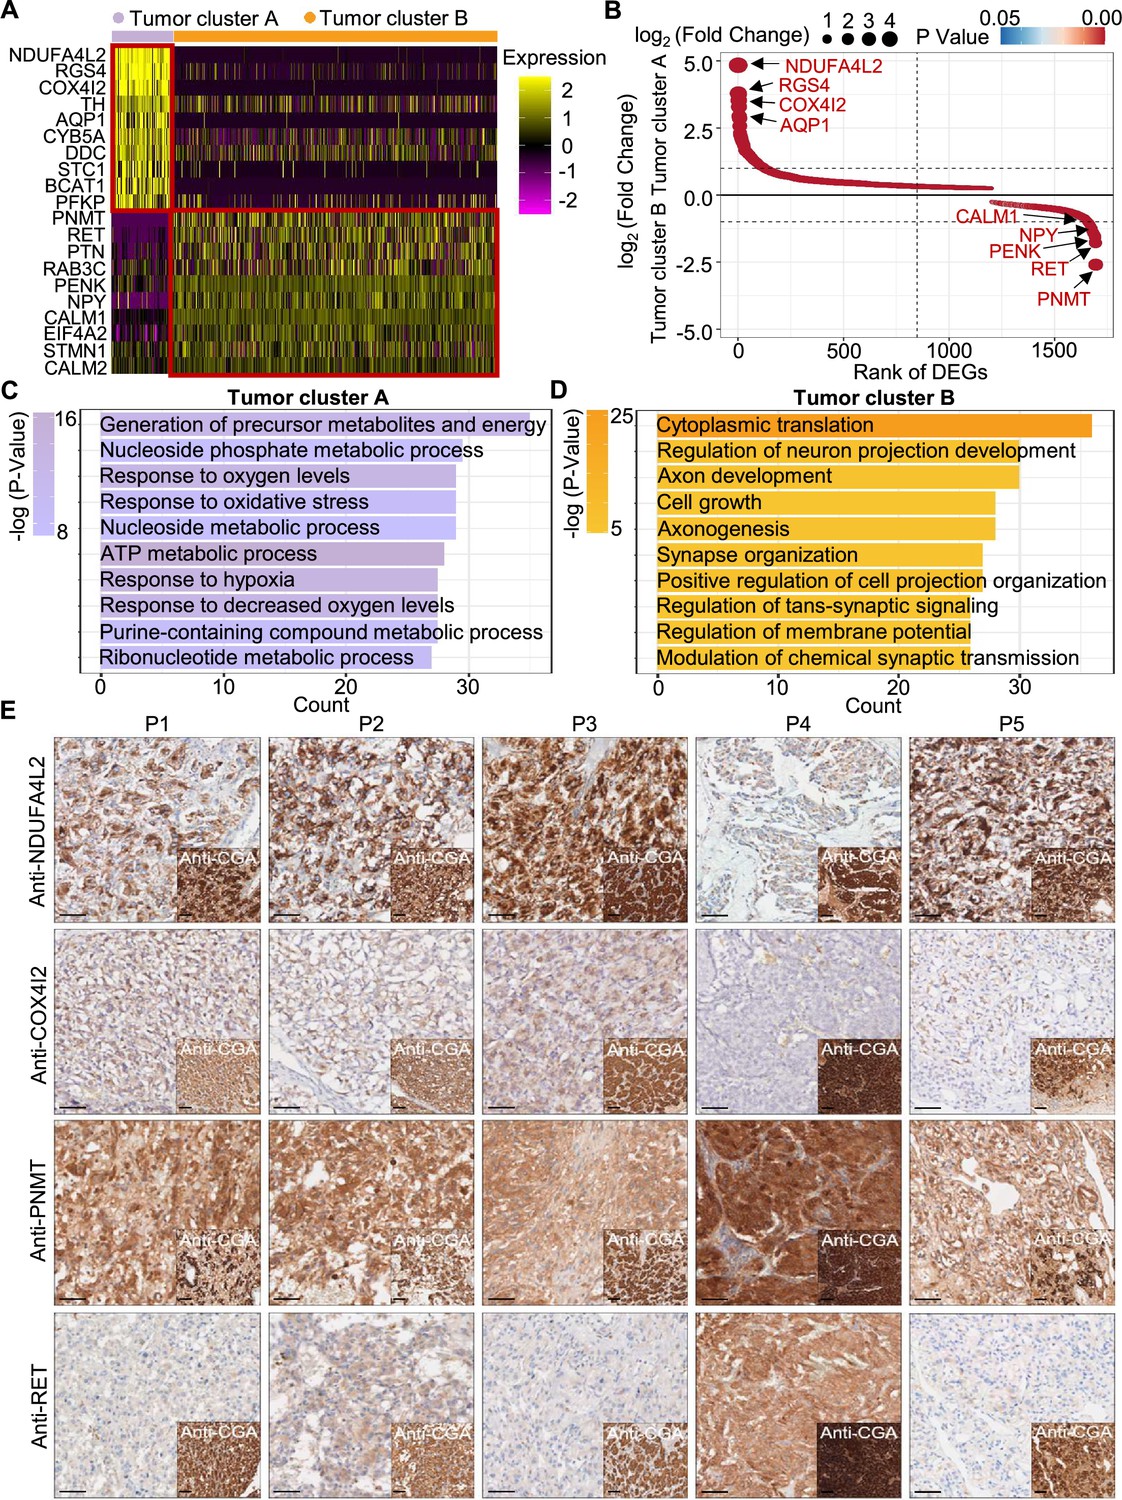
PCC patients were classified into metabolism-type and kinase-type.
(A) Heatmap plotting the scaled expression patterns of major marker genes in each tumor cluster. The color keys from pink to yellow indicate relative expression levels from low to high. (B) Dot plot depicting up-regulated genes of tumor cluster A (top) and tumor cluster B (bottom). The x-axis specifies the rank of DEGs and the y-axis specifies the natural logarithm of the FC. Dotted vertical and horizontal lines reflect the filtering criteria. Dot size represents the natural logarithm of the FC of genes. The color keys from blue to red indicate the P-value from high to low. (C, D) GO enrichment analysis of the up-regulated genes in tumor cluster A (C) and tumor cluster B (D) indicating the top altered 10 terms in the biological process of gene ontology. The x-axis specifies the number of genes enriched in the pathways. The color keys from shallow to deep indicate the p-value from high to low. (E) Immunohistochemistry staining of CGA, NDUFA4L2, COX4I2, PNMT, and RET markers in formalin-fixed paraffin-embedded PCC tissue sections matched to scRNA-seq specimens. Scale bar, 100 μm.
Figure 5
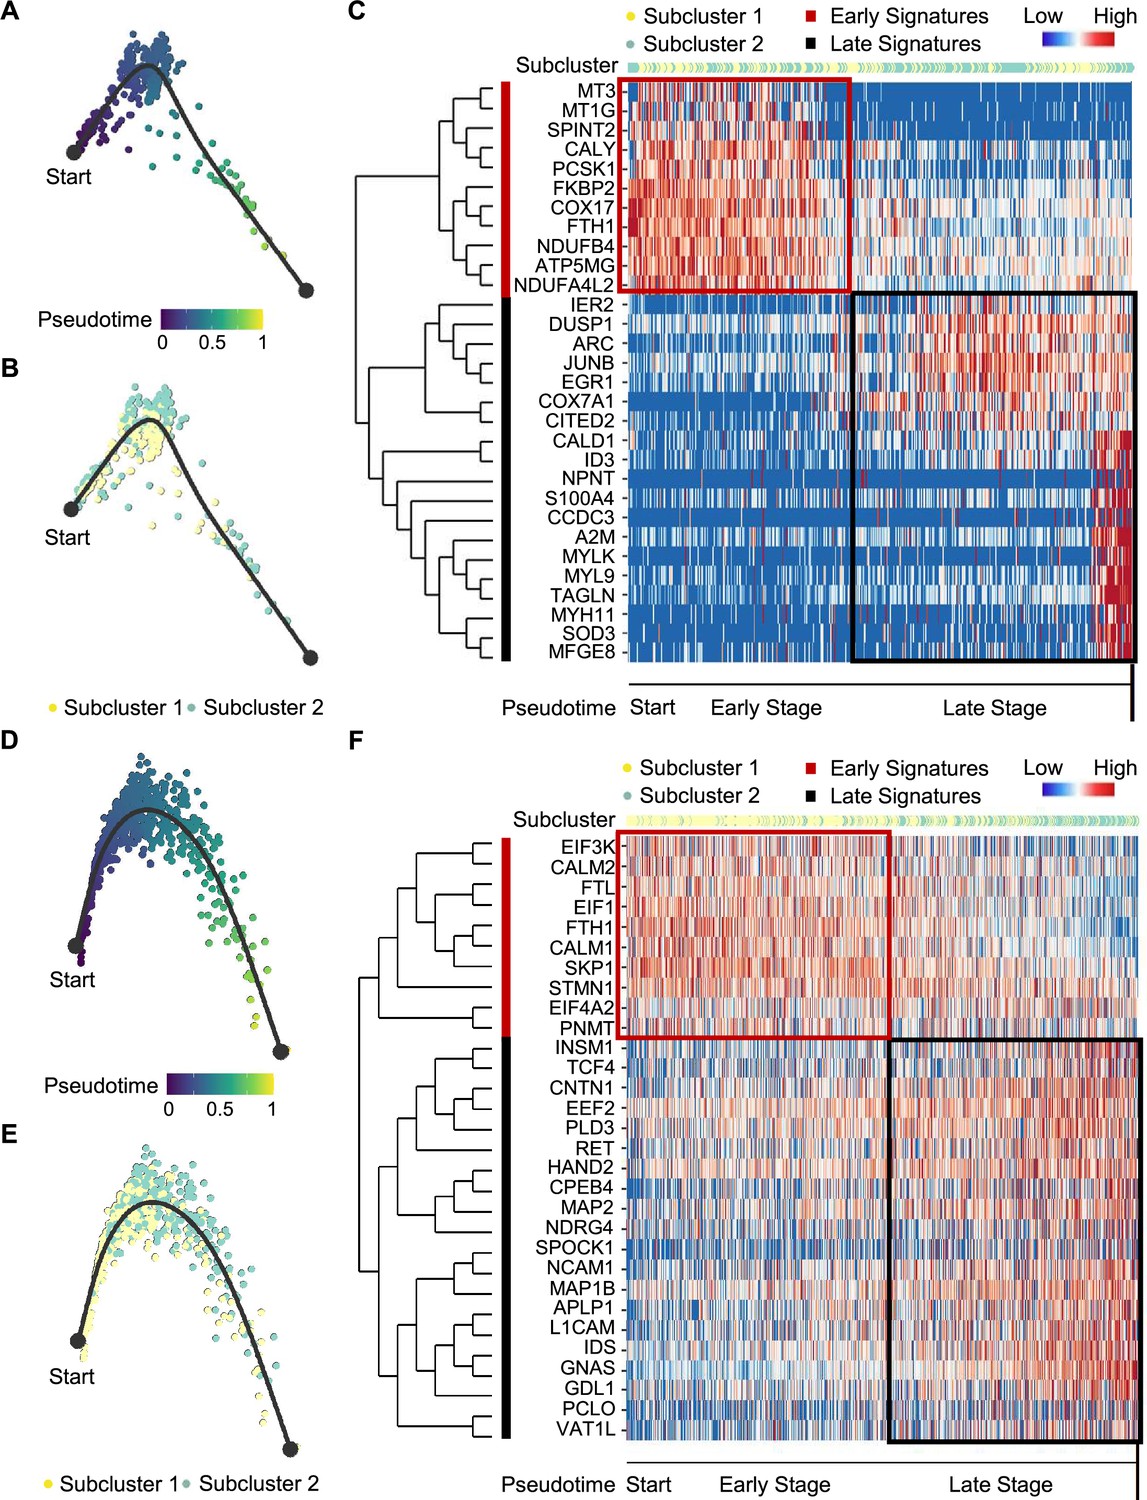
Pseudotime analysis of PCC tumor evolution by Dynverse.
(A, B) Pseudotime trajectory of metabolism-type PCC cells colored by pseudotime (A) and tumor subclusters (B). (C) Pseudotime heatmap plotting the expression levels of genes across the transition from beginning (left) to end (right). The color keys from blue to red indicate the gene expression levels from low to high. (D, E) Pseudotime trajectory of kinase-type PCC cells colored by pseudotime (D) and tumor subclusters (E). (F) Pseudotime heatmap showing the expression levels of genes across the transition from beginning (left) to end (right). The color keys from blue to red indicate the gene expression levels from low to high.
Figure 6 with 1 supplement
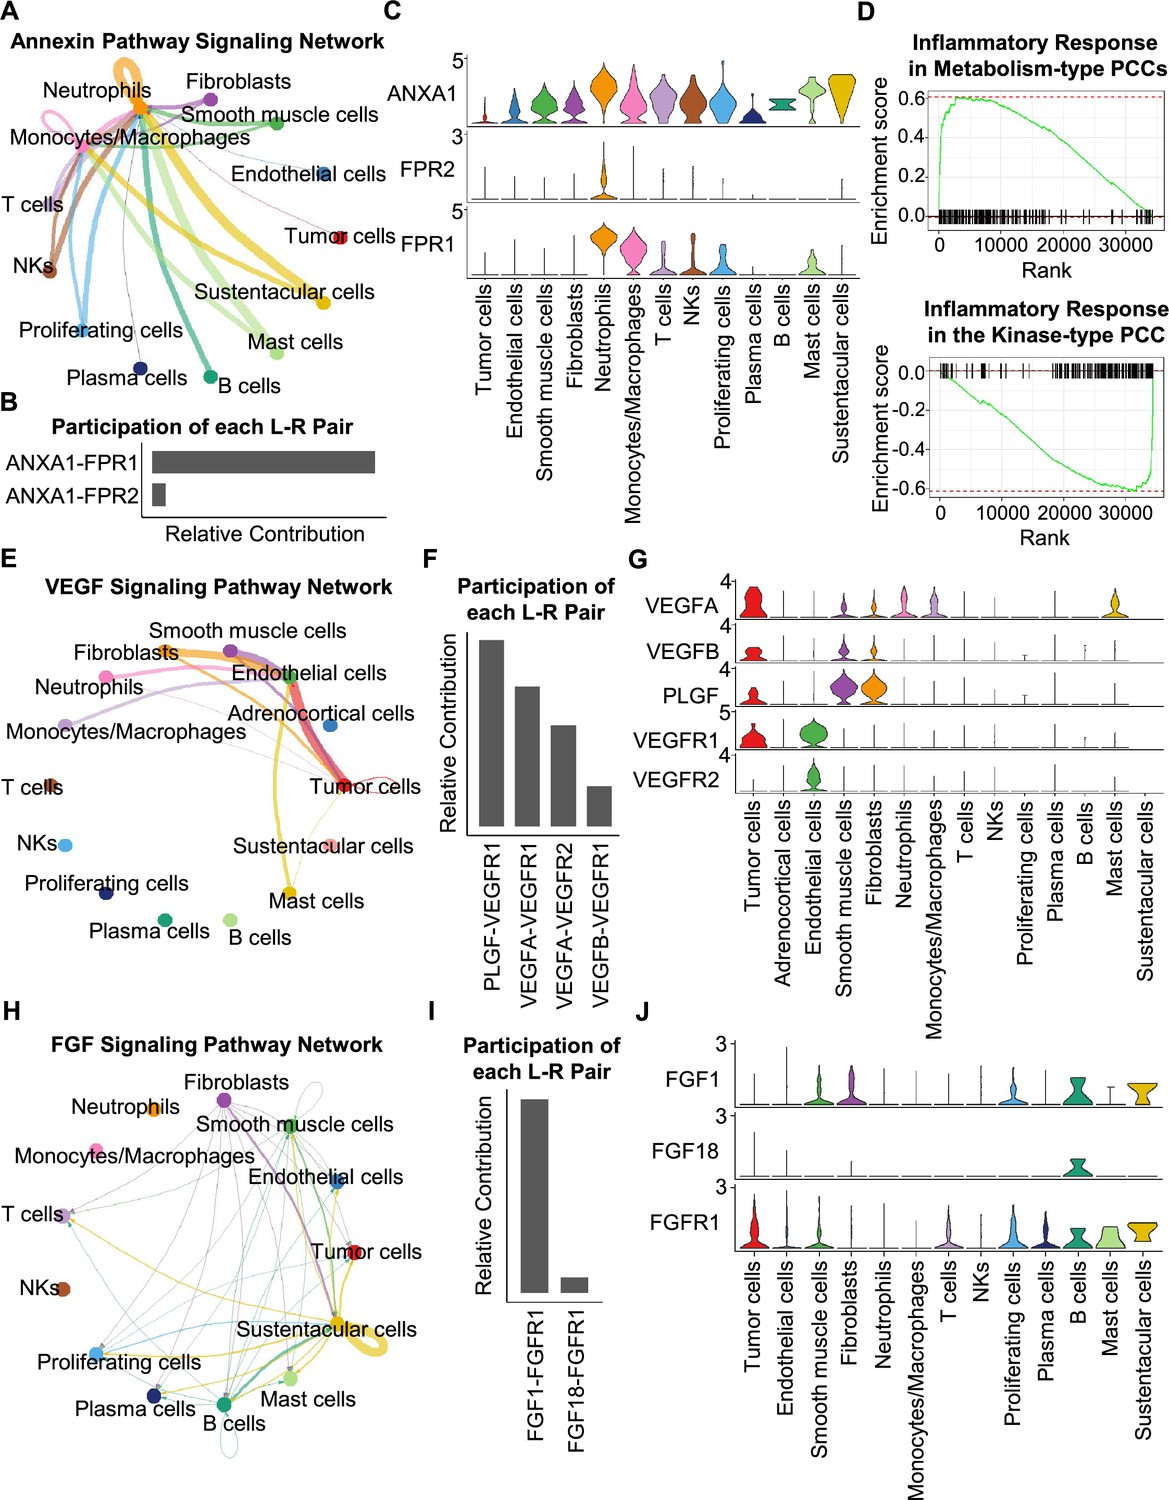
CellChat analysis reveals cell-cell communication patterns in PCC types.
(A) Circle plot showing an inferred annexin signaling pathway network in the metabolism-type PCC microenvironment. The edges connecting the circles represent the communication probability between any two kinds of cell types. The color of the edge denotes directionality (i.e., senders vs receivers). (B) Bar graph plotting the quantification of the relative contributions of individual ligand-receptor pairs to the overall annexin signaling pathway. (C) Violin plot of the expression distribution of ANXA1, FPR1, and FPR2 in main cell types of the metabolism-type PCC microenvironment. (D) GSEA enrichment plots of the inflammatory response signaling of metabolism-type patients (left) and the kinase-type patient (right). (E) Circle plot depicting an inferred VEGF signaling pathway. (F) Bar graph displaying the quantification of the relative contributions of individual ligand-receptor pairs to the overall VEGF communication network. (G) Violin plot plotting the expression distribution of VEGFA, VEGFB, PLGF, VEGFR1, and VEGFR2 in main cell types of P5 PCC microenvironment. (H) Circle plot of an inferred FGF signaling pathway in the kinase-type PCC microenvironment. (I) Bar graph showing the quantification of the relative contributions of individual ligand-receptor pairs to the overall FGF signaling pathway. (J) Violin plot plotting the expression distribution of FGF1, FGF18, and FGFR1 in main cell types of the kinase-type PCC microenvironment.
Figure 6—figure supplement 1

The frequency distribution of cell types within the microenvironment of metabolism-type and kinase-type PCC patients.
Figure 7
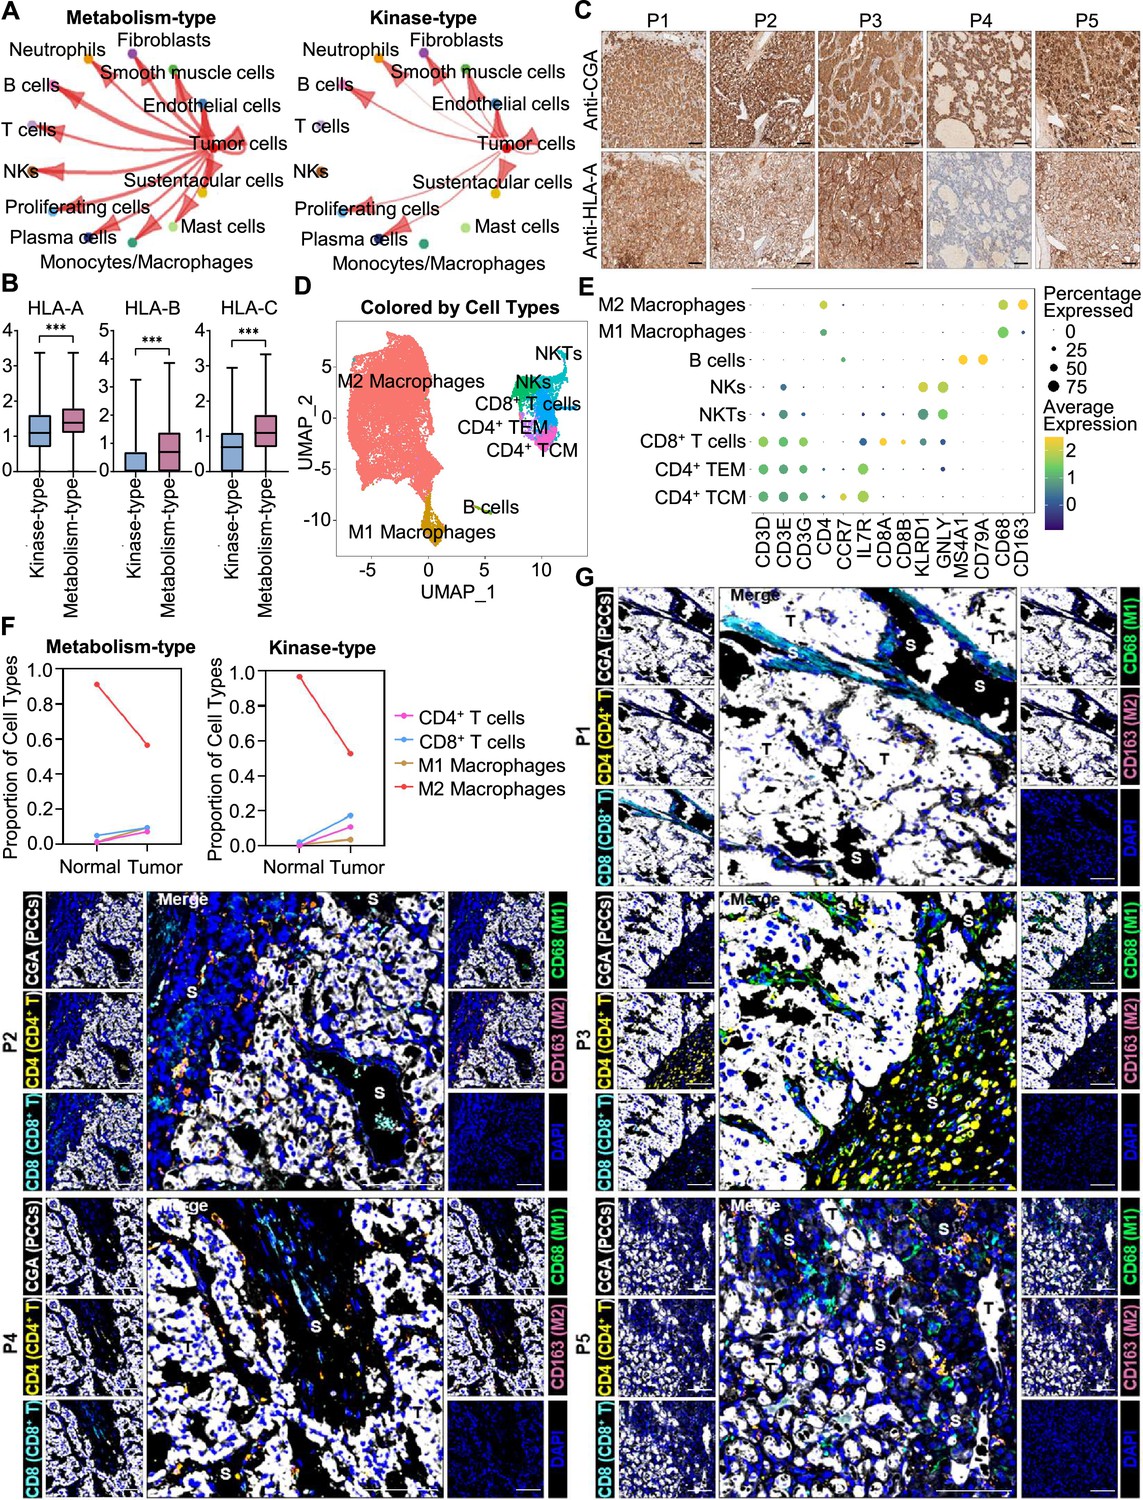
Prediction of the immune escape potential and immunotherapy response of PCC patients.
(A) Circle plots depicting inferred inter-cellular interactions in metabolism-type (left) and kinase-type (right) PCC microenvironment. (B) Box plots showing the expression levels of HLA-A, HLA-B, and HLA-C in metabolism-type and kinase-type PCC patients. (C) Immunohistochemistry staining of CGA and HLA-A in formalin-fixed paraffin-embedded PCC tissue sections matched to scRNA-seq specimens. Scale bar, 100 μm. (D) UMAP plot showing 8 immune cell types detected from all PCC specimens. (E) Dot plot of representative marker genes for each immune cell type. The color scale represents the average marker gene expression level; dot size represents the percentage of cells expressing a given marker gene. (F) Comparison of the proportion of immune cell types in tumor vs adjacent normal adrenal medullary tissues. (G) Multispectral immunofluorescent staining for the juxtaposition of PCC cells (marked by CGA), CD4+ T cells (marked by CD4), CD8+ T cells (marked by CD8), M1 macrophages (marked by CD68), and M2 macrophages (marked by CD163) in formalin-fixed paraffin-embedded PCC tissue sections matched to scRNA-seq specimens. The white, yellow, cyan, green, pink, and blue spots indicated cells with high expression of CGA, CD4, CD8, CD68, CD163, and DAPI proteins in PCC tissue sections, respectively. S, stroma; T, tumor. Scale bar, 100 μm.
Author response image 1

Hematoxylin-eosin staining and immunohistochemistry staining of CGA marker in formalin-fixed paraffin-embedded PCC tissue sections matched to scRNA-seq specimens.
Scale bar, 100 μm.
Author response image 2

Schematic of the experimental pipeline.
11 tumor specimens and 5 adjacent normal adrenal medullary specimens were isolated from 5 PCC patients, dissociated into single-cell suspensions, and analyzed using 10x Genomics Chromium droplet scRNA-seq.
Author response image 3

Dot plot of representative marker genes for each cell type.
The color scale represents the average marker gene expression level; dot size represents the percentage of cells expressing a given marker gene.
Author response image 4

Integration Analysis across 5 PCC Patients Revealing the Cell Type Composition of the PCC Microenvironment.
UMAP plot depicting the distribution of adrenal cells, stromal cells, and immune cells (including lymphocytes and myeloid cells) within the PCC microenvironment.
Author response image 5

The frequency distribution of cell types within the microenvironment of metabolism-type and kinase-type PCC patients.
Additional files
-
Supplementary file 1
WES Detection, PASS Scores, and Clinical Information of 5 PCC Patients.
(a) Somatic and Germline Mutations in 5 PCC Patients Detected by WES. (b) PASS Scores of Collected Tumor Tissues. (c) Clinical Information of 5 PCC Patients.
- https://cdn.elifesciences.org/articles/87586/elife-87586-supp1-v1.docx
-
MDAR checklist
- https://cdn.elifesciences.org/articles/87586/elife-87586-mdarchecklist1-v1.docx
Download links
A two-part list of links to download the article, or parts of the article, in various formats.
Downloads (link to download the article as PDF)
Open citations (links to open the citations from this article in various online reference manager services)
Cite this article (links to download the citations from this article in formats compatible with various reference manager tools)
Molecular classification and tumor microenvironment characteristics in pheochromocytomas
eLife 12:RP87586.
https://doi.org/10.7554/eLife.87586.3


