The ability to sense the environment is heterogeneously distributed in cell populations
- Department of Biomedical Engineering, Yale University, United States
- Department of Physics, University of Florida, United States
- Systems Biology Institute, Yale University, United States
Figures
Figure 1
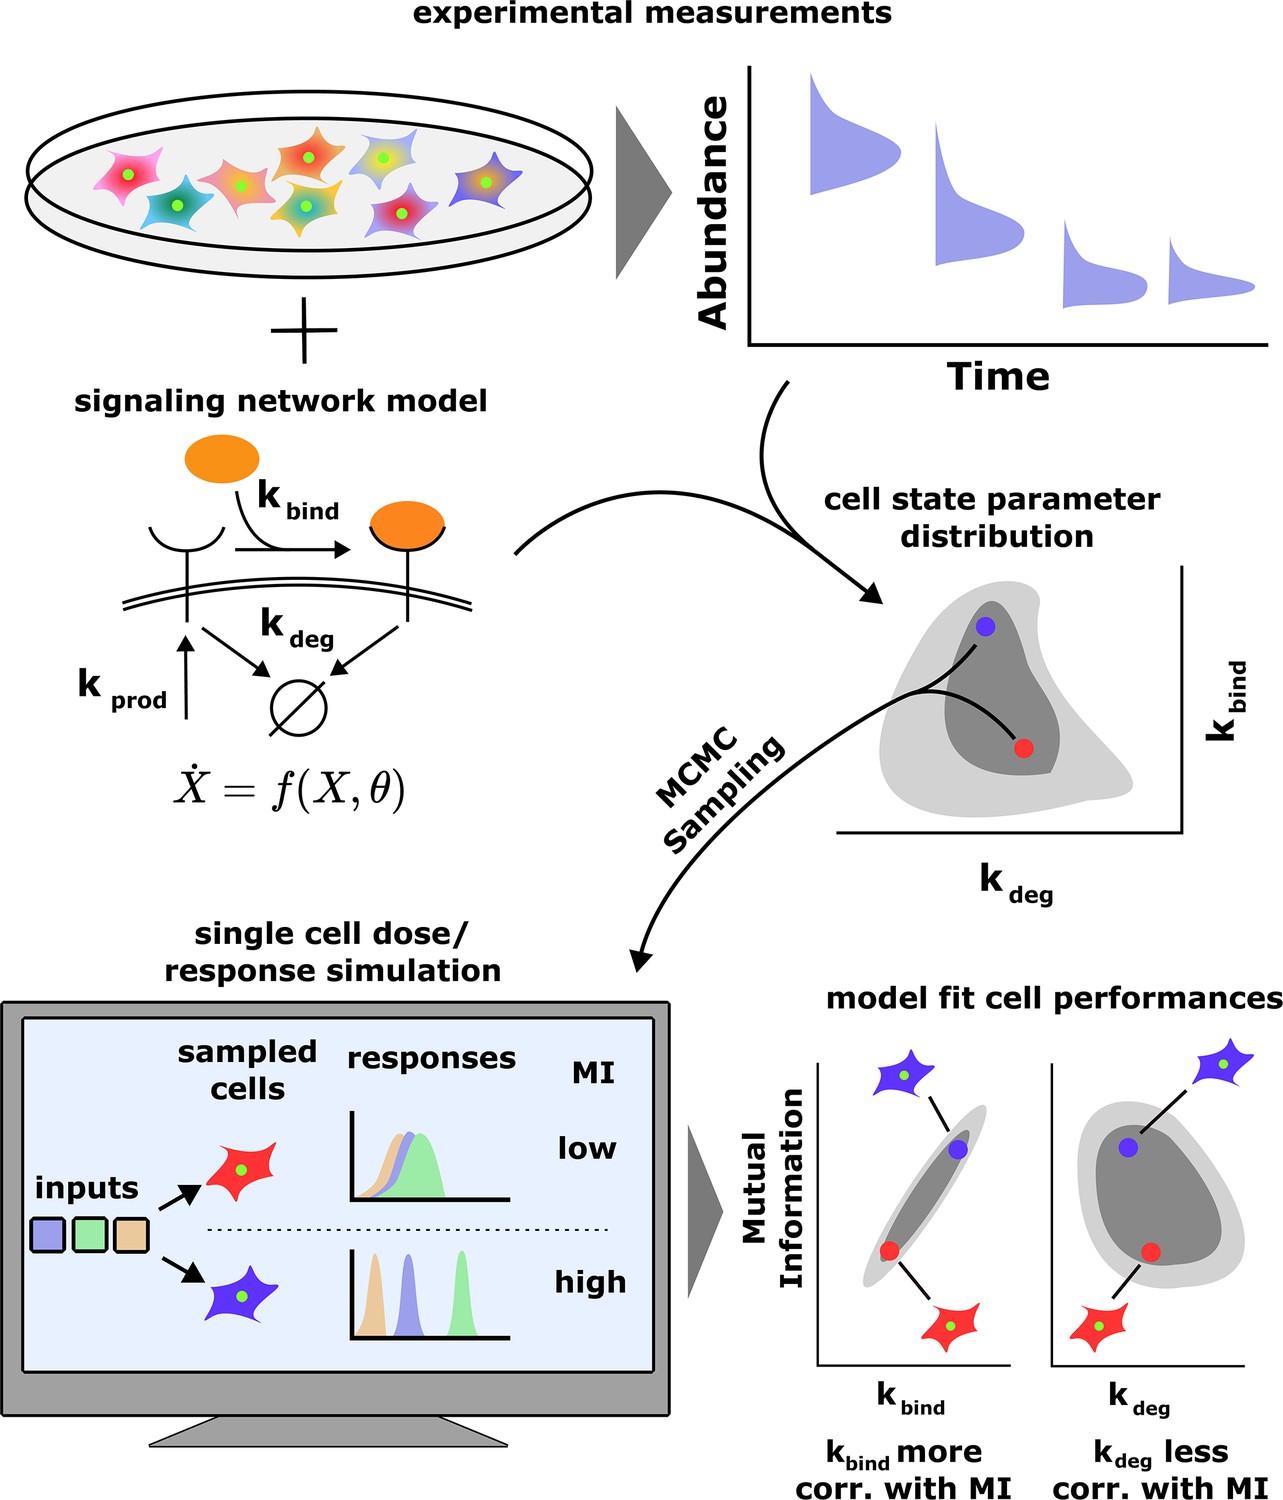
A schematic of our computational approach.
Top: single-cell data across different input conditions and time points are integrated with a stochastic model of a signaling network using a previous developed maximum entropy approach leading to a distribution over signaling network parameters (middle). Bottom: in silico cells are generated using the inferred parameter distribution and cell state-specific mutual information and population distribution of cell performances is estimated. The model also evaluates the correlation between cells’ performance and biochemical parameters.
Figure 2 with 7 supplements
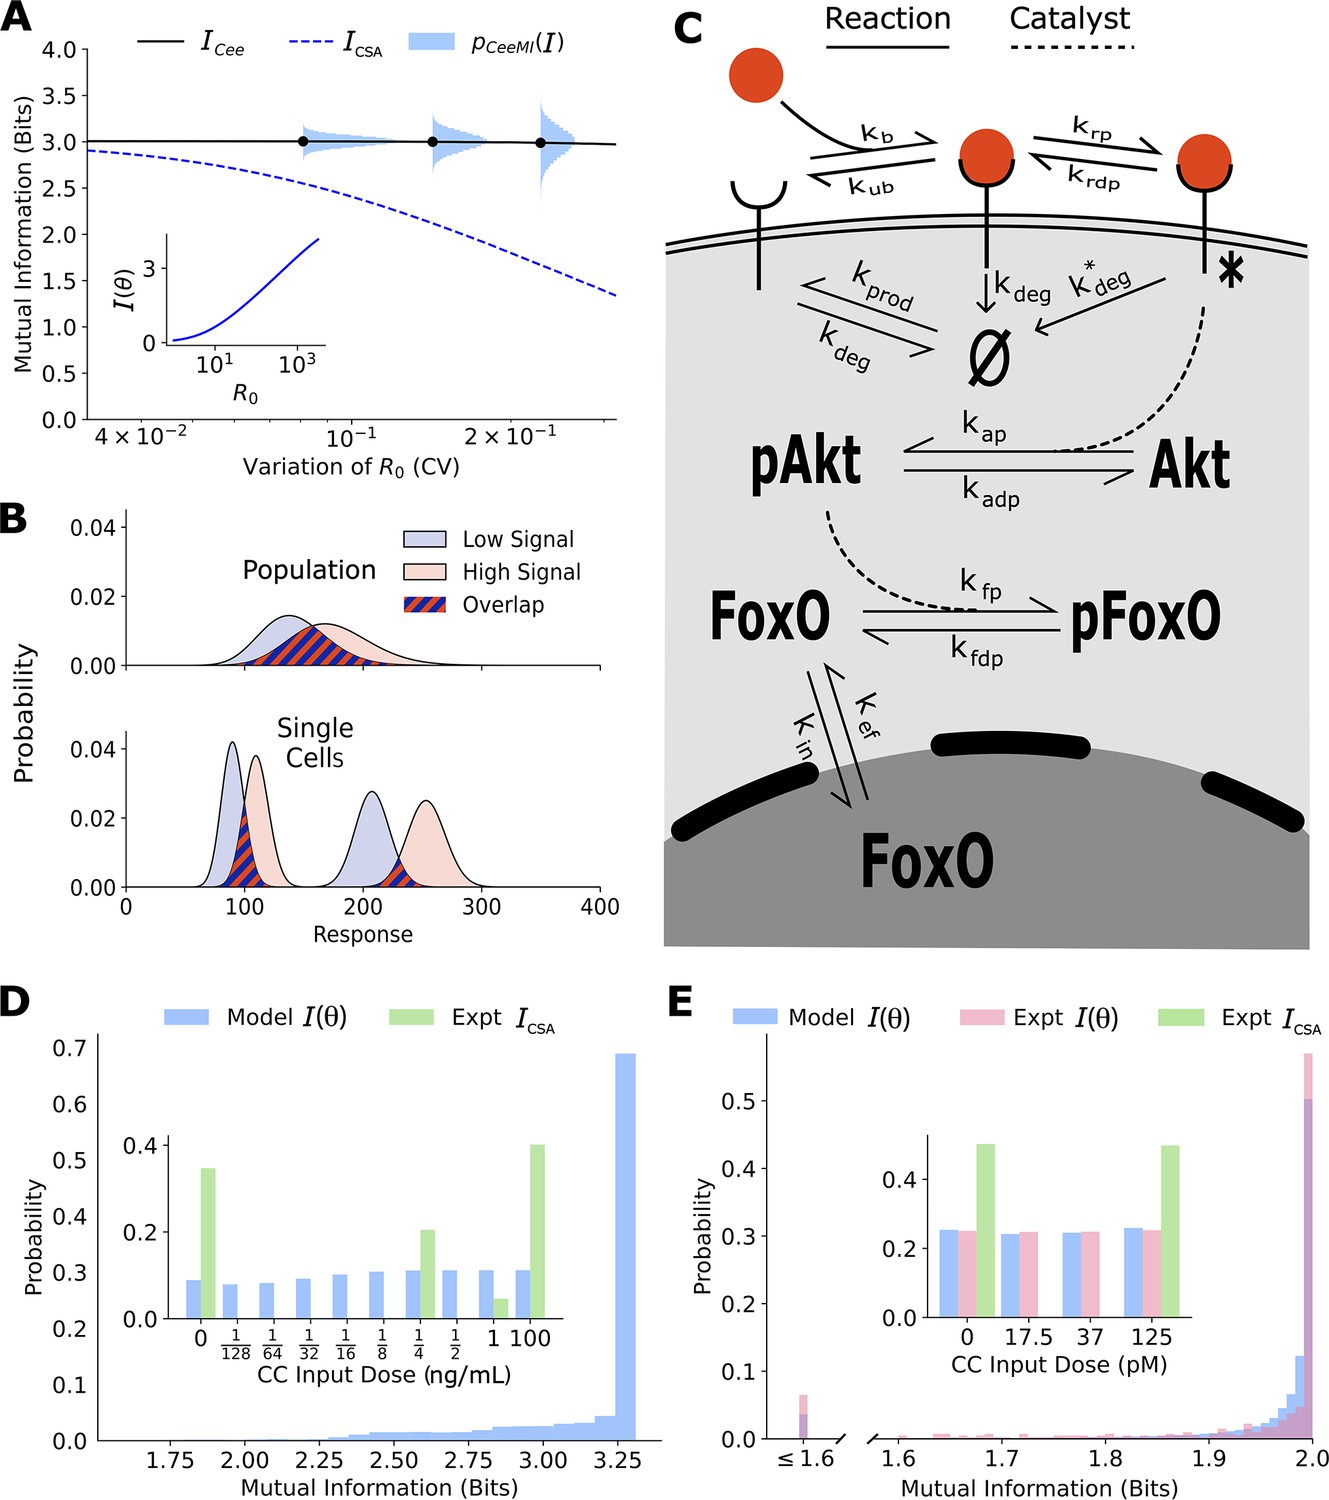
Channel capacities are broadly distributed in a population of cells.
(A) The distribution of single-cell sensing abilities (horizontal blue histograms) and its average plotted as a function of the coefficient of variation of the distribution of one cell state variable, the cell surface receptor number The dashed blue lines show the traditional cell state-averaged mutual information (Equation 1). The inset shows the dependence between cell state-specific mutual information and cell state variable The input distribution is assumed to be a gamma distribution. (B) A schematic showing the effect of heterogeneity in cell states on population-level response. Even when individual cells have little overlap in their responses to extracellular signal (bottom), the population-level responses could have significant overlap (top), leading to a low mutual information between cell state-averaged response and the input. (C) A combined schematic of the two growth factor pathways. Extracellular growth factor ligand (red circle) binds to cell surface receptors which are shuttled to and from the plasma membrane continuously. Ligand-bound receptors are phosphorylated and activate Akt. Phosphorylated Akt leads to phosphorylation of FoxO, which bars it from entering the nucleus. EGF/EGFR model is limited to the reactions on the plasma membrane. The corresponding cell state variables are given by . The cell state variables for the IGF/FoxO model are given by . (D) The estimated distribution of single-cell mutual information values for the EGF/EGFR pathway using a maximum entropy estimation of . The inset shows the input distribution corresponding to the maximum of the average of (blue), along with the input distribution corresponding to the channel capacity of (green). (E) Same as (D) for the IGF/FoxO pathway. We additionally show the experimentally estimated (pink).
Figure 2—figure supplement 1

Schematic of the toy model.
Cell surface receptors bind to ligand (orange oval). Ligand-free receptors and ligand-bound receptors are shuttled between the plasma membrane and the cytoplasm.
Figure 2—figure supplement 2
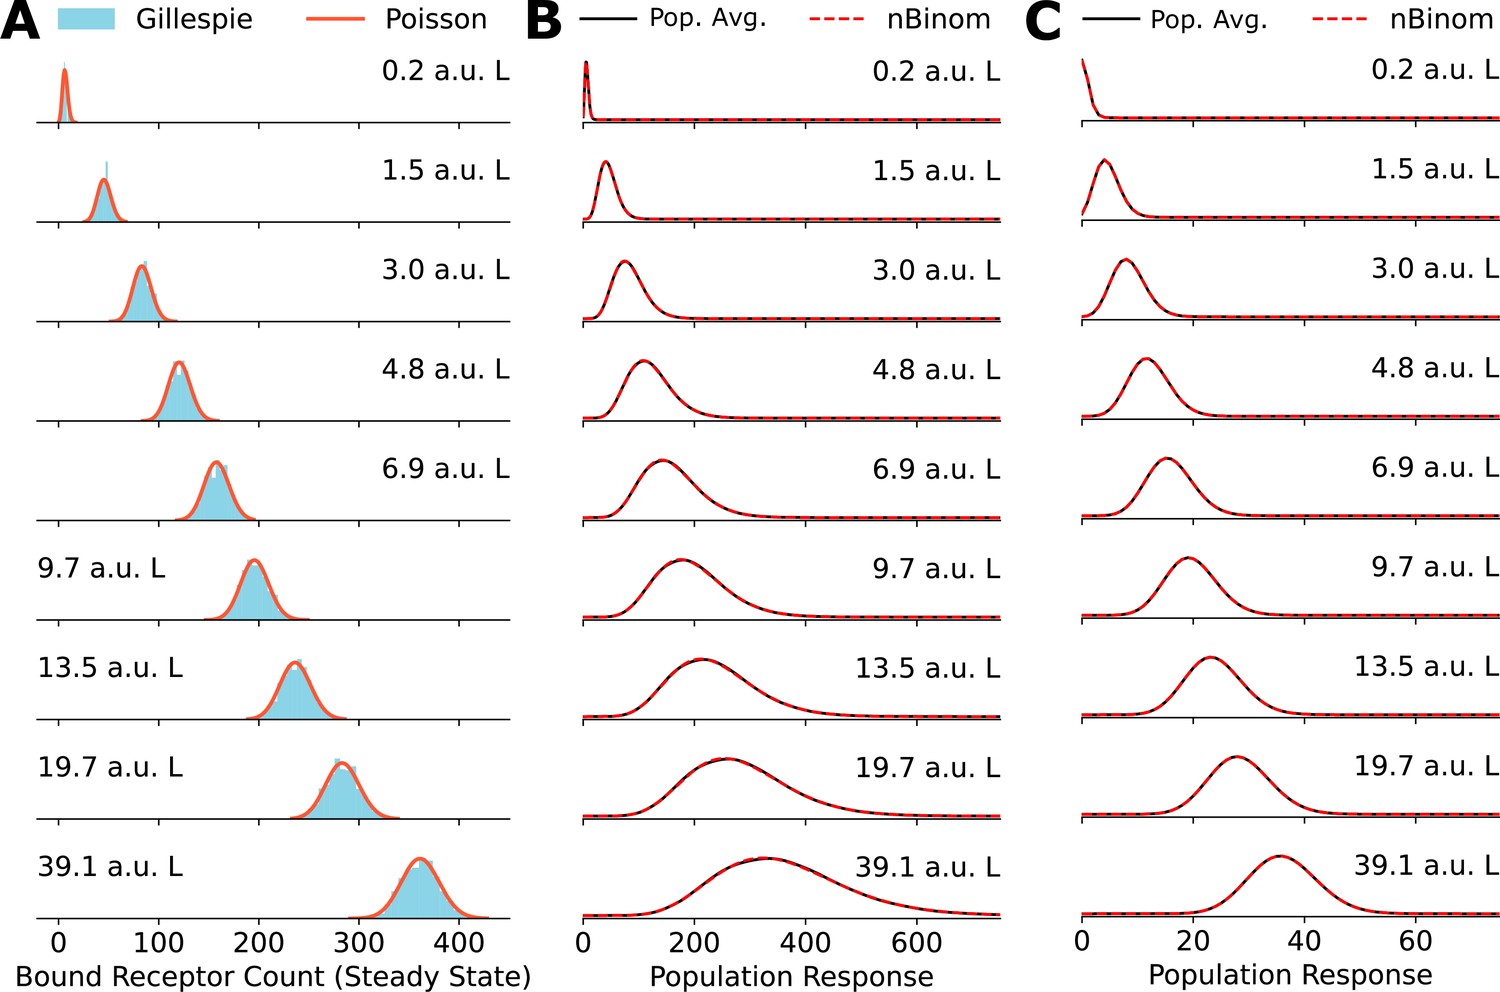
Poisson distribution accurately fits numerically obtained distributions.
(A) Comparison between explicit simulations of the toy network using Gillespie’s algorithm and the Poisson distribution. (B) A comparison between the negative binomial distribution assumption and population average distribution of receptor levels obtained by averaging over a gamma distribution for the cell state variable . (C) Same as in (B) for cell state variable .
Figure 2—figure supplement 3
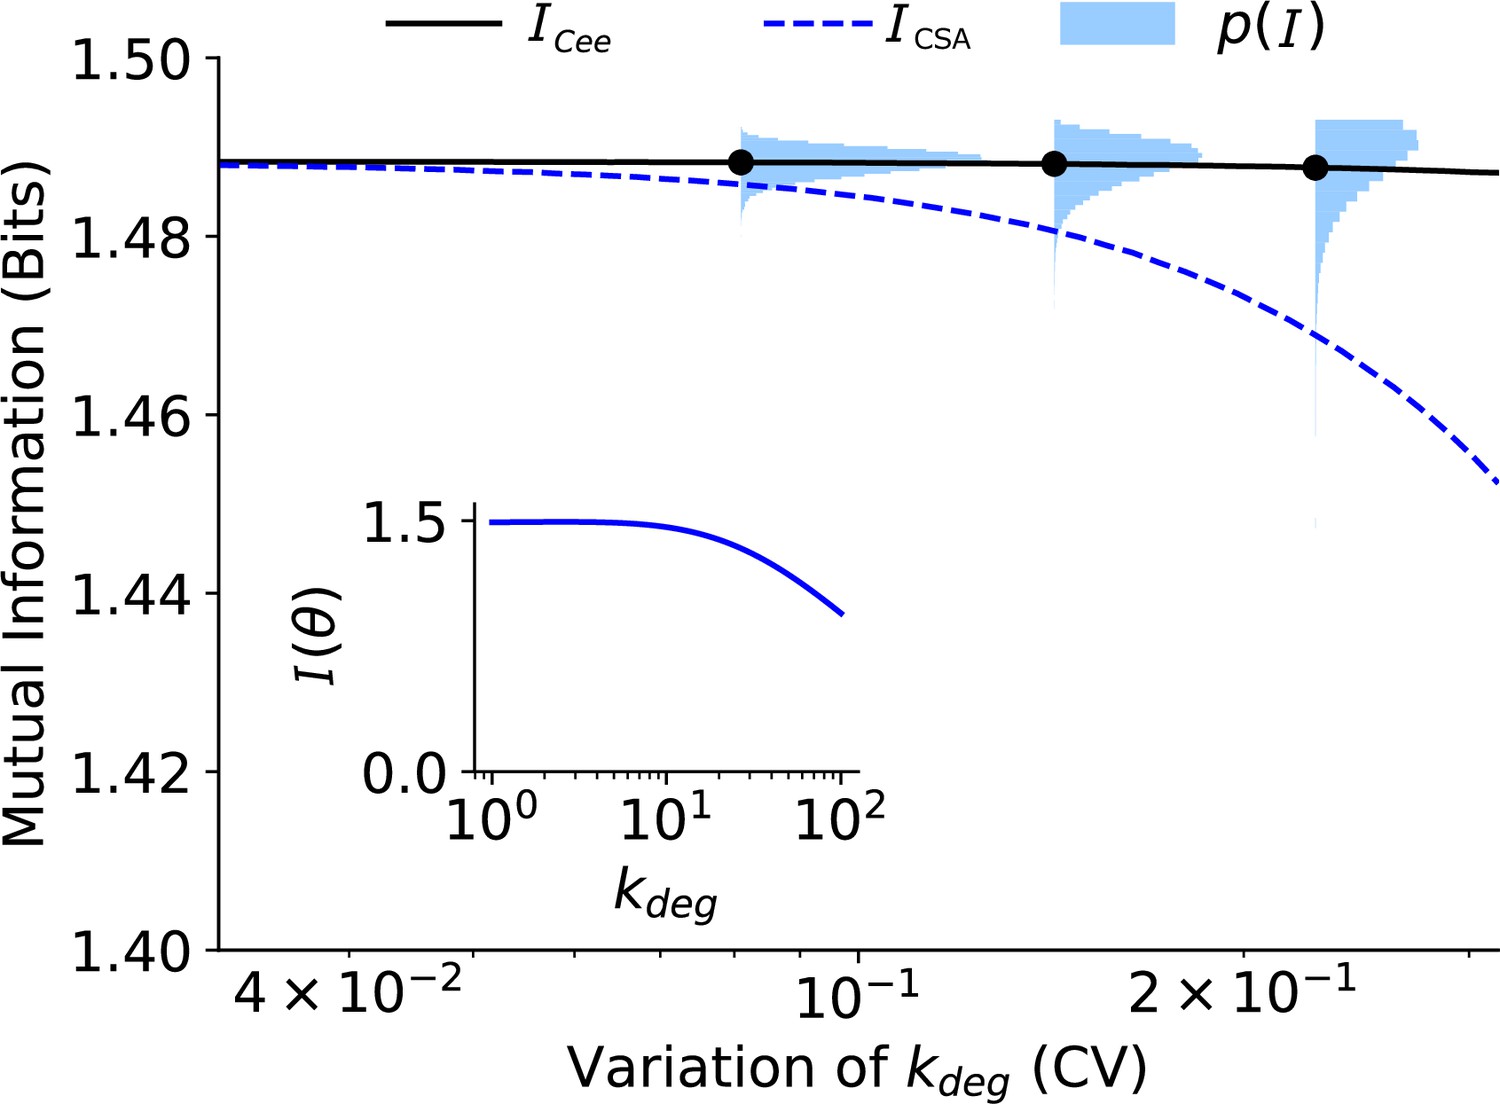
Values of (Equation S1), (Equation S3), and (y-axis) as a function of the degree of variability (coefficient of variation) in .
The inset shows (Equation S2) as a function of .
Figure 2—figure supplement 4
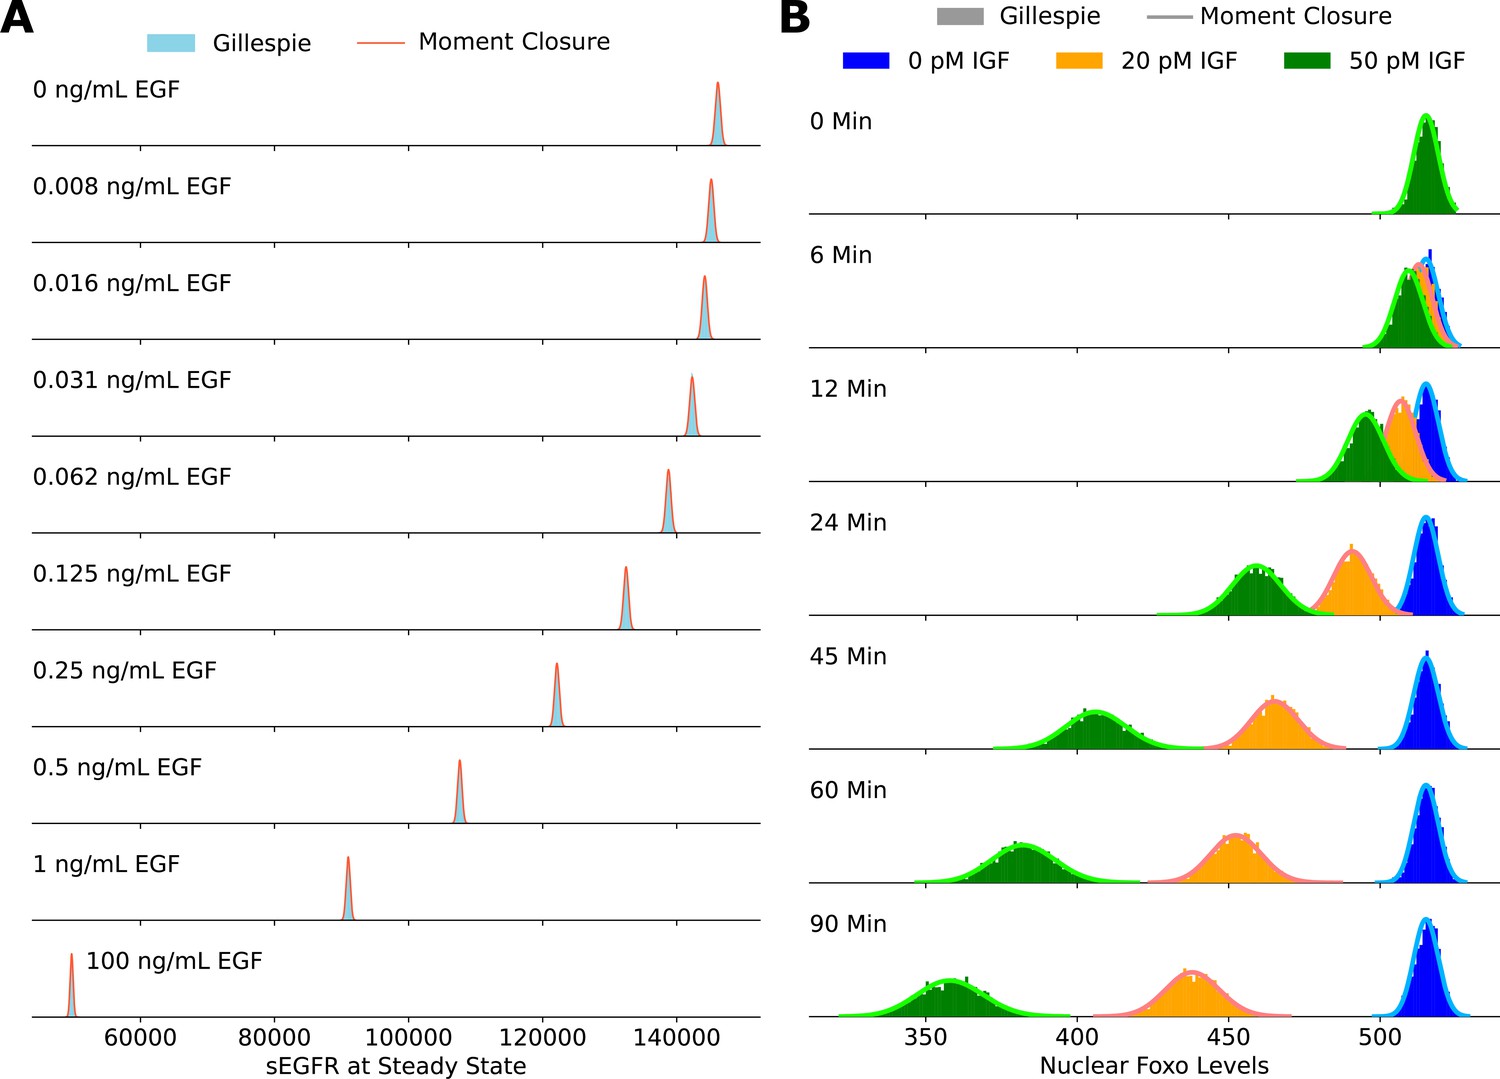
Validating the accuracy of the moment closure approximation against histograms obtained using the Gillespie algorithm.
The steady-state cell surface EGFR levels are shown in panel A, and the steady-state nuclear FoxO levels are shown in panel B.
Figure 2—figure supplement 5

Mean absolute relative error between predicted bin fractions and estimated bin fractions as a function of iteration number for the IGF/FoxO (panel A) and the EGF/EGFR pathway (panel B).
Figure 2—figure supplement 6

A schematic of the experiment performed by Gross et al.
Single cells were treated with subsequent doses of IGF every 90 min and nuclear FoxO levels were recorded. FoxO levels reached a steady state at ~30–45 min of continuous IGF stimulation. Information about the steady-state response was collected between 60 and 90 min of IGF stimulation (shaded regions). (A) The single-cell responses for all 400 cells examined in the step dose experiment along with the average response. (B) The response of a single cell to the incremental dosing scheme.
Figure 2—figure supplement 7
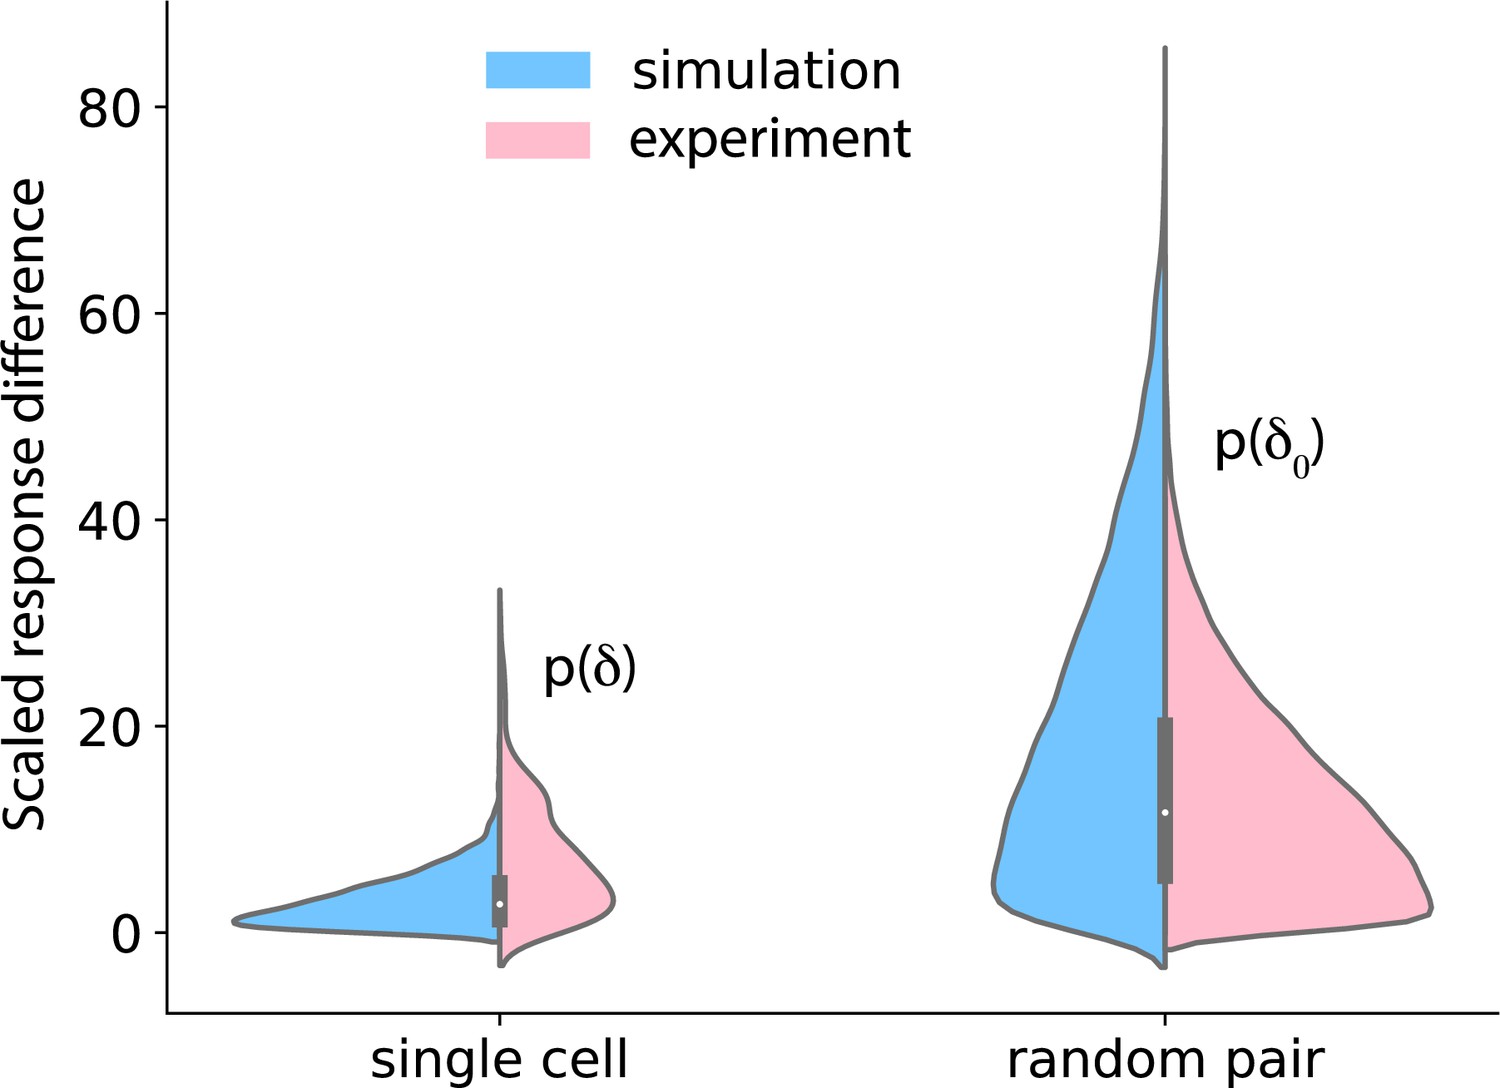
Temporal stability of cell states.
Left: cells were treated with 37.5 pM of IGF for 90 min, washed out for 120 min, and again treated with 37.5 pM of IGF. Nuclear FoxO was measured during the treatment and the washout. The distributions on the left show the difference in FoxO levels in single cells after the two 90 min IGF stimulations (pink: data; blue: model). Right: distribution of difference in FoxO levels in two randomly picked cells after 90 min of exposure to 37.5 pM IGF.
Figure 3 with 1 supplement
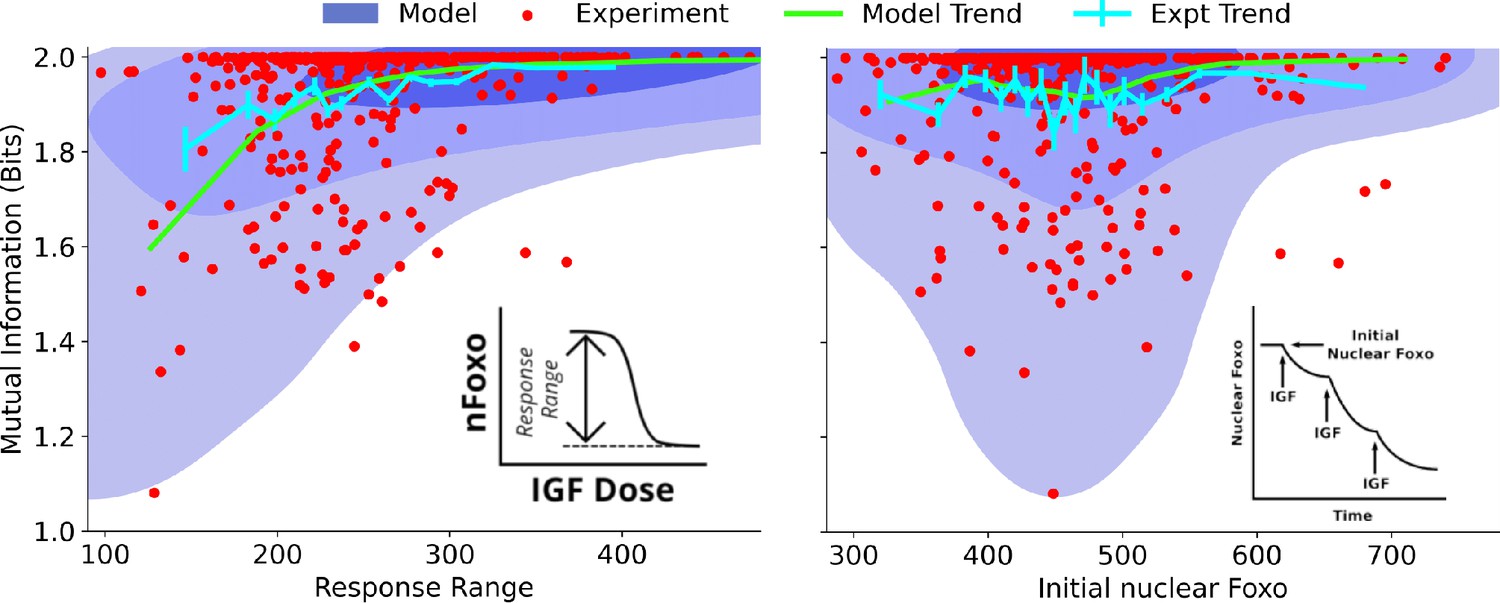
Dependence on cell state-dependent mutual information on biochemical parameters.
Left: the joint distribution of cell state-specific mutual information and biochemical parameter chosen to be the single-cell response range of nuclear FoxO levels (x-axis, see inset for a cartoon). The shaded blue regions are model predictions, and the green line is the model average. The darker shades represent higher probabilities. The red dots represent experimental cells. The cyan line represents experimental averages. Right: same as left, with biochemical parameter chosen to be steady-state nuclear Foxo levels in the absence of stimulation. The contours represent 1–10%, 10–50%, and 50–100% of the total probability mass (from faint to dark shading).
Figure 3—figure supplement 1
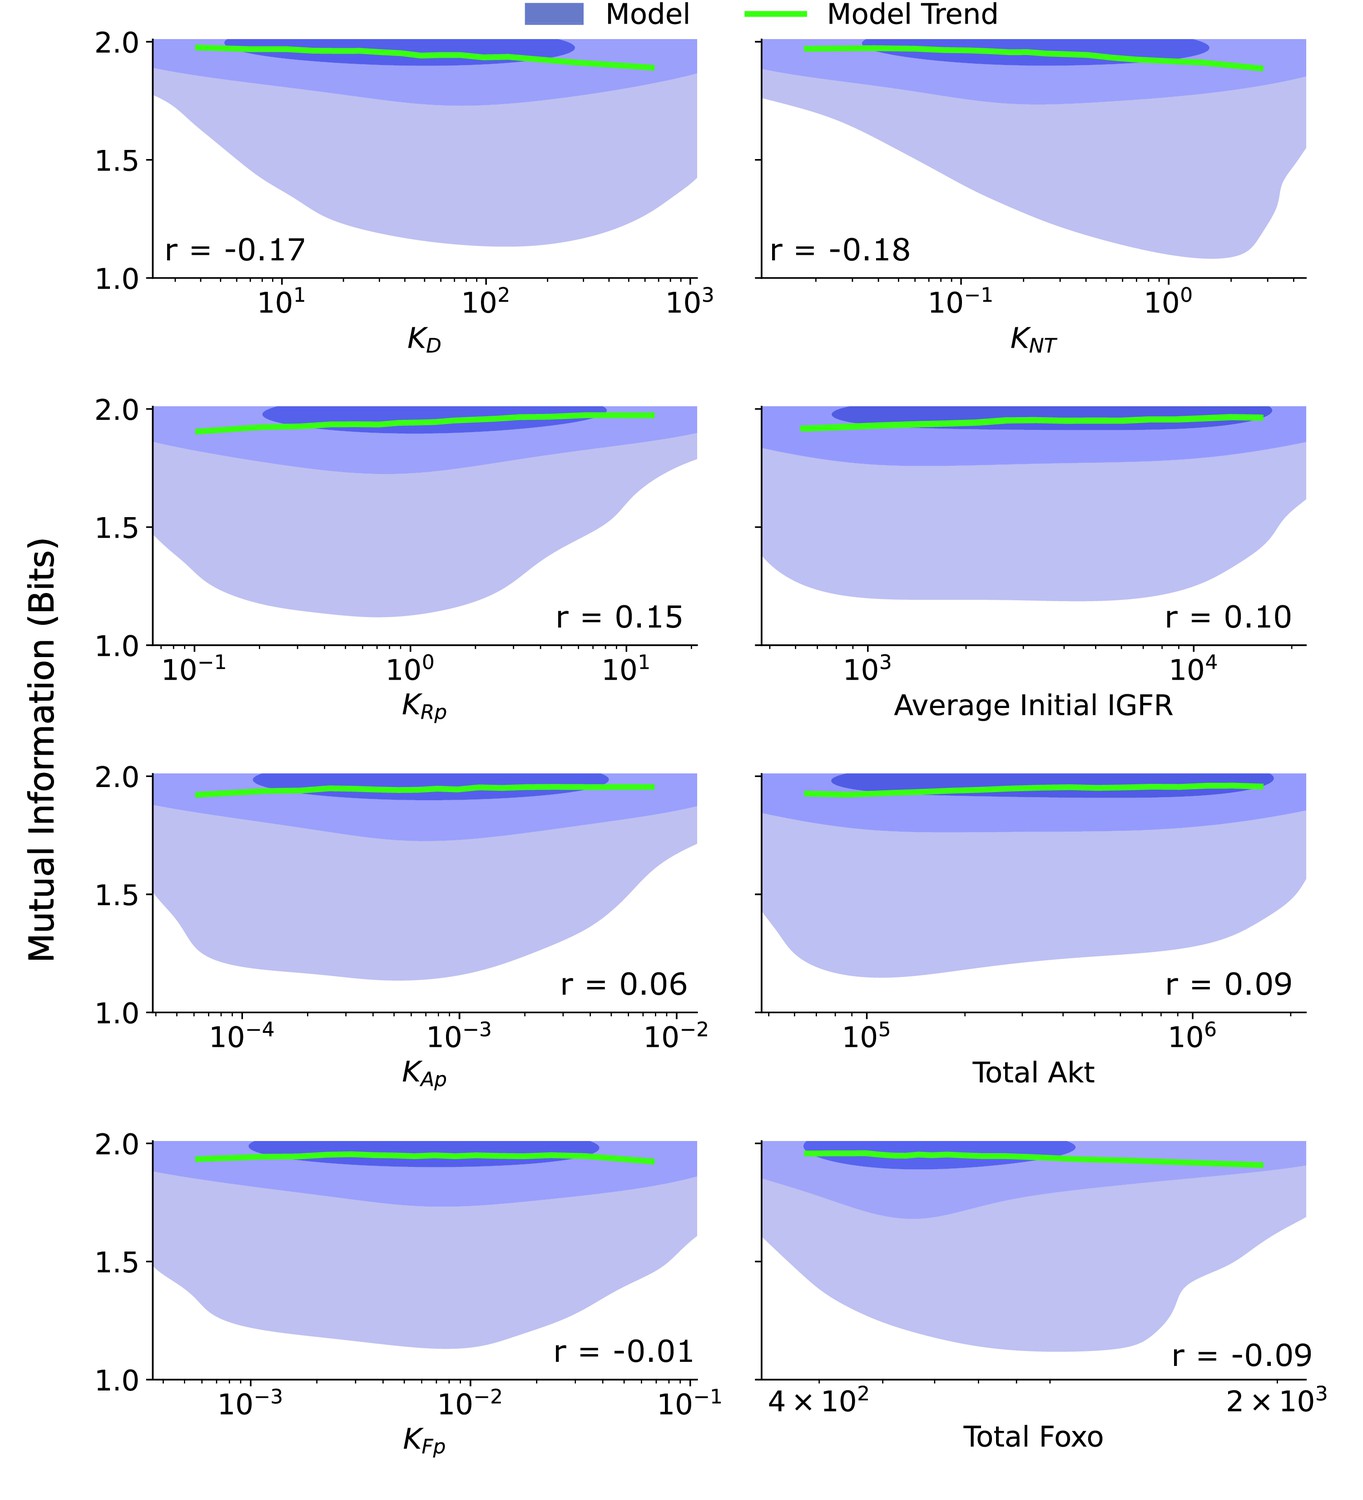
Joint distributions for additional biochemical parameters.
The joint distribution are provided for a collection of biochemical parameters: ≡ the ligand dissociation constant, ≡ the ratio of the FoxO efflux rate to the FoxO influx rate, ≡ the ratio of the IGFR phosphorylation rate to the pIGFR dephosphorylation rate, Average Initial IGFR ≡ the average IGFR before IGF stimulation, given by the ratio of the production rate of IGFR to the degradation rate of IGFR, ≡ the ratio of the Akt phosphorylation rate to the pAkt dephosphorylation rate, Total Akt ≡ the combined count of pAkt and Akt, ≡ the ratio of the cytoplasmic FoxO phosphorylation rate to the cytoplasmic pFoxO dephosphorylation rate, Total FoxO ≡ the combined count of all forms of FoxO. The shaded blue regions are model predictions, and the green line is the model average. The correlation coefficient, r, is provided for each parameter. The contours represent 1–10%, 10–50%, and 50–100% of the total probability mass (from faint to dark shading).
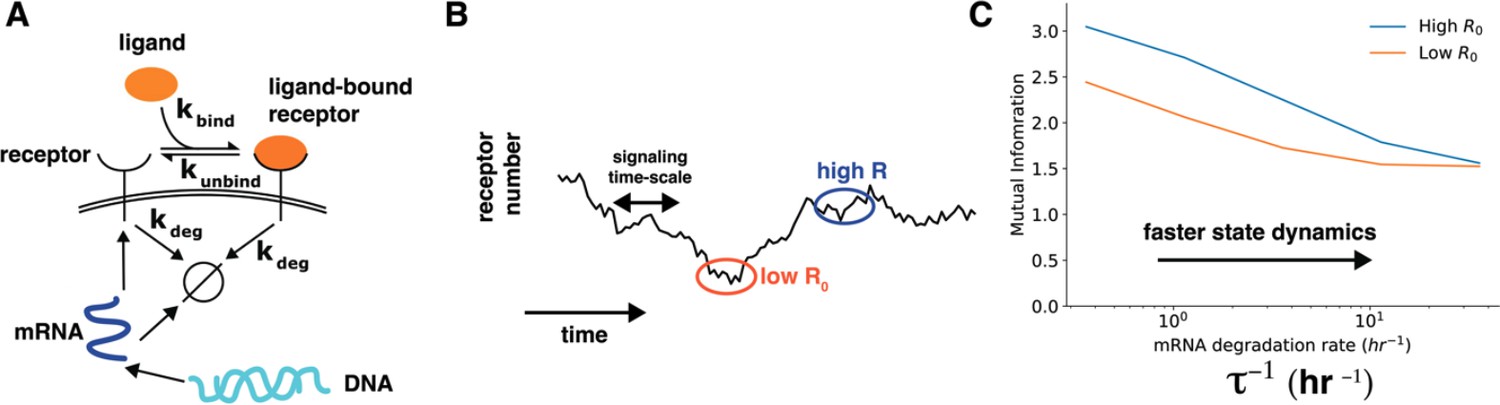
Figure 4

Cell state dynamics governs cell state-conditioned mutual information.
(A) In a simple stochastic model, receptor mRNA is produced at a constant rate from the DNA and the translated into ligand-free receptors. The number of ligand-bound receptors after a short exposure to ligands is considered the output. (B) A schematic showing dynamics of receptor numbers when mRNA dynamics are slower compared to signaling time scales. (C) Conditioning on receptor numbers leads to differing abilities in sensing the environment when the time scale of mRNA dynamics is slow. In contrast, when the mRNA dynamics are fast (large ), conditioning on cell state variables does not lead to difference in sensing abilities.
Author response image 1

Author response image 1.
Left: nuclear FoxO response averaged over all cells in the population across different ligand concentration. Right: nuclear FoxO response was first normalized at the single cell level and then averaged over all cells in the population across different ligand concentrations.
Author response image 2

Author response image 2.
Left: Cells were treated with 37.5 pM of IGF for 90 minutes, washed out for 120 minutes and again treated with 37.5 pM of IGF. Nuclear FoxO was measured during the treatment and the washout. The distributions on the left show the difference in FoxO levels in single cells after the two 90 minutes IGF stimulations (pink: data, blue: model). Right: Distribution of difference in FoxO levels in two randomly picked cells after 90 minutes of exposure to 37.5 pM IGF.
Author response image 3
Author response image 3.
Cell state dynamics governs cell state conditioned mutual information. A. In a simple stochastic model, receptor mRNA is produced at a constant rate from the DNA and the translated into ligand-free receptors. The number of ligand-bound receptors after a short exposure to ligands is considered the output. B. A schematic showing dynamics of receptor numbers when mRNA dynamics are slower compared to signaling time scales. C. Conditioning on receptor numbers leads to differing abilities in sensing the environment when the time scale of mRNA dynamics τ is slow. In contrast, when the mRNA dynamics are fast (large τ-1), conditioning on cell state variables does not lead to difference in sensing abilities.
Additional files
Download links
A two-part list of links to download the article, or parts of the article, in various formats.
Downloads (link to download the article as PDF)
Open citations (links to open the citations from this article in various online reference manager services)
Cite this article (links to download the citations from this article in formats compatible with various reference manager tools)
The ability to sense the environment is heterogeneously distributed in cell populations
eLife 12:RP87747.
https://doi.org/10.7554/eLife.87747.3


