Exploration of drug resistance mechanisms in triple negative breast cancer cells using a microfluidic device and patient tissues
- Department of Biomedical Engineering, Sungkyunkwan University, Republic of Korea
- Department of Molecular Cell Biology, Sungkyunkwan University School of Medicine, Republic of Korea
- School of Mechanical Engineering, Sungkyunkwan University, Republic of Korea
- Institute of Molecular Biotechnology of the Austrian Academy of Sciences (IMBA), Vienna Biocenter (VBC), Austria
- Department of Breast Cancer Center, Samsung Medical Center, Sungkyunkwan University School of Medicine, Republic of Korea
- Division of Breast Surgery, Department of Surgery, Samsung Medical Center, Sungkyunkwan University School of Medicine, Republic of Korea
- The Cancer Ecology Center at the James Buchanan Brady Urological Institute, Johns Hopkins School of Medicine, United States
- Department of Physics, Princeton University, United States
- Single Cell Network Research Center, Sungkyunkwan University School of Medicine, Republic of Korea
- Samsung Biomedical Research Institute, Samsung Medical Center, Sungkyunkwan University School of Medicine, Republic of Korea
- Institute of Quantum Biophysics (IQB), Sungkyunkwan University, Republic of Korea
Figures
Figure 1
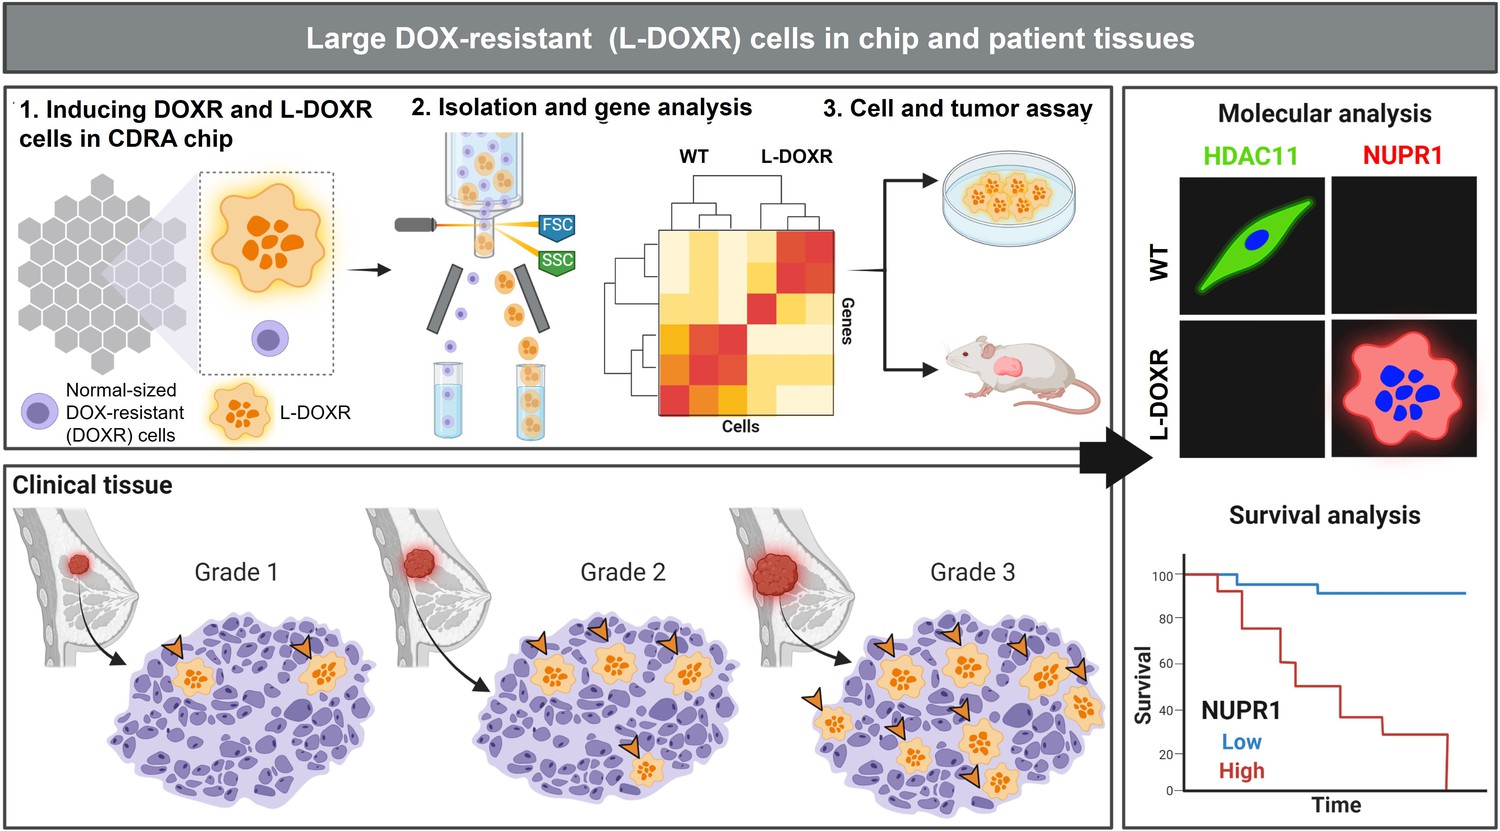
Experimental design and analysis workflow.
Triple negative breast cancer (TNBC) cells were subjected to doxorubicin (DOX) and nutrient gradients to induce DOX-resistant TNBC cells in a Cancer Drug Resistance Accelerator (CDRA) chip (Han et al., 2016). Large DOX-resistant (L-DOXR) cells were sorted by fluorescence-activated cell sorting (FACS) and their transcriptome was analyzed by RNA sequencing (RNA-seq). The oncogenic properties of L-DOXR cells were evaluated in vitro and in vivo to better understand their effect on cancer progression. Additionally, the proportion of L-DOXR cells in TNBC patient tissues was positively associated with TNBC tumor grade. The roles of histone deacetylase 11 (HDAC11) and nuclear protein 1 (NUPR1) in DOX-resistance were investigated through molecular analysis and survival analysis of patients with high/low NUPR1 expression.
Figure 2
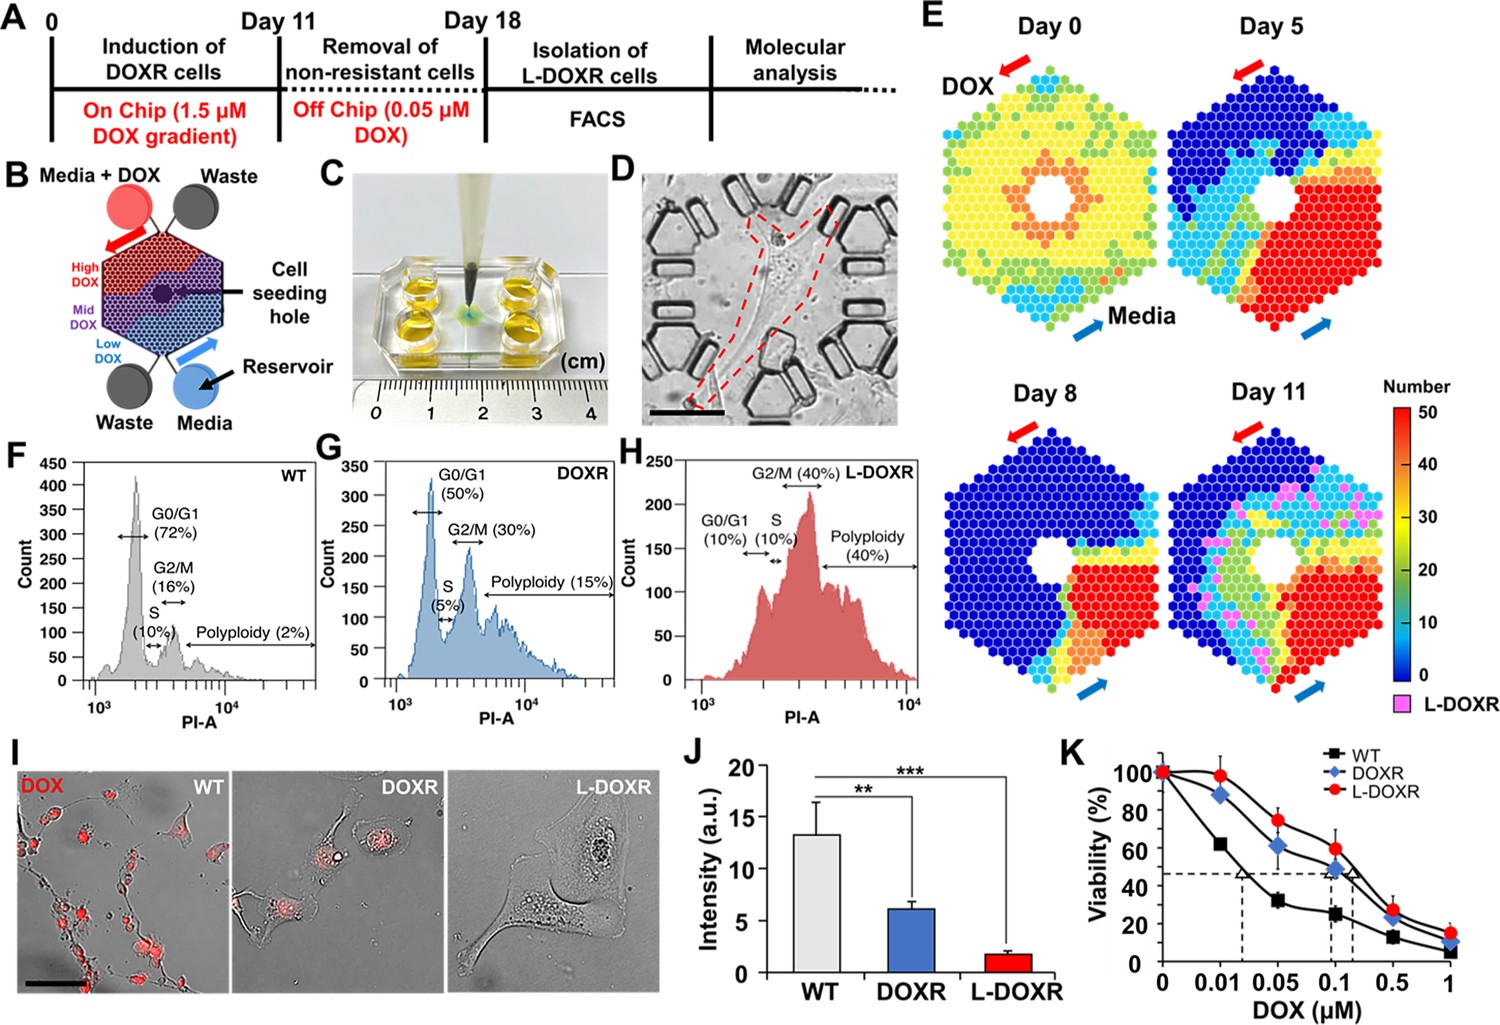
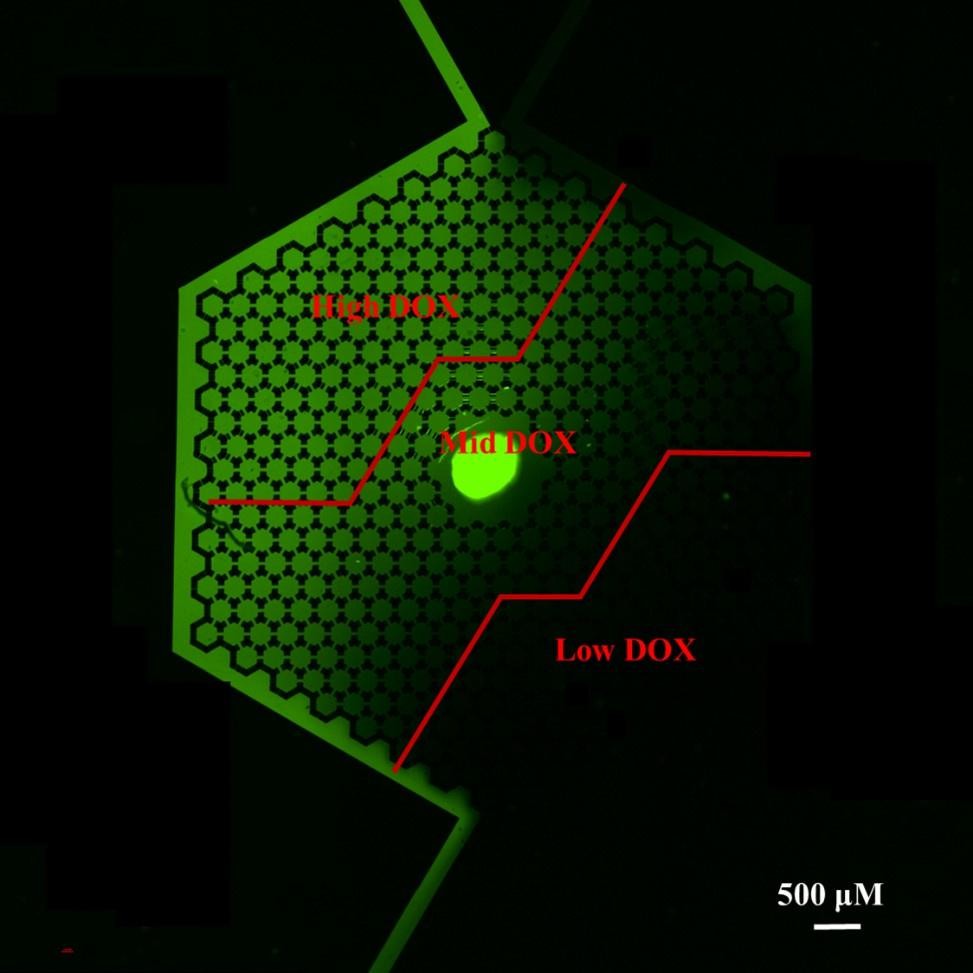
Tracking DOXR and L-DOXR cells induced by a DOX concentration-gradient in the CDRA chip and their cell cycle and drug resistance.
(A) Experimental design. (B) Schematic of the chip. (C) Image of the CDRA chip. (D) L-DOXR cells (red dotted line) induced in the CDRA chip. (E) Tracking the number of live cells in each chamber of the chip for 11 days. L-DOXR cells are observed in some of the pink chambers on day 11. FACS analysis was used to assess the cell cycle of (F) WT cells, (G) DOXR cells, and (H) L-DOXR cells. (I) Red fluorescent intensity of WT cells, DOXR cells, and L-DOXR cells. Scale bar = 100 μm. (J) DOX efflux ability of WT cells, DOXR cells, and L-DOXR cells. **p<0.01, ***p<0.001, two-tailed Student’s t-test. (K) DOX sensitivity of WT cells (The half-maximal inhibitory concentration (IC50)=25 nM), DOXR cells (IC50=100 nM), and L-DOXR cells (IC50=200 nM).
Figure 3 with 1 supplement
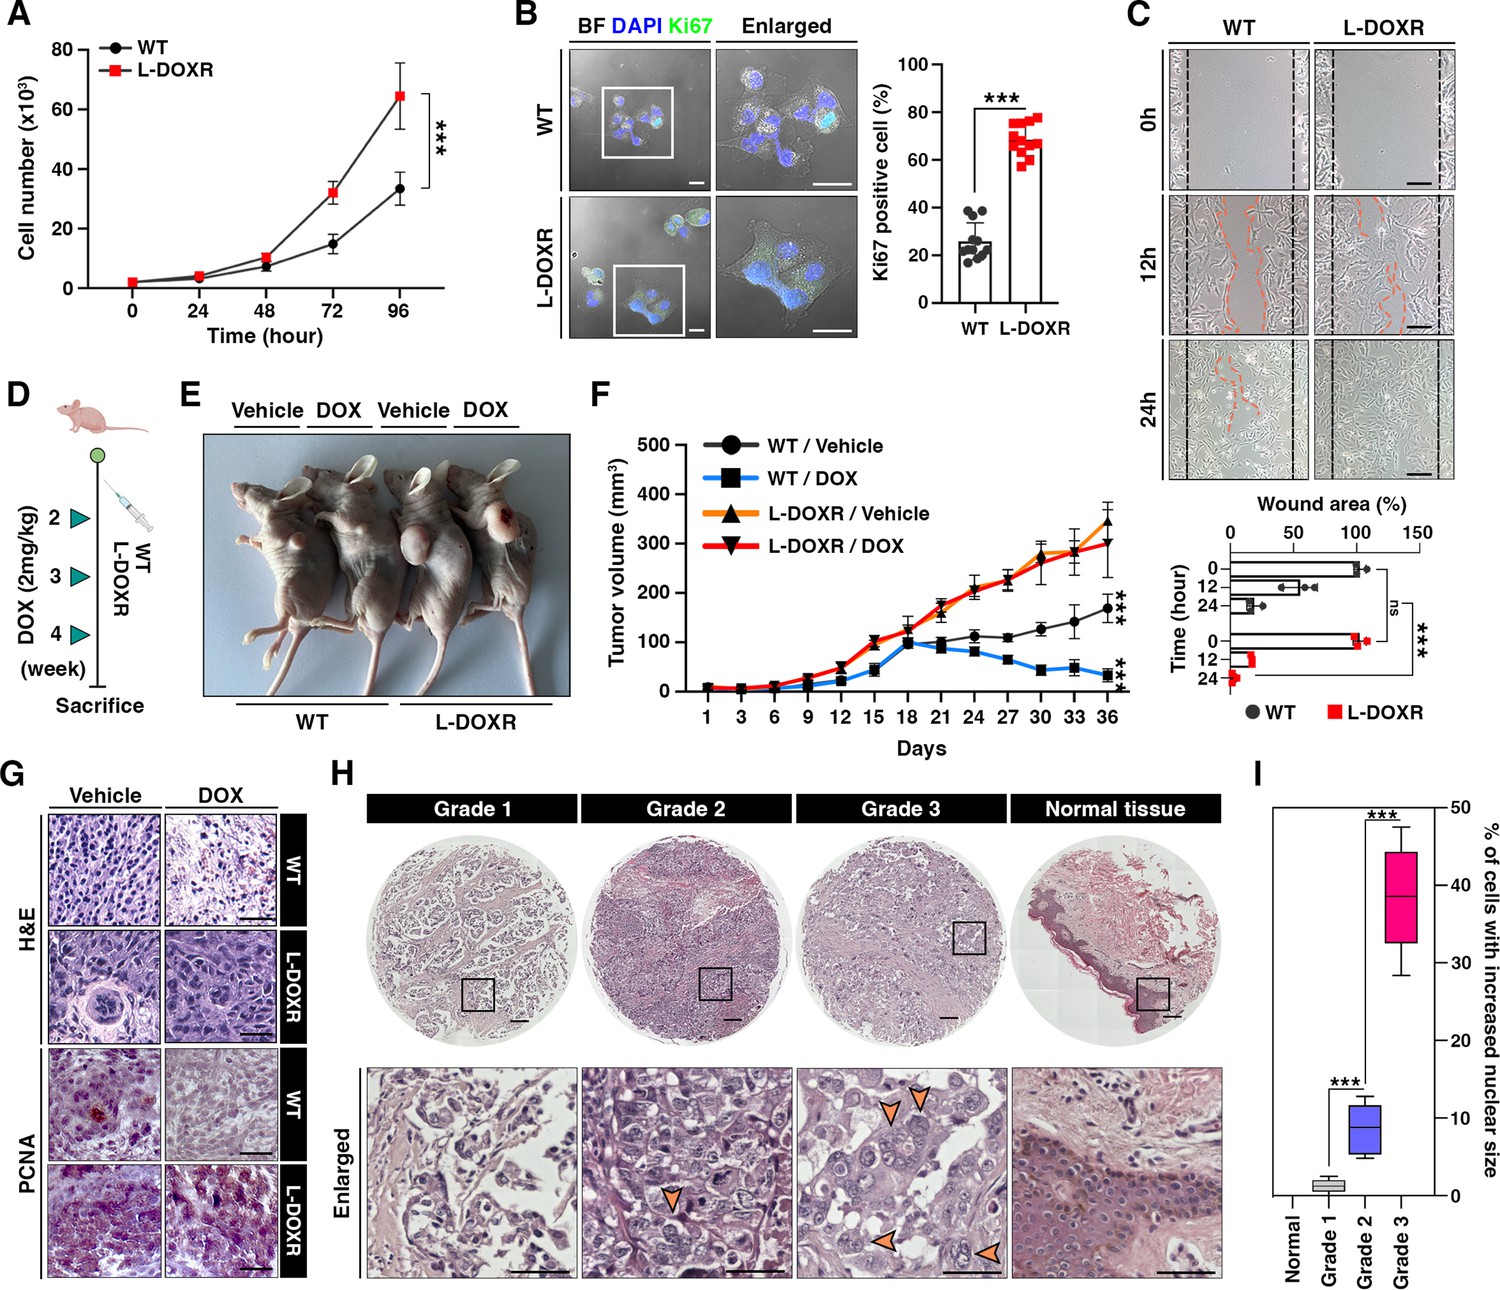
L-DOXR cells promote cancer growth and tumor progression in TNBC.
(A) Cell proliferation assay of WT and L-DOXR cells by cell counting. (B) Ki67 immunofluorescence staining and intensity measurement in eight randomly selected fields to evaluate proliferative ability. Scale bars: 20 μm. (C) Wound healing assay to measure cell migration. The gap between cells was measured and shown as a bar graph (bottom). Scale bars: 50 μm. (D, E) Timeline showing subcutaneous injection of 1×10⁷ WT cells and L-DOXR cells followed by DOX injection (2 mg/kg) once a week when tumor volume reached 150 mm3 (n=6 per group). A timeline demonstrating the subcutaneous injection of 1×10⁷ WT cells and L-DOXR cells, followed by injection of DOX (2 mg/kg) into the tail vein (n=6 per group) once a week when the tumor volume reached 150 mm3. Representative tumors shown in photographs. (F) Tumor size measured with calipers every three days for up to 36 days. (G) Representative images of hematoxylin and eosin (H&E) staining (upper) and immunohistochemical staining for PCNA on paraffin sections of tumor tissues (bottom). Scale bars: 50 μm. (H, I) H&E staining of a TNBC tissue microarray with different tumor grades (grades 1, 2, 3, and negative) to detect L-DOXR cells. The number of L-DOXR cells was counted and analyzed from five randomly selected fields on each slide. The black boxes are magnified, and the orange arrows indicate L-DOXR cells. Scale bars: 500 μm. Data presented as mean ± SEM; ***p<0.001; Student’s two-tailed, unpaired t-test (A, B); one-way ANOVA with Bonferroni’s post-test (C, F, I).
Figure 3—figure supplement 1
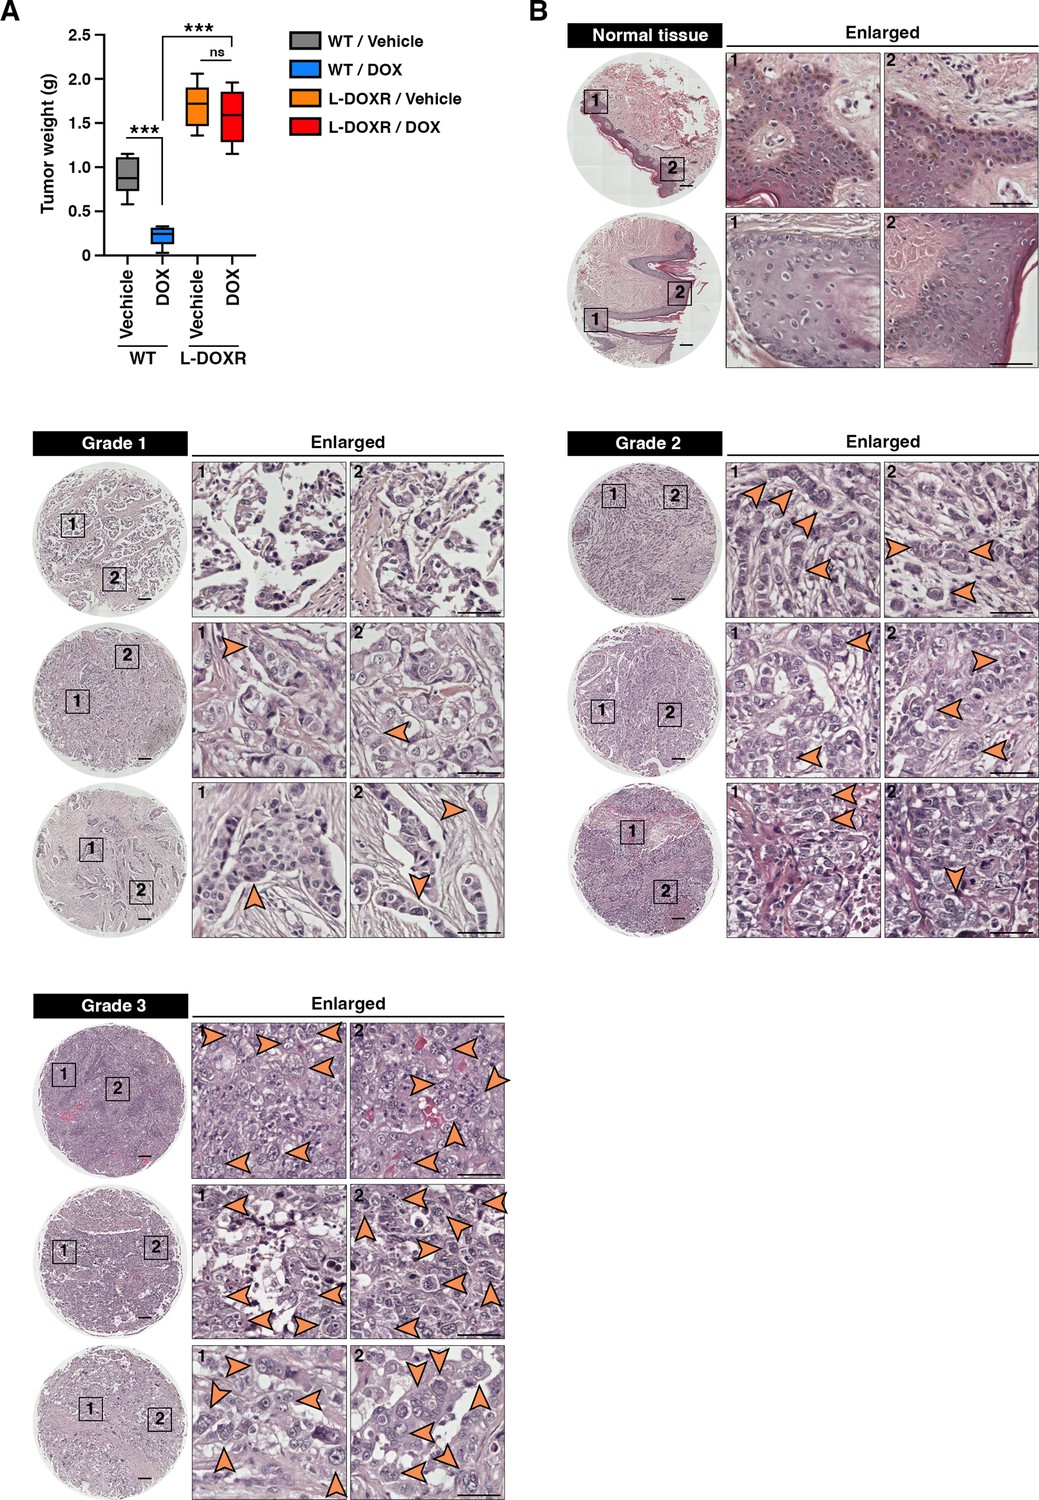
L-DOXR accelerated cancerous growth and tumor progression in TNBC.
(A) Wet weights of WT and L-DOXR tumors treated with DOX or vehicle (n = 6 per group). (B) Representative images showed triple-negative breast cancer tissue microarray (TMA, US Biomax #BR1301) with different tumor grades (grade 1, 2, 3, and negative) after stained with H&E (Hematoxylin and eosin) for the detection of L-DOXR. Black boxes are magnified. Orange arrows indicate L-DOXR cells. Scale bars: 500 μm. All data are presented as means ± SEM; ***p<0.001; one-way ANOVA with Bonferroni’s post-test (A).
Figure 4 with 1 supplement
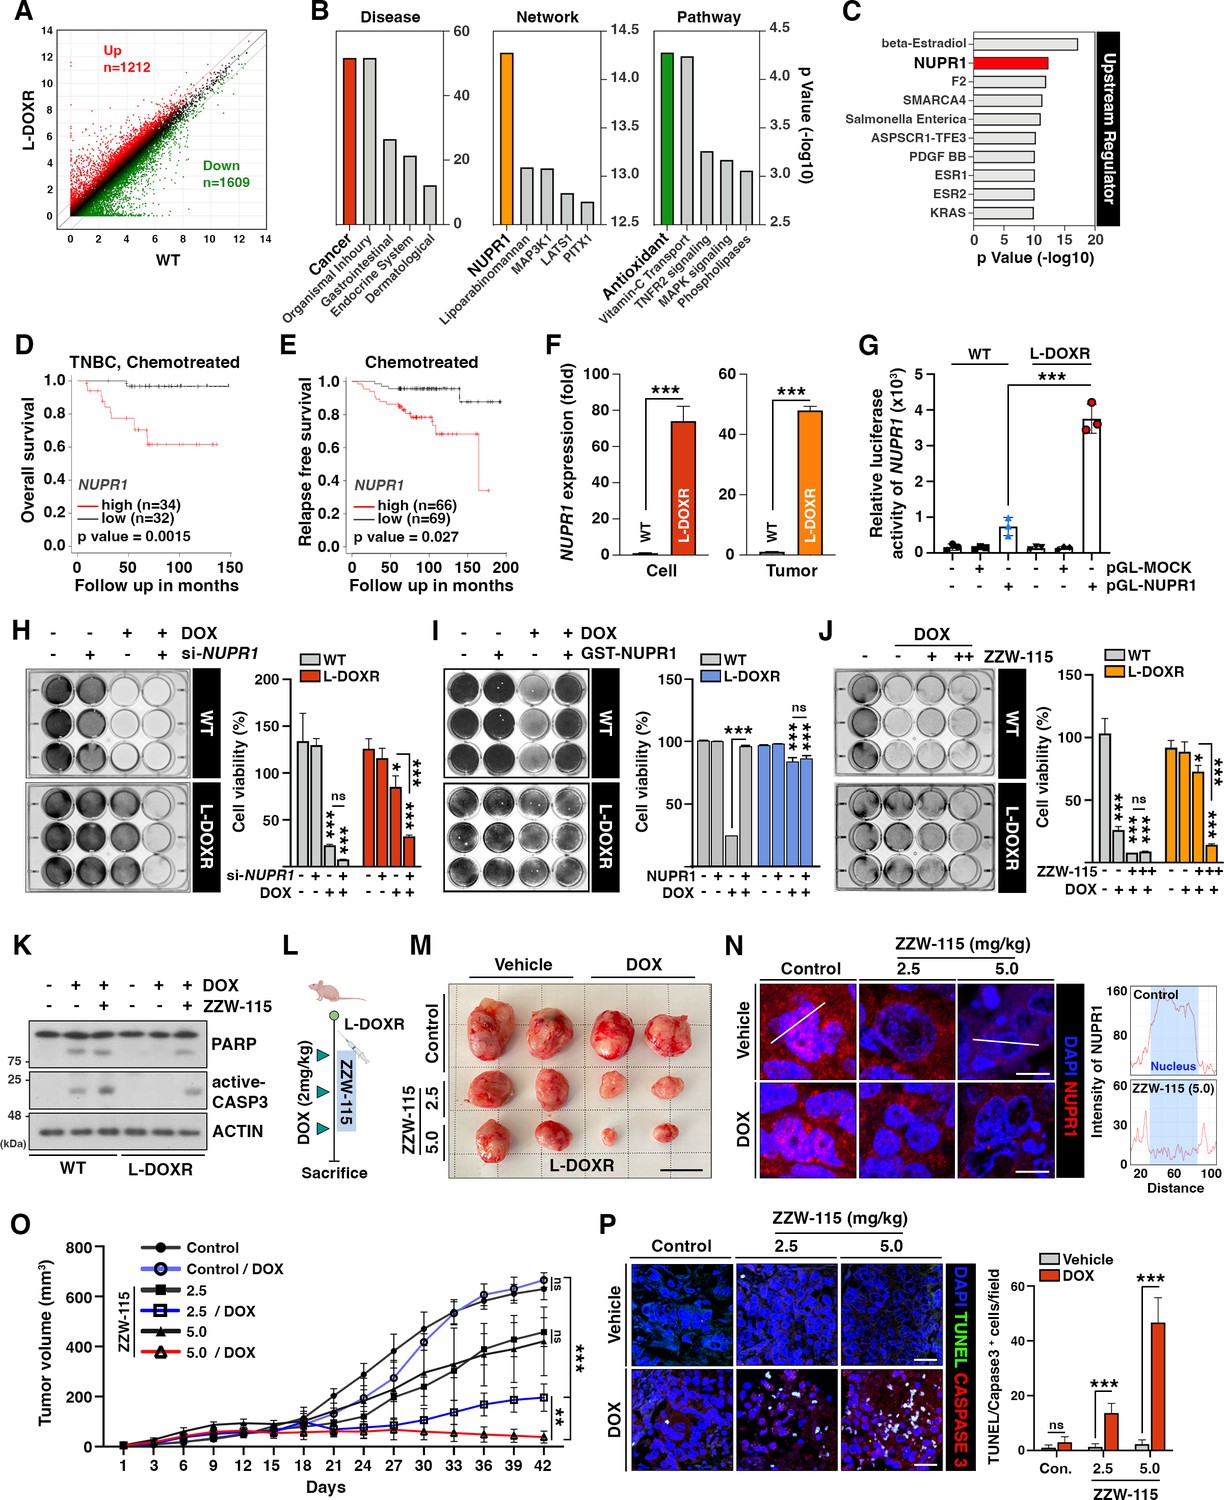
NUPR1 is a key mediator of chemoresistance in L-DOXR cells.
(A) Volcano plot of differential gene expression between WT and L-DOXR cells. Cut-off criteria included a fold change of 2. (B, C) Ingenuity Pathway Analysis (IPA) of the RNA-sequencing data shows disease and disorders (left), causal network (middle), canonical pathways (Yue et al., 2020), and upstream regulator (C). The top five ranks are presented. Cut-off criteria are p<0.05 and a false discovery rate (FDR) q-value <0.05. (D) Kaplan-Meier (Dai et al., 2013) survival curve represents the overall survival rate in chemotherapy-treated TNBC patients (n=66) based on low vs. high NUPR1 expression from the meta-analysis in KM plotter. (E) KM survival curve representing the relapse-free survival rate in chemotherapy-treated patients (n=135) based on low vs. high NUPR1 expression from GSE12093. (F) Reverse transcriptase-quantitative polymerase chain reaction (RT-qPCR) analysis of NUPR1 mRNA expression in cells (left) and tumor tissue from a mouse xenograft (Yue et al., 2020). The values were normalized to the level of the control (Jazaeri et al., 2005). (G) The relative luciferase activity of the NUPR1 promoter was measured in WT cells and L-DOXR cells. (H) Cell viability was measured among si-NUPR1 transfected cells treated with DOX using a crystal violet staining assay. (I) Cell viability was measured using GST-NUPR1 transfected cells with DOX. (J) Cell viability was measured after administering DOX with and without ZZW-115 (NUPR1 inhibitor). The bar graph indicates the average density of dyed crystal violet. (K) Apoptotic proteins were detected by immunoblotting from WT cells and L-DOXR cells with and without DOX/ZZW-115. (L) Timeline demonstrating the subcutaneous injection of 1×10⁷ L-DOXR cells followed by injections of doxorubicin (4 mg/kg) or ZZW-115 (2.5 mg/kg, 5.0 mg/kg) into the tail vein (n=6 per group). (M) The photographs show representative tumors. Scale bar: 2 cm. (N) Representative images showing immunohistochemical staining for NUPR1 in PCGGs with and without ZZW-115 and DOX treatment (left). Localization of NUPR1 in the control and ZZW-115 (5.0 mg/kg)-injected tumors was analyzed by ImageJ (Yue et al., 2020). Scale bars: 20 μm. (O) Animals were monitored for up to 42 days, and tumor size was measured using calipers at three-day intervals. (P) Representative images showing immunohistochemical staining for TUNEL and active-caspase 3 on paraffin sections of tumor tissues. Scale bars: 20 μm. All data are presented as mean ± SEM; *p<0.05, **p<0.01, ***p<0.001; Student’s two-tailed, unpaired t-test (F); one-way ANOVA with Bonferroni’s post-test (G, H, I, J, O).
-
Figure 4—source data 1
Original image for the western blot analysis in Figure 4K.
- https://cdn.elifesciences.org/articles/88830/elife-88830-fig4-data1-v1.zip
Figure 4—figure supplement 1
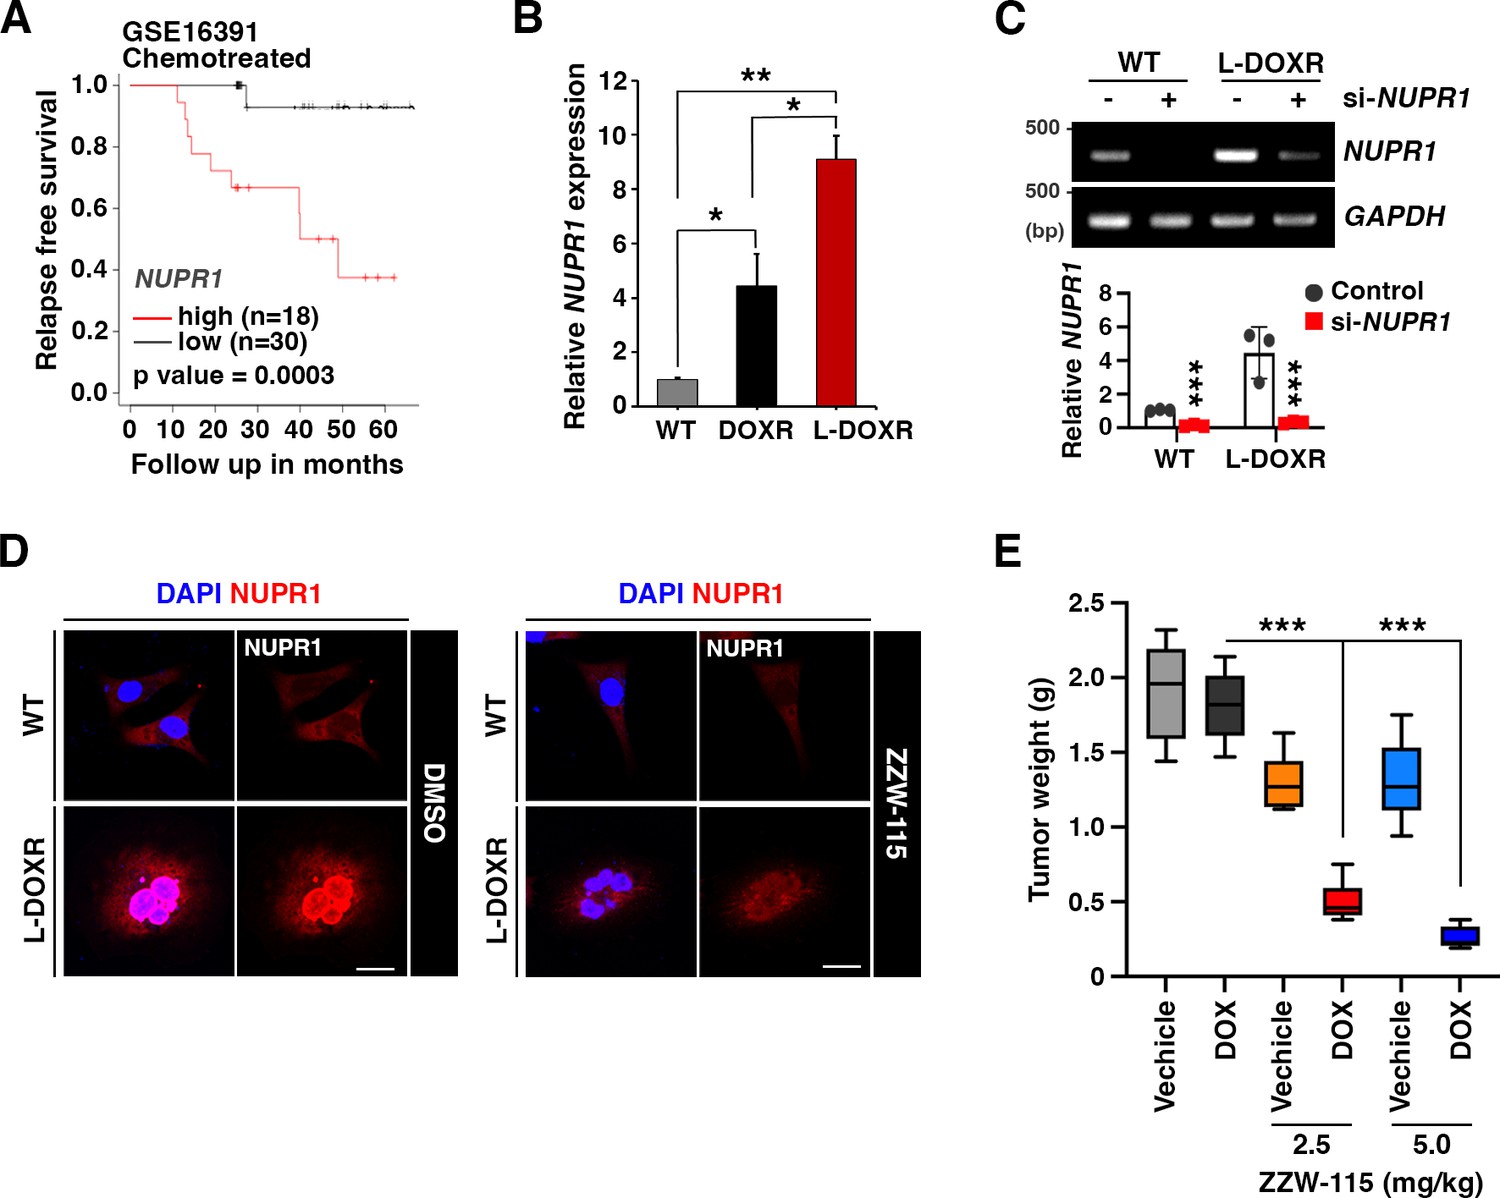
NUPR1 is a key mediator of chemoresistance in L-DOXR.
(A) Comparison of overall survival between high (red line) or low (blue line) expressions of NUPR1 in patients after chemo treated (GSE16391) were analyzed by the Kaplan-Meier and Log-rank test. KM survival curve representing the relapse-free survival rate in chemotherapy-treated patients (n=48) based on low (n=30) vs. high (n=18) NUPR1 expression. (B) The RNA expressions of NUPR1 were measured. (C) si-NUPR1 was transfected into WT and L-DOXR and incubated for 24 hr. The RNA expressions of NUPR1 were measured by RT-PCR. (D) WT and L-DOXR were stained with anti-NUPR1 (red) after treated ZZW-115. (E) Tumor weights were measured after they were harvested from the mice. Scale bars: 20 μm. All data are presented as means ± SEM; *p<0.05, **p<0.01, ***p<0.001; Student’s two-tailed, unpaired t-test (B, C); one-way ANOVA with Bonferroni’s post-test (E).
-
Figure 4—figure supplement 1—source data 1
Original image of the RNA expression in Figure 4—figure supplement 1C.
- https://cdn.elifesciences.org/articles/88830/elife-88830-fig4-figsupp1-data1-v1.zip
Figure 5 with 1 supplement
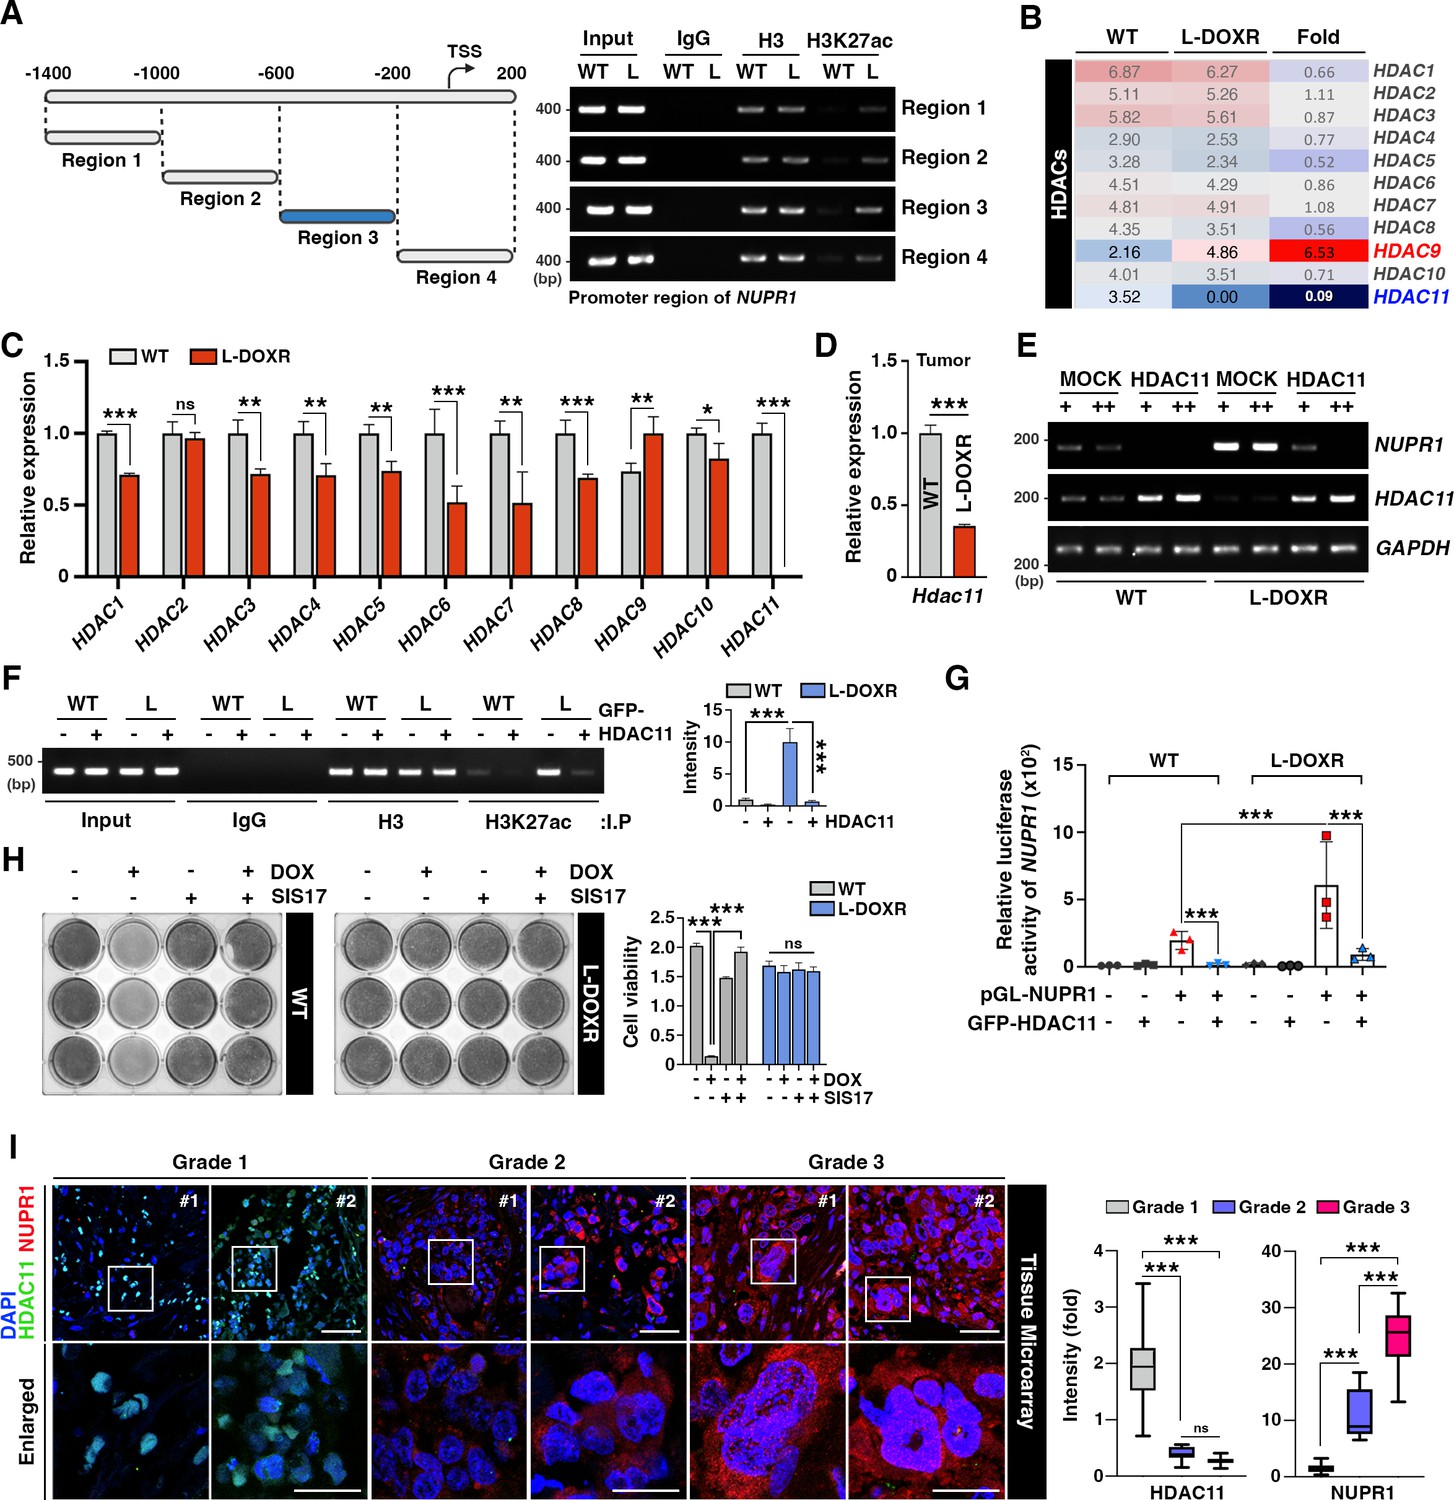
HDAC11 suppression leads to NUPR1 upregulation in L-DOXR cells.
(A) Schematic diagram showing the promoter region of NUPR1. A ChIP assay was performed with qPCR on WT cells and L-DOXR cells using anti-H3 and H3K27ac antibodies. L, L-DOXR cells. (B) A heat map representing the relative mRNA expression levels of HDACs in WT cells and L-DOXR cells. (C) Real-time PCR analysis of the mRNA expression of the indicated genes in WT cells and L-DOXR cells. (D) The mRNA expression of HDAC11 in L-DOXR cells-derived tumor tissue was measured by RT-qPCR. (E) The mRNA expression of NUPR1 and HDAC11 was measured in cells transfected with either GFP-MOCK or HDAC11. (F) A ChIP assay was performed after transfecting WT and L-DOXR cells with GFP-MOCK or HDAC11 using anti-H3 or H3K27ac antibodies. Acetylated-histone levels were determined by RT-qPCR with specific primers (−600/–200). L, L-DOXR cells. (G) The relative luciferase activity of the NUPR1 promoter was measured after transfecting WT cells and L-DOXR cells with GFP-HDAC11. (H) Cell viability was measured among SIS17-treated cells with DOX using a crystal violet staining assay. (I) Representative images show the expression of NUPR1 (Gao et al., 2002) and HDAC11 (Liedtke et al., 2008) on a TNBC TMA with different tumor grades (grades 1, 2, and 3). Quantitative analysis of the intensity of NUPR1 and HDAC11 is displayed (Yue et al., 2020). White boxes are magnified. Scale bars: 50 μm (upper) and 25 μm (bottom). All data are presented as means ± SEM; *p<0.05, **p<0.01, ***p<0.001; Student’s two-tailed, unpaired t-testing (C, D); one-way ANOVA with Bonferroni’s post-test (G, I).
-
Figure 5—source data 1
Original image for the promoter region in Figure 5A.
- https://cdn.elifesciences.org/articles/88830/elife-88830-fig5-data1-v1.zip
-
Figure 5—source data 2
Original image for the RNA expression in Figure 5E.
- https://cdn.elifesciences.org/articles/88830/elife-88830-fig5-data2-v1.zip
-
Figure 5—source data 3
Original image for the RNA expression in Figure 5F.
- https://cdn.elifesciences.org/articles/88830/elife-88830-fig5-data3-v1.zip
Figure 5—figure supplement 1
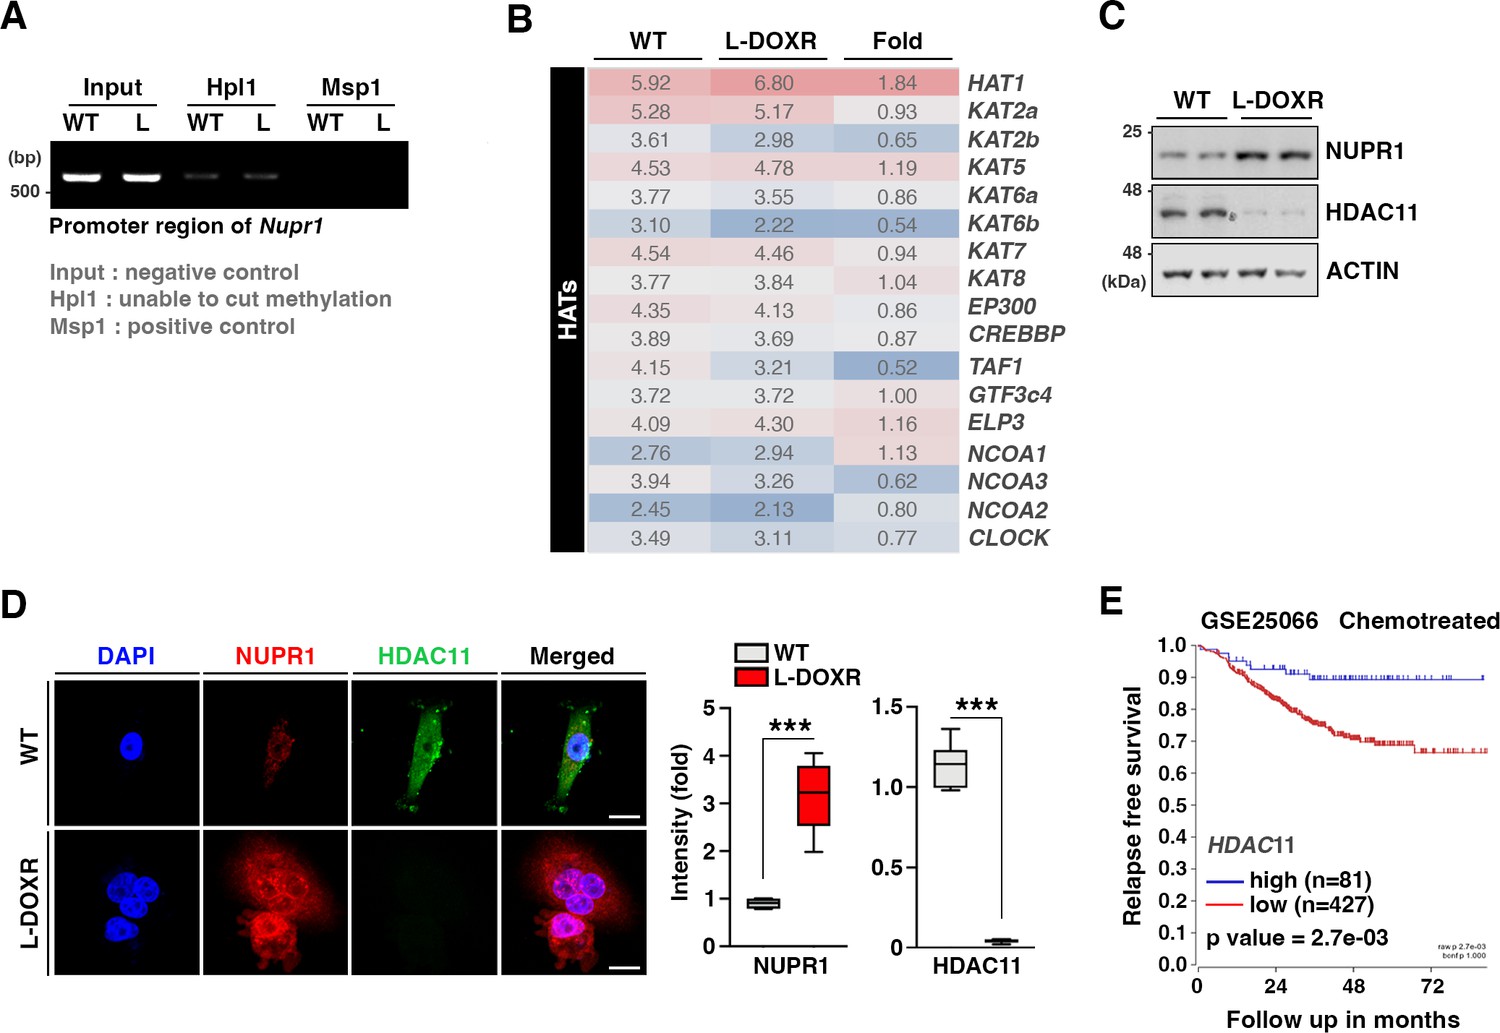
HDAC11 suppression leads to NUPR1 upregulation in L-DOXR.
(A) Extracted gDNA from WT and L-DOXR were digested with restriction enzymes that cut only non-methylated CCGG or cut all CCGG sequences. gDNA was assessed for methylation levels using RT-PCR with specific primer sets for CpG islands of NUPR1. L, L-DOXR. (B) Heatmap representing the relative mRNA expression levels of HDACs in WT or L-DOXR. (C) Protein expressions of NUPR1 and HDAC11 were measured from WT and L-DOXR by immunoblotting. (D) Cells were stained with anti-NUPR1 (red) and HDAC11 (green) antibodies for measuring their negative correlation. The intensity of NUPR1 and HDAC11 was measured by ImageJ. Scale bars: 20 μm. (E) Comparison of overall survival between high (n=81) or low (n=427) expressions of HDAC11 in patients after chemo treated (GSE25066, n=508) were analyzed by the Kaplan-Meier and Log-rank test. All data are presented as means ± SEM; ***p<0.001; Student’s two-tailed, unpaired t-test (D).
-
Figure 5—figure supplement 1—source data 1
Original image of the RNA expression in Figure 5—figure supplement 1A.
- https://cdn.elifesciences.org/articles/88830/elife-88830-fig5-figsupp1-data1-v1.zip
-
Figure 5—figure supplement 1—source data 2
Original image of the western blot in Figure 5—figure supplement 1C.
- https://cdn.elifesciences.org/articles/88830/elife-88830-fig5-figsupp1-data2-v1.zip
Author response image 1
Additional files
-
MDAR checklist
- https://cdn.elifesciences.org/articles/88830/elife-88830-mdarchecklist1-v1.docx
-
Supplementary file 1
List of primer sequences for RT-qPCR and ChIP assay.
- https://cdn.elifesciences.org/articles/88830/elife-88830-supp1-v1.docx
Download links
A two-part list of links to download the article, or parts of the article, in various formats.
Downloads (link to download the article as PDF)
Open citations (links to open the citations from this article in various online reference manager services)
Cite this article (links to download the citations from this article in formats compatible with various reference manager tools)
Exploration of drug resistance mechanisms in triple negative breast cancer cells using a microfluidic device and patient tissues
eLife 12:RP88830.
https://doi.org/10.7554/eLife.88830.3


