Detection of new pioneer transcription factors as cell-type-specific nucleosome binders
- Institute of Biophysics and Department of Physics, Central China Normal University, China
- National Library of Medicine, National Institutes of Health, United States
- School of Life Sciences, University of Essex, Wivenhoe Park, United Kingdom
- Department of Pathology and Molecular Medicine, Queen’s University, Canada
- Department of Biology and Molecular Sciences, Queen’s University, Canada
- School of Computing, Queen’s University, Canada
- Ontario Institute of Cancer Research, Canada
Figures
Figure 1 with 2 supplements
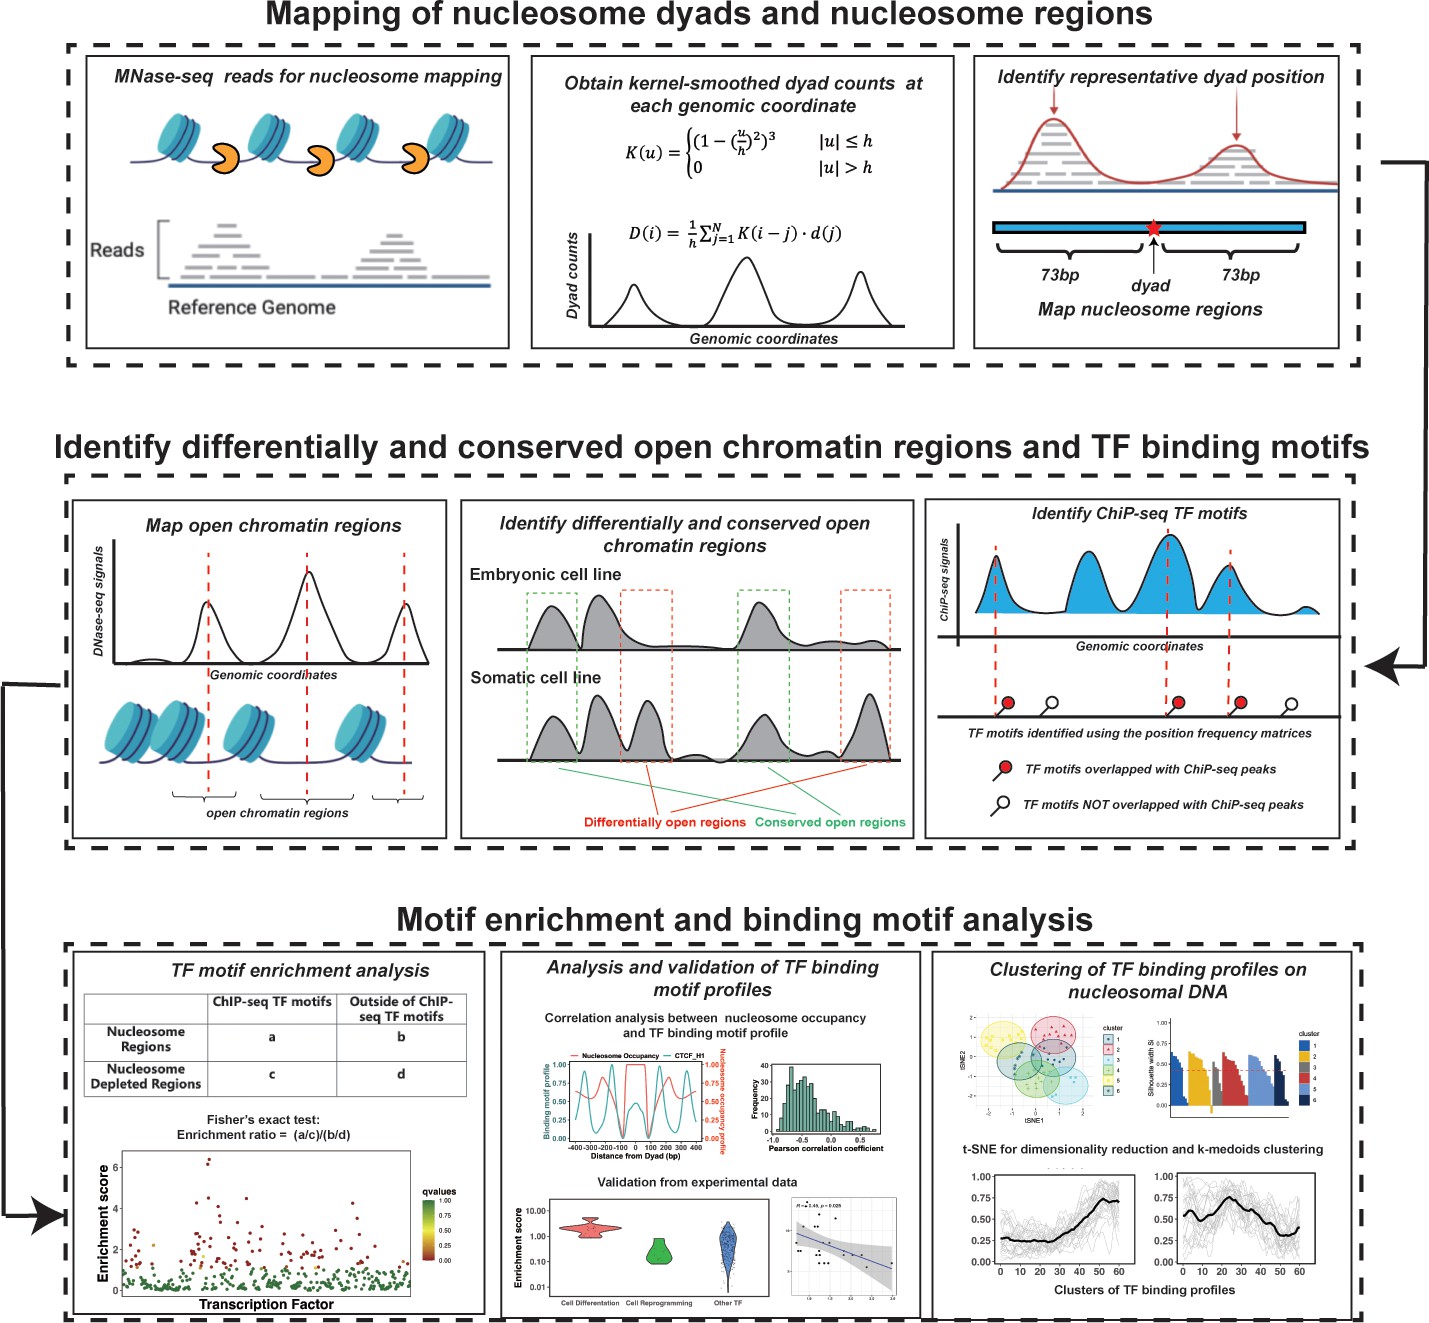
The computational framework to analyze the ability of transcription factors to bind to nucleosomes by integrating ChIP-seq, MNase-seq, and DNase-seq data for motif enrichment and binding motif analysis.
Figure 1—figure supplement 1
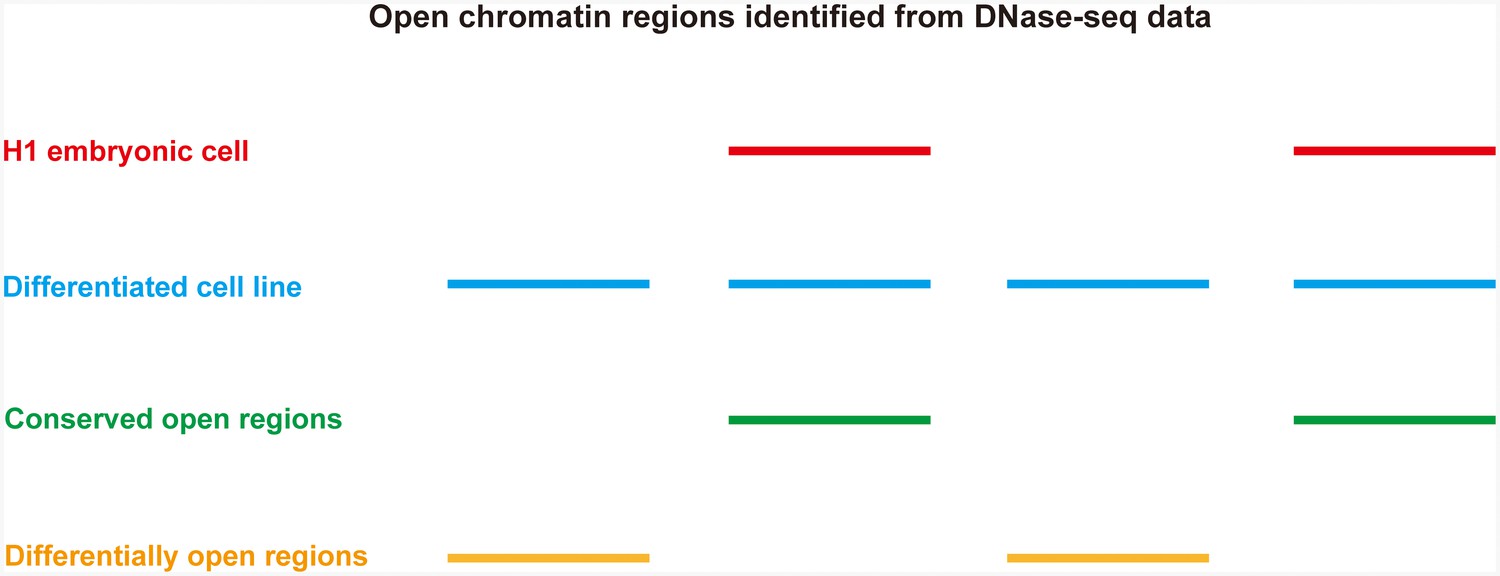
Identification of differentially open and conserved open chromatin regions between H1 embryonic cell line and any other differentiated cell lines.
Open chromatin regions are shown as lines.
Figure 1—figure supplement 2
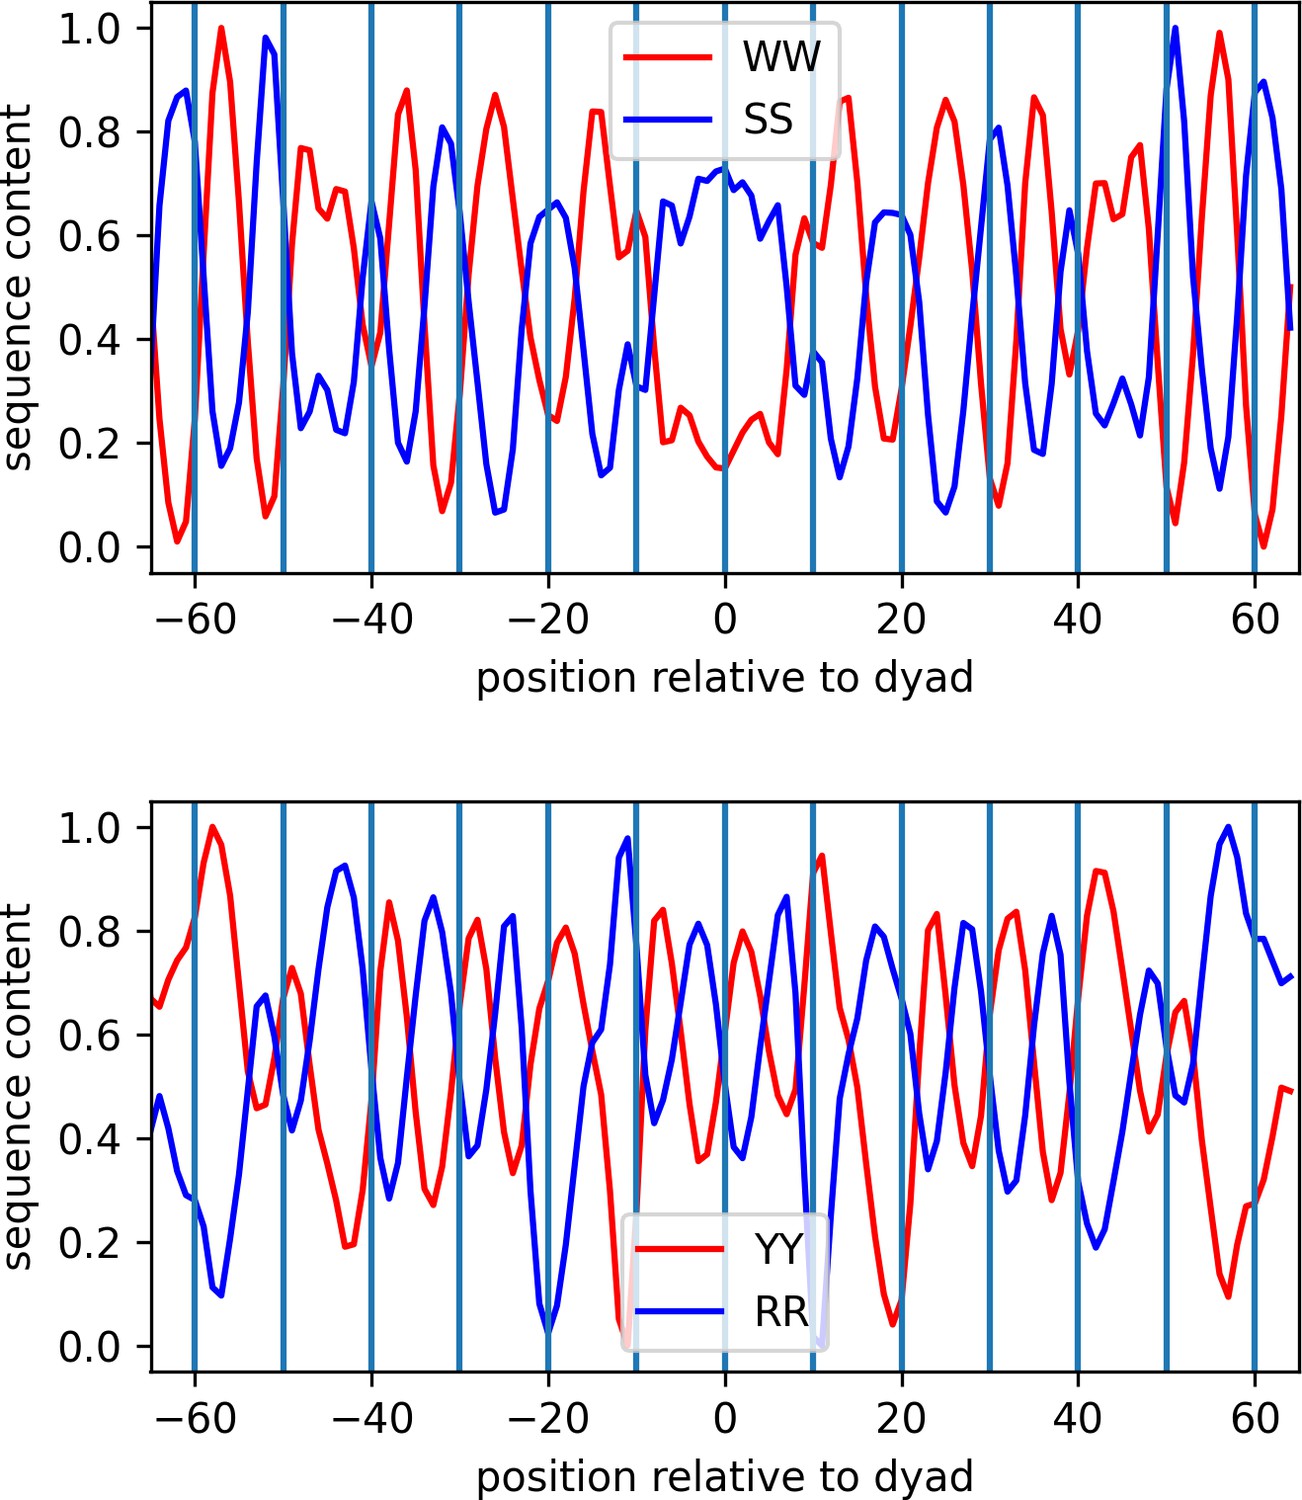
Identification of dinucleotide patterns of nucleosomal DNA (MCF7 cell line is shown as a representative case).
-
Figure 1—figure supplement 2—source data 1
Source data for dinucleotide patterns of nucleosomal DNA.
- https://cdn.elifesciences.org/articles/88936/elife-88936-fig1-figsupp2-data1-v1.xlsx
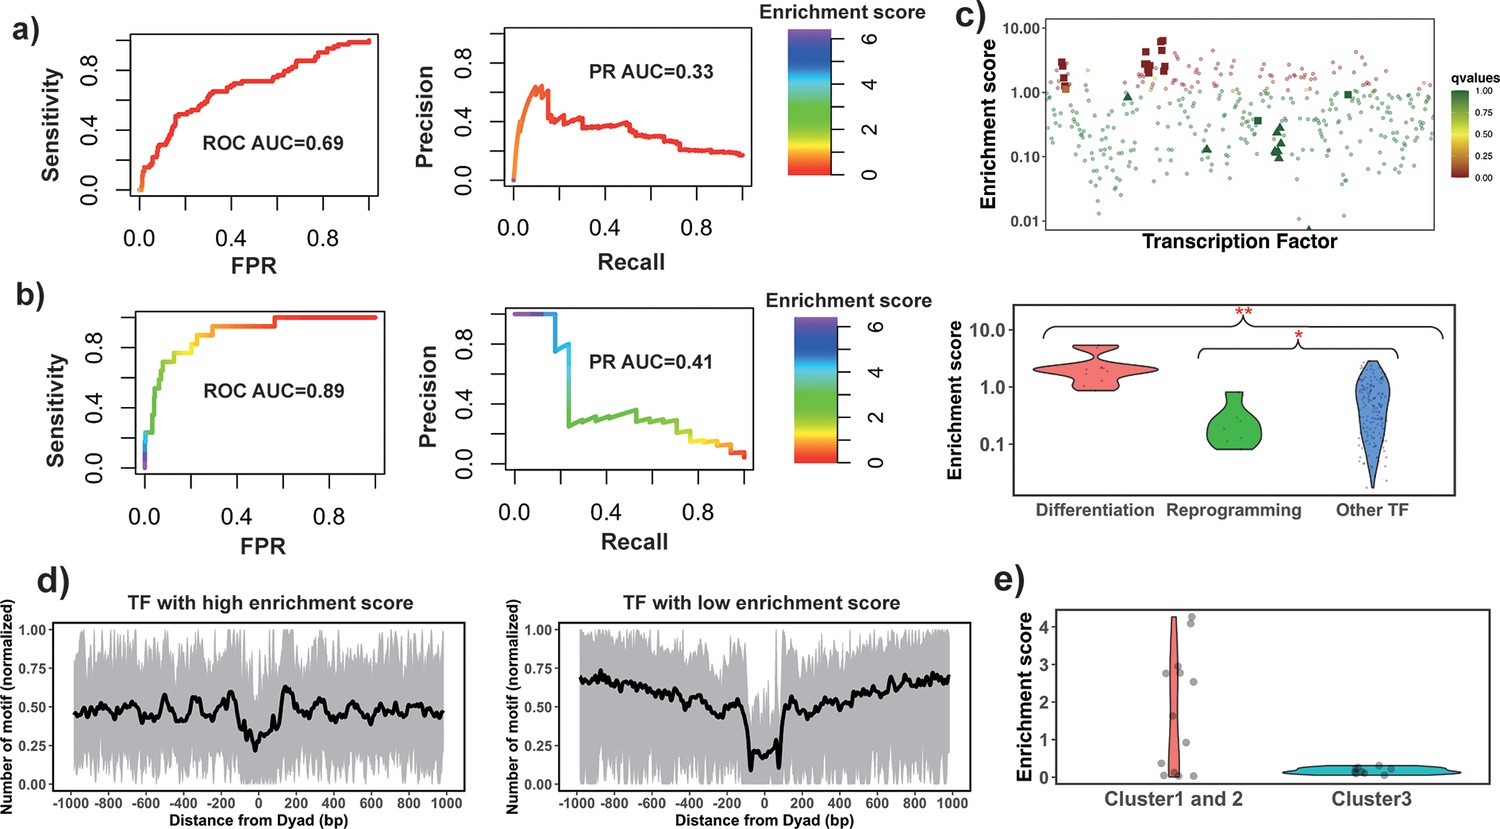
Figure 2 with 5 supplements
Identify pioneer transcription factors (PTFs) using motif enrichment analysis.
(a) Transcription factor (TF) motif enrichment score is used to distinguish 32 known PTFs (Test set 1) from other TFs. Receiver operating curve (ROC) and precision-recall (PR) curve analysis of motif enrichment scores are performed. Here, nucleosome regions (NRs) were determined as genomic regions (147bp long) centered at the representative dyad positions and the nucleosome-depleted regions (NDRs) represent genomic regions free of nucleosomes and are located in open chromatin regions. The random retrieval classifier would predict with AUC = 0.5and PR = the fraction of true positives = 0.17. (b) TF motif enrichment score is used to distinguish 11 known PTFs with essential roles in cell differentiation (Test set 2) from other TFs. Here, NRs in differentially open and NDRs in conserved open chromatin regions are used in enrichment analysis. The random retrieval classifier would predict with AUC = 0.5and PR = 0.04. (c) Classification of PTFs by binding motif enrichment scores. Known PTFs from Test set 2 and Test set 3 are indicated by squares and triangles, while other TFs are shown as circles. Colors corresponds to false discovery rate (FDR) q-values. Mann-Whitney U tests are performed under the null hypothesis that PTF’s mean values of enrichment scores are equal to canonical TFs. * – p-value <0.05; ** – p-value <0.005. (d) Binding motif profile of TFs with the highest and lowest motif enrichment scores (ranked at the top or bottom 10% among all TFs). The number of motifs for each TF is normalized within the range between 0 and 1 as follows: X(i)normalized = (X(i) – Xmin)/(Xmax – Xmin), X(i) is the number of sequences which have TF binding sites at the ith base pair from the nucleosomal dyad position; Xmax and Xmin represent the maximal and minimal counts of sequence fragments respectively. (e) Comparison of the enrichment score of TFs in different clusters identified from recent electromobility shift assay (EMSA) experiments (Fernandez Garcia et al., 2019). Only 13 TFs could be found in EMSA and our dataset. Clusters 1 and 2 include strong binders to both naked DNA and nucleosomal DNA and weak binders to both naked DNA and nucleosomal DNA (only one TF). Cluster 3: strong binders to naked DNA but weak binders to nucleosomal DNA.
-
Figure 2—source data 1
Source data for all TF enrichment scores calculated from motif enrichment analysis.
- https://cdn.elifesciences.org/articles/88936/elife-88936-fig2-data1-v1.xlsx
Figure 2—figure supplement 1
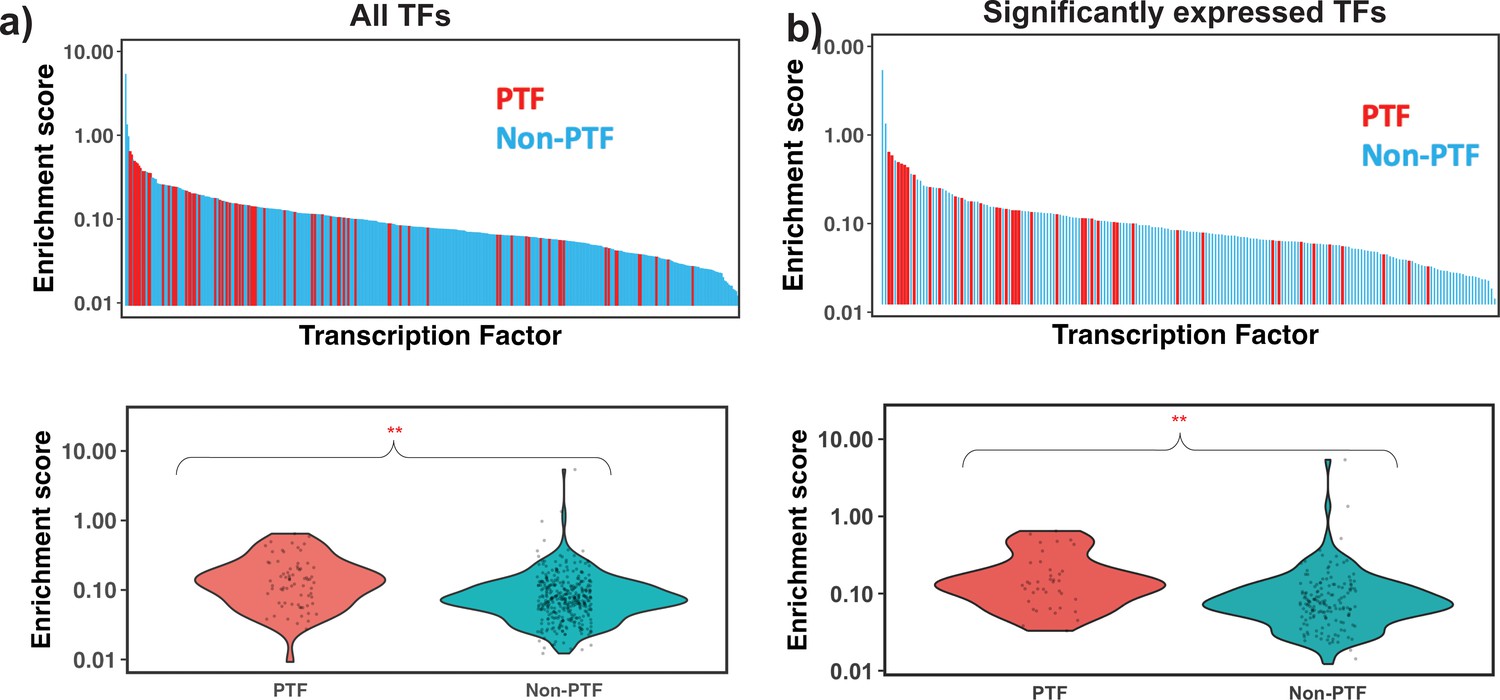
Motif enrichment analysis of different transcription factors (TFs) using nucleosome-depleted regions (NDRs) located in open chromatin regions and all identified nucleosome regions (NRs).
32 Known pioneer transcription factors (PTFs) from Supplementary file 1—table 5 and non-PTFs are shown with red and light blue colors. Mann-Whitney U test is performed under the null hypothesis that the mean of enrichment scores of PTFs is equal to other TFs. (a) and (b) show the ranking of all TFs and significantly expressed TFs by their enrichment score. ** – p-value <0.001.
-
Figure 2—figure supplement 1—source data 1
Source data for the enrichment scores of TFs.
- https://cdn.elifesciences.org/articles/88936/elife-88936-fig2-figsupp1-data1-v1.xlsx
Figure 2—figure supplement 2
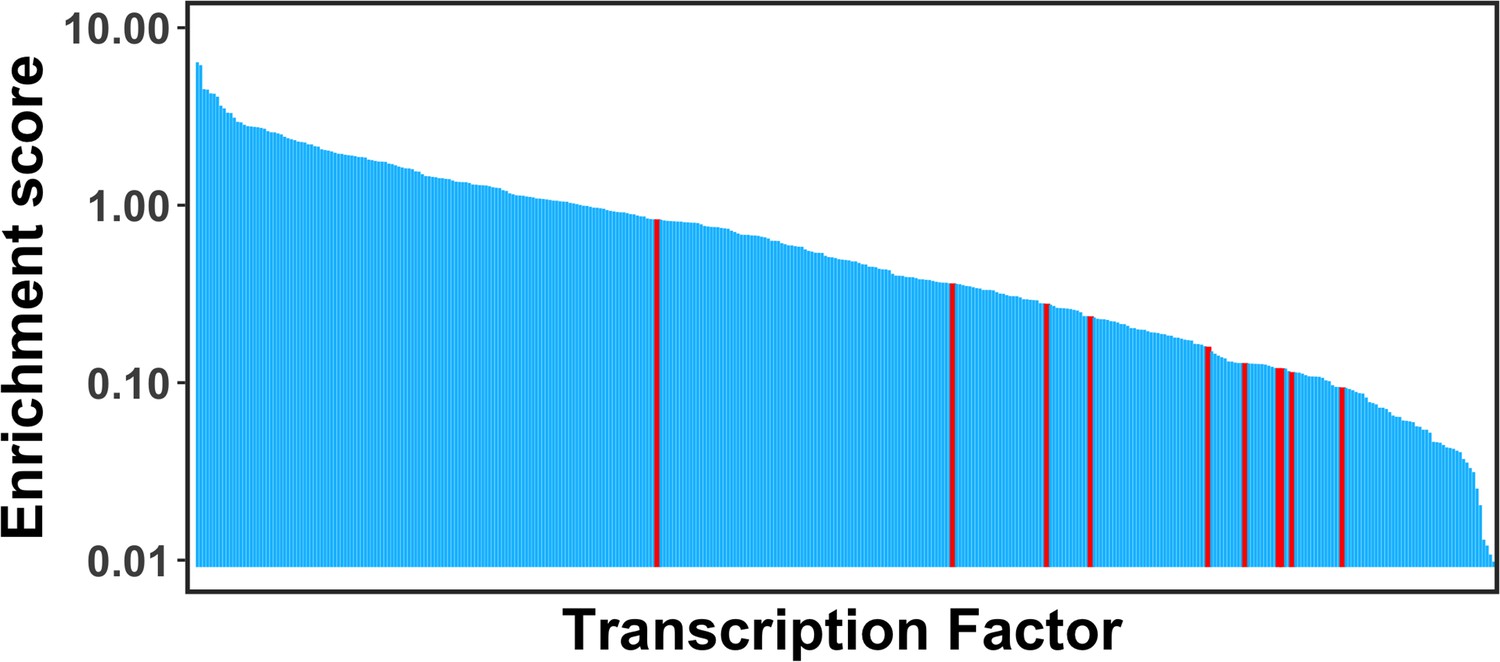
Comparison of the enrichment scores of pioneer factors for the maintenance of embryonic stem cell or reprogramming of somatic cells into induced pluripotent stem cells (Test set 3, highlighted as red) with other transcription factors (TFs).
Pioneer factors in Test set 3 were strongly depleted at nucleosomes and showed significantly lower enrichment scores compared with other TFs.
Figure 2—figure supplement 3
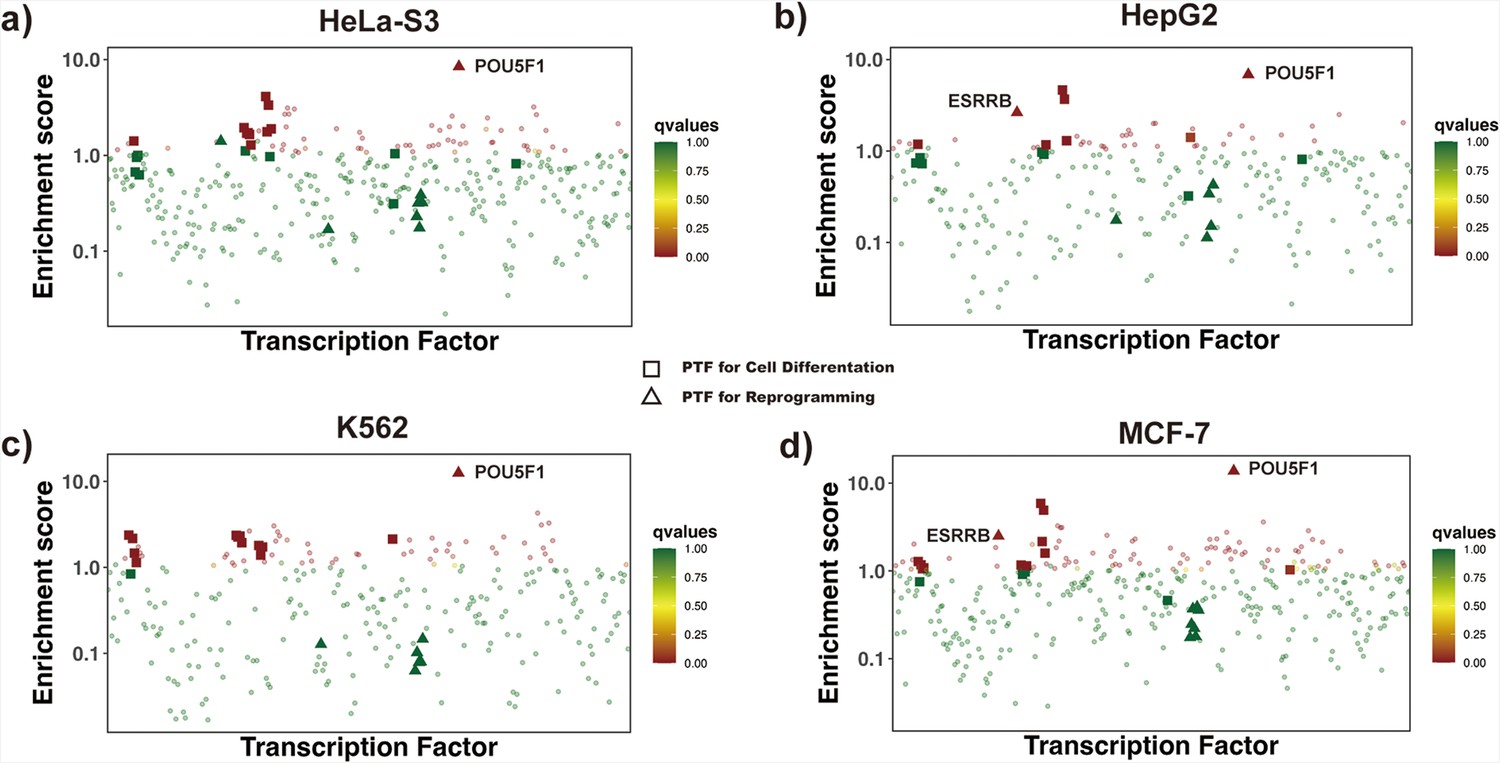
Enrichment analysis of transcription factors (TFs) by redefining differentially open regions as those closed in differentiated cell lines and open in H1 embryonic cell line.
Differentially open regions are closed in (a) HeLa-S3 , (b) HepG2, (c) K562 and (d) MCF-7 cell lines and open in H1 embryonic cell line. Known pioneer factors with essential roles in cell differentiation (Test set 2) and pioneer factors critical for the maintenance of embryonic stem cell or reprogramming of somatic cells into induced pluripotent stem cells (Test set 3) are indicated by squares and triangles, while other TFs are shown as circles. Colors correspond to false discovery rate (FDR) q-values. ESSRB and Yamanaka pioneer factor POU5F1 (OCT4) from Test set 3 showed significantly higher enrichment scores.
-
Figure 2—figure supplement 3—source data 1
Source data of TF enrichment scores calculated from the enrichment analysis by redefining differentially open regions as those closed in differentiated cell lines and open in H1 embryonic cell line.
- https://cdn.elifesciences.org/articles/88936/elife-88936-fig2-figsupp3-data1-v1.xlsx
Figure 2—figure supplement 4
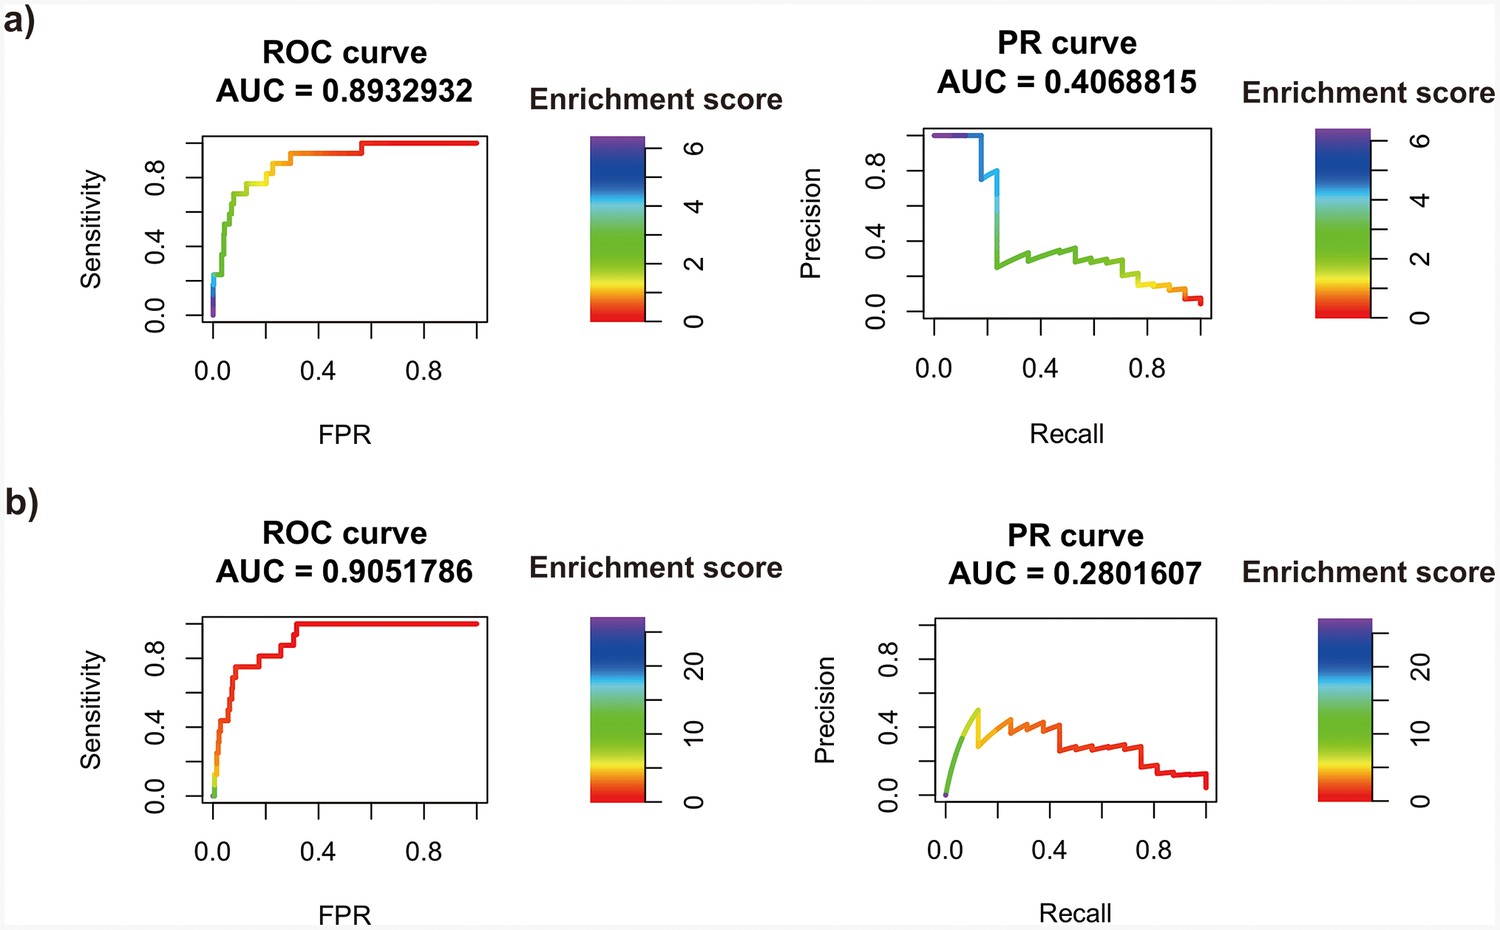
Transcription factor (TF) motif enrichment score is used to distinguish 11 known pioneer transcription factors (PTFs) with essential roles in cell differentiation (Test set 2) from other TFs.
Receiver operating curve (ROC) and precision-recall (PR) curve analysis are performed. Enrichment scores are calculated using the nucleosome regions (NRs) and nucleosome-depleted regions (NDRs) from (a) differentially and conserved open chromatin regions and (b) differentially and conserved active enhancer regions.
-
Figure 2—figure supplement 4—source data 1
Source data of TF enrichment scores used for ROC analysis.
- https://cdn.elifesciences.org/articles/88936/elife-88936-fig2-figsupp4-data1-v1.xlsx
Figure 2—figure supplement 5
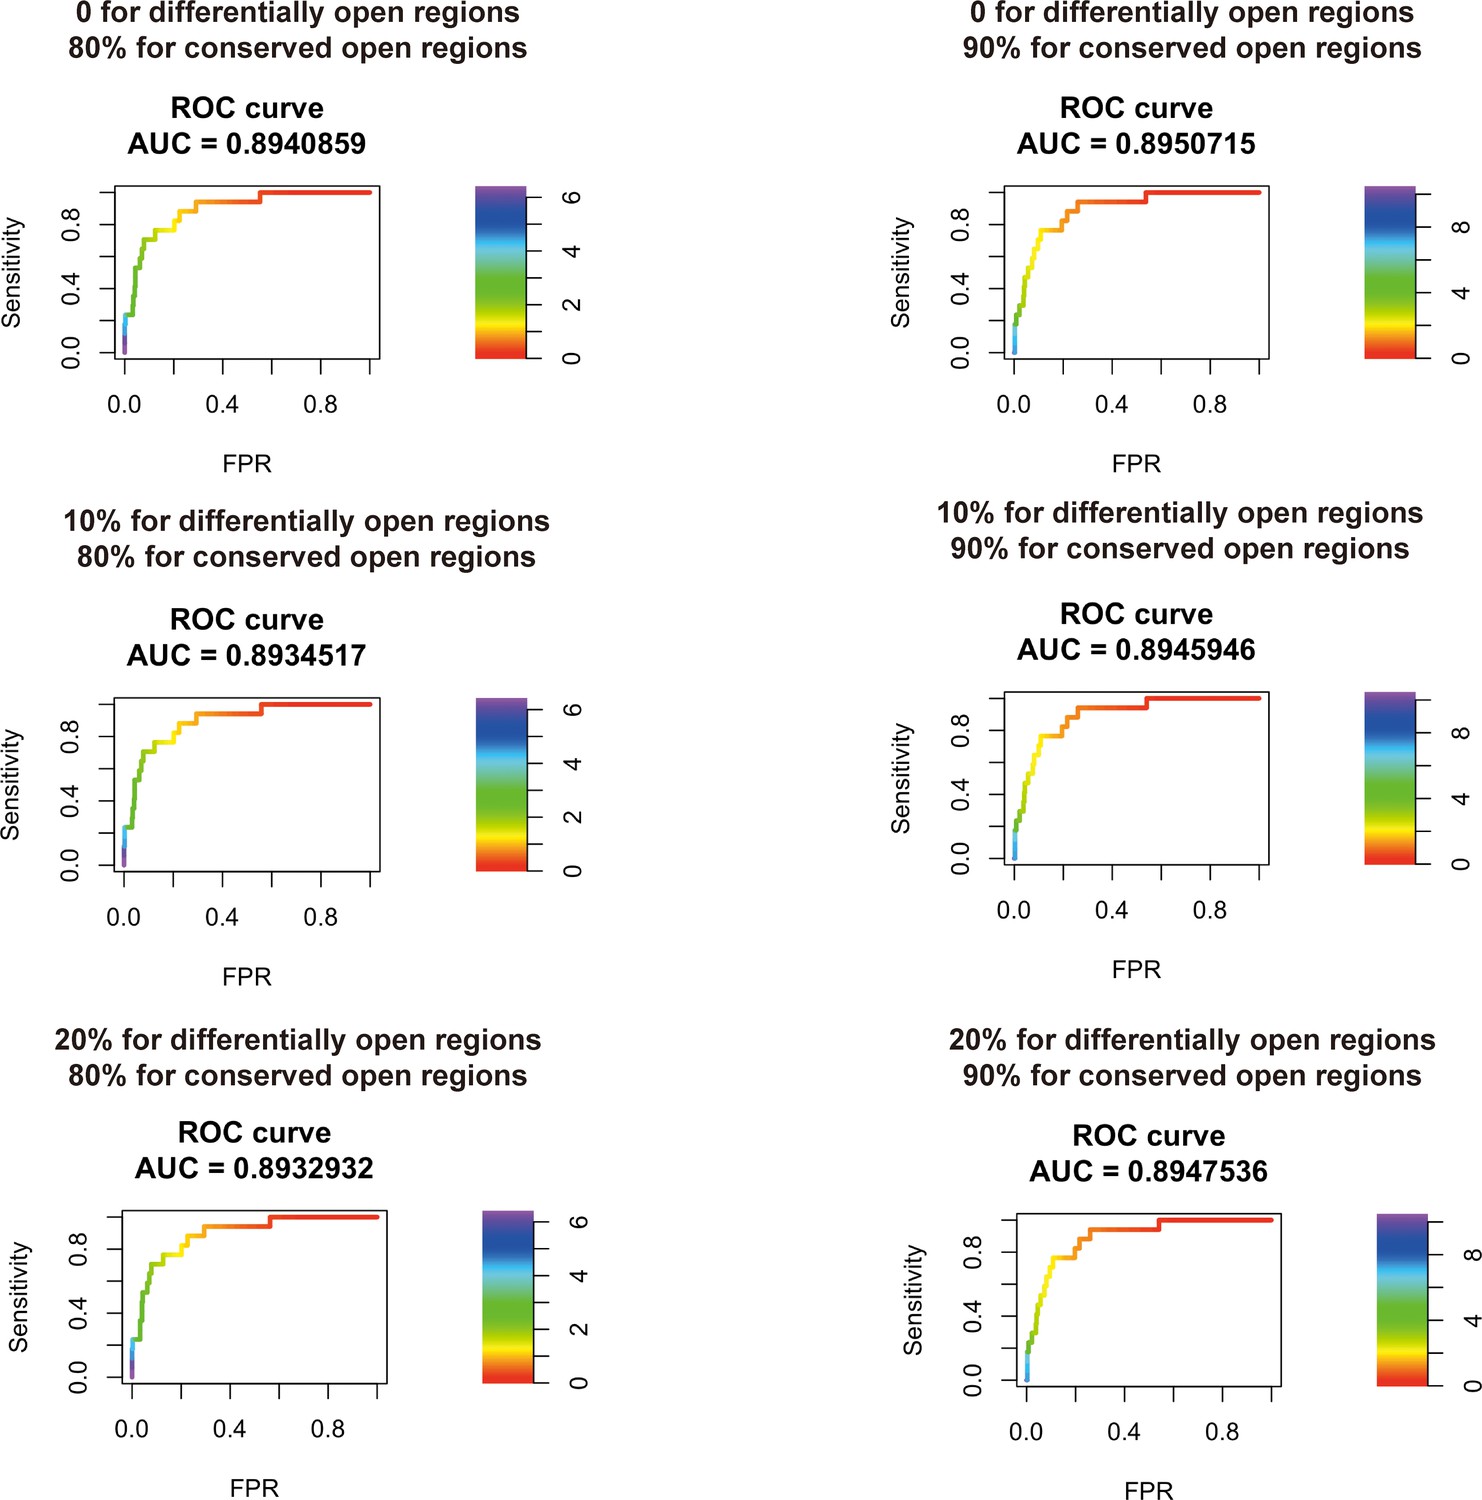
Transcription factor (TF) motif enrichment score is used to distinguish 11 known pioneer transcription factors (PTFs) with essential roles in cell differentiation (Test set 2) from other TFs.
Receiver operating curve (ROC) analyses of motif enrichment scores are performed using different thresholds in defining the differentially and conserved open chromatin regions.
-
Figure 2—figure supplement 5—source data 1
Source data for TF enrichment scores calculated with different thresholds.
- https://cdn.elifesciences.org/articles/88936/elife-88936-fig2-figsupp5-data1-v1.xlsx
Figure 3
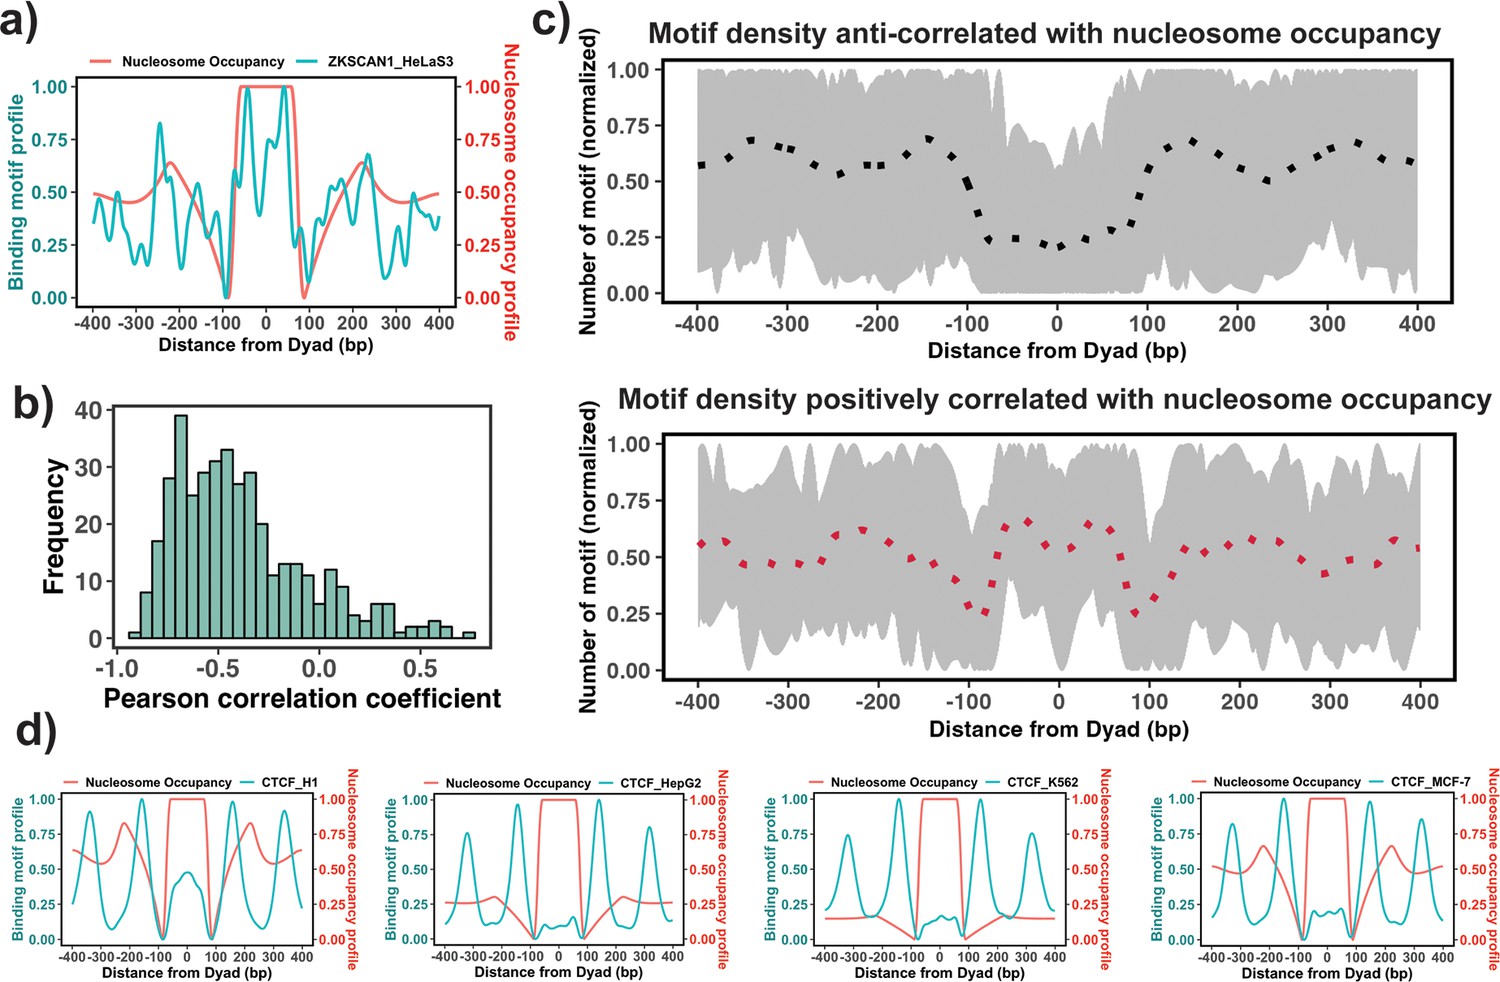
Association between the binding motif profiles and nucleosome occupancy.
(a) Motif profiles for ZKSCAN1 in HeLa-S3 cell line is shown as an example. (b) Pearson correlation coefficients between motif profiles and nucleosome occupancy values for each transcription factor (TF) (n=225) (the median value of correlation coefficient = –0.46). (c) Binding motif profiles of TFs with positive (red, correlation coefficient ≥ 0.2and p-value <0.05) or negative correlation coefficients (black, correlation coefficient ≤ –0.4and p-value <0.05) between binding motif profile and nucleosome occupancy. Dashed lines correspond to the average of binding motif profiles. (d) Comparison of binding motif profiles of CTCF between H1 embryonic stem cell line and somatic cell lines (normalized within the range between 0 and 1).
-
Figure 3—source data 1
Source data for TF binding profiles, nucleosome occupancy levels and results of the correlation analysis.
- https://cdn.elifesciences.org/articles/88936/elife-88936-fig3-data1-v1.xlsx
Figure 4 with 2 supplements
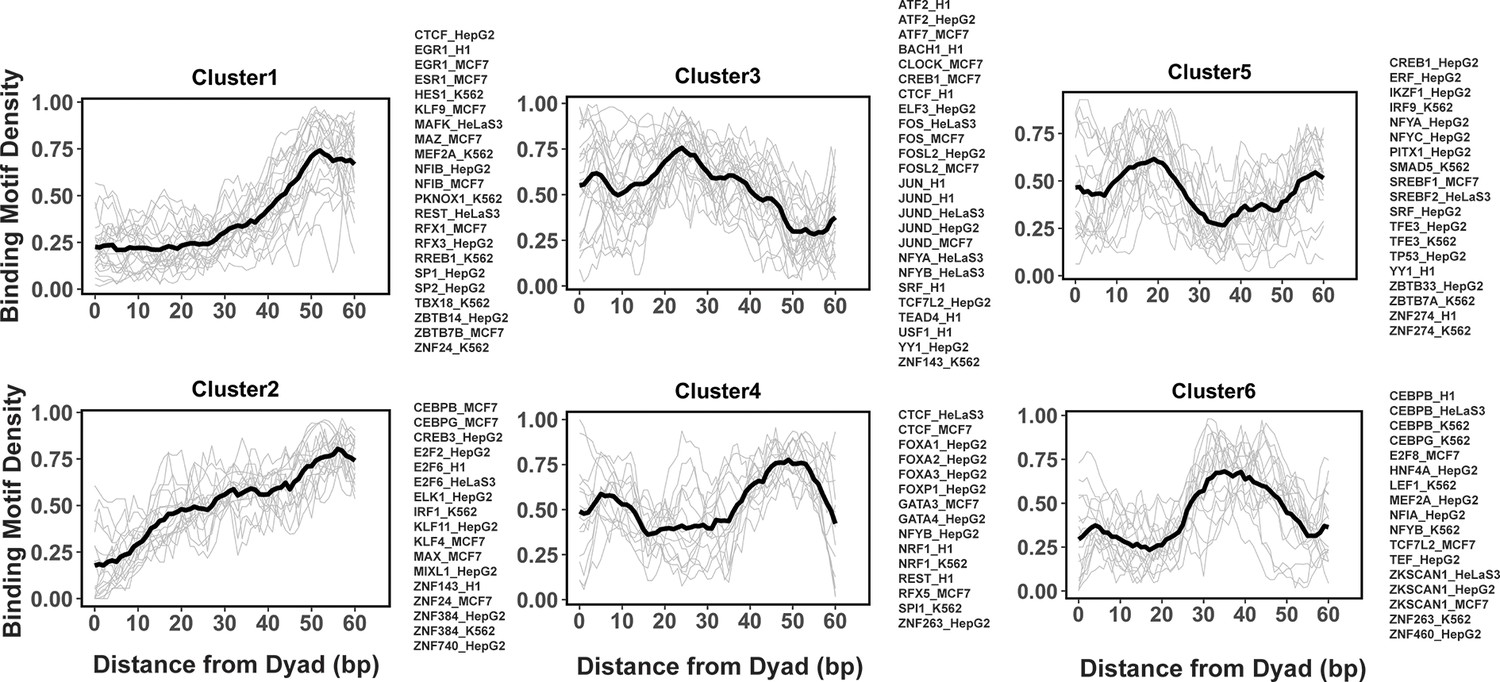
Clusters of transcription factor (TF) binding motif profiles on nucleosomal DNA.
Binding motif profiles centered at nucleosomal dyad locations (±60bp from dyad) are clustered using k-medoids clustering with k=6. The entry/exit regions of nucleosomal DNA were excluded as a certain nucleotide bias exists around the ends of nucleosomal DNA reads produced by the MNase-seq experiments. Binding motif profiles between two symmetrical nucleosomal halves are combined for each TF. The black line represents the averaged profiles of all TFs in the same cluster. Cluster members with silhouette width ≤ 0.25 were considered as outliers and removed.
-
Figure 4—source data 1
Source data for TF binding profiles in each cluster.
- https://cdn.elifesciences.org/articles/88936/elife-88936-fig4-data1-v1.xlsx
Figure 4—figure supplement 1
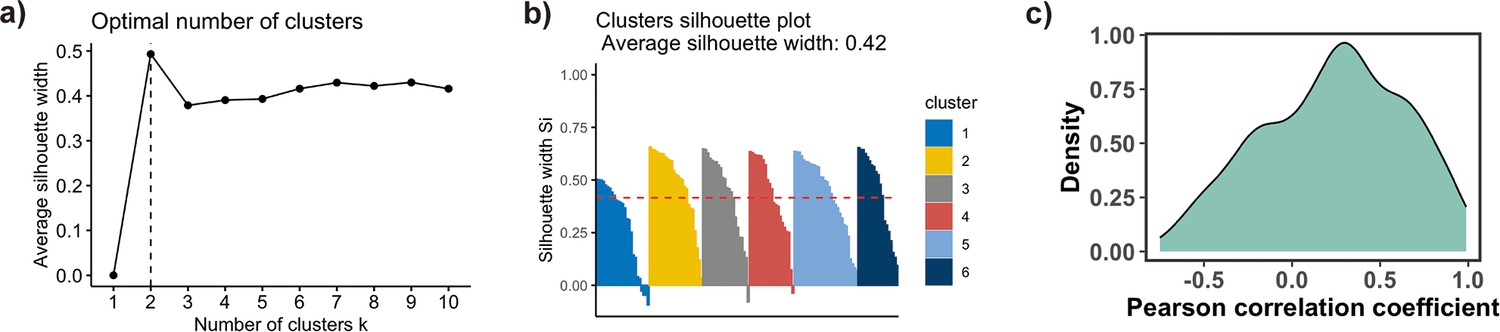
Clusters analysis of TF binding motif profiles.
(a) Variation of the average silhouette width with the number of clusters in k-medoids clustering of transcription factor (TF) binding profiles. Six is selected as an optimal number of clusters. (b) Distribution of silhouette width for all points (Si) in each cluster. Each point with Si ≤ 0.25 is considered as outlier and excluded from the analysis. (c) Pearson correlation coefficients (PCCs) of binding motif profiles between two symmetrical nucleosomal halves (define superhelical location [SHL]) of all TFs. TFs with PCC values less than 0.4 and the total number of base pairs of binding motifs in nucleosome regions (NRs) less than 500 are excluded from the analysis.
Figure 4—figure supplement 2
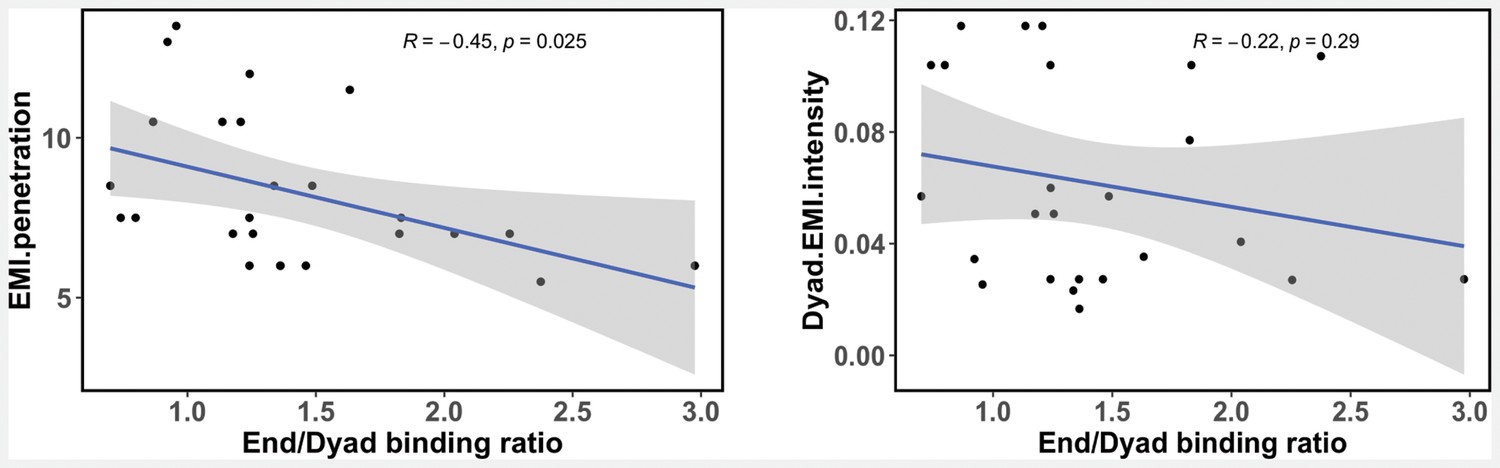
A liner regression model describing the relationship between calculated transcription factor (TF) end/dyad binding ratio () from our study and the enriched mutual information (EMI) intensity and EMI penetration values from recent nucleosome NCAP-SELEX experiments (Zhu et al., 2018).
A Pearson correlation coefficient is shown.
-
Figure 4—figure supplement 2—source data 1
Source data of the EMI intensity and EMI penetration values from nucleosome NCAP–-SELEX experiments.
- https://cdn.elifesciences.org/articles/88936/elife-88936-fig4-figsupp2-data1-v1.xlsx
Tables
Key resources table
| Reagent type (species) or resource | Designation | Source or reference | Identifiers | Additional information |
|---|---|---|---|---|
| Software, algorithm | nf-core-mnaseseq pipeline | The Bioinformatics & Biostatistics Group and Patel, 2020 | https://github.com/nf-core/mnaseseq | |
| Software, algorithm | Burrows-Wheeler Aligner (BWA) | Li and Durbin, 2009a | https://bio-bwa.sourceforge.net | |
| Software, algorithm | BEDTools suite | Quinlan and Hall, 2021 | https://bedtools.readthedocs.io/en/latest/content/bedtools-suite.html | |
| Software, algorithm | FIMO | Grant et al., 2011a | https://meme-suite.org/meme/doc/fimo.html | |
| Software, algorithm | t-SNE | Donaldson, 2022 | https://cran.r-project.org/web/packages/tsne/index.html | |
| Software, algorithm | Cluster | Maechler et al., 2023 | https://cran.r-project.org/web/packages/cluster/index.html | |
| Software, algorithm | TTR | Ulrich and Smith, 2023 | https://cran.r-project.org/web/packages/TTR/index.html |
Additional files
-
Supplementary file 1
Supplementary materials for this study.
- https://cdn.elifesciences.org/articles/88936/elife-88936-supp1-v1.docx
-
MDAR checklist
- https://cdn.elifesciences.org/articles/88936/elife-88936-mdarchecklist1-v1.docx
-
Source code 1
Source codes for identifying nucleosome representative dyad positions.
- https://cdn.elifesciences.org/articles/88936/elife-88936-code1-v1.zip
-
Source code 2
Source codes for processing MNase-seq raw data and mapping nucleosome dyad locations.
- https://cdn.elifesciences.org/articles/88936/elife-88936-code2-v1.zip
-
Source code 3
Source codes for transcription factor (TF) enrichment score and binding motif profile analyses.
- https://cdn.elifesciences.org/articles/88936/elife-88936-code3-v1.zip
Download links
A two-part list of links to download the article, or parts of the article, in various formats.
Downloads (link to download the article as PDF)
Open citations (links to open the citations from this article in various online reference manager services)
Cite this article (links to download the citations from this article in formats compatible with various reference manager tools)
Detection of new pioneer transcription factors as cell-type-specific nucleosome binders
eLife 12:RP88936.
https://doi.org/10.7554/eLife.88936.4


