Body size as a metric for the affordable world
- Department of Psychology & Tsinghua Laboratory of Brain and Intelligence, Tsinghua University, China
- Faculty of Psychology, Beijing Normal University, China
Figures
Figure 1 with 1 supplement
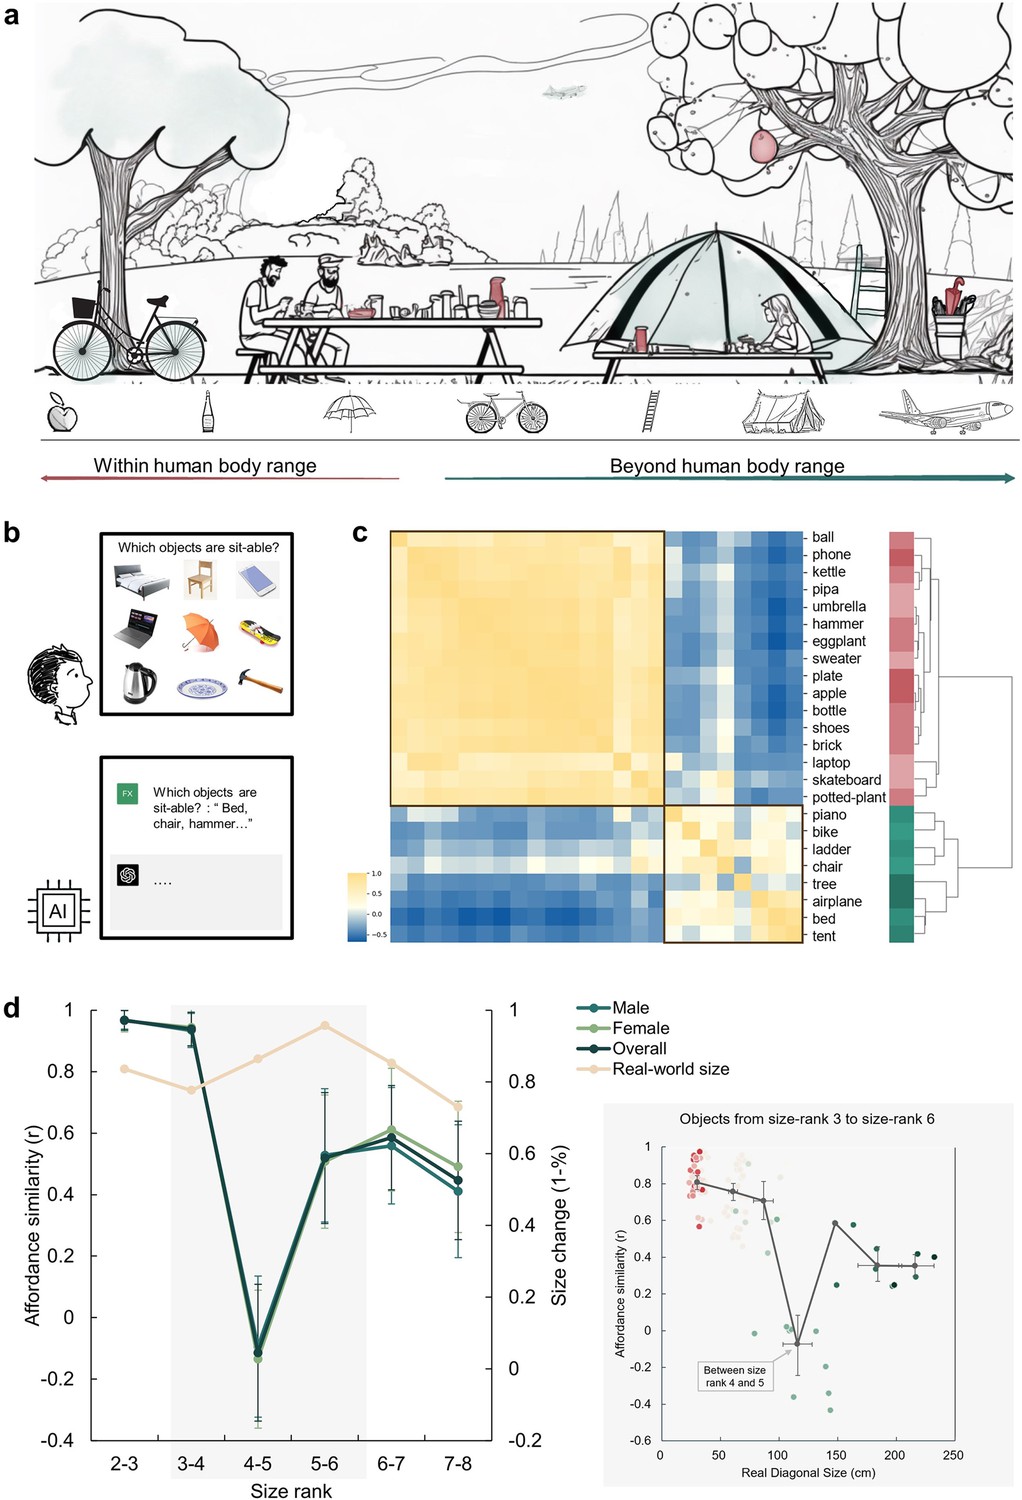
An affordance boundary in the affordable world.
(a) An illustration of a picnic scene, featuring objects of various sizes relative to human body. Example objects within the normal body size range are painted red, and those beyond green. We hypothesized qualitative differences between perceived affordances of these two kinds of objects. (b) A demonstration of the object-action relation judgement task for human participants (top) and AI models (bottom). The question in the task for human participants was presented in Chinese. (c) The representational similarity matrix (RSM) for objects based on human rating of affordance similarity. Object sizes are denoted with red to green. Two primary clusters emerged in the clustering analysis of the similarity pattern are outlined with black boxes. (d) Left panel: The overall affordance similarity and that of each gender (left y-axis) as well as real-world size similarity (right y-axis) between neighboring size ranks. The error bars represent the standard error (SE), computed from sample size n = 14. Right panel: The point clouds of pairwise correlations between objects from the same rank or neighboring ranks. Each colored dot represents the affordance similarity (y-axis) and the average real-world size (x-axis) of a specific object pair. The grey dots indicate the averaged size (x-axis) and pairwise similarity (y-axis) of object pairs in different rank compositions. Left to right: both from size rank 3, from size rank 3 and 4, both from size rank 4, from size rank 4 and 5, both from size rank 5, from size rank 5 and 6, and both from size rank 6. The horizontal error bars represent 95% confidence interval (CI) of the averaged object size in each pair, and the vertical error bars denote the CI of pairwise affordance similarity (sample size n = 100).
Figure 1—figure supplement 1
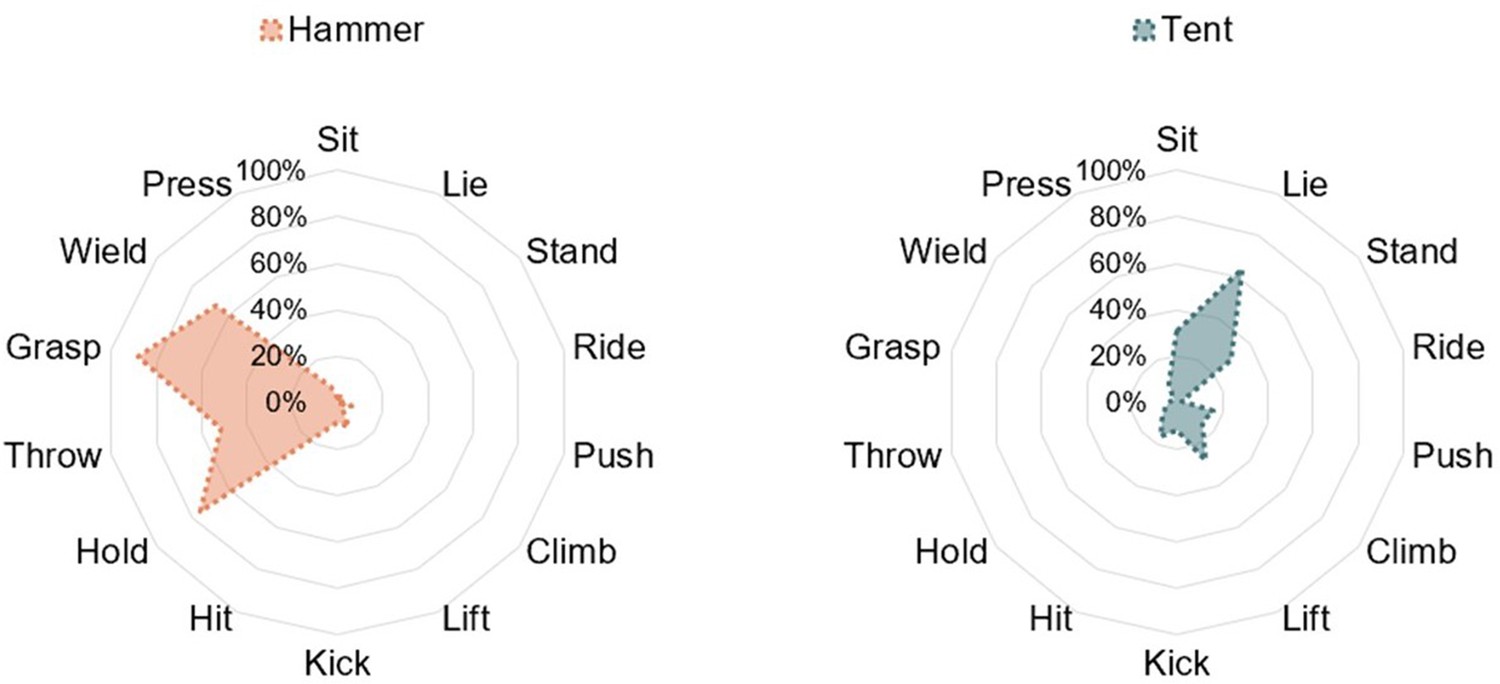
Two exemplar objects with different affordance profiles.
The values represented the percentage of participants who agreed on a certain action being afforded by an object.
Figure 2
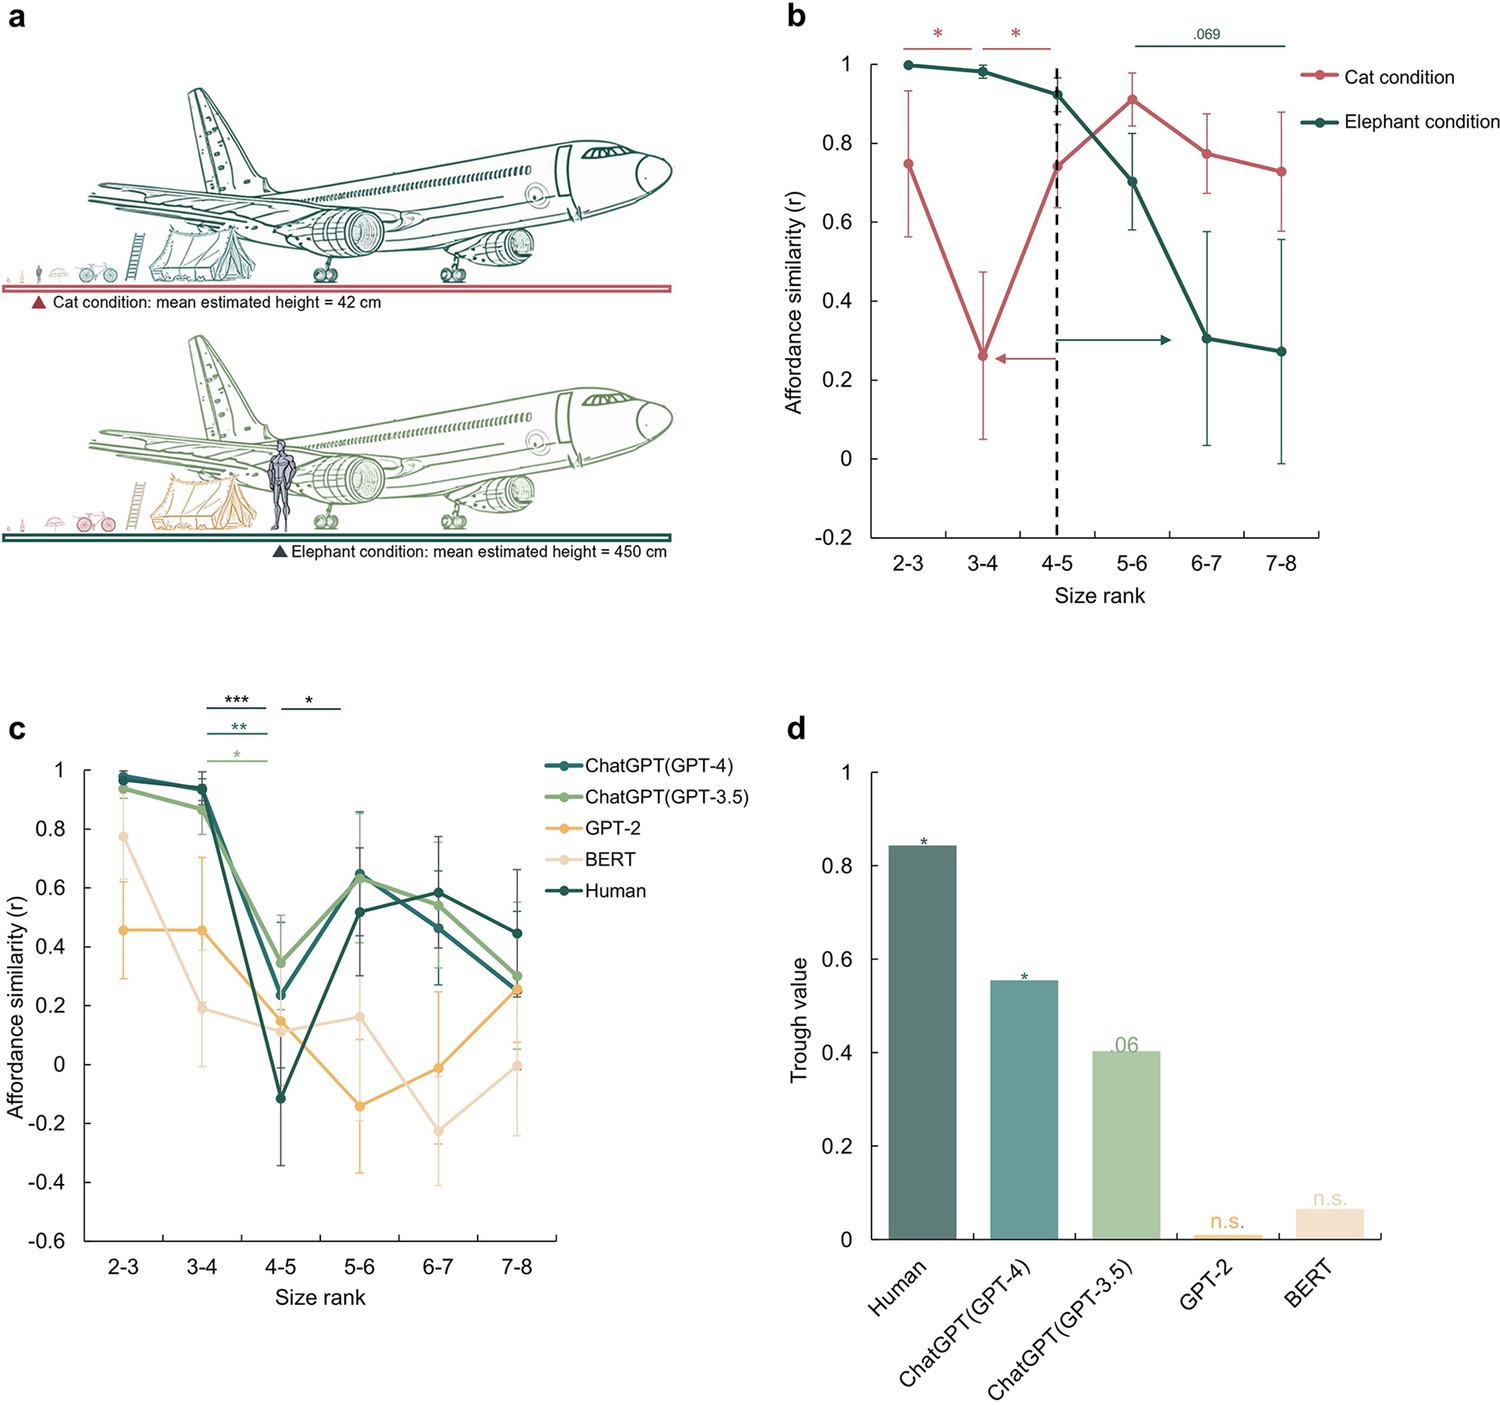
A disembodied origin of the affordance boundary.
(a) The schematic diagram of the imagined size in the cat condition (top) and the elephant condition (bottom), with the mean estimated height reported by participants for each condition. (b), The affordance similarity between neighboring size ranks for manipulated body sizes (Red line: cat-size body; Green line: elephant-size body). The dashed line marks the boundary of the human-size body. The red and green arrows indicate the corresponding boundary shift in each condition. (c), The affordance similarity between neighboring size ranks for different large language models, and human data from Figure 1d was re-drawn as a reference. The stars indicate significant contrasts between affordance similarities between neighboring data points. (d), The trough value of each model at between size rank 4–5. The stars here indicate the significant trough value compared to zero. The error bars represent the estimated standard error (SE), computed from sample size n = 14. *p<0.05, **p<0.01, ***p<0.001.
Figure 3 with 3 supplements
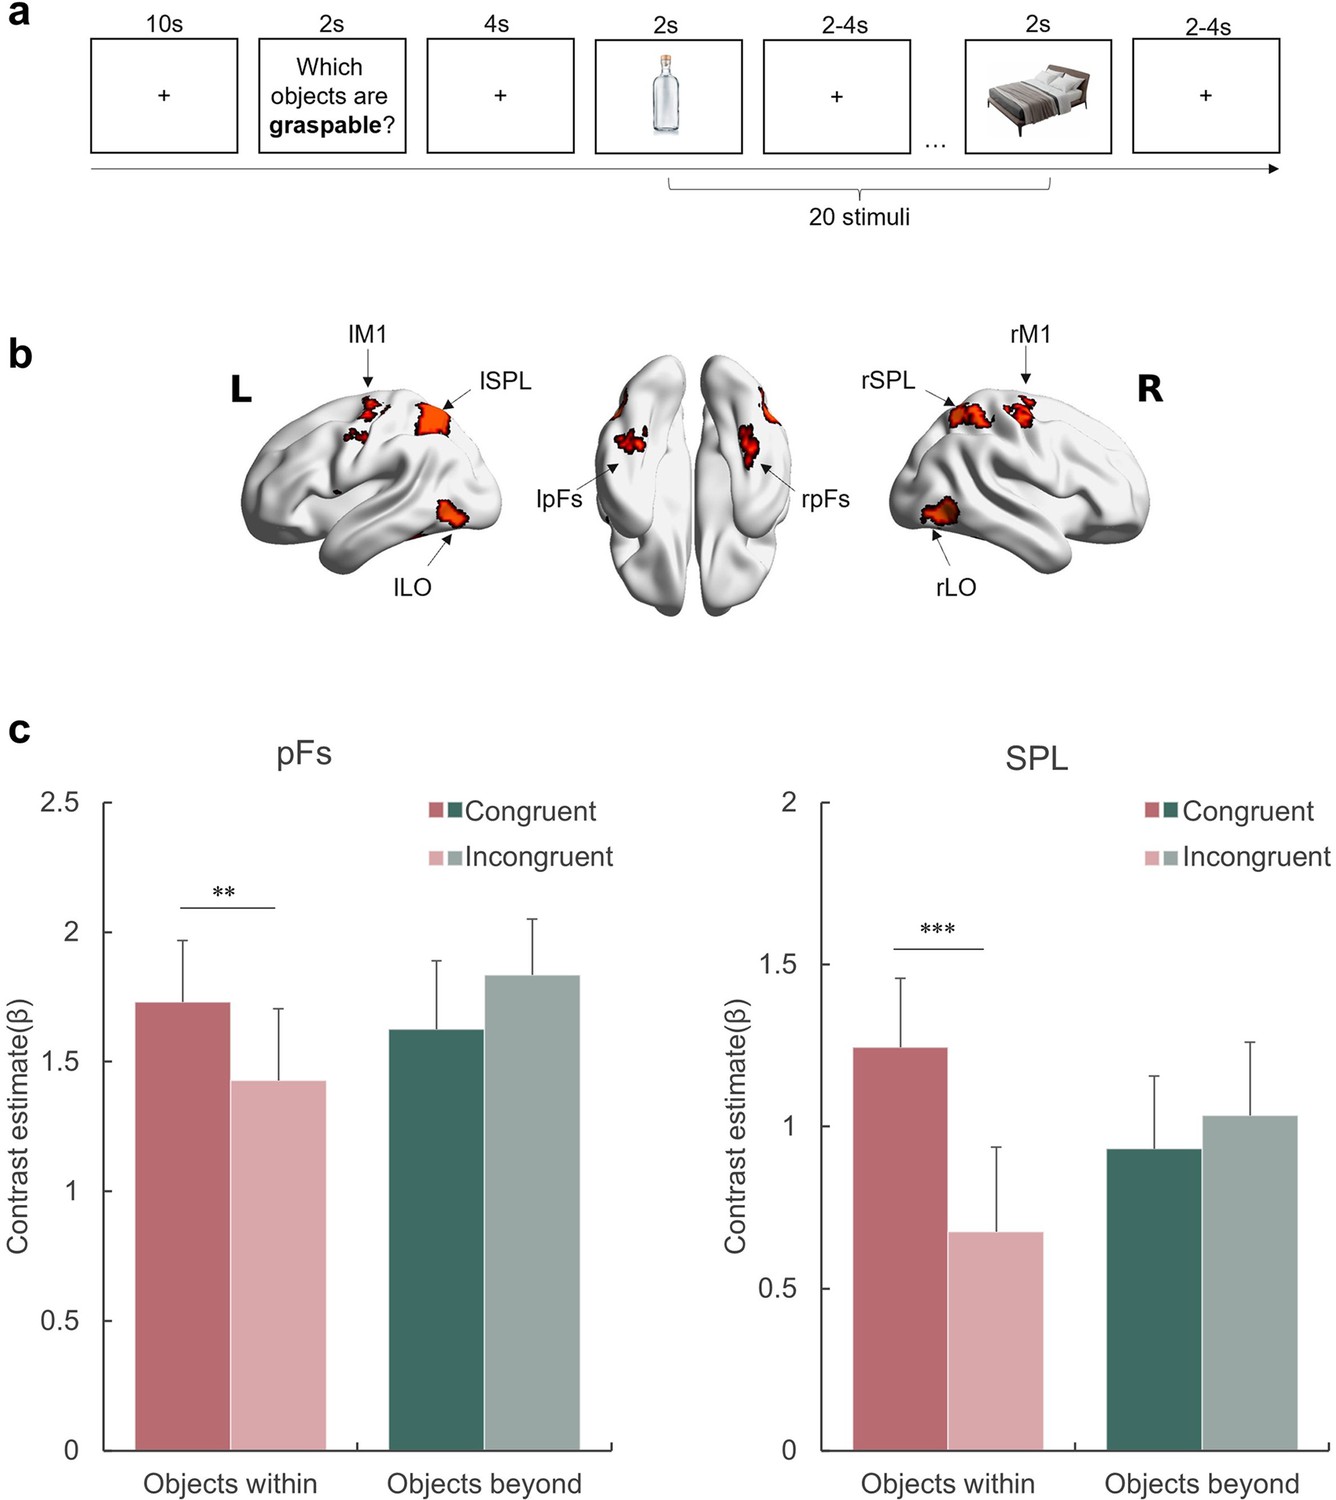
Affordance representation in the visual streams.
(a) An example block with the probe action ‘graspable’. The participants indicated whether each of the subsequently presented objects was graspable by pressing the corresponding button. The action probing question was presented in Chinese during the experiment. (b) The ROIs included in this experiment. (c) The activation of each condition in the pFs and SPL. The bars represent the contrast estimates of each condition versus baseline. The stars indicate the significant difference between congruent and incongruent conditions. *p<0.05, **p<0.01, ***p<0.001, otherwise non-significance. Error bars represent the standard error (SE), computed from sample size n = 12.
Figure 3—figure supplement 1
Brain areas showing significantly greater neural activation for objects within body size and beyond body size versus baseline.
Figure 3—figure supplement 2
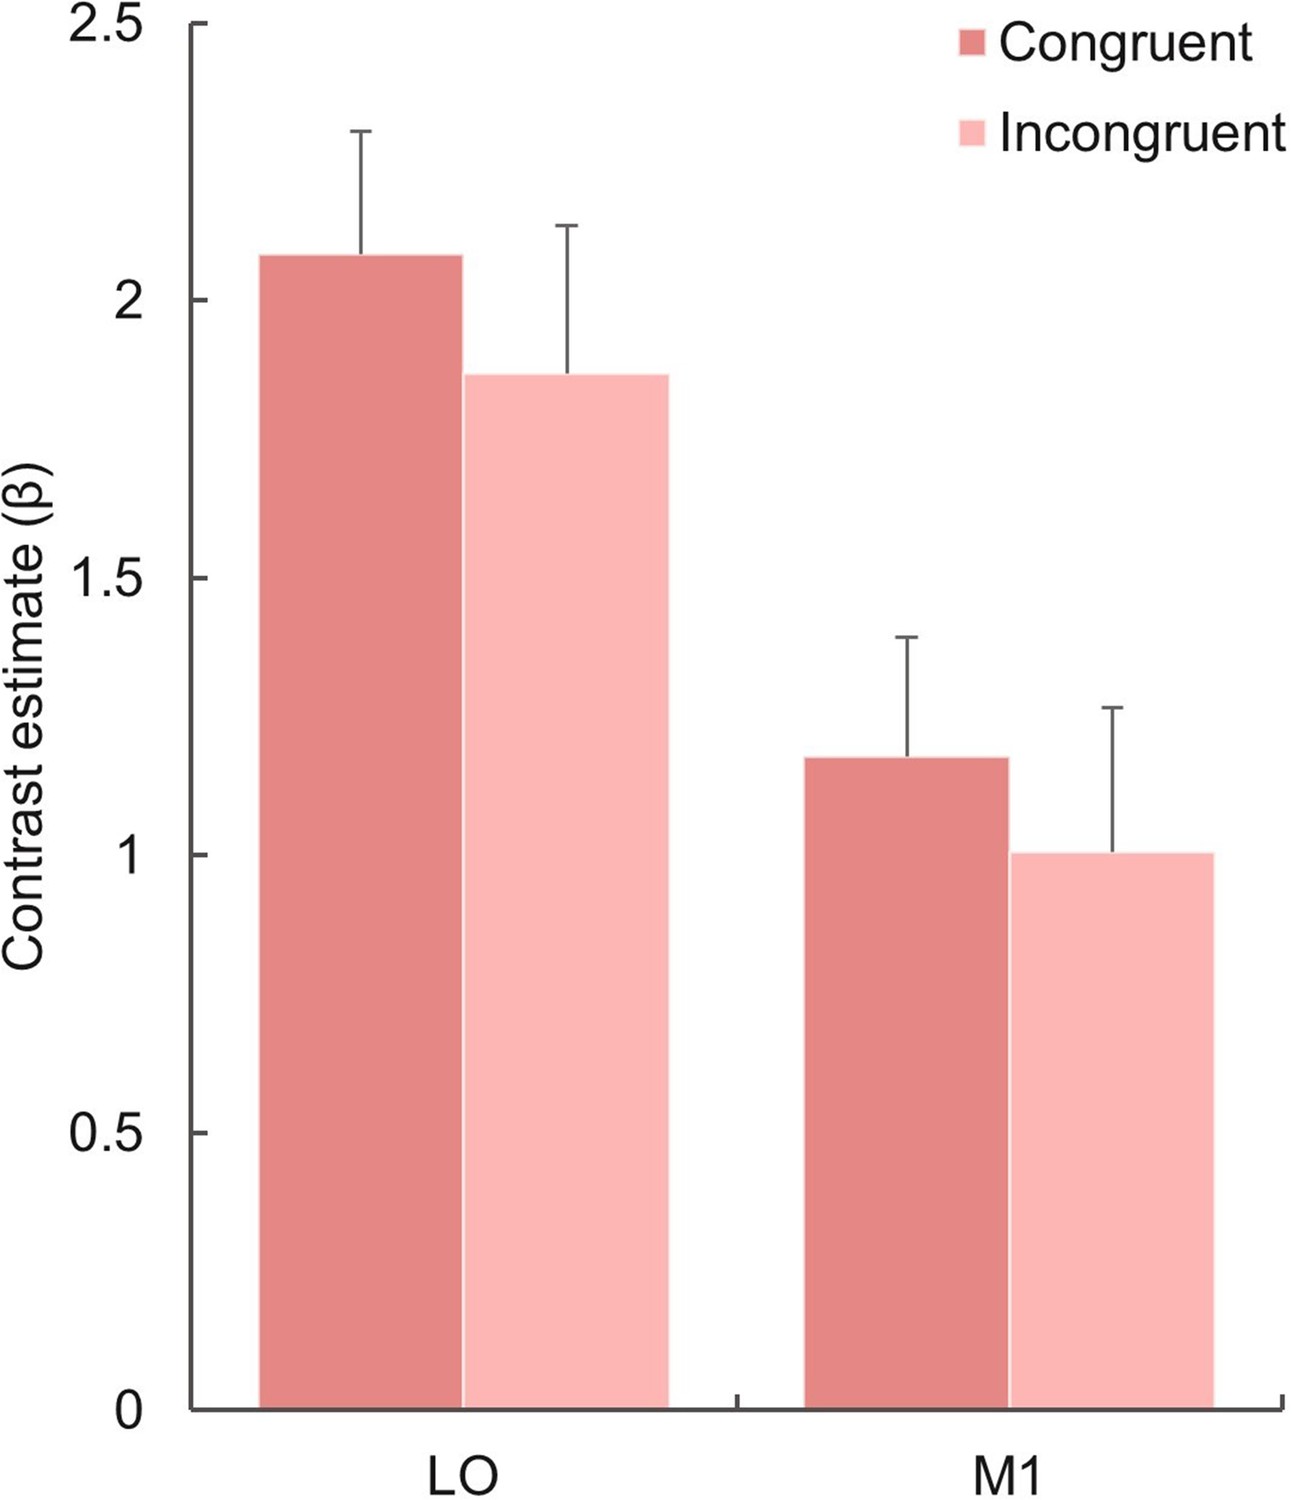
The activation in LO and M1 in response to objects within body size in the congruent and incongruent conditions, respectively.
The bars refer to the contrast estimates of each condition versus baseline. The stars indicate whether the contrast was significant. *p<0.05, **p<0.01, ***p<0.001, otherwise not significant. Error bars represent the standard error (SE), computed from sample size n = 12.
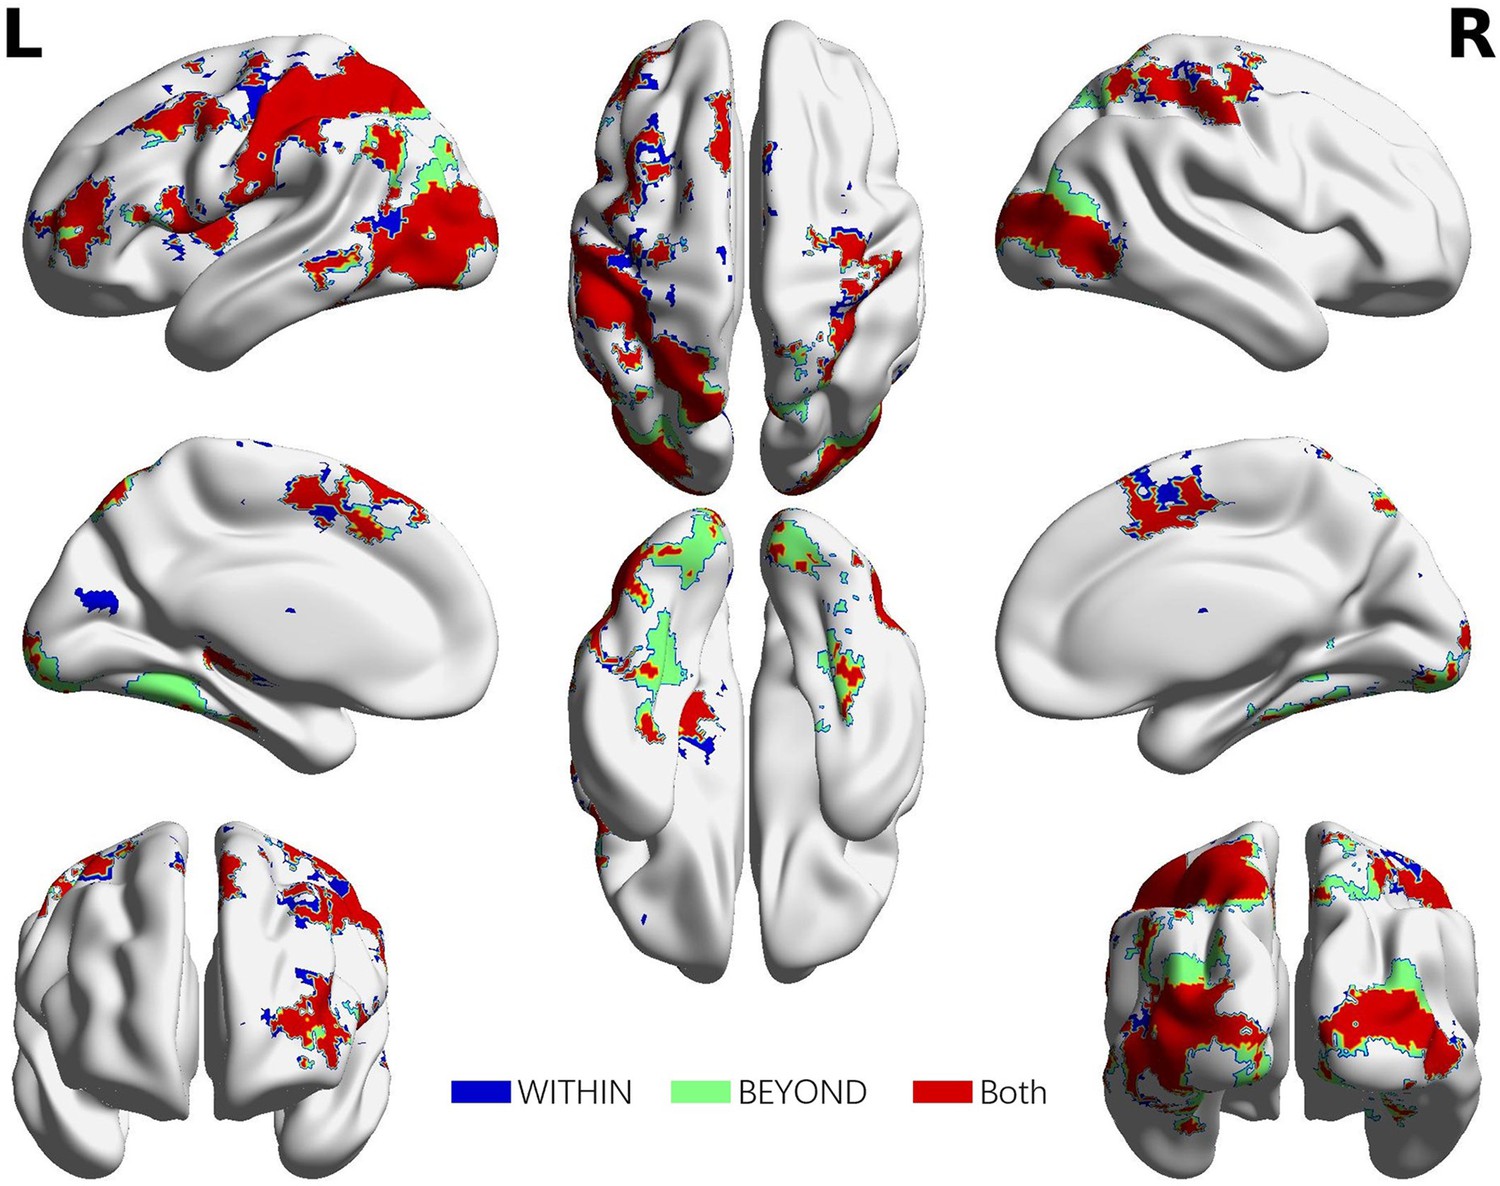
Figure 3—figure supplement 3
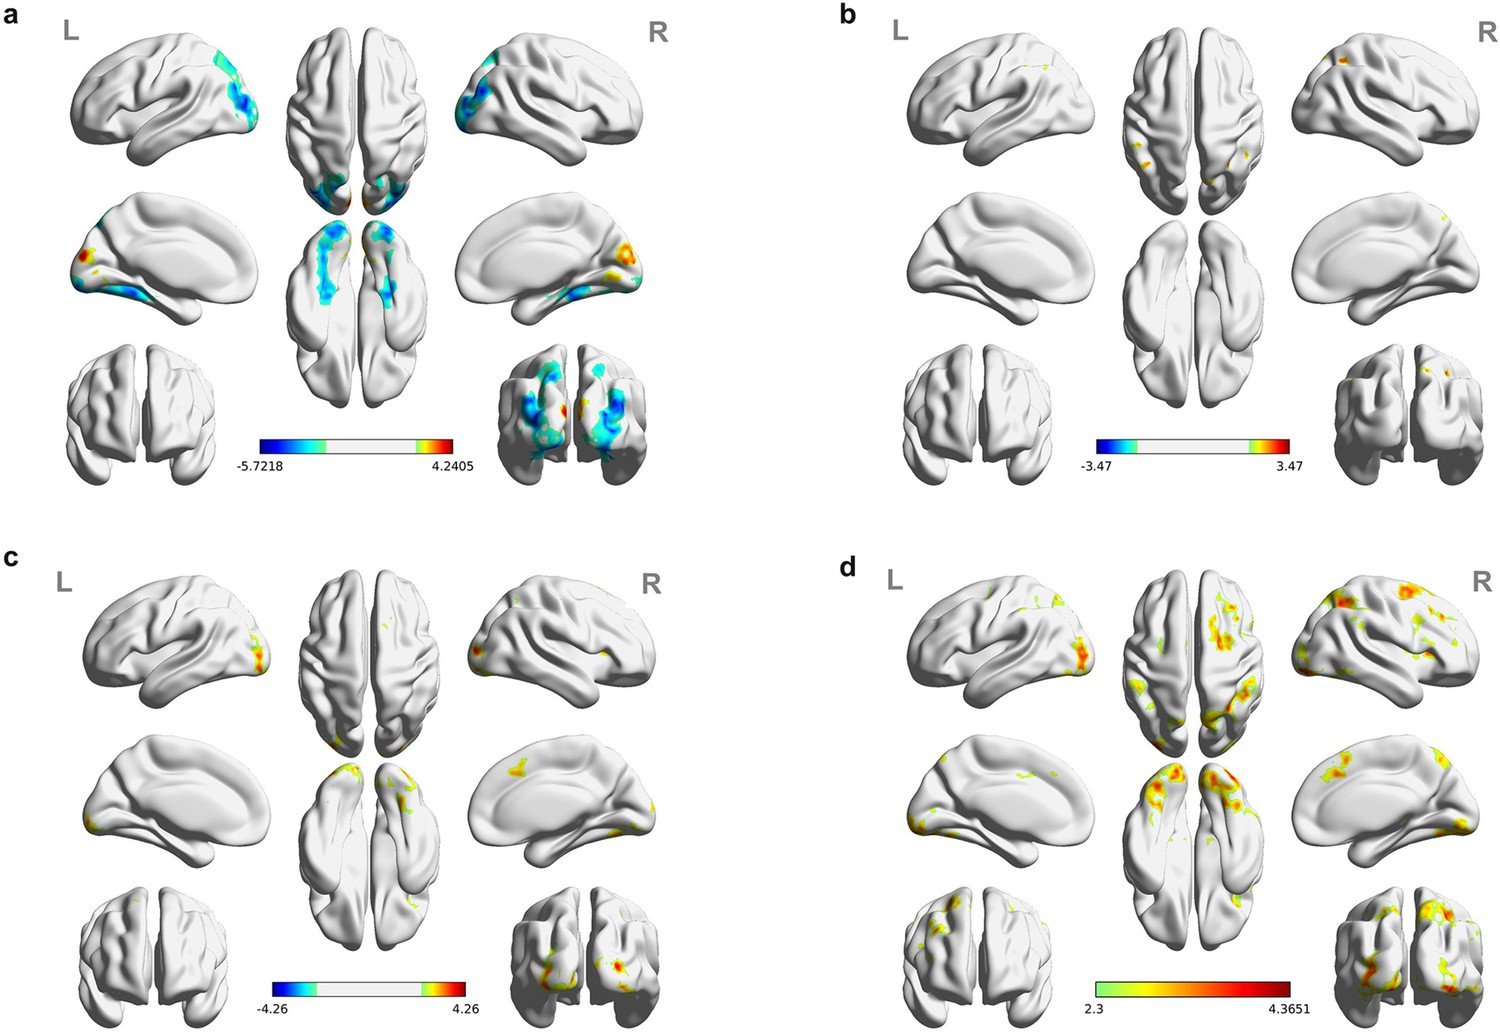
Significant brain activations of different contrasts in the whole-brain level analysis.
(a) The effect of object type, positive values (warm color) indicated higher activation for objects within than objects beyond and negative values (cold color) indicated the opposite. (b) The effect of congruency, positive values indicated higher activation in congruent than incongruent condition. (c) The effect of interaction between object type and congruency, positive values indicated the larger congruency effect for objects within than beyond. (d) The congruency effect for objects within. All contrasts were corrected with cluster-level correction at p<0.05. The detailed cluster-level results for each contrast map can be found in Supplementary file 1b-1e.
Author response image 1

Significant brain activations of different contrasts in the whole-brain level analysis.
(a) the effect of object type, positive values (warm color) indicated higher activation for objects within than objects beyond and negative values (cold color) indicated the opposite. (b) the effect of congruency, positive values indicated higher activation in congruent than incongruent condition. (c) the effect of interaction between object type and congruency, positive values indicated the larger congruency effect for objects within than beyond. (d) the congruency effect for objects within. All contrasts were corrected with cluster-level correction at p < .05. The detailed cluster-level results for each contrast map can be found in Supplementary Table S2 to S5.
Author response image 2
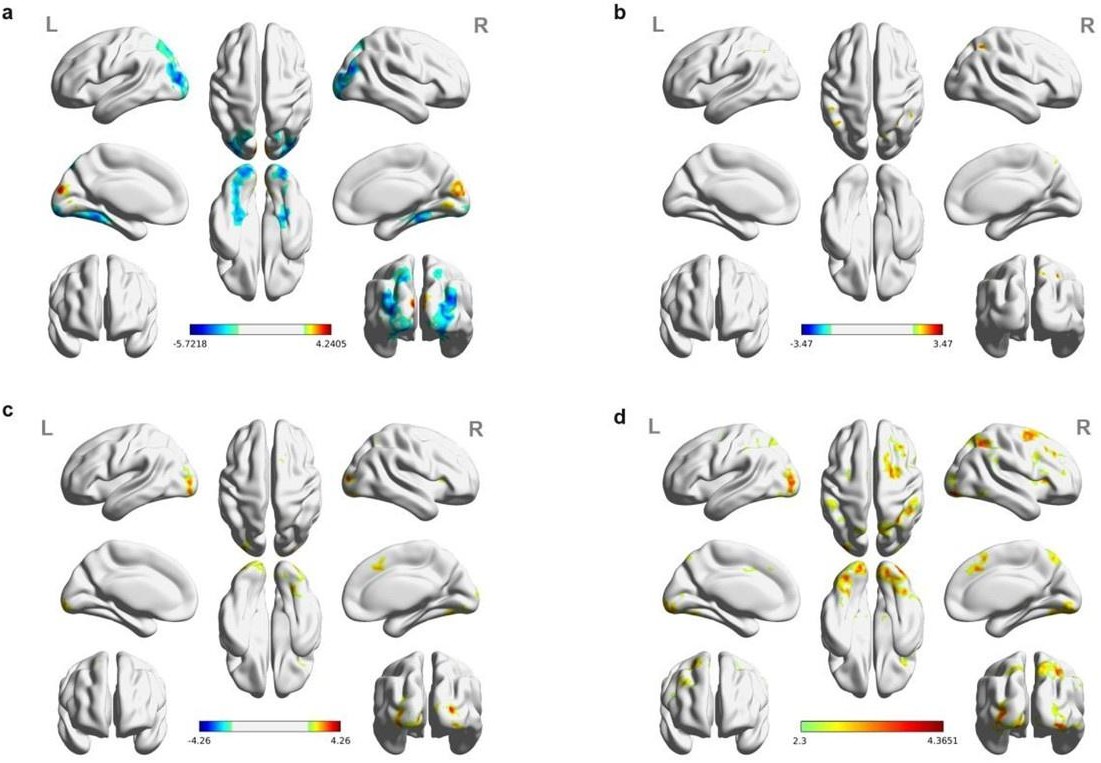
Significant brain activations of different contrasts in the whole-brain level analysis.
a, the effect of object type, positive values (warm color) indicated higher activation for objects within than objects beyond and negative values (cold color) indicated the opposite. b, the effect of congruency, positive values indicated higher activation in congruent than incongruent condition. c, the effect of interaction between object type and congruency, positive values indicated the larger congruency effect for objects within than beyond. d, the congruency effect for objects within. All contrasts were corrected with cluster-level correction at p < .05. The detailed cluster-level results for each contrast map can be found in Supplementary Table S2 to S5.
Tables
Author response table 1
Cortical regions showing significant congruency effect (congruent versus incongruent) for objects within, whole-brain analysis (R = right hemisphere, L = left hemisphere; Z > 2.3, p = 0.05, cluster corrected).
| Cluster | Region | Number ofvoxels in region | MNI coordinates | Peak Z value | ||
|---|---|---|---|---|---|---|
| x | y | z | ||||
| (OW_Congruent – OW_Incongruent) > (OB_Congruent – OB_Incongruent) | ||||||
| 1 | L Middle Occipital Gyrus | 831 | 22 | –94 | 10 | 4.25 |
| R Middle Occipital Gyrus | 187 | |||||
| L Fusiform Gyrus | 113 | |||||
| R Fusiform Gyrus | 376 | |||||
| L Inferior Occipital Gyrus | 293 | |||||
| R Inferior Occipital Gyrus | 276 | |||||
| L Lingual Gyrus | 215 | |||||
| R Lingual Gyrus | 345 | |||||
| L Superior Occipital Gyrus | 123 | |||||
| 2 | R Supplementary Motor Area | 383 | 14 | 14 | 60 | 3.39 |
| 3 | R Superior Parietal Lobule | 191 | 36 | –62 | 56 | 3.18 |
| R Inferior Parietal Lobule | 114 | |||||
| 4 | R Insula | 175 | 32 | 18 | 8 | 3.41 |
| (OB_Congruent – OB_Incongruent) > (OW_Congruent – OW_Incongruent) | ||||||
| - | No significant cluster | - | - | - | - | - |
Author response table 2
The silhouette values of a k-means clustering when k (number of clusters) = 2 to 10.
| Number of clusters | 2 | 3 | 4 | 5 | 6 | 7 | 8 | 9 | 10 |
|---|---|---|---|---|---|---|---|---|---|
| Average silhouette values | 0.362 | 0.275 | 0.299 | 0.194 | 0.171 | 0.263 | 0.176 | 0.164 | 0.137 |
Author response table 3
Cortical regions reaching significance in the contrasts of (A) objects within versus object beyond and (B) objects beyond versus objects within, whole-brain analysis (R = right hemisphere, L = left hemisphere; Z > 2.3, p = 0.05, cluster corrected).
| Cluster | Region | Number ofvoxels in region | MNI coordinates | Peak Z value | ||
|---|---|---|---|---|---|---|
| x | y | z | ||||
| Objects within >Objects beyond | ||||||
| 1 | L Cuneus | 363 | 10 | –90 | 20 | 4.24 |
| R Cuneus | 309 | |||||
| L Lingual Gyrus | 176 | |||||
| R Lingual Gyrus | 293 | |||||
| Objects beyond >Objects within | ||||||
| 1 | L Middle Occipital Gyrus | 1831 | –16 | –92 | -8 | 5.72 |
| L Fusiform Gyrus | 994 | |||||
| L Superior Parietal Lobule | 584 | |||||
| L Lingual Gyrus | 504 | |||||
| L Inferior Occipital Gyrus | 304 | |||||
| L Superior Occipital Gyrus | 211 | |||||
| L Parahippocampal Gyrus | 210 | |||||
| L Precuneus | 205 | |||||
| 2 | R Middle Occipital Gyrus | 1358 | 20 | –86 | -2 | 5.4 |
| R Lingual Gyrus | 340 | |||||
| R Superior Parietal Lobule | 328 | |||||
| R Superior Occipital Gyrus | 320 | |||||
| R Inferior Occipital Gyrus | 276 | |||||
| 3 | R Fusiform Gyrus | 483 | 34 | –38 | –16 | 4.73 |
| R Parahippocampal Gyrus | 316 | |||||
Author response table 4
Cortical regions reaching significance in contrasts of (A) congruent versus incongruent and (B) incongruent versus congruent, whole-brain analysis (R = right hemisphere, L = left hemisphere; Z > 2.3, p = 0.05, cluster corrected).
| Cluster | Region | Number ofvoxels in region | MNI coordinates | Peak Z value | ||
|---|---|---|---|---|---|---|
| x | y | z | ||||
| Congruent >Incongruent | ||||||
| 1 | L Inferior Parietal Lobule | 322 | –44 | –50 | 64 | 3.47 |
| 2 | R Superior Parietal Lobule | 339 | 36 | –66 | 52 | 3.31 |
| R Inferior Parietal Lobule | 165 | |||||
| Incongruent >Congruent | ||||||
| - | No significant cluster | - | - | - | - | - |
Author response table 5
Review Table 5 (New Supplementary Table S4).Cortical regions showing significant interaction between object type and congruency, whole-brain analysis (OW = Objects within, OB = Objects beyond; R = right hemisphere, L = left hemisphere; Z > 2.3, p = 0.05, cluster corrected).
| Cluster | Region | Number ofvoxels in region | MNI coordinates | Peak Z value | ||
|---|---|---|---|---|---|---|
| x | y | z | ||||
| (OW_Congruent – OW_Incongruent) > (OB_Congruent – OB_Incongruent) | ||||||
| 1 | L Middle Occipital Gyrus | 831 | 22 | –94 | 10 | 4.25 |
| R Middle Occipital Gyrus | 187 | |||||
| L Fusiform Gyrus | 113 | |||||
| R Fusiform Gyrus | 376 | |||||
| L Inferior Occipital Gyrus | 293 | |||||
| R Inferior Occipital Gyrus | 276 | |||||
| L Lingual Gyrus | 215 | |||||
| R Lingual Gyrus | 345 | |||||
| L Superior Occipital Gyrus | 123 | |||||
| 2 | R Supplementary Motor Area | 383 | 14 | 14 | 60 | 3.39 |
| 3 | R Superior Parietal Lobule | 191 | 36 | –62 | 56 | 3.18 |
| R Inferior Parietal Lobule | 114 | |||||
| 4 | R Insula | 175 | 32 | 18 | 8 | 3.41 |
| (OB_Congruent – OB_Incongruent) > (OW_Congruent – OW_Incongruent) | ||||||
| - | No significant cluster | - | - | - | - | - |
Additional files
-
Supplementary file 1
Cortical regions showing significant results in whole-brain analyses (R=right hemisphere, L=left hemisphere; Z>2.3, P=0.05, cluster corrected).
- https://cdn.elifesciences.org/articles/90583/elife-90583-supp1-v1.docx
-
Supplementary file 2
The full list of inanimate objects used in the behavioral study, with the corresponding size rank noted according to Konkle and Oliva, 2011.
- https://cdn.elifesciences.org/articles/90583/elife-90583-supp2-v1.docx
-
MDAR checklist
- https://cdn.elifesciences.org/articles/90583/elife-90583-mdarchecklist1-v1.docx
Download links
A two-part list of links to download the article, or parts of the article, in various formats.
Downloads (link to download the article as PDF)
Open citations (links to open the citations from this article in various online reference manager services)
Cite this article (links to download the citations from this article in formats compatible with various reference manager tools)
Body size as a metric for the affordable world
eLife 12:RP90583.
https://doi.org/10.7554/eLife.90583.3


