Quantification of sporozoite expelling by Anopheles mosquitoes infected with laboratory and naturally circulating P. falciparum gametocytes
- Department of Medical Microbiology, Radboud University Nijmegen Medical Centre, Netherlands
- Centre National de Recherche et de Formation sur le Paludisme, Burkina Faso
- Department of Plastic and Reconstructive Surgery, Azienda Ospedaliero Universitaria GiulianoIsontina Trieste, Italy
- Department of Molecular Microbiology and Immunology, Johns HopkinsBloomberg School of Public Health, United States
- Liverpool School of Tropical Medicine, United Kingdom
- Department of Immunology and Infection, London School of Hygiene and Tropical Medicine, United Kingdom
Figures
Figure 1 with 1 supplement
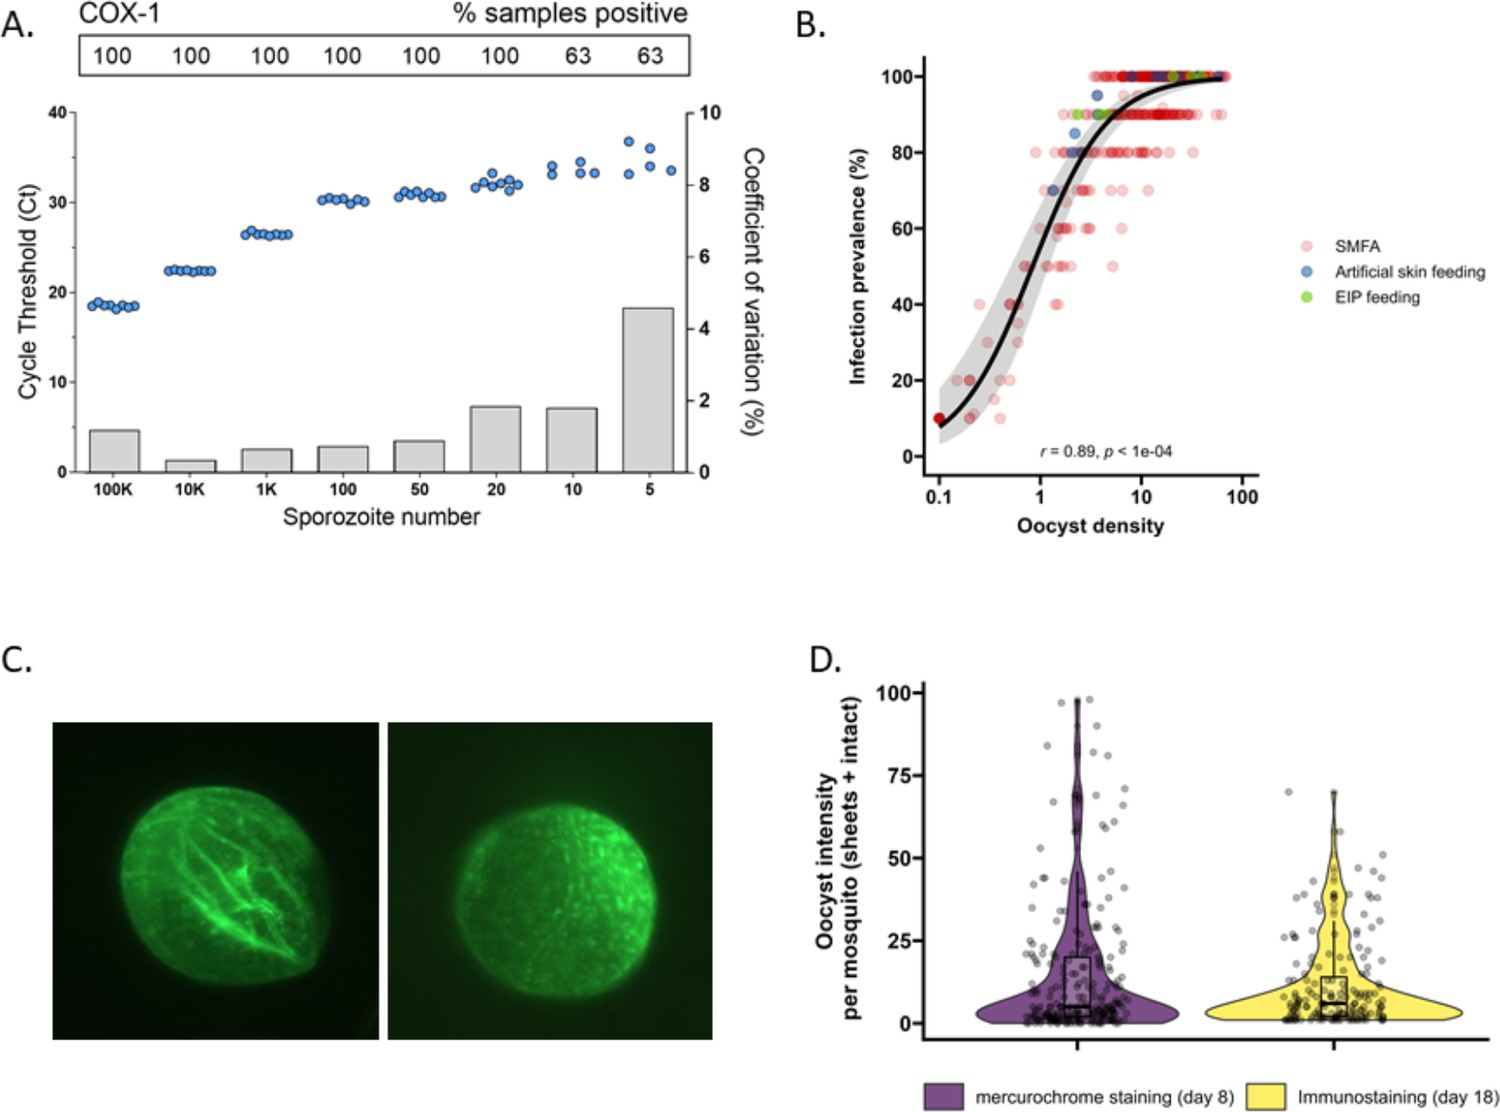
The detectability of sporozoites by molecular methods and oocysts by immunolabeling.
(A) qPCR performance for P. falciparum sporozoites. Serial dilutions of sporozoites (x-axis) were prepared in phosphate-buffered saline (PBS) and assessed in octuplicate on a single plate to determine qPCR COX-1 limit of detection and quantification. Dots represent sample cycle threshold (left y-axis), and bars coefficient of variation (right y-axis). For each serial dilution, Ct sample positivity is shown as the percentage of total tested. (B) The relationship between oocyst density versus infection prevalence from 457 membrane feeding experiments using cultured gametocytes. Colors represent regular feeds (red) and those selected for performing experiments on the extrinsic incubation period (EIP; green) or sporozoite-expelling experiments (blue). (C) Immunofluorescence staining with 3SP2-Alexa 488 anti-CSP. Empty sheet (left) and intact oocyst (right). (D) Violin plots of oocyst staining – day 8 post infection by mercurochrome (purple) and – day 18 by 3SP2-Alexa 488 anti-CSP immunostaining (yellow) for cultured parasites. Box plots show interquartile range, whiskers show the 95% intervals.
Figure 1—figure supplement 1
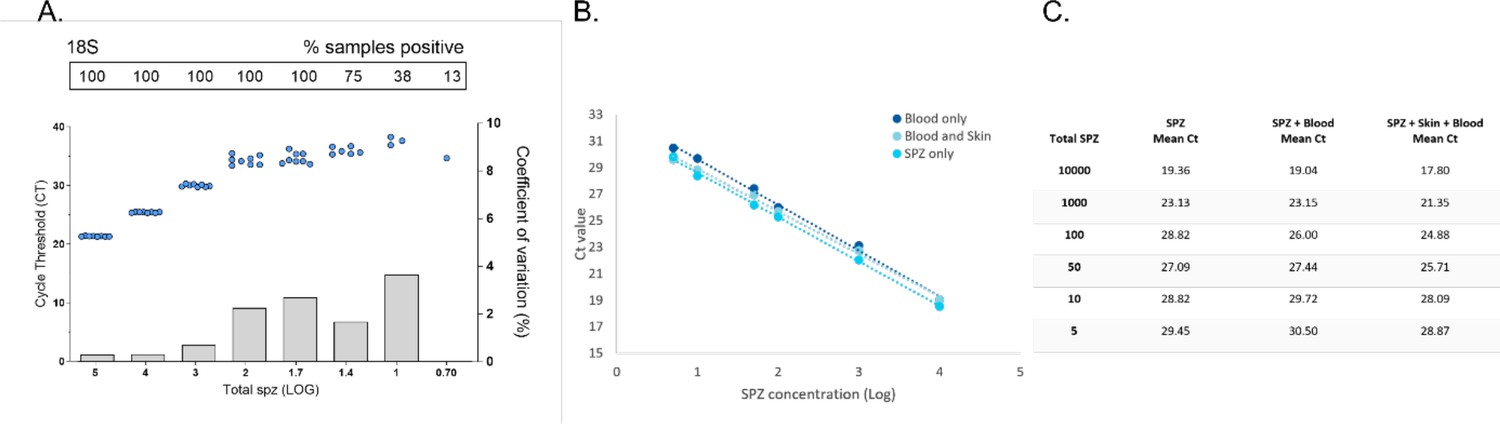
qPCR performance on extracted P. falciparum sporozoites (SPZ) targeting the 18S rRNA gene, and DNA extraction/quantification of P. falciparum SPZ from artificial skin.
A serial dilution of SPZ was prepared as described in ‘Materials and methods’ and run in octuplicate to assesses the limit of detection (LOD) and limit of quantification (LOQ) for qPCR targeting 18S. (A) Dots represent sample cycle threshold (left y-axis) and bars the coefficient of variation (right y-axis). For each serial dilution, Ct sample positivity is shown as the percentage of the total number of replicates analyzed. The LOD was set at 100% sample positivity, which was 50 SPZ per sample. The LOQ was set at 100% sample positivity, with a coefficient of variation (COV) <2. For 18S, this was 1000 SPZ per sample (COV 0.71%). (B) Next to test if Integra bovine collagen artificial skin would be suitable as a mosquito feeding membrane to collect expelled SPZ we first tested DNA extraction and quantification from this material. Serial dilutions of SPZ were prepared in phosphate-buffered saline (PBS) and human blood. To compare DNA extraction efficiency, three conditions were tested in duplicate and compared by COX-1 qPCR; SPZ diluted in PBS, SPZ diluted in whole-blood, and SPZ diluted in whole-blood spotted on artificial skin. The amount of SPZ in the sample (x-axis, log 10) plotted against the qPCR Ct value (y-axis) for tested conditions. (C) The amount of SPZ in sample and mean Ct of the three assessed conditions. SPZ serial dilutions in PBS and human blood showed comparable Ct values. SPZ in blood spotted on artificial skin showed slightly lower Ct values, indicating that SPZ can be efficiently extracted from skin without loss of signal. Detection was possible down to approximately five SPZ.
Figure 2
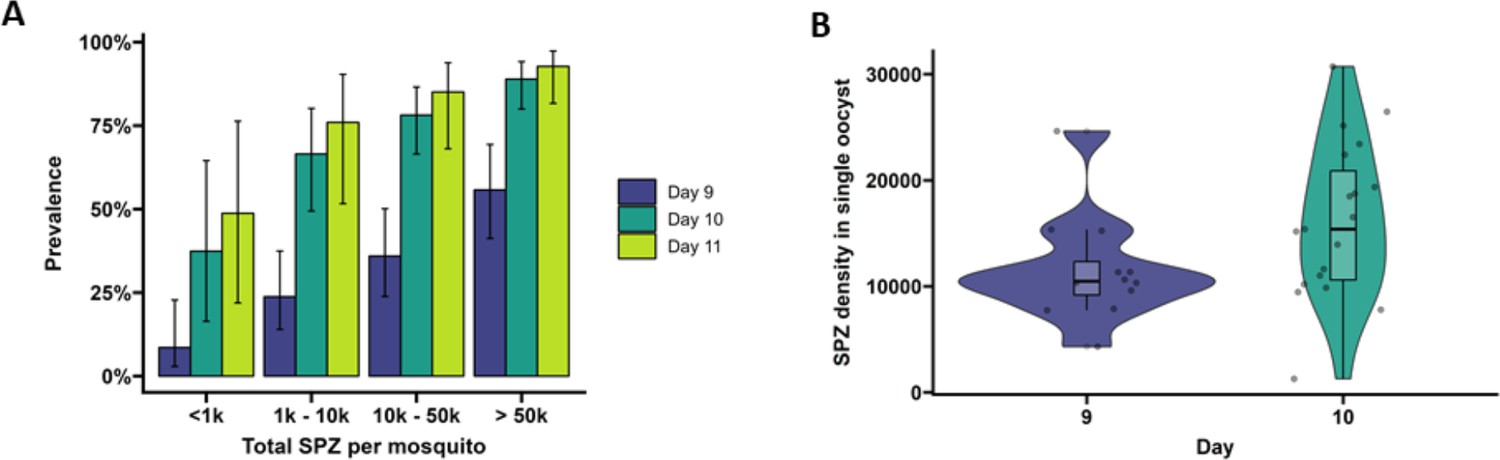
Extrinsic incubation period in high- versus low-infected mosquitoes.
(A) Total sporozoites (SPZ) per mosquito in body plus salivary glands (x-axis) were binned by infection load <1k; 1k–10k; 10k–50k; >50k and plotted against the proportion of mosquitoes (%) that were SPZ positive (y-axis) as estimated from an additive logistic regression model with factors day and SPZ categories. In total, 120, 120, and 40 mosquitoes were dissected on days 9 (blue), 10 (dark green), and 11 (light green), respectively. Error bars show the 95% confidence intervals. (B) Violin plots of SPZ density in single oocysts dissected on days 9 (purple) and 10 (green). The box indicates the interquartile range (IQR) (Q1 and Q3 quartiles) and the median. Lines extending Q1 and Q3 quartiles indicate the range of the data within 1.5× IQR.
Figure 3 with 1 supplement
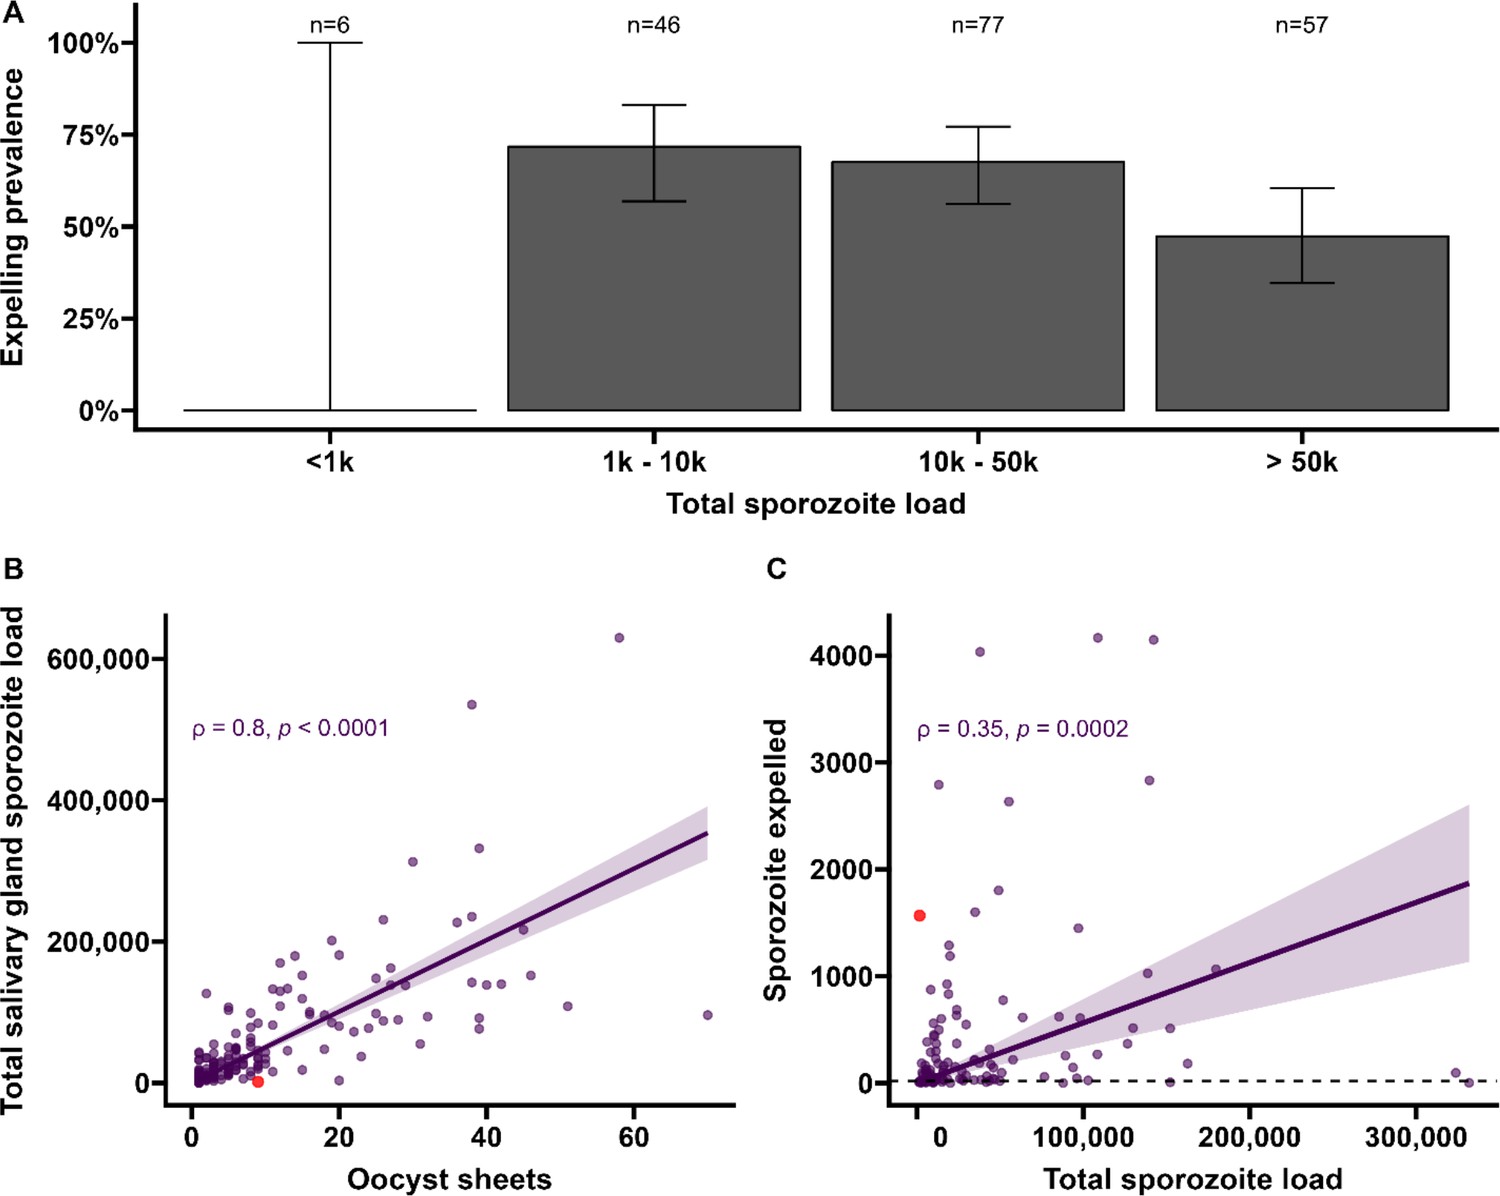
Sporozoite expelling in relation to infection burden in Anopheles stephensi mosquitoes infected with cultured gametocytes.
(A) Binning of mosquitoes by total sporozoite load and expelling prevalence (N = 186). (B) The number of ruptured oocysts stained by 3SP2-Alexa 488 anti-CSP and fluorescent microscopy (x-axis) in relation to total salivary gland sporozoite density (y-axis), assessed by COX-1 qPCR; ρ = 0.80 (CI, 0.74–0.85, p<0.0001). The red dot indicates a mosquito which had 9 ruptured oocysts but only 126 residual salivary glands sporozoites while it expelled 1567 sporozoites. Considering the high number of ruptured oocysts in the midgut, it is possible that some lobes of salivary glands were missed during dissection and sporozoite load was underestimated by qPCR. (C) Total sporozoite density (residual salivary gland sporozoites + sporozoites expelled, x-axis) in relation to the number of expelled sporozoites (y-axis) by COX-1 qPCR ρ = 0.35 (CI, 0.17–0.50, p=0.0002). The dotted line on the x-axis shows the threshold of qPCR detection of 20 sporozoites. The line represents the fitted linear regression line, the intercept is forced to zero for biological plausibility, and the gray shaded area is the 95% CI.
-
Figure 3—source data 1
Source data include re-analyses of correlation coefficients when different thresholds for data inclusion are imposed to determine whether associations are robust.
- https://cdn.elifesciences.org/articles/90989/elife-90989-fig3-data1-v1.docx
Figure 3—figure supplement 1
Sporozoite expelling in relation to infection burden.
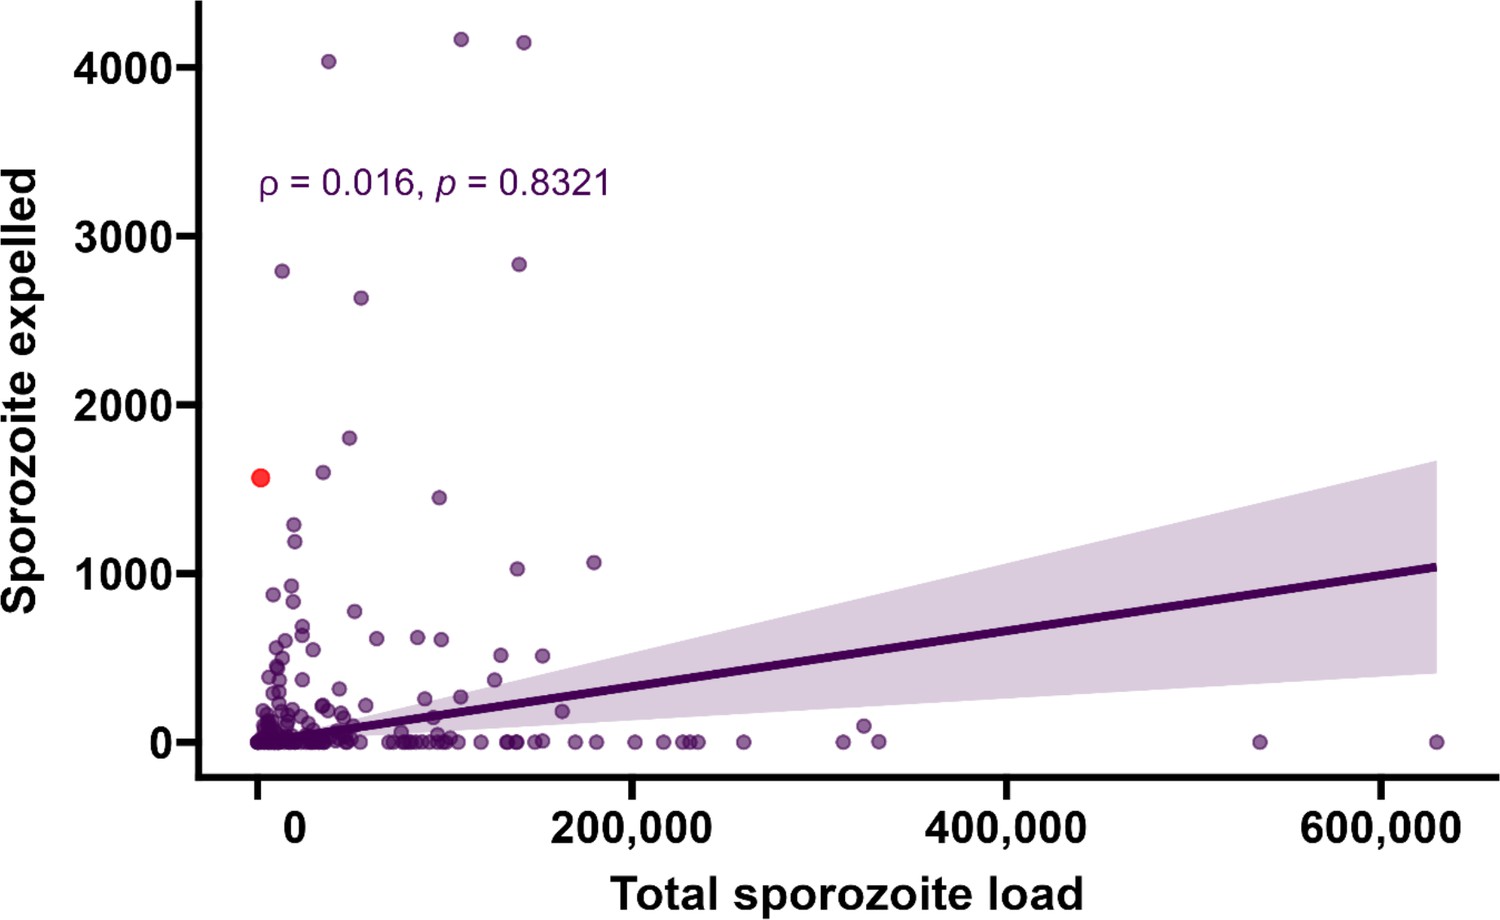
Total sporozoite density (residual salivary gland sporozoites + sporozoites expelled, x-axis) in relation to the number of expelled sporozoites (y-axis) by COX-1 qPCR (ρ = 0.016, 95% CI, –0.12 to 0.16, p=0.8321). This figure includes 26 observations from mosquitoes that did not expel any sporozoites; these observations were excluded from the main text. The line represents the fitted linear regression line, the intercept is forced to zero for biological plausibility, and the shaded area is the 95% CI.
Figure 4
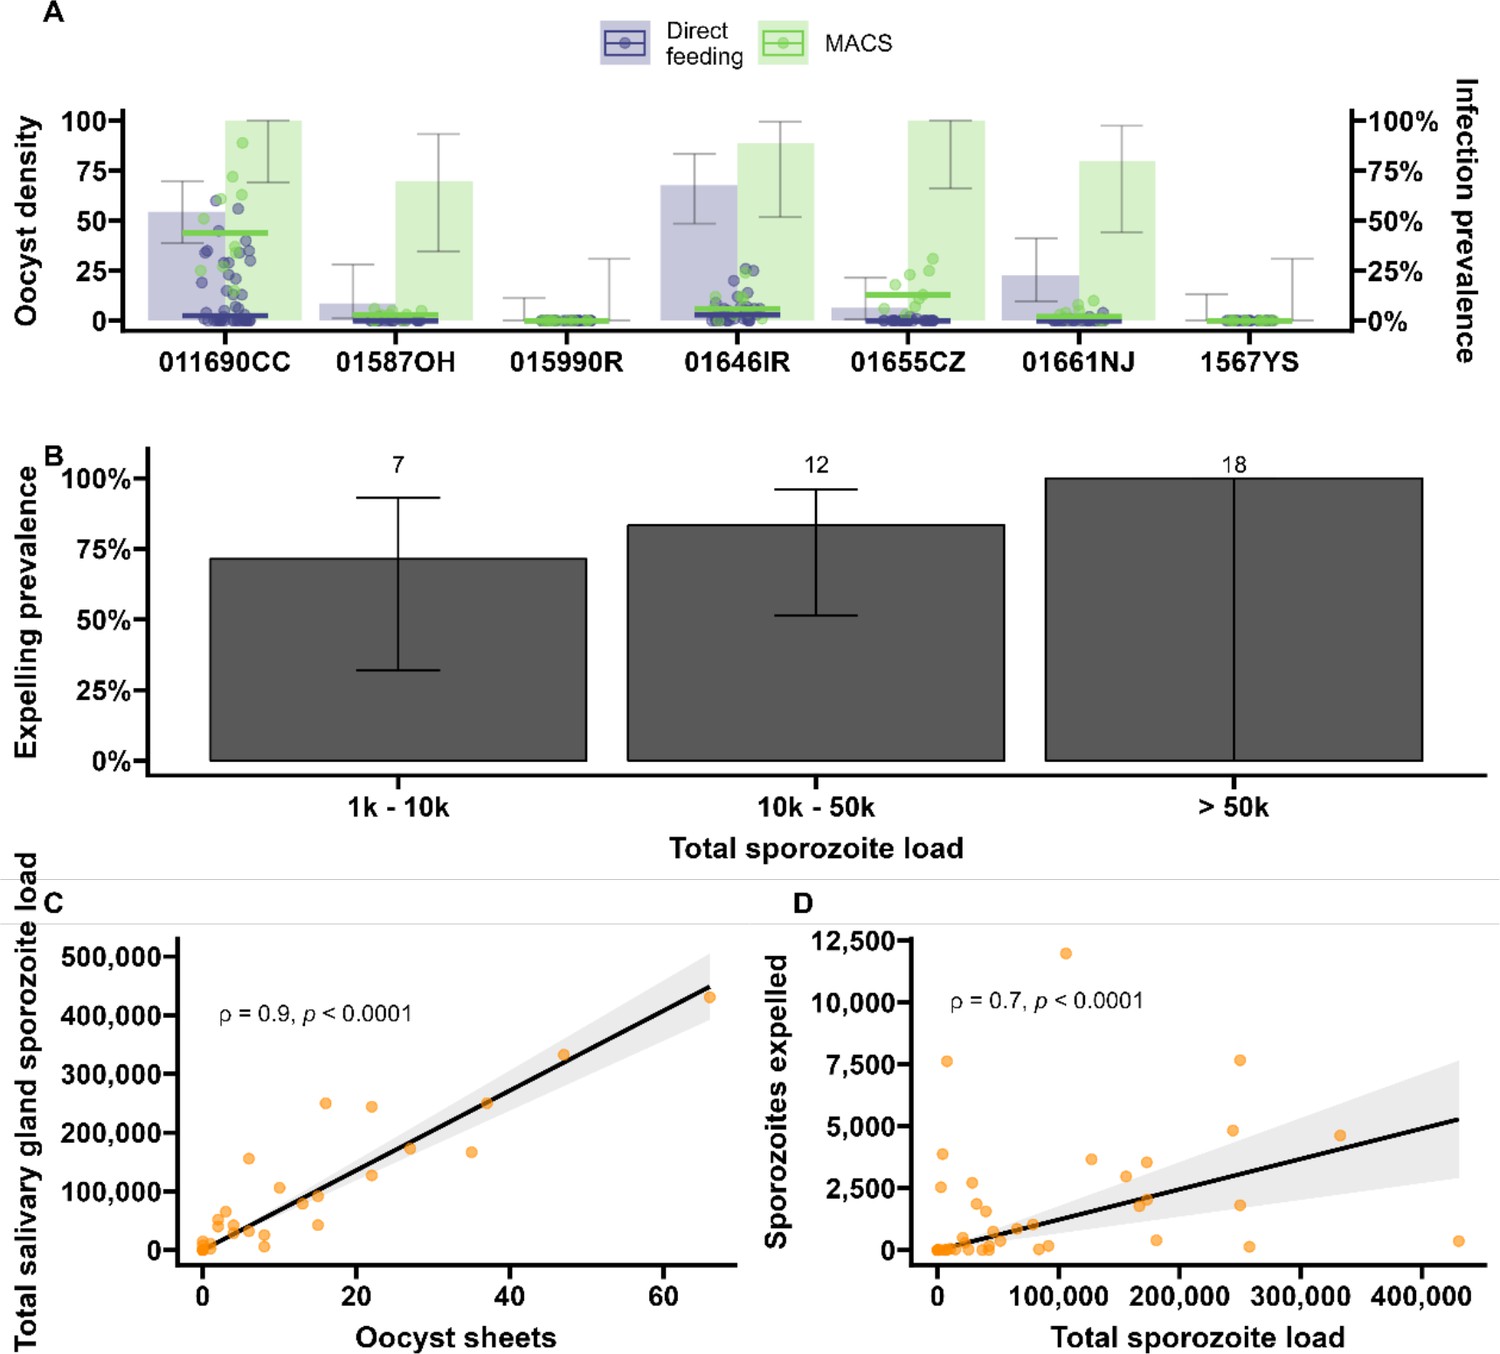
Sporozoite expelling in relation to infection load in Anopheles coluzzii mosquitoes infected by naturally acquired gametocyte infections in Burkina Faso.
(A) Direct feeding (blue) vs magnetic-activated cell sorting (MACS; green). Bars show the infection prevalence for each of the seven gametocyte carriers. Scatter plots with median lines show the midgut oocyst density as a result of direct feeding (blue) and MACS (green). (B) Binning of total sporozoite load and expelling prevalence (N = 25). (C) Scatter plot of absolute numbers of ruptured oocyst (sheet) density assessed by fluorescent microscopy vs total salivary gland sporozoite density assessed by COX-I qPCR; ρ = 0.90 (95% CI, 0.80–0.95). The line represents the fitted linear regression line and the gray shaded area is the 95% CI. (D) Scatter plot of absolute numbers of total sporozoite density (residual salivary gland sporozoites + sporozoites expelled) and sporozoites expelled into the artificial skin assessed by COX-I qPCR; ρ = 0.70 (CI, 0.52–0.82). The line represents the fitted linear regression line, the intercept is forced to zero for biological plausibility, and the gray shaded area is the 95% CI.
-
Figure 4—source data 1
Source data include re-analyses of correlation coefficients when different thresholds for data inclusion are imposed to determine whether associations are robust.
- https://cdn.elifesciences.org/articles/90989/elife-90989-fig4-data1-v1.docx
Figure 5
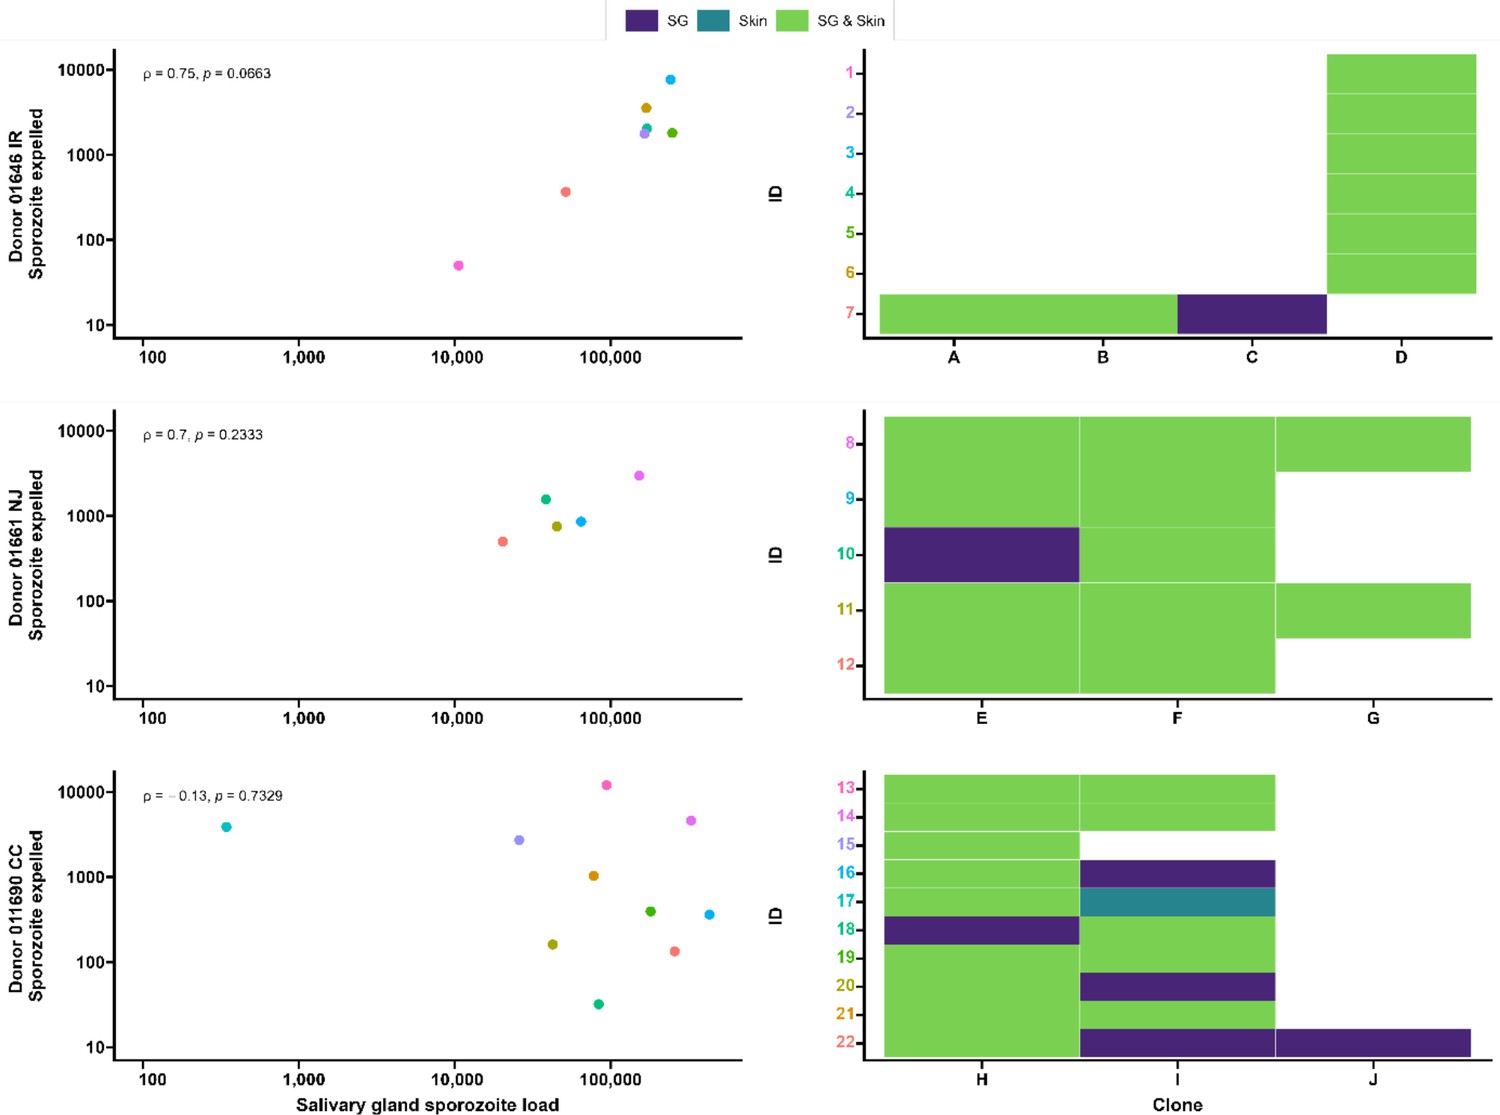
Clonal complexity of P. falciparum infections in salivary glands and artificial skins following probing by mosquitoes infected by gametocyte carriers who were naturally infected in Burkina Faso.
Clonal data for three donors: 01646 IR (top row), 01661 NJ (middle row), and 011690 CC (bottom row). Left panel shows scatter plots for the association between sporozoite salivary gland load and expelled sporozoites in skin, with a Spearman’s rank correlation across samples from each donor. Right panel shows clonal data for each donor sample in a heatmap plot. The colored numbers on y-axes correspond to the color of the sample in the scatter plot. Purple indicates the presence of a clone in the salivary gland only, turquoise indicates the presence of a clone in the skin only, and green indicates the presence of a clone in both salivary gland and skin.
Figure 6
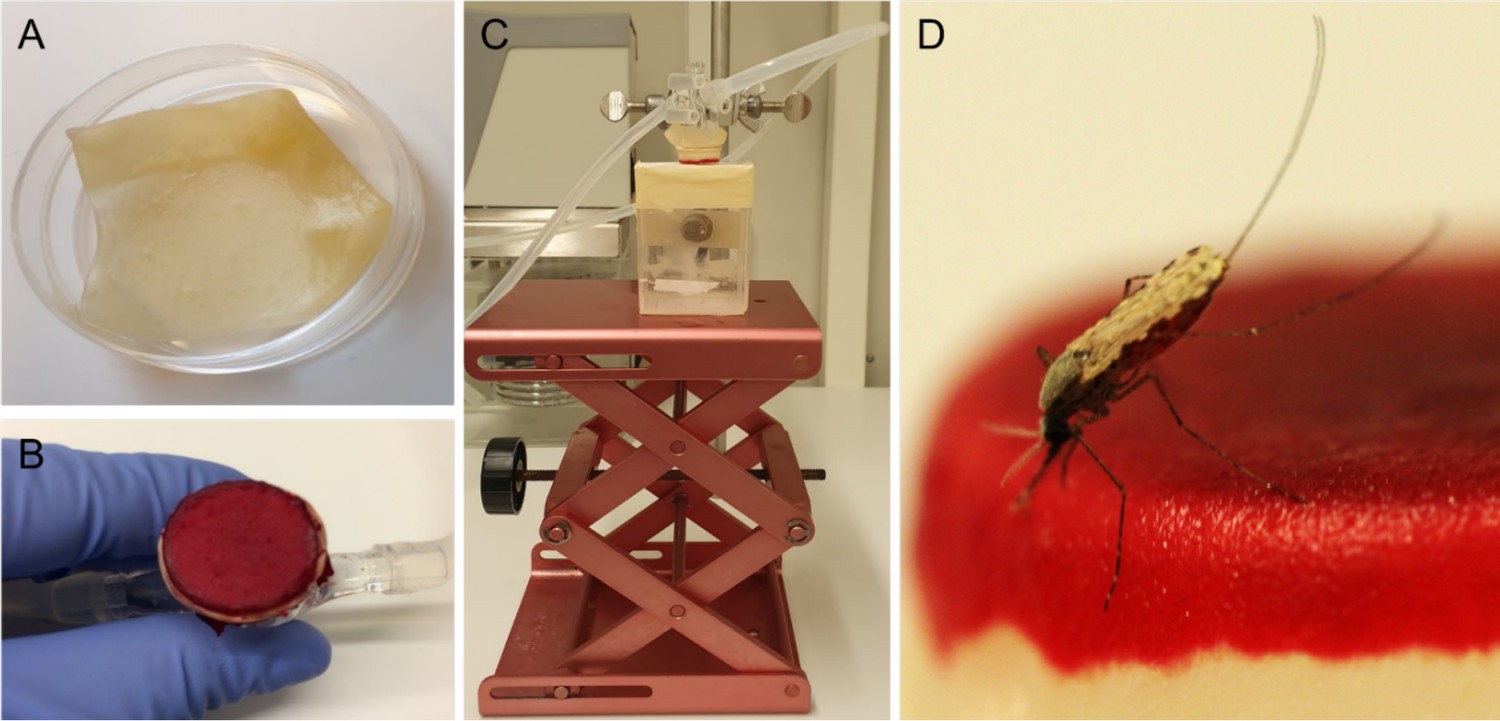
Artificial skin feeding procedure.
(A) Petri dish filled with sterile nuclease-free water, containing the artificial skin. (B) Skin folded around a mini-feeder and supplemented with 100 µl of human blood. (C) Feeding setup with adjustable table and a small Perspex cage containing a single mosquito underneath. (D) A blood-feeding mosquito on artificial skin.
Download links
A two-part list of links to download the article, or parts of the article, in various formats.
Downloads (link to download the article as PDF)
Open citations (links to open the citations from this article in various online reference manager services)
Cite this article (links to download the citations from this article in formats compatible with various reference manager tools)
Quantification of sporozoite expelling by Anopheles mosquitoes infected with laboratory and naturally circulating P. falciparum gametocytes
eLife 12:RP90989.
https://doi.org/10.7554/eLife.90989.3


