Neurophysiological trajectories in Alzheimer’s disease progression
- Biomagnetic Imaging Laboratory, Department of Radiology and Biomedical Imaging, University of California, San Francisco, United States
- Medical Imaging Business Center, Ricoh Company Ltd, Japan
- Memory and Aging Center,UCSF Weill Institute for Neurosciences, University of California, San Francisco, United States
- Signal Analysis Inc, Japan
- Department of Radiology and Biomedical Imaging, University of California, San Francisco, United States
- Mary S. Easton Center for Alzheimer’s Research and Care, Department of Neurology, David Geffen School of Medicine, University of California, Los Angeles, United States
Figures
Figure 1 with 4 supplements
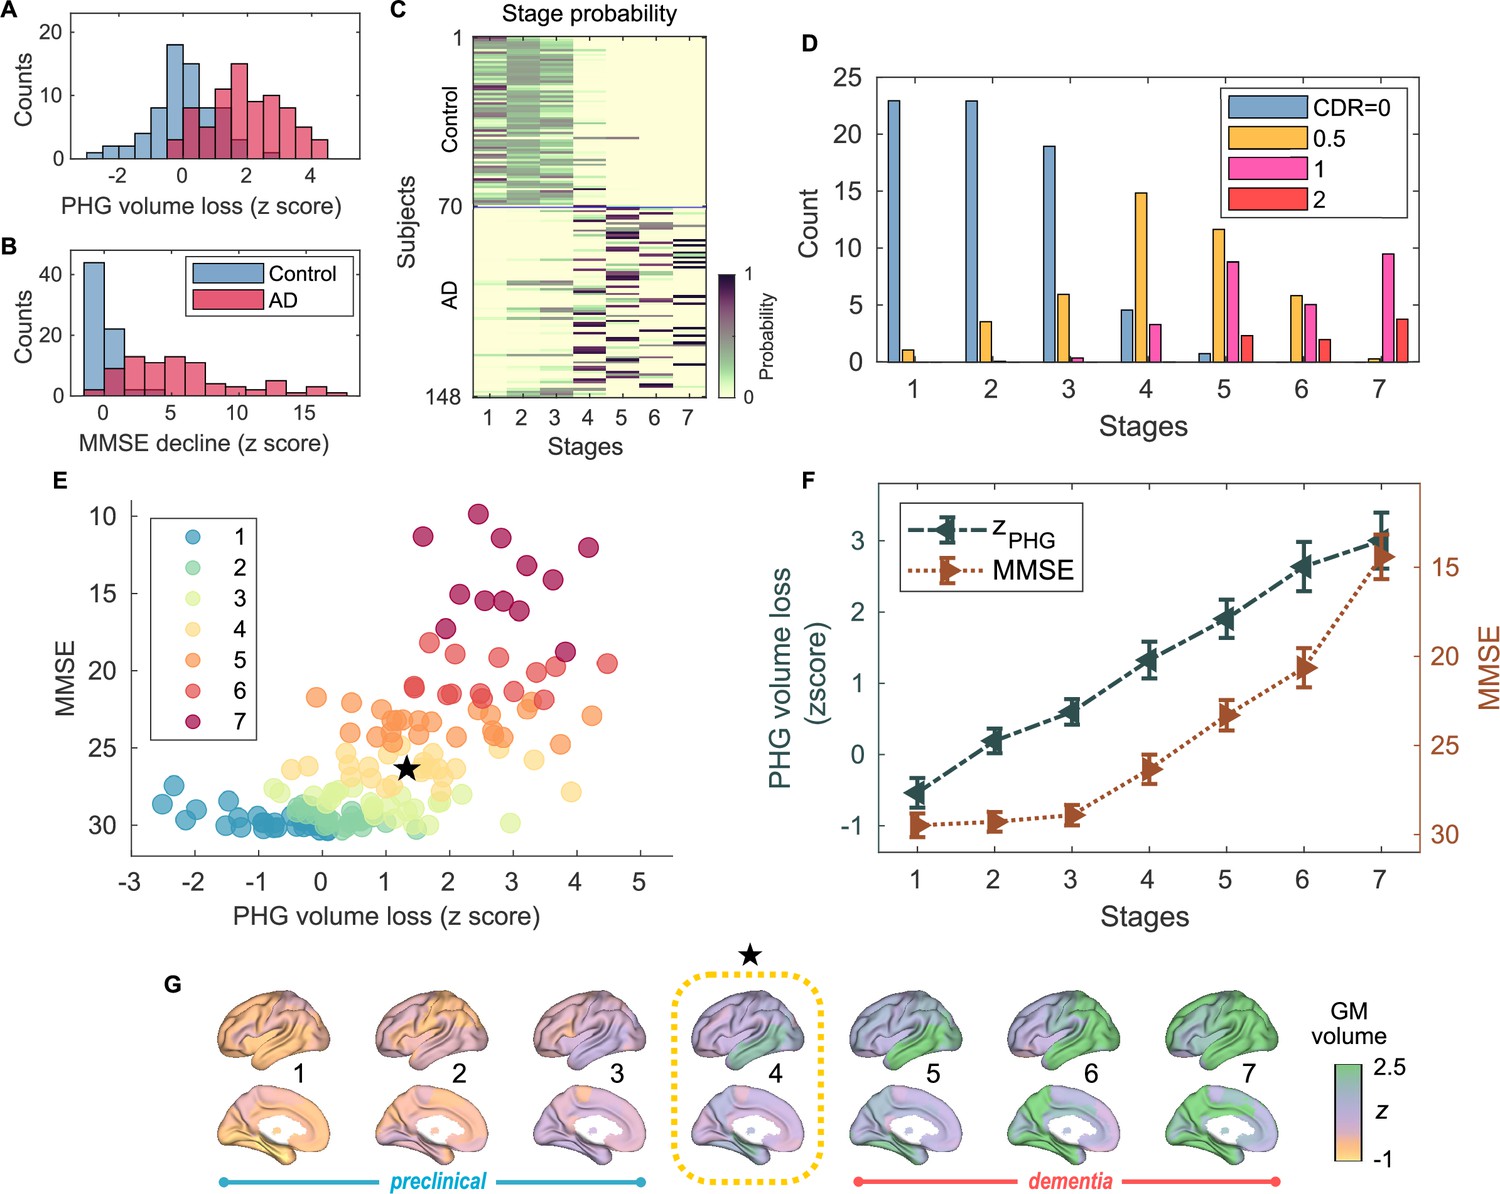
Atrophy-cognition event-based sequencing model (EBM) staging of Alzheimer’s disease (AD) progression.
(A) Histogram of parahippocampal gyrus (PHG) volume loss -scores, . (B) Histogram of mini-mental state examination (MMSE)-decline -scores, . The -scores for PHG volume loss and MMSE were standardized by the adjusted scores of the control group and sign-inverted so that higher -scores denote more severity. (C) Posterior probabilities, , that a subject belongs to a stage evaluated by the Atrophy-Cognition EBM (AC-EBM). (D) The ratio of subjects classified to each stage; blue: Control (clinical dementia rating, CDR 0), orange: MCI due to AD (CDR 0.5), pink: mild AD dementia (CDR 1), and red: moderate AD dementia (CDR 2). (E) Distribution of the stages in the space spanned by PHG volume loss and MMSE score. Each subject was distinctly assigned to one of the stages with the highest posterior probability, . The colors of the dots denote the seven stages. A star symbol denotes the probability-based weighted means of and MMSE scores at stage 4 and MMSE . The values in parentheses denote the standard error (SE; Equation 5) of the weighted means. (F) Trajectories of PHG volume loss and MMSE score as a function of the seven stages. Probability-based weighted means (± SE) are shown. The initial and final -scores used in the AC-EBM were: for PHG volume loss and for MMSE decline, respectively. (G) Progression of GM volume loss (-scores) from stage 1–7. Regional gray matter (GM) atrophy in the predicted stage of mild cognitive impairment (MCI) (stage 4) was circled with a dotted line.
Figure 1—figure supplement 1
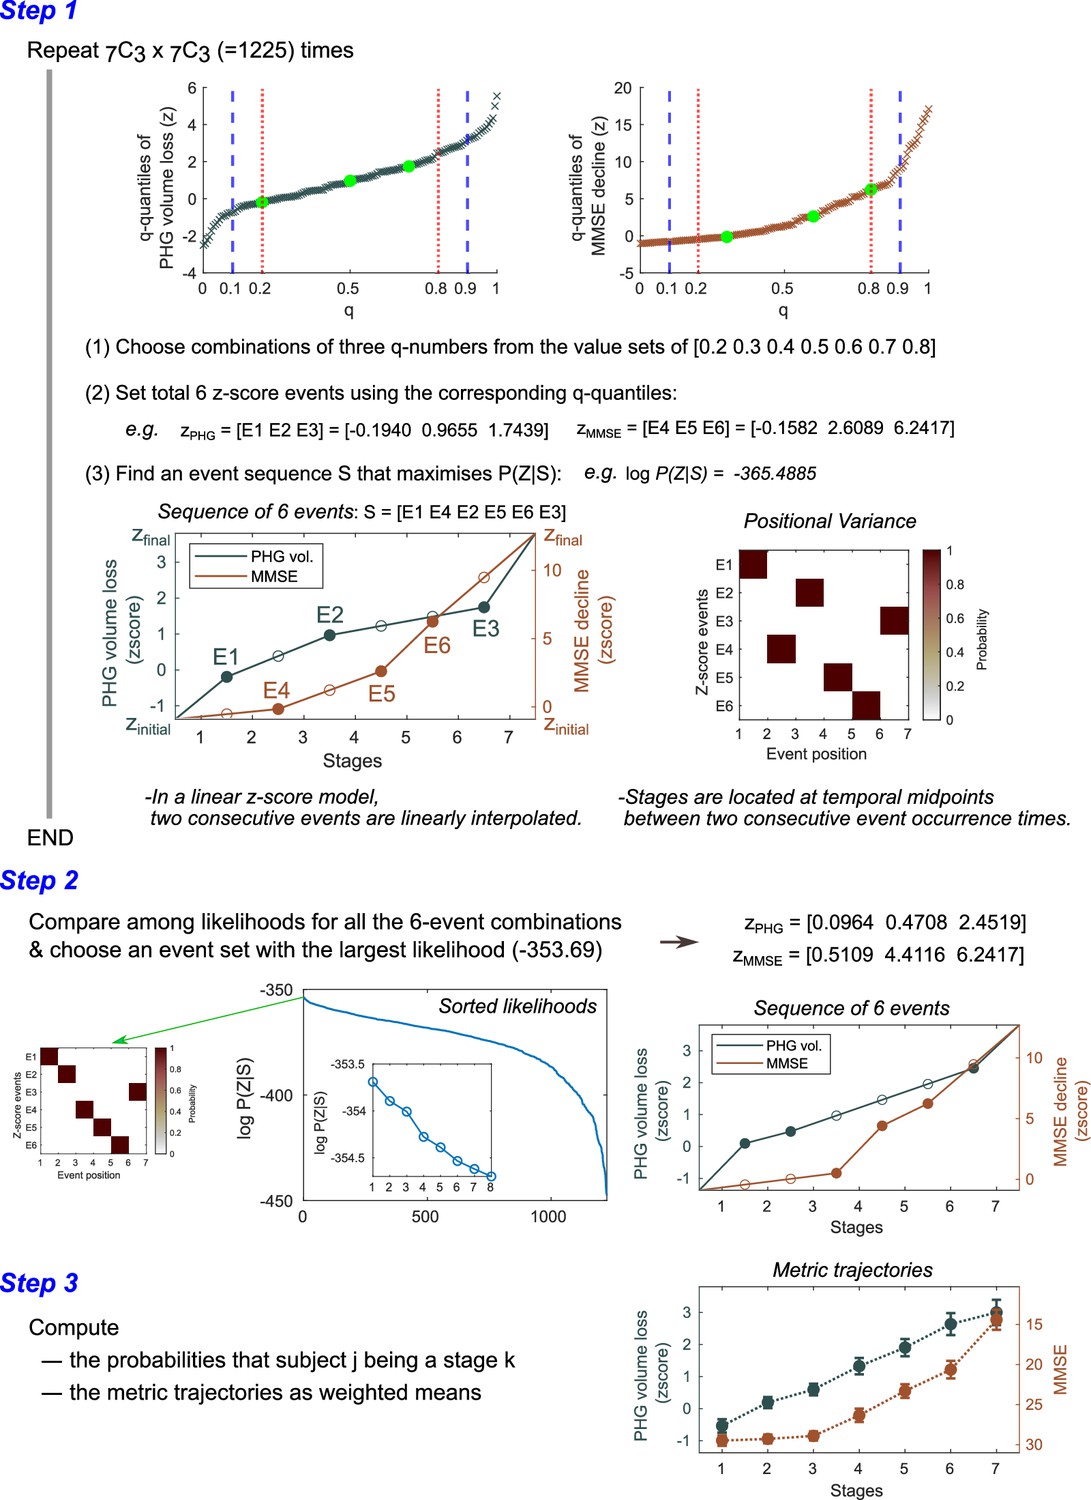
Steps for computing metric trajectories.
The metrics-trajectory computation steps in the Atrophy-Cognition EBM (AC-EBM) are illustrated. Similar steps were executed for the SAC-EBMs. In an SAC-EBM, the number of iterations in Step 1 was . A diagram shown at the bottom of Step 1 represents the relationship between the events and stages in a linear -score model. A stage is located between two consecutive event occurrence times and its model value () is given by a midpoint value. When a total of events is set, the models provide event-based sequencing model (EBM) stages. Positional variance diagrams of the -score events created from the 50,000 Markov chain Monte Carlo (MCMC) samples indicated that there was no uncertainty in the predicted positions of selected -score events. Another example of positional variance with positional uncertainty has been shown in Figure 1—figure supplement 3.
Figure 1—figure supplement 2

An example of positional variance diagram of -score events.
The -score events, and, were selected. Markov chain Monte Carlo (MCMC) sampling (50,000 samples) was performed to find an optimal sequence of events. It should be noted that this set of -score events was not used in the Atrophy-Cognition EBM (AC-EBM) shown in the main text. This figure is intended to show just an example of positional variance diagrams with positional uncertainty. In the AC-EBM shown in the main text, we obtained the positional variance diagrams without positional uncertainty for the optimal sets of -score events (Figure 1—figure supplement 3).
Figure 1—figure supplement 3

Group comparisons of parahippocampal gyrus (PHG) volumes and mini-mental state examination (MMSE) scores.
(A) Group comparison of PHG volume [unpaired -test: t(143) = -9.508; ***p < 0.001] based on -statistic while adjusting for the effects of total intracranial volume (TIV), age, and the difference between MRI and magnetoencephalography (MEG) dates. The PHG volume was defined as the sum of the volumes of PHGs from the left and right hemispheres. The average PHG volume in patients with Alzheimer’s disease (AD) was , and the average PHG volume in controls . (B) Group comparison of mini-mental state examination (MMSE) scores [unpaired -test: t(144) = -10.171; ***p < 0.001] based on -statistic while adjusting for the effects of age and the difference between MMSE and MEG dates. MMSEs were performed within an average of 0.48 years (range: -2.83–1.50) and 0.22 years (range: -1.52–1.01) of the evaluation of MEG for controls and patients, respectively.
Figure 1—figure supplement 4
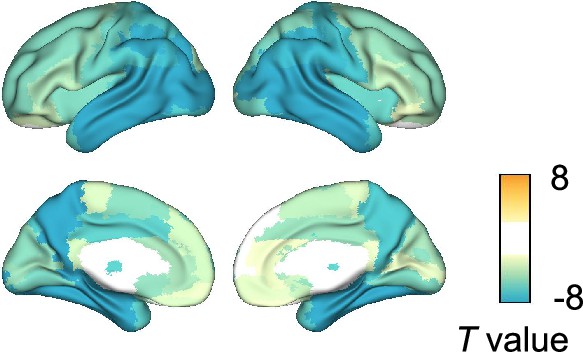
Group comparison of gray matter (GM) volumes.
Group comparisons of GM volume for each of the 94 anatomical regions included in the Automated Anatomical Labeling 3 (AAL3) atlas were performed by computing - and -values using general linear models (GLMs) with total intracranial volume (TIV), age, and the difference between MRI and magnetoencephalography (MEG) dates as covariates. Eighty-seven regional GM volumes were significantly smaller in patients with Alzheimer’s disease (AD) than in controls, especially in the temporal regions. -values exceeding threshold (, false discovery rate (FDR) corrected) were displayed. Top 10 regions with significant group differences are listed in Supplementary file 4.
Figure 2 with 3 supplements
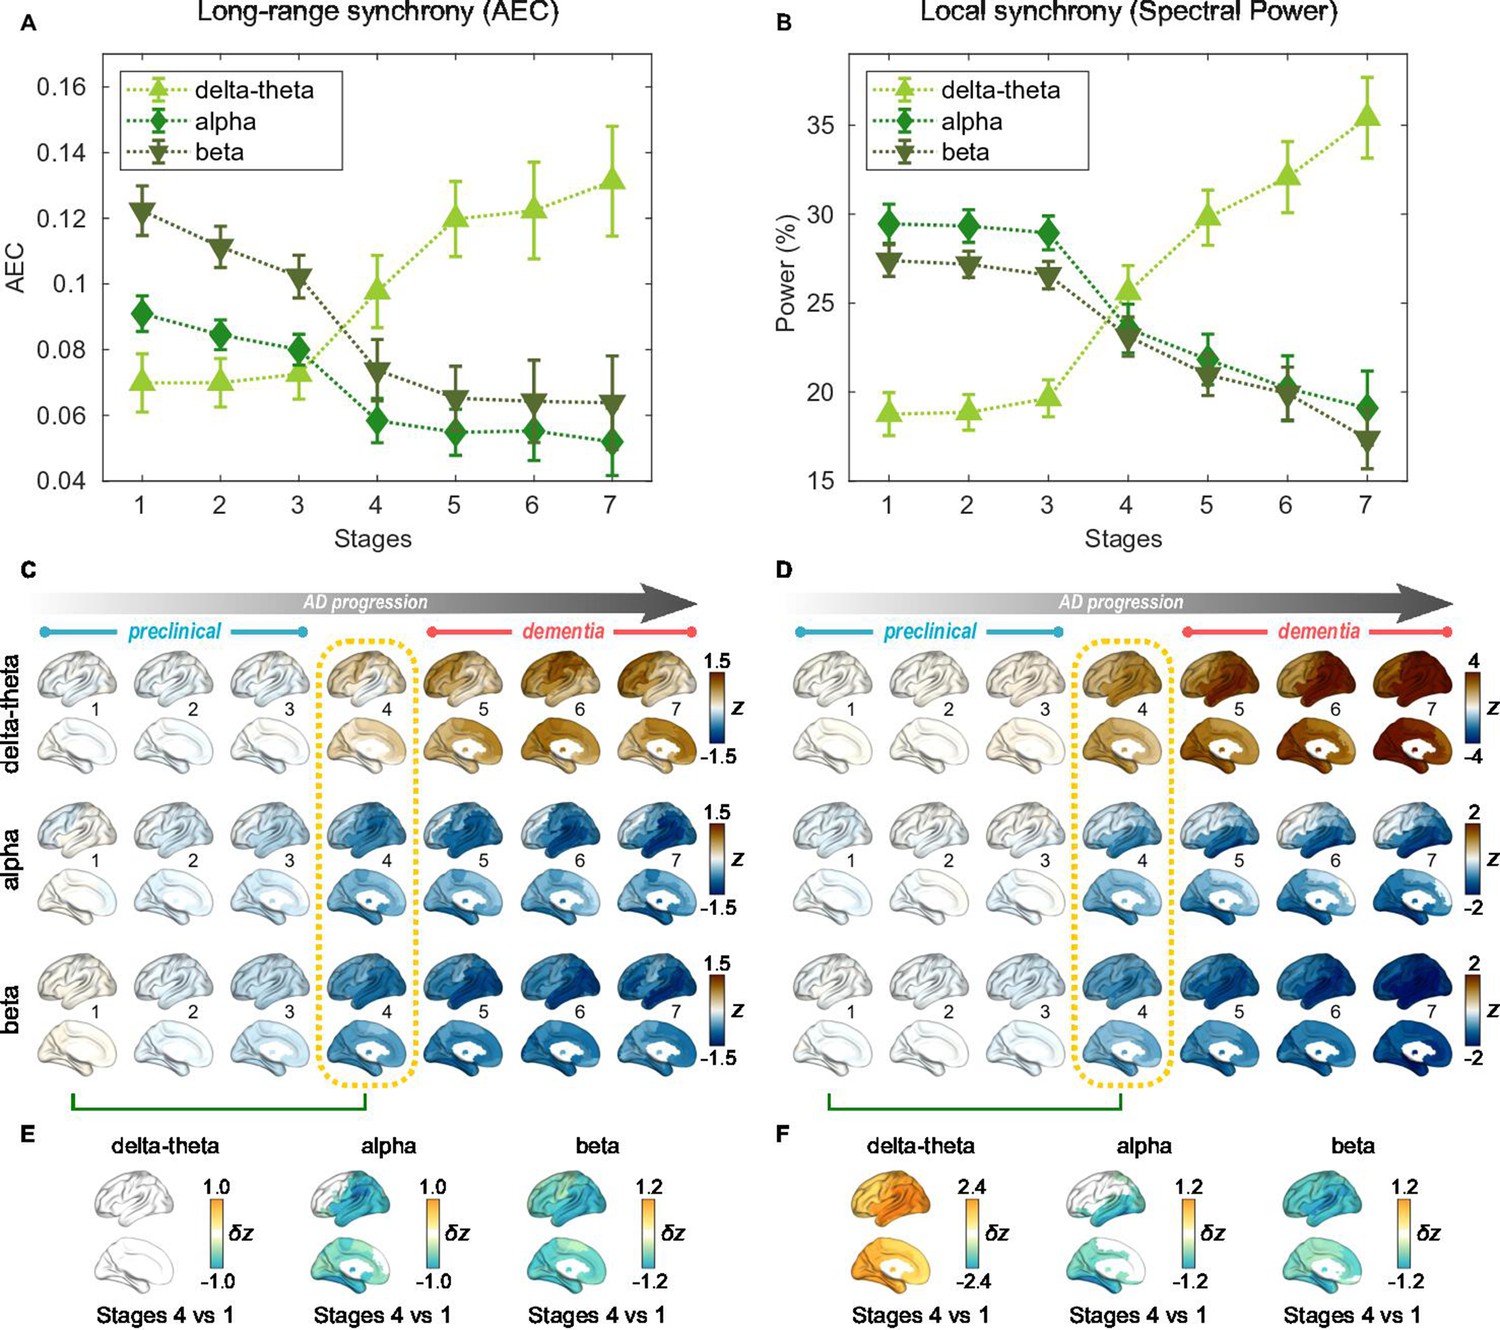
Profiles of neural synchrony as a function of the Alzheimer’s disease (AD) stages estimated by Atrophy-Cognition EBM (AC-EBM).
(A,B) Profiles of amplitude-envelope correlation (AEC) (A) and spectral power (B) as a function of the seven stages, showing probability-based weighted means (± SE). Neural synchrony increased monotonously with AD progression in the delta-theta band and decreased monotonously in the alpha and beta bands. (C,D) Regional AEC (C) and spectral power (D) as a function of the seven stages. Deviations from the neural-synchrony spatial patterns averaged over the controls are displayed. The deviations were evaluated using the probability-based weighted means of -scores standardized by the controls. Spatial patterns in the mild cognitive impairment (MCI) stage (stage 4) were circled with dotted lines. (E,F) Changes in neural synchrony during the preclinical stages. Regional comparisons between two stages (stages 4 vs 1) are shown based on non-parametric tests of weighted mean differences . Differences that exceed the threshold () are displayed. There were no significant differences in long-range synchrony in the delta-theta band.
Figure 2—figure supplement 1

Normalized power spectral densities (PSDs) for the Alzheimer’s disease (AD) and control groups.
Power spectral densities (PSDs) were averaged in all regions of the brain (94 Automated Anatomical Labeling 3, AAL3 atlas) for controls and AD patients, respectively. Their 95% confidence intervals are also shown. The shaded areas in the frequency axis denote the canonical frequency bands: delta-theta (2–7 Hz), alpha (8–12 Hz), and beta (15–29 Hz) bands. In terms of the average PSD in AD, a clear alpha peak disappeared. Alpha frequencies in each region in AD patients generally decrease (i.e. alpha slowing) compared to controls. The magnitude of alpha slowing depends on brain regions as well as AD severity; for example, alpha slowing is prominent in temporal regions. Averaging over PSD curves with different alpha peaks results in the disappearance of an alpha peak in the average PSD in patients with AD.
Figure 2—figure supplement 2
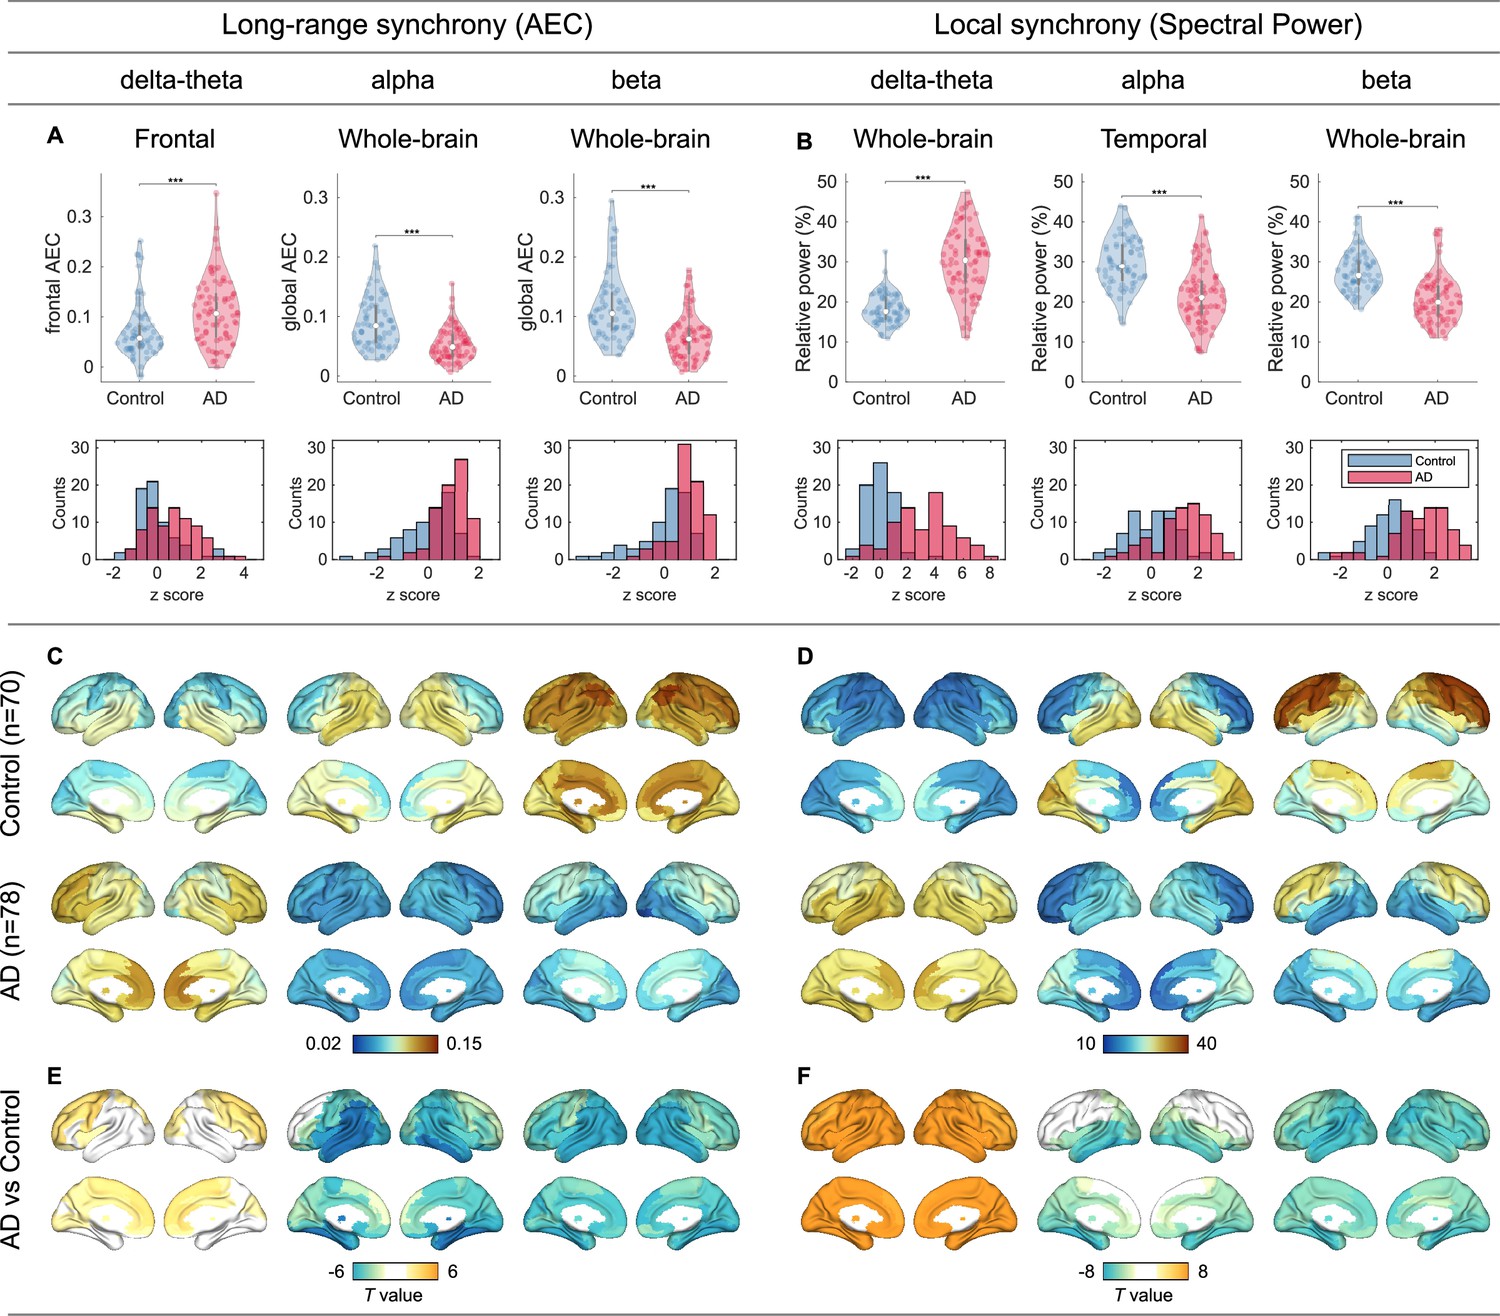
Group comparisons of magnetoencephalography (MEG) metrics.
(A,B) Group comparisons (violin plots) and -score histograms of the six scalar MEG metrics: [i] frontal delta-theta-band amplitude-envelope correlation (AEC), [ii] whole-brain alpha-band AEC, [iii] whole-brain beta-band AEC, [iv] whole-brain delta-theta-band spectral power, [v] temporal alpha-band spectral power, and [vi] whole-brain beta-band spectral power. Group comparisons were performed by -statistics while adjusting for the effect of age (***p < 0.001). In terms of the -scores of the scalar MEG metrics, raw -score values in alpha and beta bands were negative in patients with AD, and therefore we defined, multiplying the values by -1 so that higher -scores denote more severity. The sign-inverted -scores were included in the SAC-EBMs. (C–F) Group comparisons of the regional MEG metrics based on -statistic maps of region-wise comparisons (94 Automated Anatomical Labeling 3 , AAL3-atlas regions) while adjusting for the effect of age. For the regional AECs, we considered the connectivity strengths of each ROI. The unit of spectral power is a percentage of total power. -values exceeding thresholds ( for long-range synchrony (E) and for local synchrony (F), false discovery rate,FDR corrected) are displayed. The top 10 regions with significant group differences in long-range (E) and local (F) synchrony are listed in Supplementary file 5 and Supplementary file 6, respectively.
Figure 2—figure supplement 3

Frontal and temporal regions of interest.
The regions of interests (ROIs) were based on group differences in neural synchrony metrics between patients with Alzheimer’s disease (AD) and controls. ROIs were selected symmetrically for the left and right hemispheres from the regions where large group contrasts were identified (see Figure 2—figure supplement 3E). (F). For the frontal delta-theta-band amplitude-envelope correlation (AEC), 12 subregions were chosen mainly from the frontal area: left and right precentral, superior frontal (dorsolateral/medial), middle frontal, anterior cingulate and paracingulate gyri, and supplementary motor areas. For the temporal alpha-band spectral power, 20 subregions were chosen from the temporal area: left and right parahippocampal, lingual, superior/middle/inferior occipital, fusiform, superior/middle/inferior temporal gyri, and precunei.
Figure 3 with 4 supplements
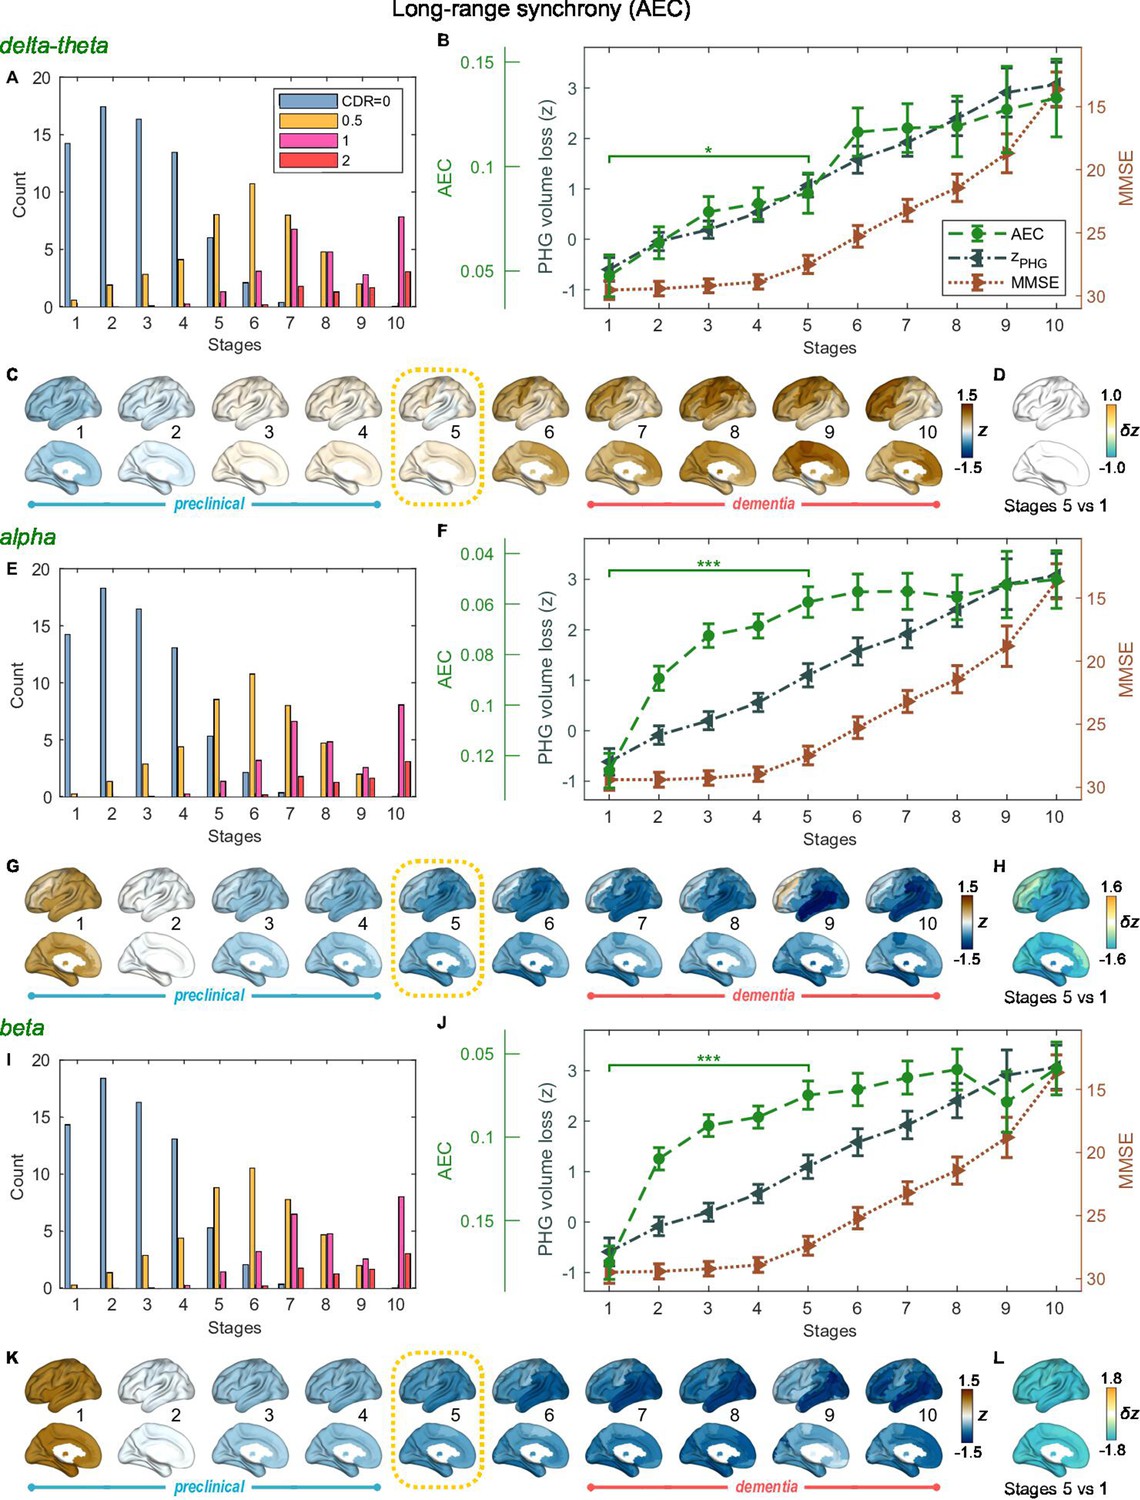
Trajectories of long-range neural synchrony in delta-theta, alpha, and beta-bands from SAC-EBMs.
(A, E, I) The ratio of subjects classified to each stage. The ratio was evaluated on the basis of the probabilities that each subject will be assigned to each of the ten stages. (B, F, J) Trajectories of long-range synchrony, parahippocampal gyrus (PHG) volume loss, and mini-mental state examination (MMSE) score as a function of the ten stages, showing probability-based weighted means (± SE). The asterisks (*q < 0.05 and ***q < 0.001, false discovery rate - FDR corrected) denote statistical significance in comparisons between stages 5 vs 1. All stage pairs with significant weighted mean differences are listed in Supplementary file 9. Initial and final -scores of long-range synchrony used in the SAC-EBMs were: , , and in the delta-theta, alpha, and beta bands, respectively. (C, G, K) Regional amplitude-envelope correlation (AEC) along the stages. The deviations from the regional patterns of the control group are shown. The regional patterns at the onset of the mild cognitive impairment (MCI) stage were circled with dotted lines. (D,H,L) Changes in regional patterns during the preclinical stages. Regional comparisons between two stages are shown based on non-parametric tests of weighted mean differences . Differences exceeding threshold (, FDR corrected) are displayed. The top 10 regions with significant differences are listed in Supplementary file 10.
Figure 3—figure supplement 1
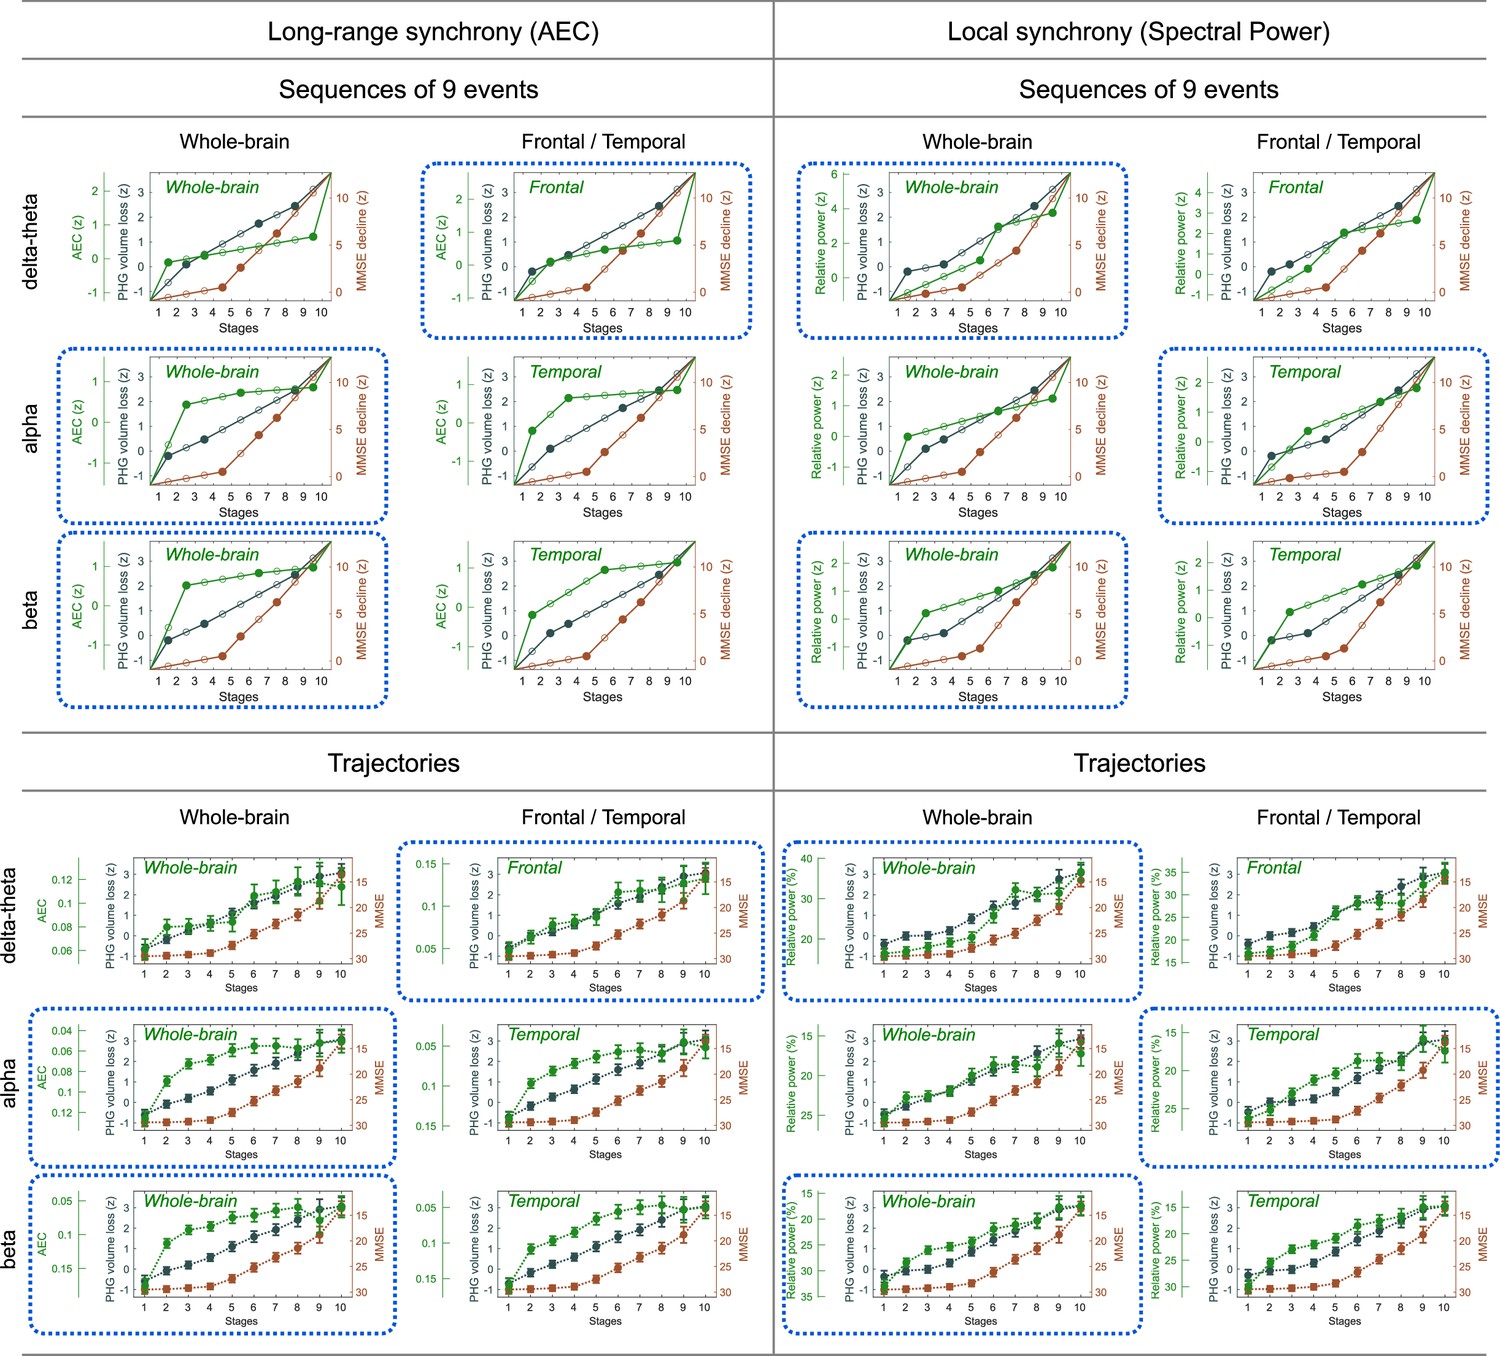
Event sequences and trajectories determined by SAC-EBMs.
Sequences of nine events () are displayed as filled dots. In a linear -score model, two consecutive events for a metric are linearly interpolated. Stages are located at temporal midpoints between two consecutive event occurrence times. The combinations of frequency bands and regions circled by blue dotted lines were considered in the SAC-EBMs described in the main text. The trajectory panels circled by blue dotted lines are the same as the trajectories shown in Figures 3 and 4 of the main text.
Figure 3—figure supplement 2
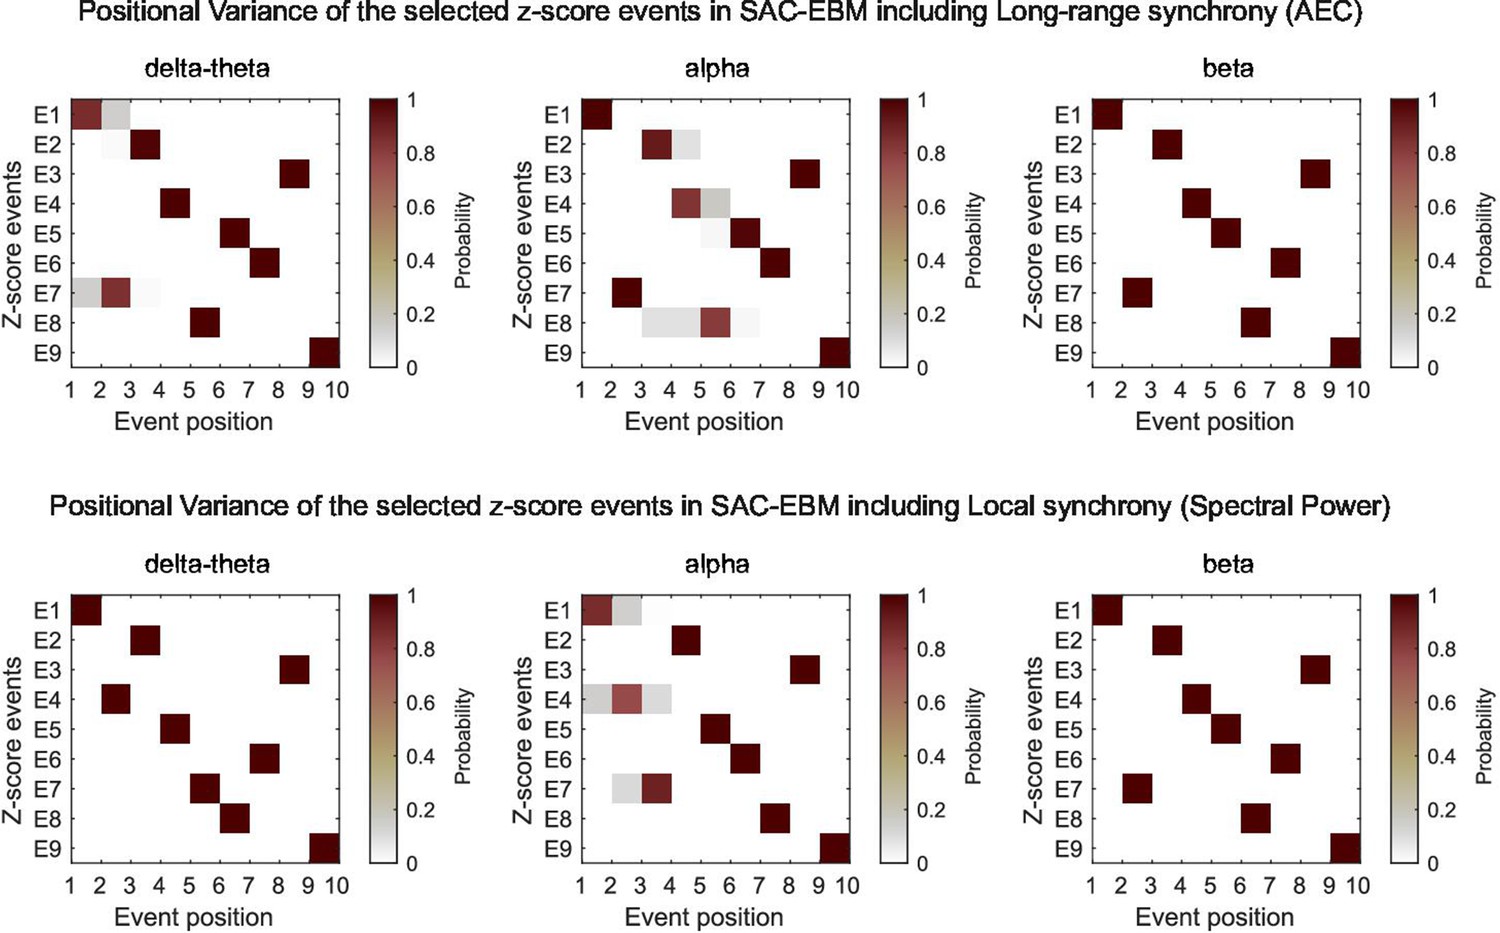
Positional variance diagrams of the -score events in SAC-EBMs.
The SAC-EBMs with the optimal sets of the -scores are shown. The labels of the -score events, E1, E2, , E9, are for the parahippocampal gyrus (PHG) volume loss -scores, the mini-mental state examination (MMSE) decline -scores, and the magnetoencephalography (MEG)-metric -scores, respectively; , , and . Positional variance was evaluated based on the Markov chain Monte Carlo (MCMC) samples of the sequence of the optimal set of -score events, such as Figure 3—figure supplement 3.
Figure 3—figure supplement 3
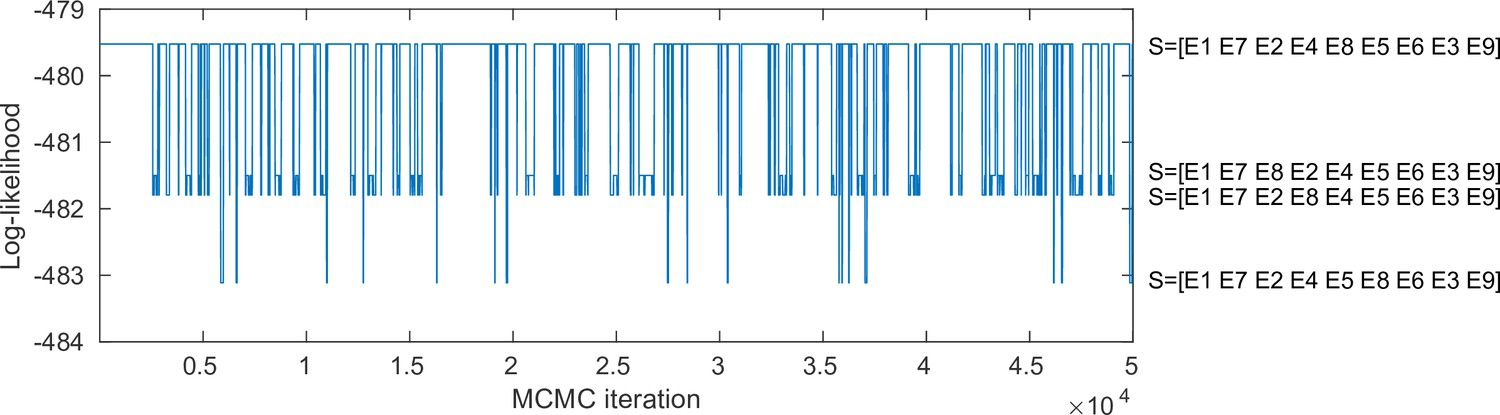
Markov chain Monte Carlo (MCMC) samples of the sequence of the optimal set of -score events in the SAC-EBM including alpha-band amplitude-envelope correlation (AEC).
A positional variance diagram for the SAC-EBM including alpha-band AEC (a upper middle panel in Figure 3—figure supplement 3) was calculated based on this occurrence frequency of the sequence of the -score events.
Figure 3—figure supplement 4
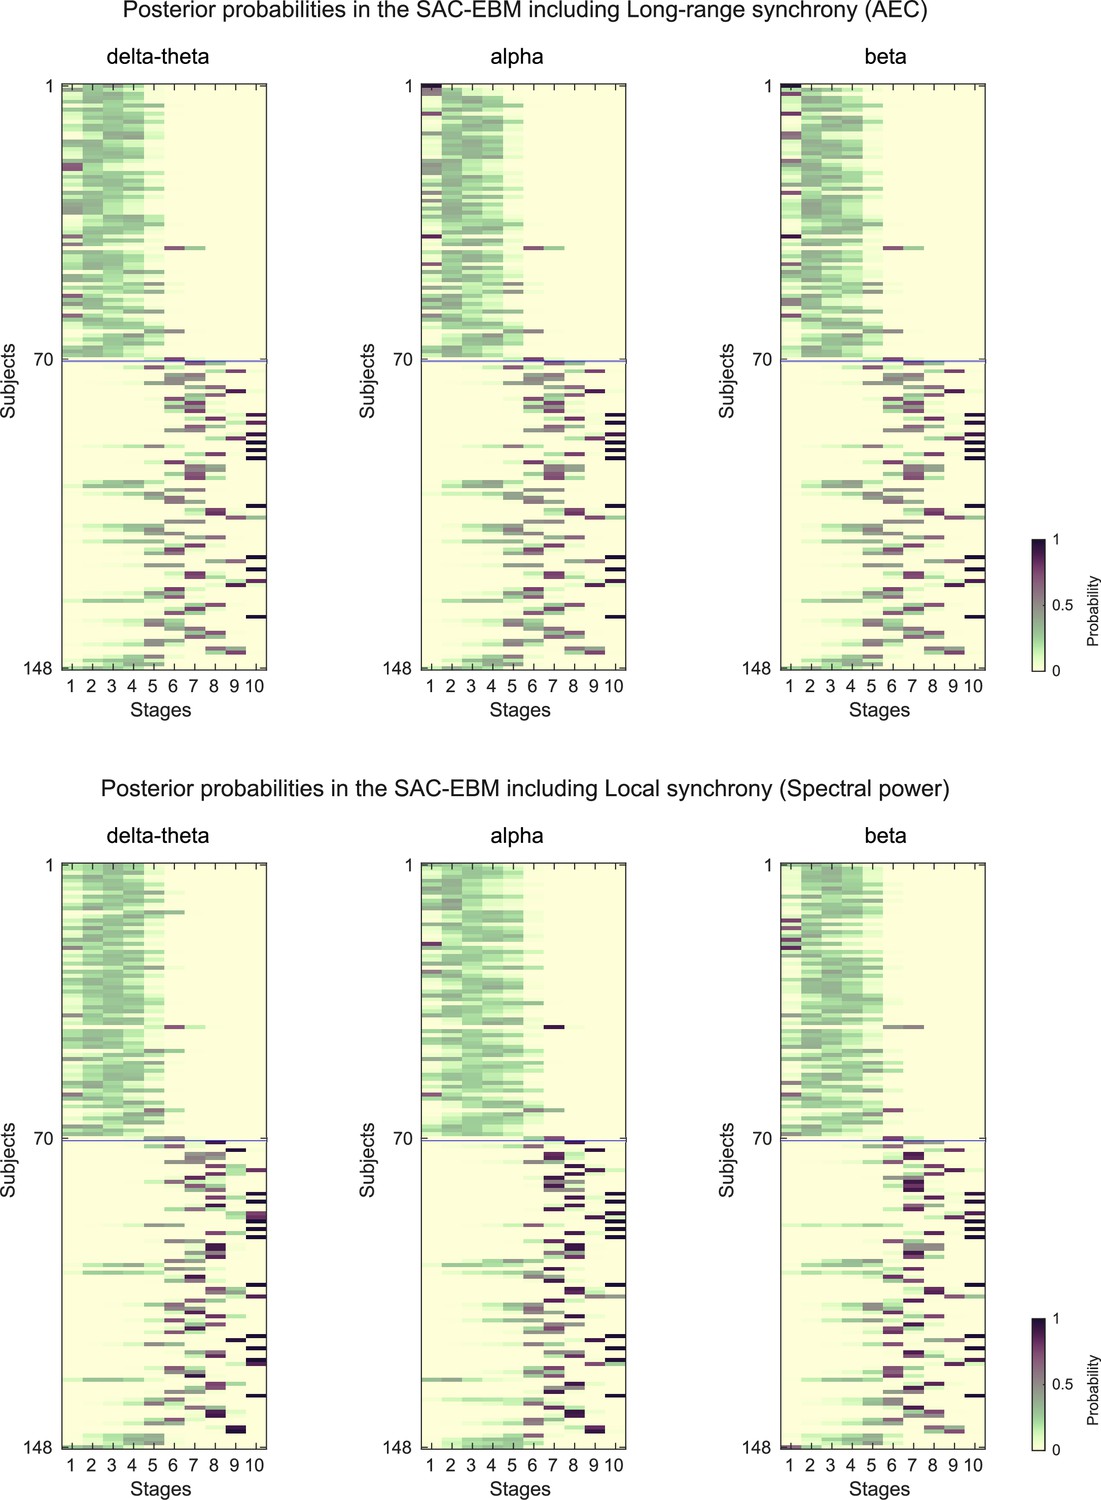
Posterior probabilities evaluated by the SAC-EBMs.
The posterior probabilities that a subject belongs to a stage are given by . (upper panels) Posterior probabilities in the SAC-EBM including long-range synchrony. (lower panels) Posterior probabilities in the SAC-EBM including local synchrony.
Figure 4
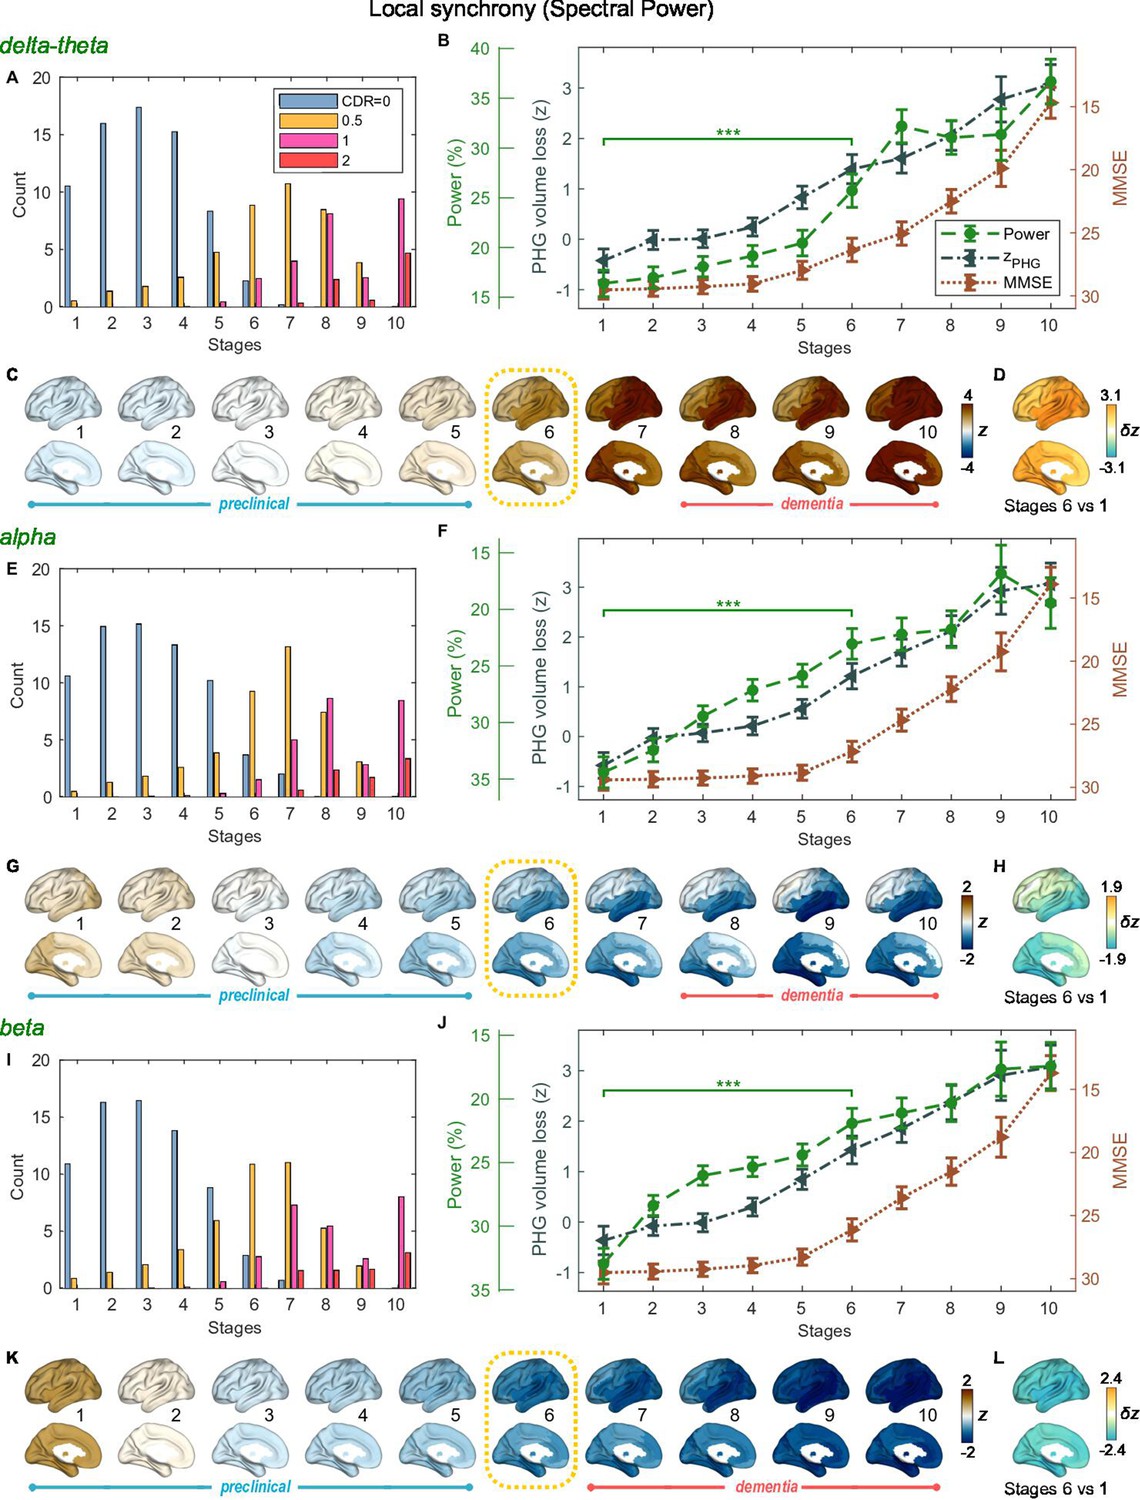
Trajectories of local neural synchrony in delta-theta, alpha, and beta bands from SAC-EBMs.
(A, E, I) The ratio of subjects classified to each stage. (B, F, J) Trajectories of local synchrony, parahippocampal gyrus (PHG) volume loss, and mini-mental state examination (MMSE) score as a function of the 10 stages, show the weighted mean (± SE). Asterisks (***q < 0.001, FDR corrected) denote statistical significance in comparisons between stages 6 vs 1. All stage pairs with significant weighted mean differences are listed in Supplementary file 11. The initial and final -scores of local synchrony used in the SAC-EBMs were: , , and in the delta-theta, alpha, and beta bands, respectively. (C, G, K) Regional spectral power along the stages. Deviations from the regional patterns of the control group are shown. The regional patterns at the onset of the mild cognitive impairment (MCI) stages were circled with dotted lines. (D, H, L) Changes in regional patterns during the preclinical stages. Regional comparisons between two stages are shown based on nonparametric tests of weighted mean differences . Differences exceeding threshold (, false discovery rate - FDR corrected) are displayed. The top 10 regions with significant differences are listed in Supplementary file 12.
Additional files
-
Supplementary file 1
Demographics and Neuropsychological assessments.
- https://cdn.elifesciences.org/articles/91044/elife-91044-supp1-v2.docx
-
Supplementary file 2
The 94 cortical/subcortical anatomical regions included in the Automated Anatomical Labeling 3 (AAL3) atlas.
- https://cdn.elifesciences.org/articles/91044/elife-91044-supp2-v2.docx
-
Supplementary file 3
Direct evaluation of the data likelihoods for all possible -score event sequences in the Atrophy-Cognition EBM (AC-EBM).
- https://cdn.elifesciences.org/articles/91044/elife-91044-supp3-v2.docx
-
Supplementary file 4
Top 10 regions with significant group differences in gray matter (GM) volumes comparison between Alzheimer’s disease (AD) patients and controls.
- https://cdn.elifesciences.org/articles/91044/elife-91044-supp4-v2.docx
-
Supplementary file 5
Top regions with significant group differences in long-range synchrony between patients with Alzheimer’s disease (AD) and controls.
- https://cdn.elifesciences.org/articles/91044/elife-91044-supp5-v2.docx
-
Supplementary file 6
Top 10 regions with significant group differences in local synchrony between patients with Alzheimer’s disease (AD) and controls.
- https://cdn.elifesciences.org/articles/91044/elife-91044-supp6-v2.docx
-
Supplementary file 7
Top regions with significant weighted mean differences (false discovery rate, FDR corrected) in long-range synchrony between stages 4 and 1 (Figure 2E in the main text).
- https://cdn.elifesciences.org/articles/91044/elife-91044-supp7-v2.docx
-
Supplementary file 8
Top regions with significant weighted mean differences (false discovery rate, FDR corrected) in local synchrony between stages 4 and 1 (Figure 2F in the main text).
- https://cdn.elifesciences.org/articles/91044/elife-91044-supp8-v2.docx
-
Supplementary file 9
Pairs of stages with significant weighted-mean differences.
- https://cdn.elifesciences.org/articles/91044/elife-91044-supp9-v2.docx
-
Supplementary file 10
Top regions with significant weighted-mean differences (false discovery rate, FDR corrected) in regional variations of long-range synchrony during preclinical stages (stages 5 vs 1).
- https://cdn.elifesciences.org/articles/91044/elife-91044-supp10-v2.docx
-
Supplementary file 11
Pairs of stages with significant weighted-mean differences .
- https://cdn.elifesciences.org/articles/91044/elife-91044-supp11-v2.docx
-
Supplementary file 12
Top regions with significant weighted-mean differences (false discovery rate, FDR corrected) in regional variations of local synchrony during the preclinical stages (stages 6 vs 1) [Figure 4D, H, L in the main text].
- https://cdn.elifesciences.org/articles/91044/elife-91044-supp12-v2.docx
-
MDAR checklist
- https://cdn.elifesciences.org/articles/91044/elife-91044-mdarchecklist1-v2.docx
Download links
A two-part list of links to download the article, or parts of the article, in various formats.
Downloads (link to download the article as PDF)
Open citations (links to open the citations from this article in various online reference manager services)
Cite this article (links to download the citations from this article in formats compatible with various reference manager tools)
Neurophysiological trajectories in Alzheimer’s disease progression
eLife 12:RP91044.
https://doi.org/10.7554/eLife.91044.3


