Habitat loss weakens the positive relationship between grassland plant richness and above-ground biomass
- Ministry of Education Key Laboratory of Ecology and Resource Use of the Mongolian Plateau, School of Ecology and Environment, Inner Mongolia University, China
- Otago Regional Council, New Zealand
- Collaborative Innovation Center for Grassland Ecological Security (Jointly Supported by the Ministry of Education of China and Inner Mongolia Autonomous Region), China
- Autonomous Region Collaborative Innovation Center for Integrated Management of Water Resources and Water Environment in the Inner Mongolia Reaches of the Yellow River, China
Figures
Figure 1 with 2 supplements
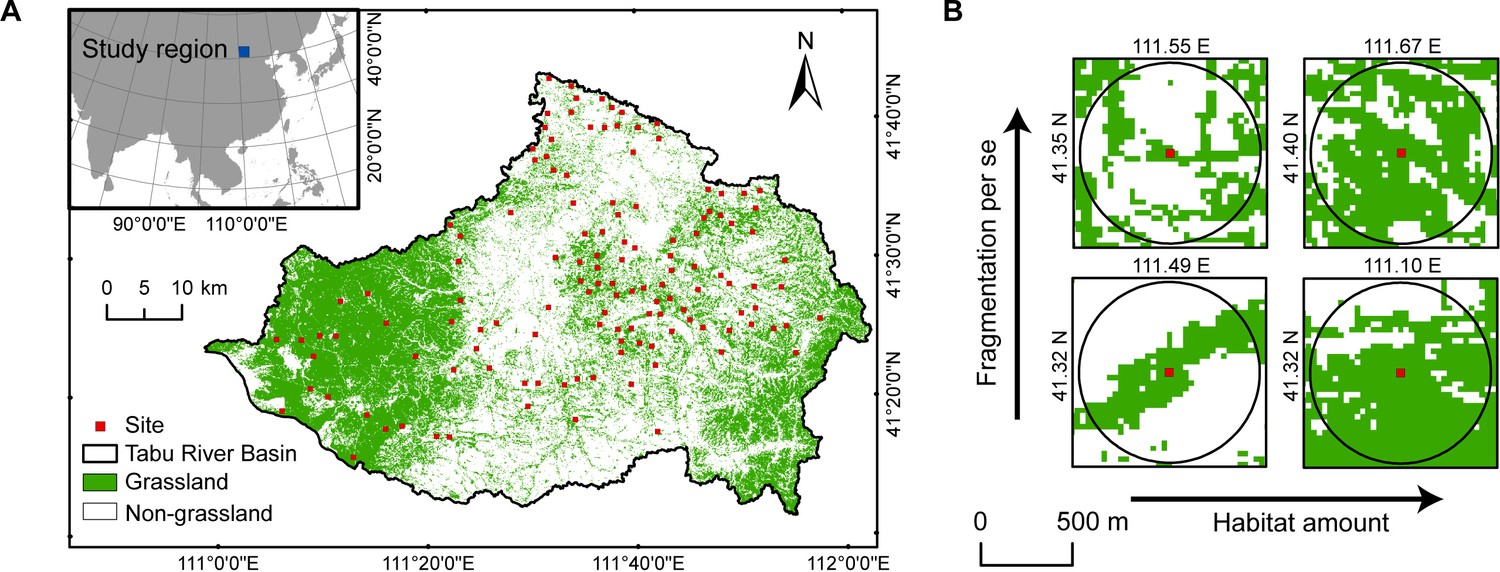
Map of study area in the Tabu River Basin, Inner Mongolia Autonomous Region, northern China.
(A) Location of the 130 survey sites in the study area. (B) Examples of four survey sites with varying levels of habitat loss and fragmentation per se shown with a 500m radius buffer.
Figure 1—figure supplement 1
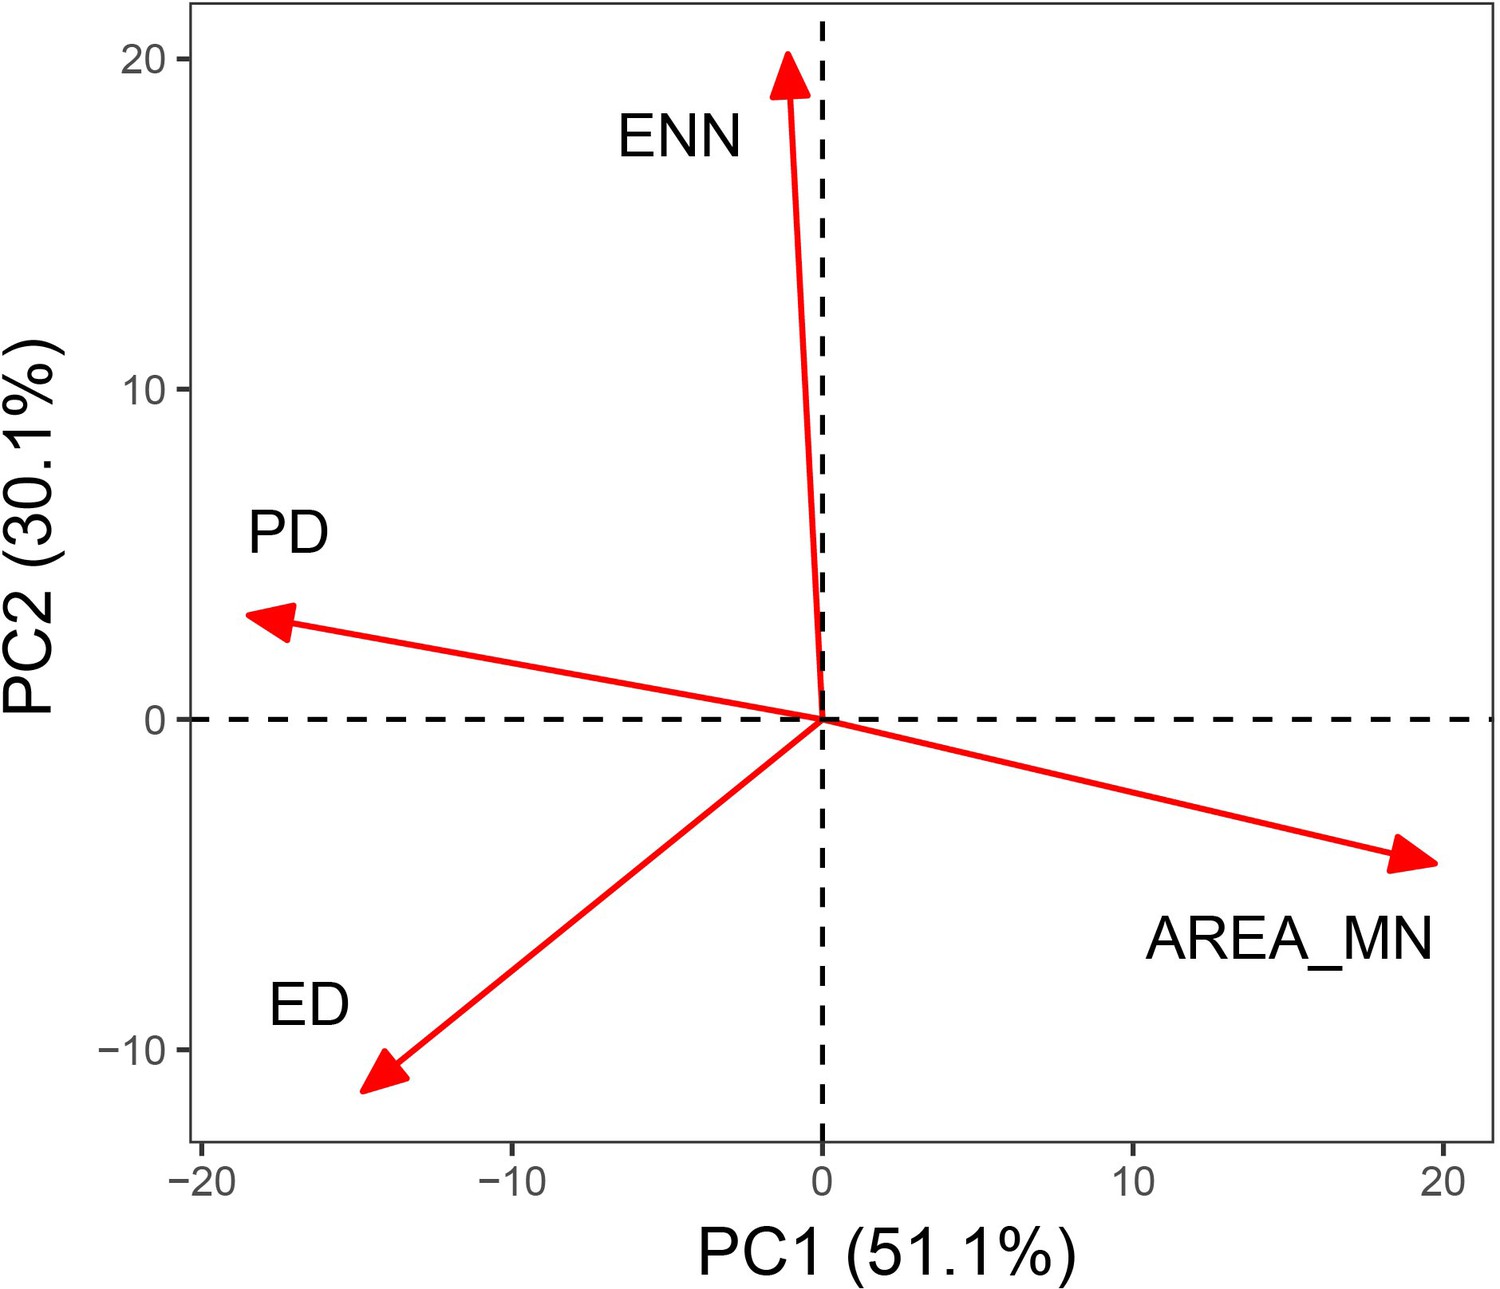
Biplot of the principal component analysis for calculating the single fragmentation index.
PD: patch density; ED: edge density; AREA_MN: mean patch area; ENN: mean nearest-neighbour distance. PC1: the first principal component of the four fragmentation indices explained 51.1% of the variation. PC2: the second principal component of the four fragmentation indices explained 30.1% of the variation.
Figure 1—figure supplement 2
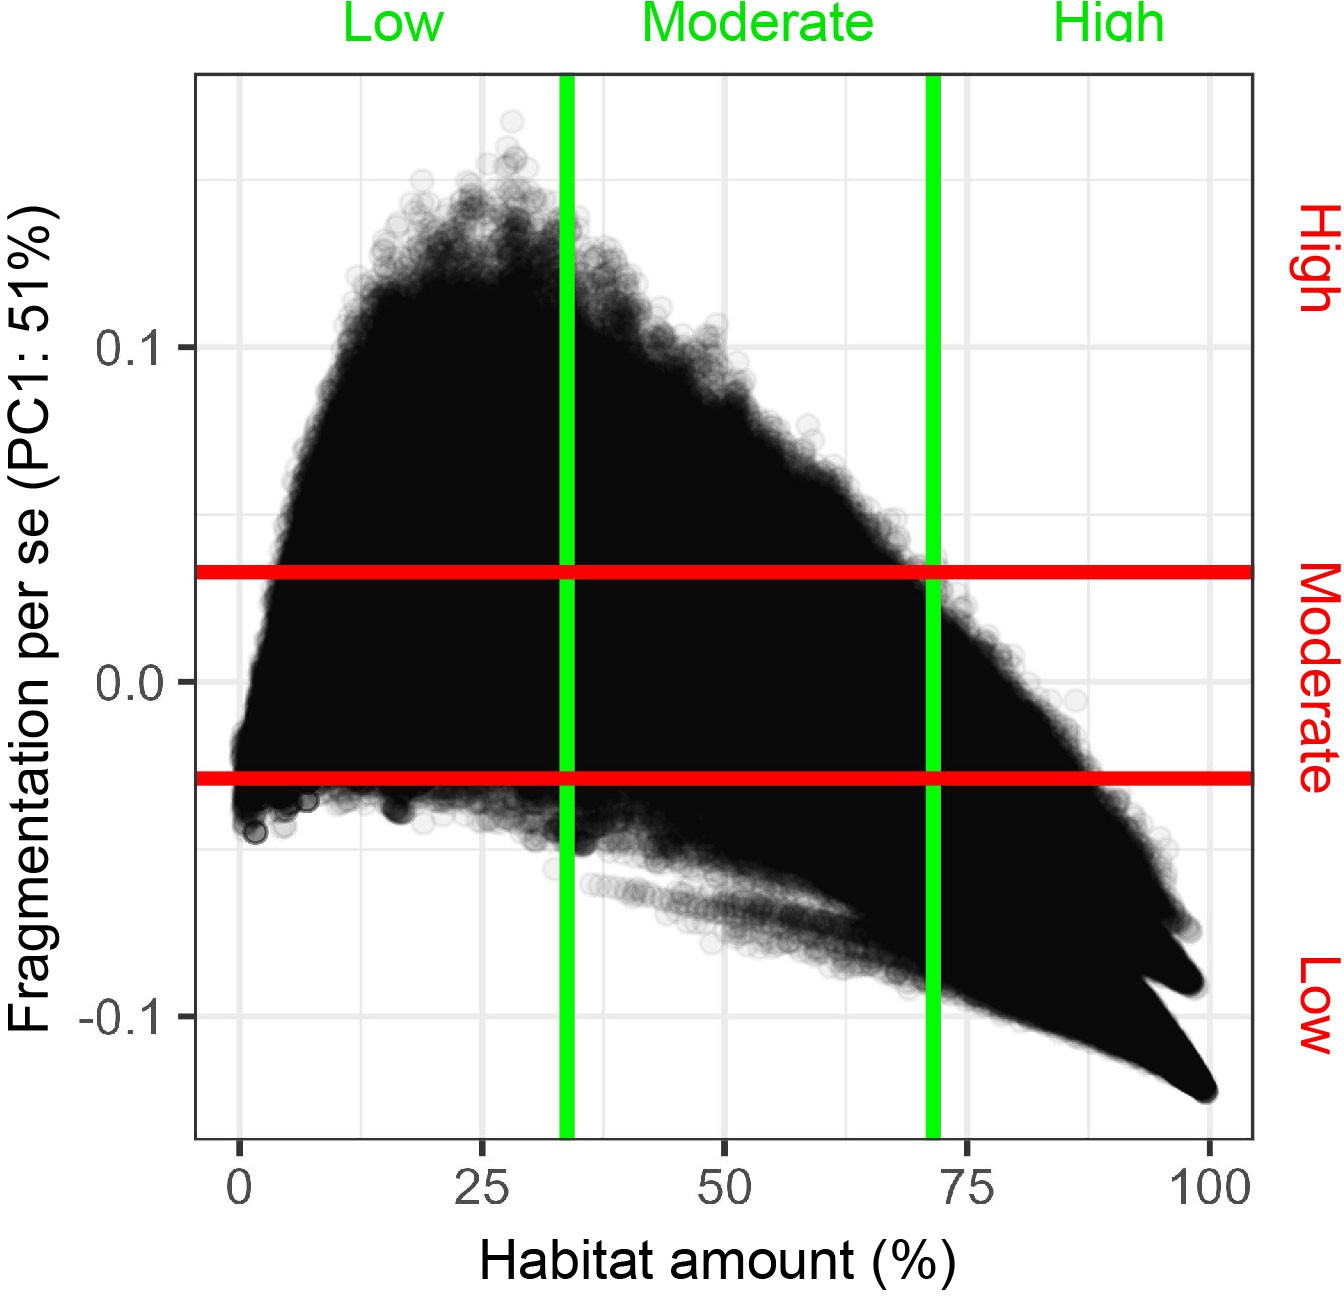
Scatterplot of habitat amount and fragmentation for stratified sampling.
Each point in the figure represents the landscapes with 500 m radius. PC1: the first principal component of the four fragmentation indices. The green lines represent quartiles of habitat amount. The red lines represent quartiles of fragmentation per se. The high, moderate, and low on the horizontal axis represent the levels of habitat amount. The high, moderate, and low on the vertical axis represent the levels of fragmentation per se.
Figure 2
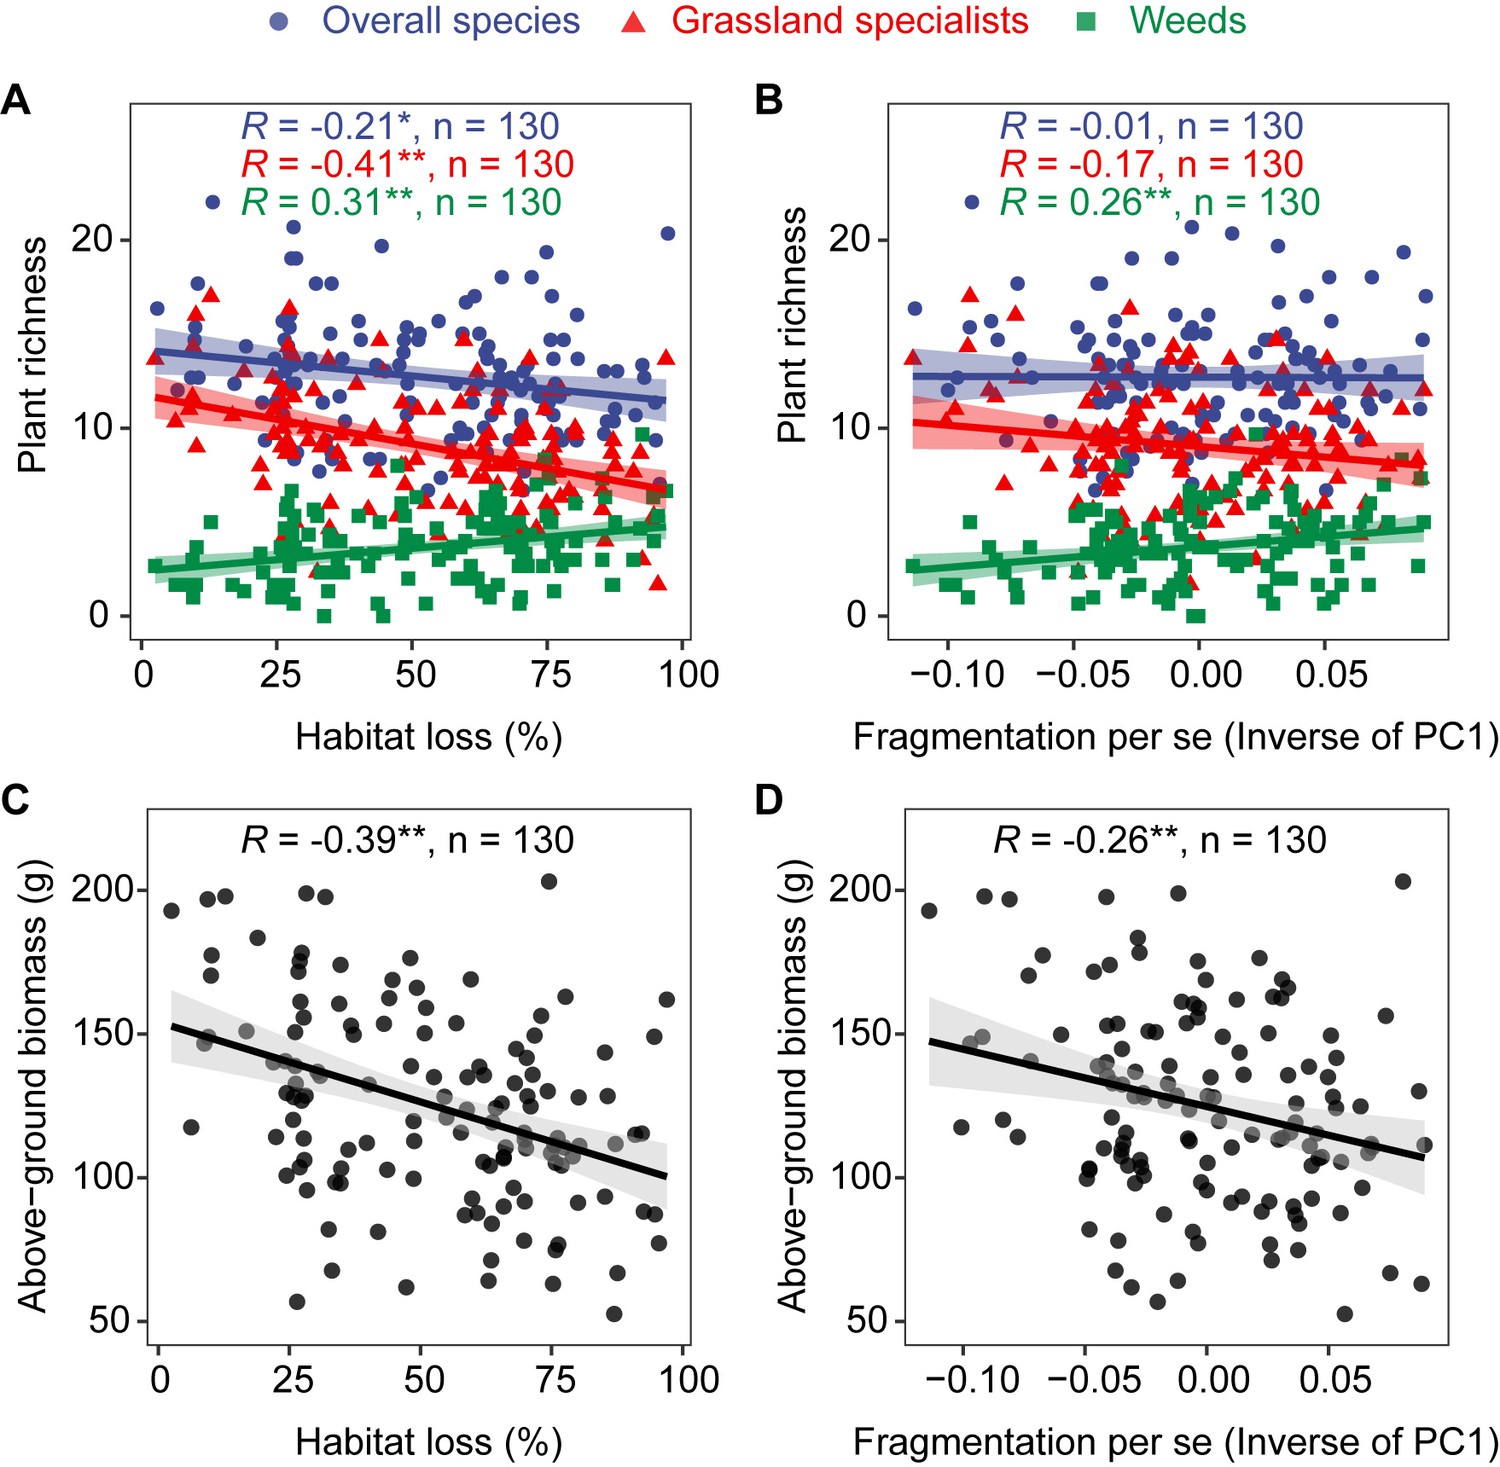
Correlation of habitat loss and fragmentation per se with grassland plant richness and above-ground biomass from 130 landscapes in the Tabu River Basin, a typical agro-pastoral ecotone of northern China.
(A) Habitat loss and plant richness, (B) fragmentation per se and plant richness, (C) habitat loss and above-ground biomass, and (D) fragmentation per se and above-ground biomass.The R value in each panel is from the Pearson correlation coefficient analyses. The n in each panel is the number of surveying sites used in the Pearson correlation analyses. The trend lines in the figure are from linear regression models. The shaded area around the trend line represents the 95% confidence interval. * and ** represent significance at the 0.05 and 0.01 levels, respectively.
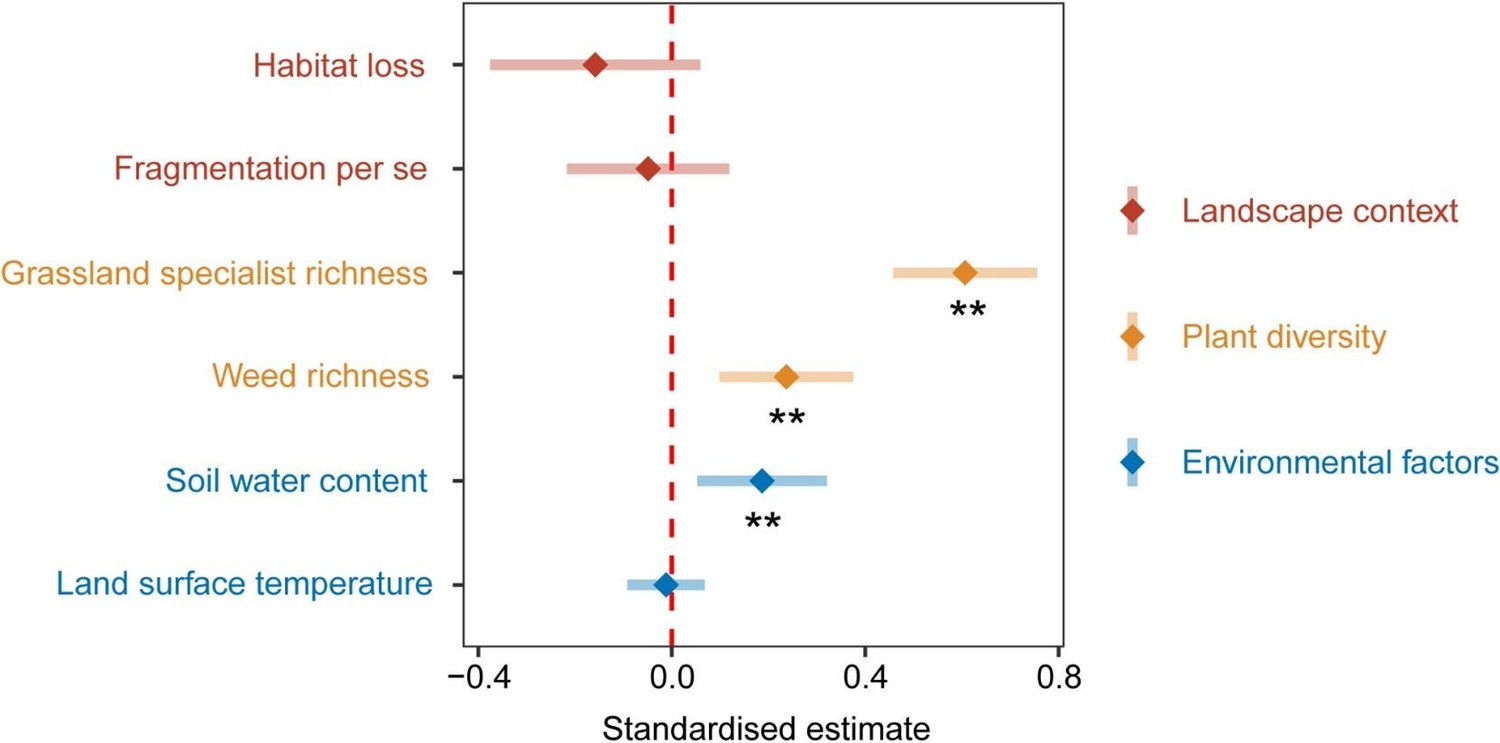
Figure 3
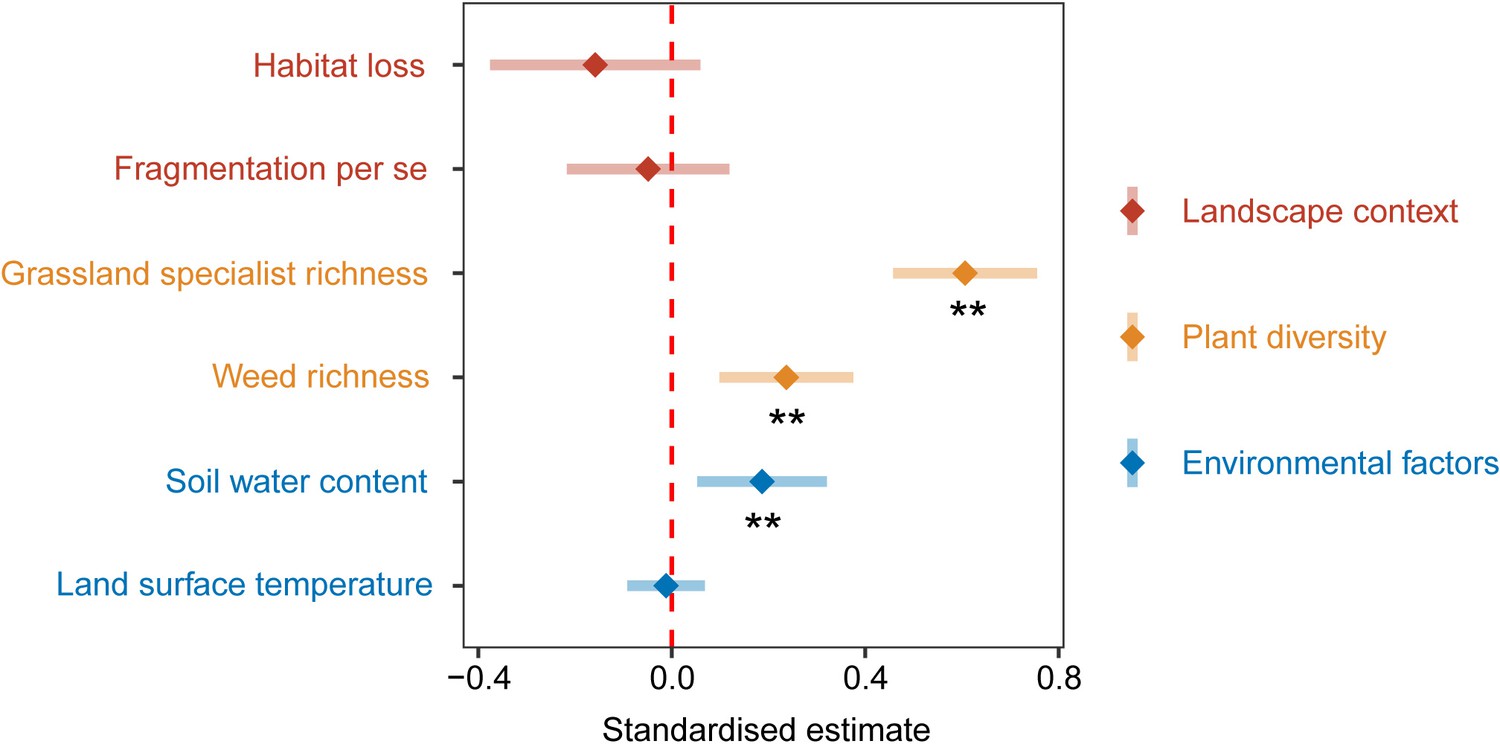
Standardised parameter estimates and 95% confidence intervals for landscape context, plant diversity, and environmental factors affecting above-ground biomass from 130 landscapes in the Tabu River Basin, a typical agro-pastoral ecotone of northern China.
Standardised estimates and 95% confidence intervals are calculated by the multi-model-averaging method based on the four optimal models affecting above-ground biomass (Supplementary file 2). ** represent significance at the 0.01 level.
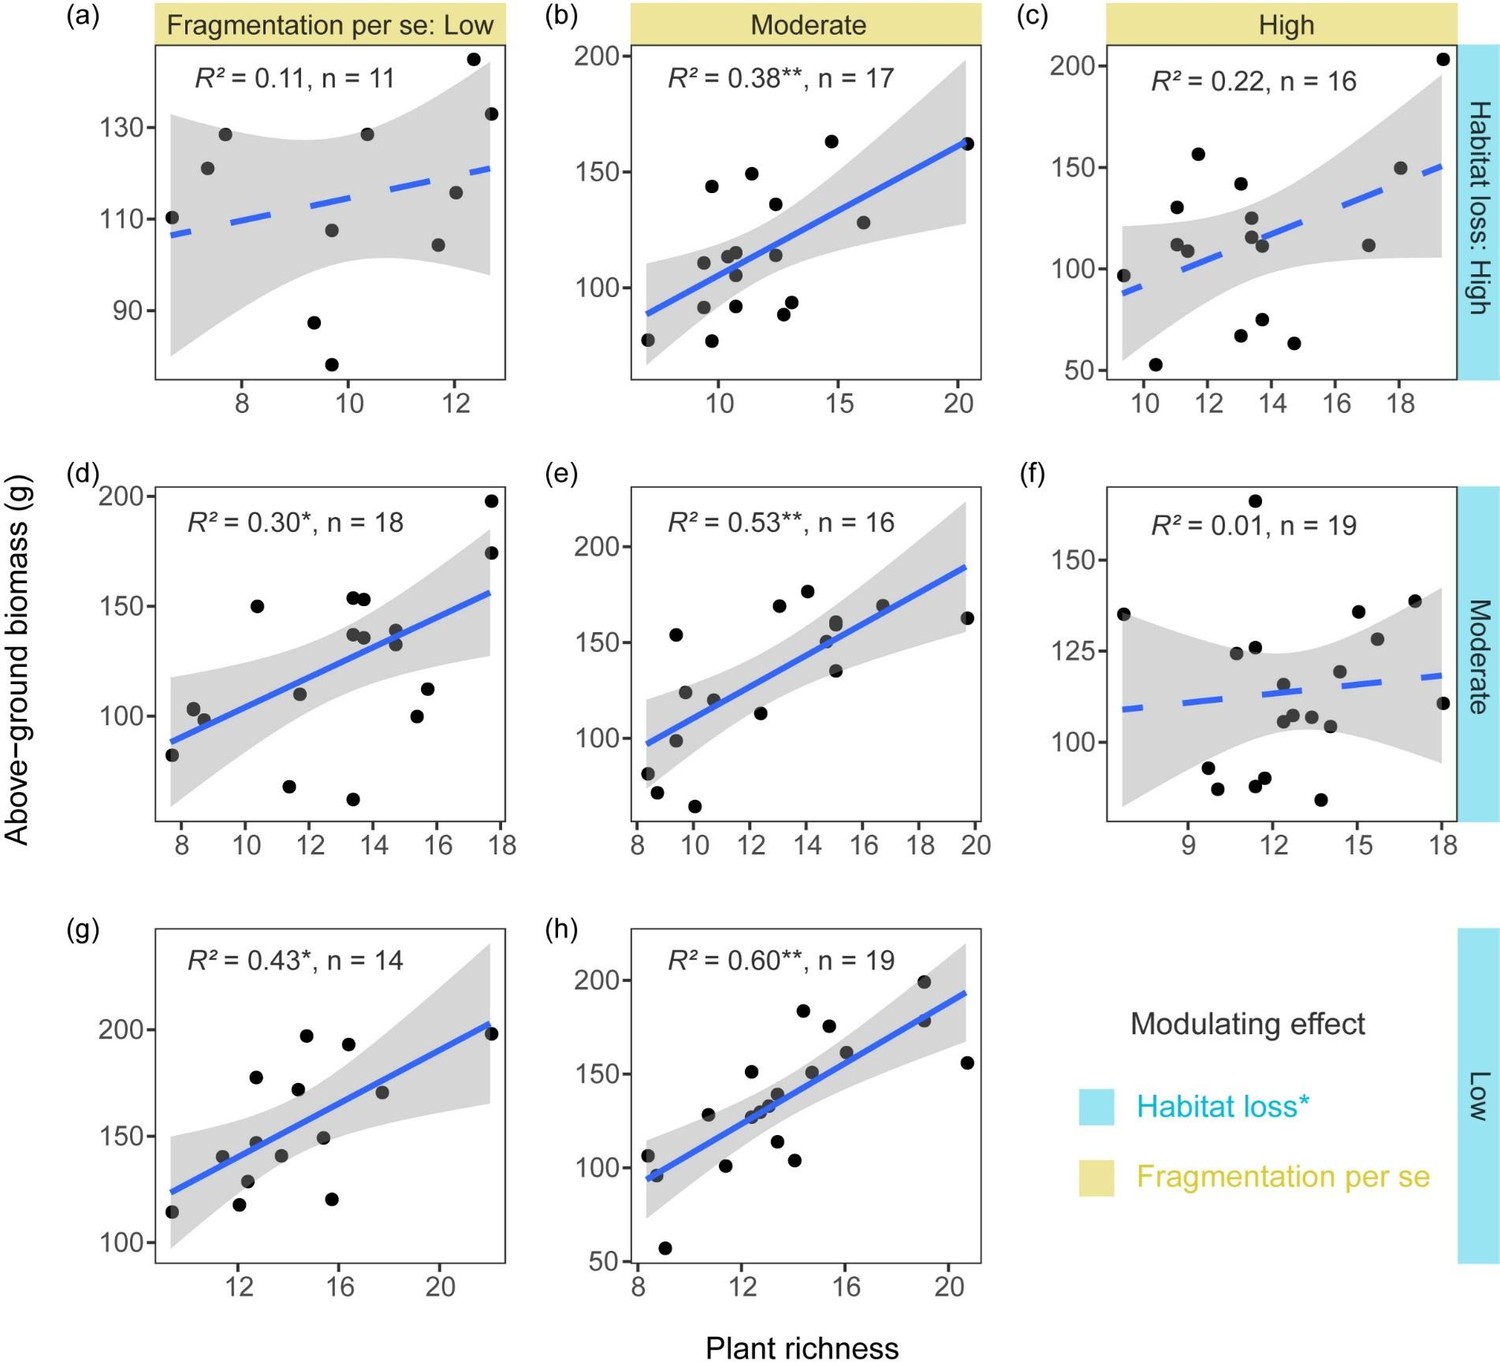
Figure 4
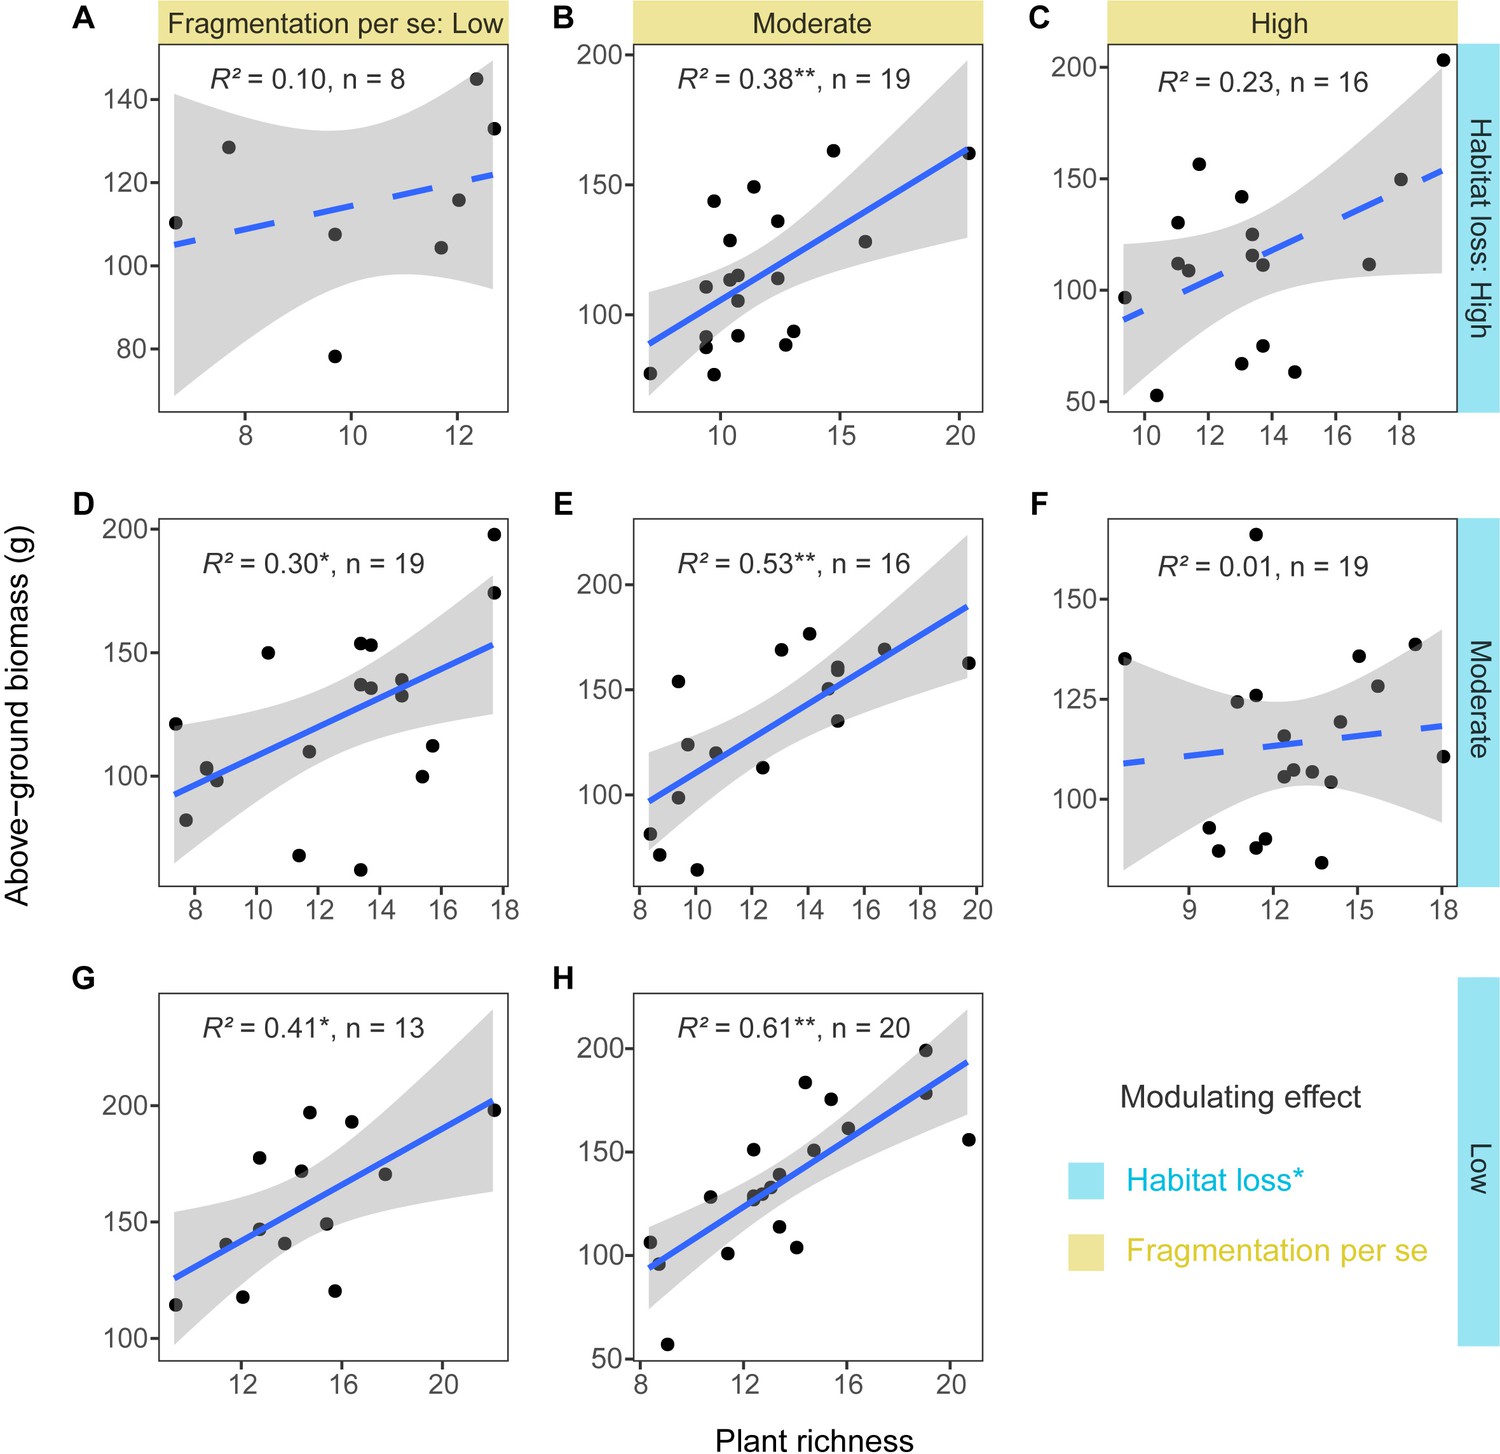
Relationships between grassland plant richness and above-ground biomass at different levels of habitat loss and fragmentation per se from 130 landscapes in the Tabu River Basin, a typical agro-pastoral ecotone of northern China.
(A) High habitat loss and low fragmentation per se, (B) high habitat loss and moderate fragmentation per se, (C) high habitat loss and high fragmentation per se, (D) moderate habitat loss and low fragmentation per se, (E) moderate habitat loss and moderate fragmentation per se, (F) moderate habitat loss and high fragmentation per se, (G) low habitat loss and low fragmentation per se, and (H) low habitat loss and moderate fragmentation per se. The modulating effect in the figure represents the significance of interaction terms between habitat loss and fragmentation per se and plant richness for affecting above-ground biomass (Supplementary file 3). The R2 values in each panel are from linear regression models. The n in each panel is the number of surveying sites used in the linear regression models. The blue solid and dashed trend lines represent the significant and not significant effects, respectively. The shaded area around the trend line represents the 95% confidence interval. * represent significance at the 0.05 level. ** represent significance at the 0.01 level.
Figure 5 with 1 supplement
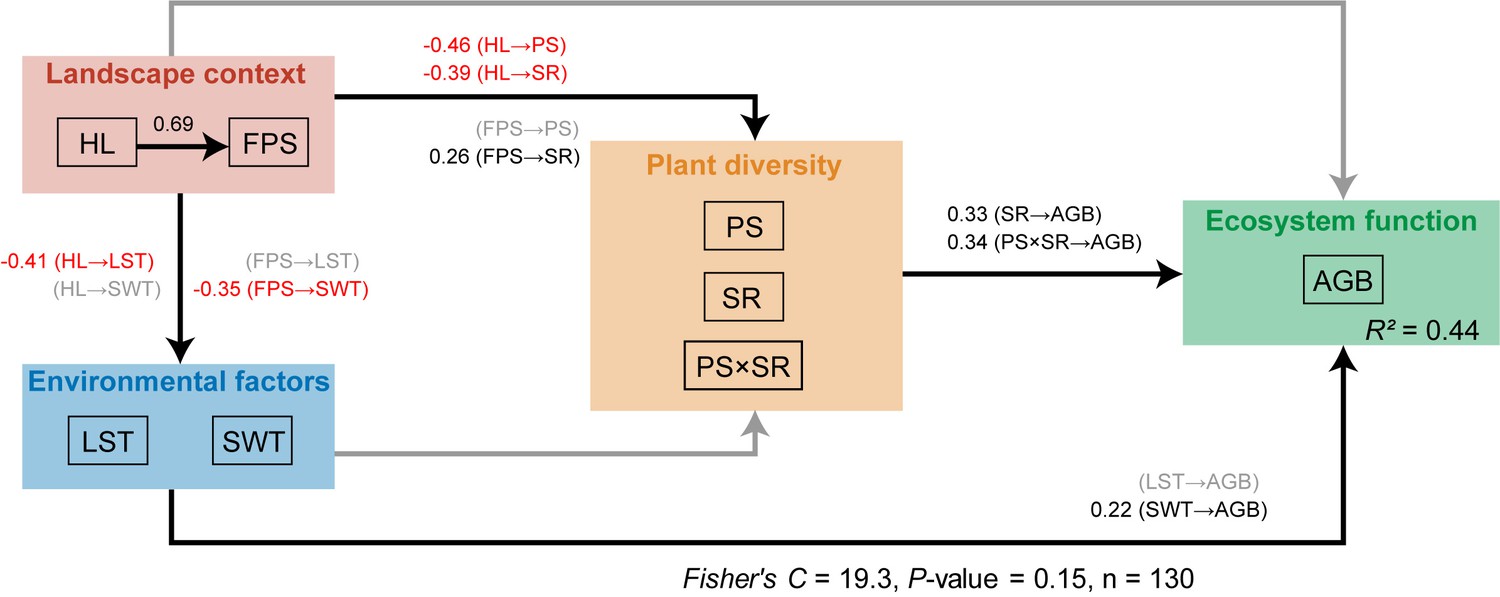
Results from the piecewise structural equation model with hypothesised paths showing how habitat loss and fragmentation per se alters the relationship between grassland plant richness and above-ground biomass from 130 landscapes in the Tabu River Basin, a typical agro-pastoral ecotone of northern China.
HL: habitat loss; FPS: fragmentation per se; LST: land surface temperature; SWT: soil water content; PS: percentage of grassland specialists; SR: plant richness; PS × SR: interaction term between percentage of grassland specialists and plant richness; AGB: above-ground biomass. Black and grey solid arrows represent the significant and not significant effects at the 0.05 level, respectively. Black and red numbers on the solid arrows represent the significant positive and negative path coefficients, respectively. The Fisher’s C and p-values are from the piecewise structural equation model.
Figure 5—figure supplement 1
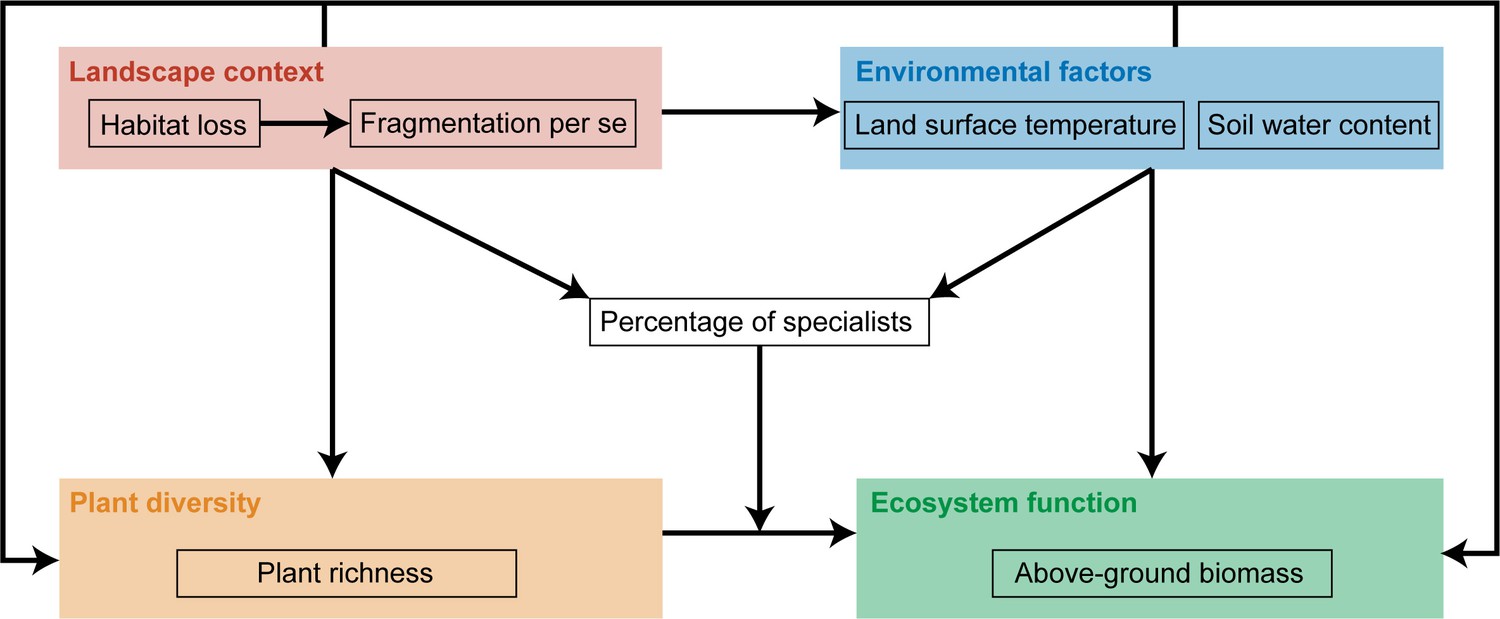
Hypothetical model of habitat loss and fragmentation per se for the relationship between grassland plant richness and above-ground biomass affecting the percentage of grassland specialists in the community from 130 landscapes in the Tabu River Basin, a typical agro-pastoral ecotone of northern China.
Arrows represent the hypothesised paths among variables. See the main text for a description of arrow directions.
Author response image 1
Relationships between grassland plant richness and above-ground biomass at different levels of habitat loss and fragmentation per se from 130 landscapes in the Tabu River Basin, a typical agro-pastoral ecotone of northern China.
(a) High habitat loss and low fragmentation per se, (b) high habitat loss and moderate fragmentation per se, (c) high habitat loss and high fragmentation per se, (d) moderate habitat loss and low fragmentation per se, (e) moderate habitat loss and moderate fragmentation per se, (f) moderate habitat loss and high fragmentation per se, (g) low habitat loss and low fragmentation per se, (h) low habitat loss and moderate fragmentation per se. The R2 values in each panel are from linear regression models. The n in each panel is the number of surveying sites used in the linear regression models. The blue solid and dashed trend lines represent the significant and not significant effects, respectively. The shaded area around the trend line represents the 95% confidence interval. * represent significance at the 0.05 level. ** represent significance at the 0.01 level.
Author response image 2

Relationships between grassland plant richness and above-ground biomass at different levels of habitat loss and fragmentation per se from 130 landscapes in the Tabu River Basin, a typical agro-pastoral ecotone of northern China.
(a) High habitat loss and low fragmentation per se, (b) high habitat loss and moderate fragmentation per se, (c) high habitat loss and high fragmentation per se, (d) moderate habitat loss and low fragmentation per se, (e) moderate habitat loss and moderate fragmentation per se, (f) moderate habitat loss and high fragmentation per se, (g) low habitat loss and low fragmentation per se, (h) low habitat loss and moderate fragmentation per se. The R2 values in each panel are from linear regression models. The n in each panel is the number of surveying sites used in the linear regression models. The blue solid and dashed trend lines represent the significant and not significant effects, respectively. The shaded area around the trend line represents the 95% confidence interval. * represent significance at the 0.05 level. ** represent significance at the 0.01 level.
Author response image 3
Standardised parameter estimates and 95% confidence intervals for landscape context, plant diversity, and environmental factors affecting above-ground biomass from 130 landscapes in the Tabu River Basin, a typical agro-pastoral ecotone of northern China.
Standardised estimates and 95% confidence intervals are calculated by the multi-model averaging method based on the four optimal models affecting above-ground biomass (Appendix Table A3). ** represent significance at the 0.01 level.
Tables
Author response table 1
Four optimal models of landscape context, environment factors, and plant diversity affecting above-ground biomass.
| Ranking | Model | R2 | AICc |
|---|---|---|---|
| 1 | AGB~HL+SWT+GSR+WR | 0.47** | 1213.7 |
| 2 | AGB~HL+FPS+SWT+GSR+WR | 0.47** | 1215.2 |
| 3 | AGB~HL+LST+SWT+GSR+WR | 0.47** | 1215.3 |
| 4 | AGB~FPS+SWT+GSR+WR | 0.46** | 1215.3 |
-
Note: AGB: above-ground biomass; HL: habitat loss; FPS: fragmentation per se; SWT: soil water content; LST: land surface temperature; GSR: grassland specialist richness; WR: weed richness; **: significance at the 0.01 level.”
Author response table 2
Variance inflation factors of habitat loss and fragmentation per se indices for influencing plant richness and above-ground biomass.
| Variable | Variance inflation factors (VIF) |
|---|---|
| Patch density | 2.28 |
| Edge density | 1.21 |
| Mean patch area | 2.54 |
| Mean nearest-neighbor distance | 1.25 |
Additional files
-
Supplementary file 1
List of 130 species of vascular plants recorded across 130 sites in this study.
- https://cdn.elifesciences.org/articles/91193/elife-91193-supp1-v1.docx
-
Supplementary file 2
Four optimal models of landscape context, environment factors, and plant diversity affecting above-ground biomass.
- https://cdn.elifesciences.org/articles/91193/elife-91193-supp2-v1.docx
-
Supplementary file 3
Effects of interaction terms between habitat loss and fragmentation per se and plant richness on above-ground biomass.
- https://cdn.elifesciences.org/articles/91193/elife-91193-supp3-v1.docx
-
Supplementary file 4
Summary of the principal component analysis for the four fragmentation indices.
- https://cdn.elifesciences.org/articles/91193/elife-91193-supp4-v1.docx
-
Supplementary file 5
Variance inflation factors of predictor variables for above-ground biomass.
- https://cdn.elifesciences.org/articles/91193/elife-91193-supp5-v1.docx
-
MDAR checklist
- https://cdn.elifesciences.org/articles/91193/elife-91193-mdarchecklist1-v1.pdf
-
Source data 1
The site location, landscape context, environmental factors, plant richness, and above-ground biomass.
- https://cdn.elifesciences.org/articles/91193/elife-91193-data1-v1.xlsx
Download links
A two-part list of links to download the article, or parts of the article, in various formats.
Downloads (link to download the article as PDF)
Open citations (links to open the citations from this article in various online reference manager services)
Cite this article (links to download the citations from this article in formats compatible with various reference manager tools)
Habitat loss weakens the positive relationship between grassland plant richness and above-ground biomass
eLife 12:RP91193.
https://doi.org/10.7554/eLife.91193.3


