Acetylcholine modulates the precision of prediction error in the auditory cortex
- Cognitive and Auditory Neuroscience Laboratory, Institute of Neuroscience of Castilla y León, Calle Pintor Fernando Gallego, Spain
- Institute for Biomedical Research of Salamanca (IBSAL), Spain
- Department of Basic Psychology, Psychobiology and Behavioural Science Methodology, Faculty of Psychology, Campus Ciudad Jardín, University of Salamanca, Spain
- Department of Biology and Pathology, Faculty of Medicine, Campus Miguel de Unamuno, University of Salamanca, Spain
Figures
Figure 1
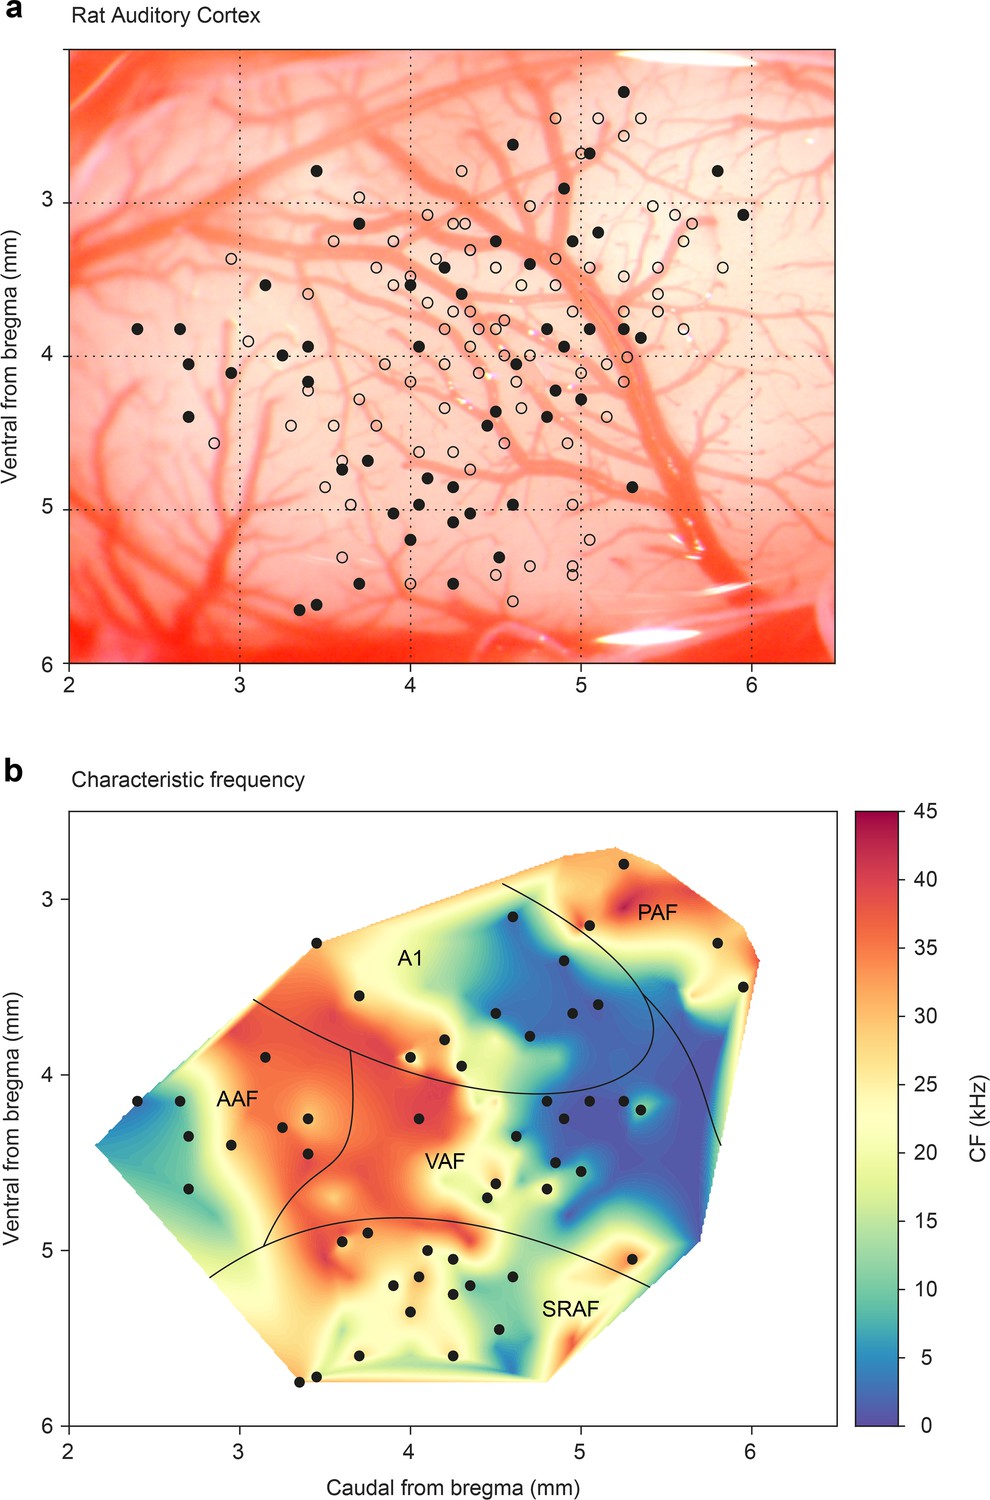
Map of all recording locations.
(a) All recording sites are drawn over the cortex of a representative animal. At every site, the characteristic frequency (CF) was determined and then we presented an oddball paradigm and the corresponding control sequences. (b) Distribution of the CFs across the entire rat auditory cortex. Note how each field shows a characteristic CF gradient. Empty dots indicate sites used only for CF determination. Filled dots indicate sites where oddball paradigm was recorded.
-
Figure 1—source data 1
Source data for Figure 1.
- https://cdn.elifesciences.org/articles/91475/elife-91475-fig1-data1-v2.xlsx
Figure 2

Examples of lemniscal auditory cortex (AC) units modulated by acetylcholine (ACh).
Left, middle, and right columns show the responses before (control), during (effect), and after (recovery) ACh application, respectively. (a) Frequency response areas (FRAs) and peri-stimulus time histograms (PSTHs) from a unit located in A1. This specific neuron shows a common SSA index (CSI) decrease during ACh application and recovery to baseline levels (CSI = 0.95, CSI = 0.4, and CSI = 0.95, respectively) (b) FRAs and PSTHs from an AAF unit with increased CSI (CSI = 0.4, CSI = 0.72, and CSI = 0.66, respectively) during ACh application. Red lines and dots: deviant response; blue lines and dots: standard response.
-
Figure 2—source data 1
Source data for Figure 2.
- https://cdn.elifesciences.org/articles/91475/elife-91475-fig2-data1-v2.xlsx
Figure 3
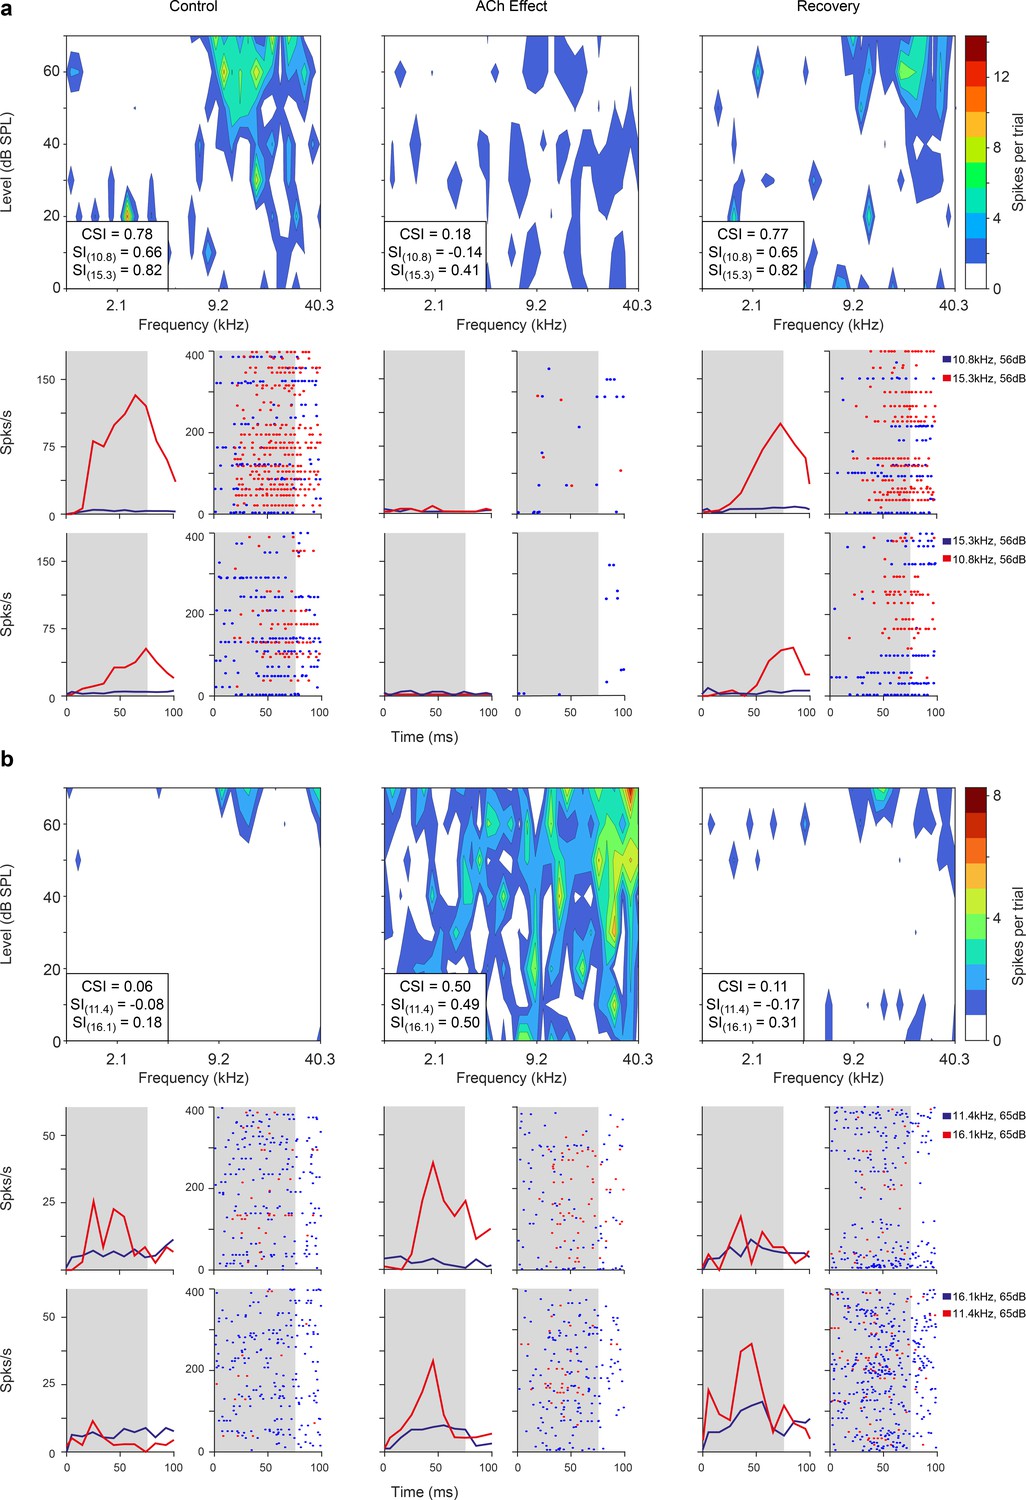
Non-lemniscal auditory cortex (AC) units modulated by acetylcholine (ACh).
Left, middle, and right columns show the responses before (control), during (effect), and after (recovery) ACh application, respectively. (a) Frequency response areas (FRAs) and peri-stimulus time histograms (PSTHs) from a unit located in supra-rhinal auditory field (SRAF). This specific neuron shows a common SSA index (CSI) decrease during ACh application and recovery to baseline levels (CSI = 0.78, CSI = 0.19, and CSI = 0.77, respectively). (b) FRAs and PSTHs from a posterior auditory field (PAF) unit with increased CSI (CSI = 0.06, CSI = 0.5, and CSI = 0.11, respectively) during ACh application. Red lines and dots: deviant response; blue lines and dots: standard response.
-
Figure 3—source data 1
Source data for Figure 3.
- https://cdn.elifesciences.org/articles/91475/elife-91475-fig3-data1-v2.xlsx
Figure 4
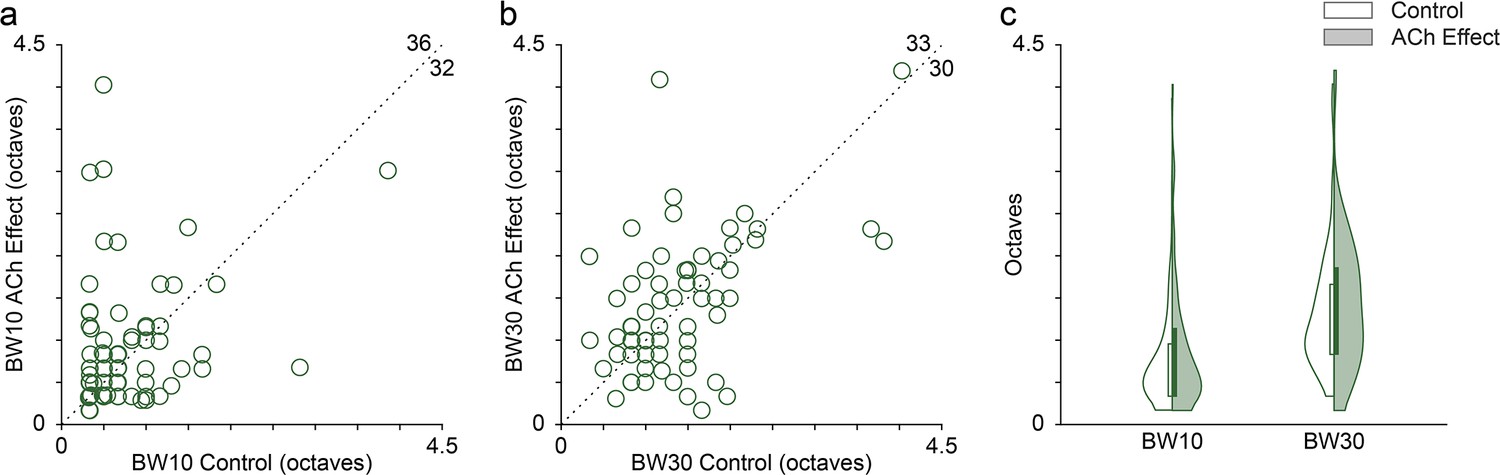
Effect of acetylcholine (ACh) on the bandwidth of the frequency response area (FRAs).
Many individual units showed enlarged or reduced FRA bandwidths, both at 10 (a) and 30 (b) dB above the minimum threshold. The values in the upper-right corner of panels (a) and (b) indicate the number of units showing either an increment (top) or a decrement (right) of the bandwidth during the application of ACh. (c) Distribution of FRA bandwidths in octaves at 10 and 30 dB above the minimum threshold (BW10 and BW30, respectively), before (white background) and during (shaded background) the application of ACh. ACh did not alter significantly neither BW10 nor BW30 at the population level.
-
Figure 4—source data 1
Source data for Figure 4.
- https://cdn.elifesciences.org/articles/91475/elife-91475-fig4-data1-v2.xlsx
Figure 5
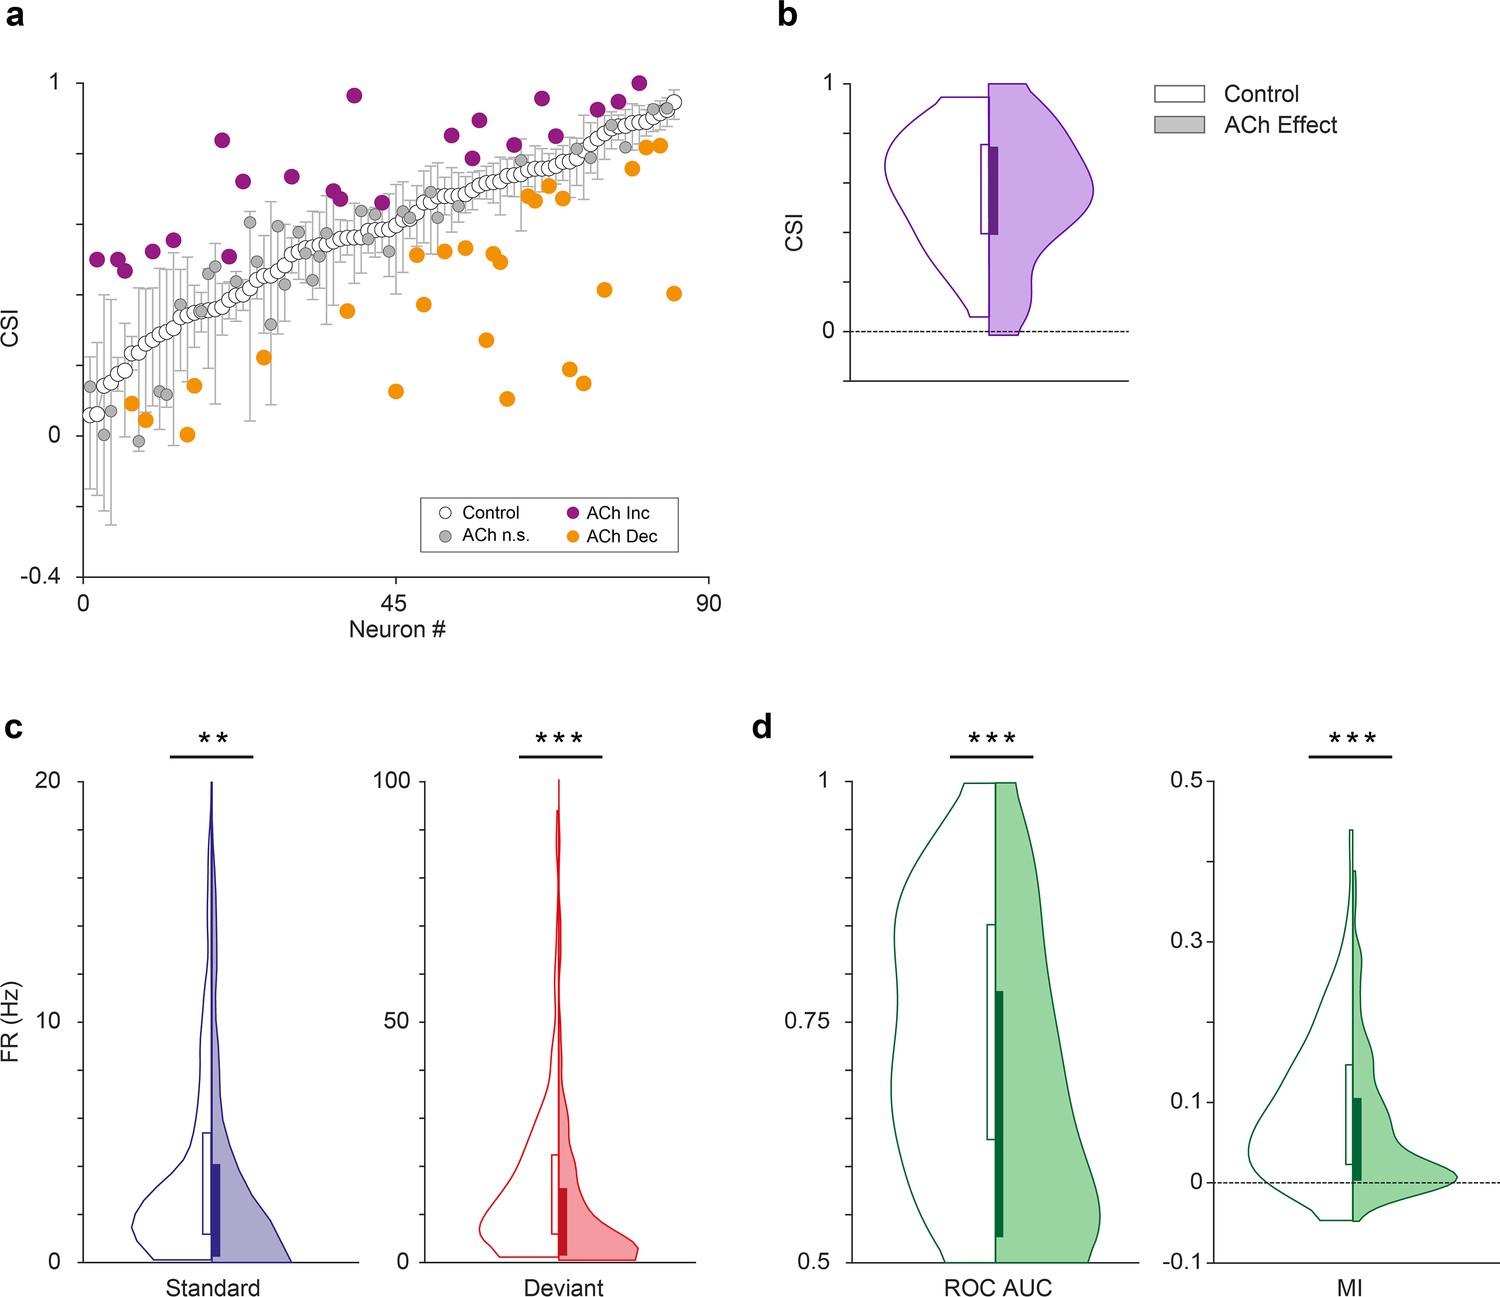
Effect of acetylcholine on common SSA index (CSI).
(a) Changes on the CSI due to the effect of acetylcholine (ACh), for each recorded unit. The units are sorted based on their CSI in the control condition (white dots). The vertical bars indicate the 95% confidence interval for the CSI in the control condition. (b) Violin plots showing the CSI measured in control and effect conditions. The CSI did not change significantly during the application of ACh. In this and similar violin plots, white background indicates the control conditions, while shaded background indicates the effect condition. (c) Distribution of firing rates in response to the deviant (red) and standard tones (blue), in control and ACh conditions. The application of ACh caused a significant reduction in the response to both deviant and standard tones. (d) Distribution of area under the curve (AUC) and Mutual Information values in control and ACh conditions. The application of ACh caused a significant decrease in both AC and Mutual Information. **p<0.01; ***p<0.001.
-
Figure 5—source data 1
Source data for Figure 5.
- https://cdn.elifesciences.org/articles/91475/elife-91475-fig5-data1-v2.xlsx
Figure 6
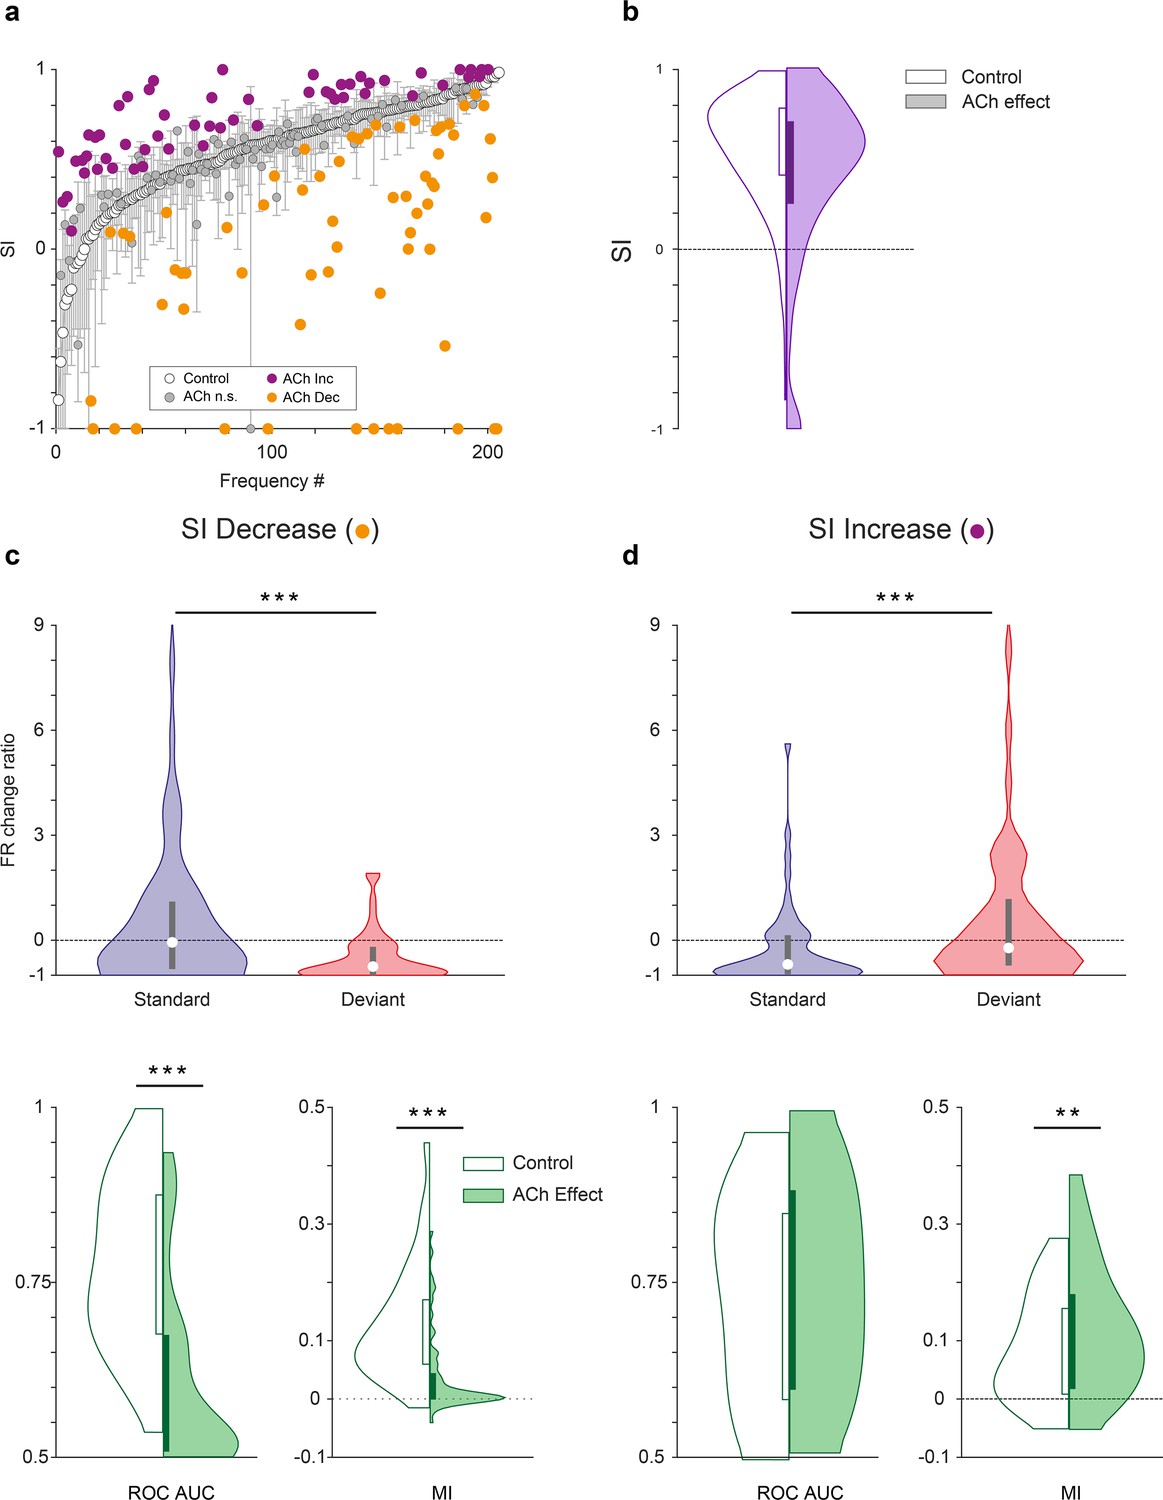
Characteristics of units depending on the effect of acetylcholine (ACh) on selectivity index (SI).
(a) Changes on the SI due to the effect of ACh, for each tested tone. The units are sorted based on their SI in the control condition (white dots). The vertical bars indicate the 95% confidence interval for the SI in the control condition. (b) Violin plot depicting the overall effect of ACh on the SI, for the complete sample. (c) Firing rate change ratio due to ACh application, relative to the control condition. In units showing SI decrease (left column), it was caused by a significant reduction of the firing rate in response to deviant tones. By contrast, in units showing SI increase (right column) it was caused by a significant reduction of the firing rate in response to standard tones. (d) In units showing SI decrease (left column), there was a significant reduction of both area under the curve (AUC) and Mutual Information during the application of ACh. On the other hand, in units showing SI increase (right column), AUC did not change but Mutual Information increased. **p<0.01; ***p<0.001.
-
Figure 6—source data 1
Source data for Figure 6.
- https://cdn.elifesciences.org/articles/91475/elife-91475-fig6-data1-v2.xlsx
Figure 7 with 1 supplement

Predictive coding indices depending on the effect of acetylcholine (ACh) on selectivity index (SI).
The application of ACh decreased the normalized spike counts in response to deviant stimuli (red) and increased the normalized spike counts in response to standard stimuli (blue) in those units where SI decreased due to the application of ACh (a), while the changes were opposite in those units where SI increased due to the application of ACh (b) In neither case, did the response to the cascade condition (green) change significantly, but there was a slight trend in the same direction as the changes in the standards. In consequence, the neuronal mismatch (iMM, purple) and prediction error indexes (iPE, light red) decreased significantly in those units where SI decreased due to the application of ACh (c), but increased in those units where SI increased due to the application of ACh (d) The repetition suppression index (iRS) in light blue, did not change significantly in any case. *p<0.05; **p<0.01; ***p<0.001.
-
Figure 7—source data 1
Source data for Figure 7.
- https://cdn.elifesciences.org/articles/91475/elife-91475-fig7-data1-v2.xlsx
Figure 7—figure supplement 1
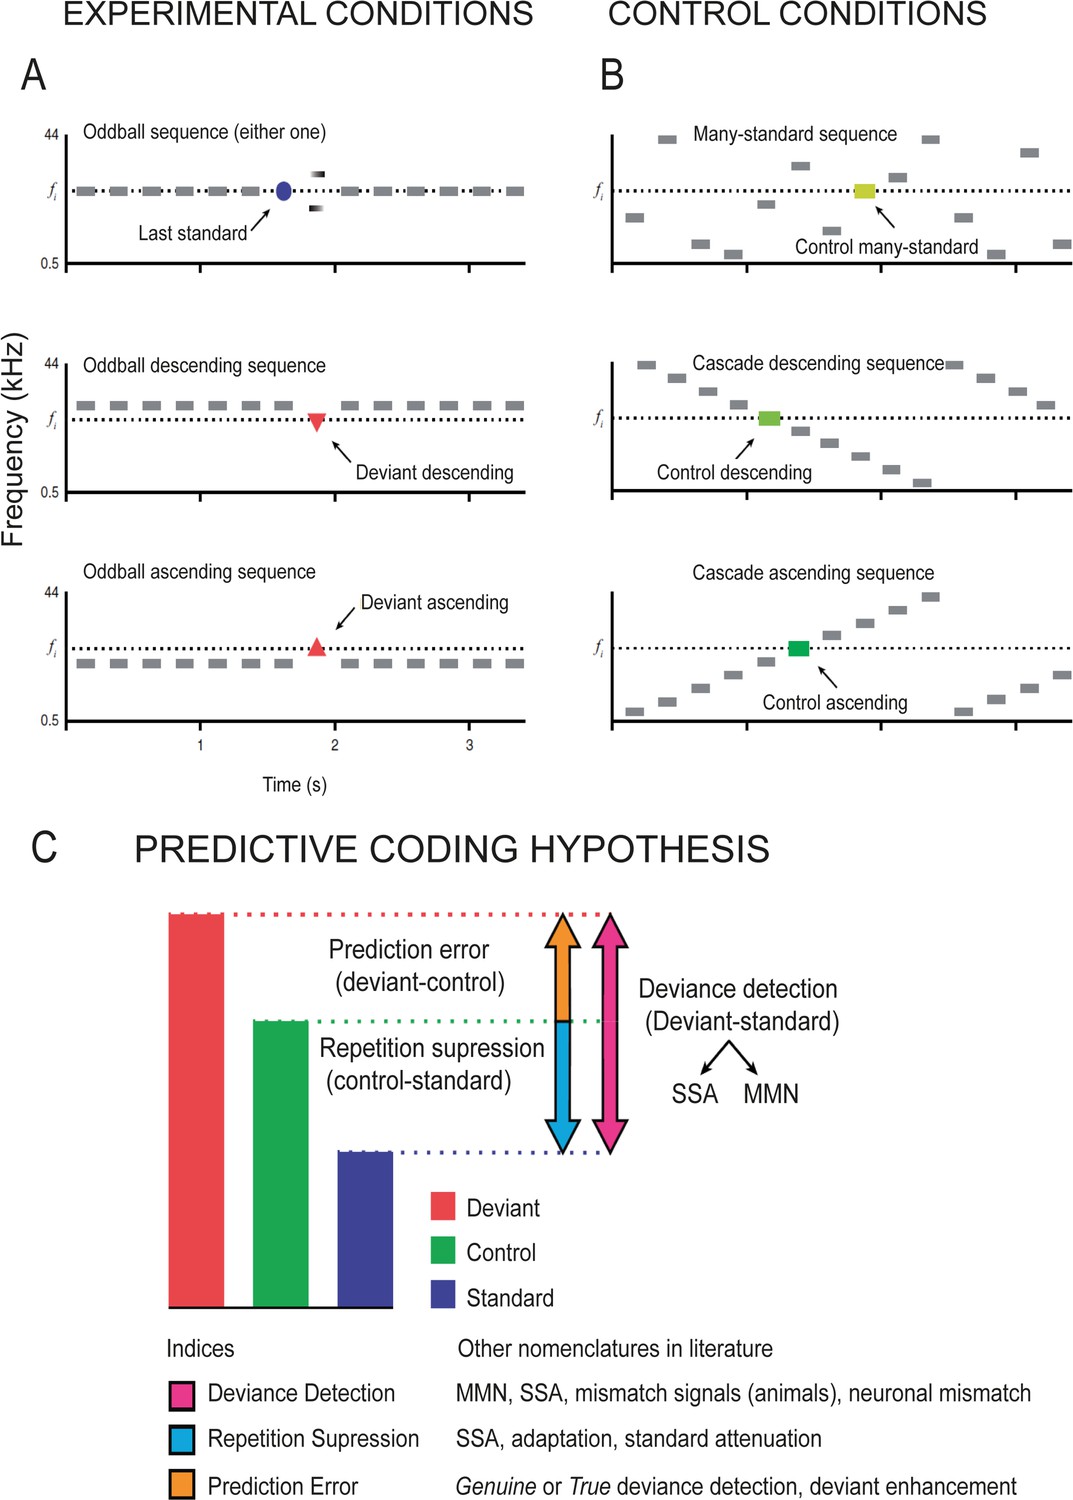
Experimental paradigms and Interpretation of the control conditions.
(A) Classic oddball paradigm, showing three possible experimental conditions for a given fi target tone: STD (blue circle, top panel), DEV descending (red triangle pointing downwards, middle panel), and DEV ascending (red triangle pointing upwards, bottom panel). (B) CTR sequences highlighting the fi target tone. In the many-standard control (very light green rectangle), the target tone is embedded within a random succession of equiprobable tones, making it impossible for the system to establish a precise prediction or accurately encode a regularity. Two versions of the cascade sequence: Cascade descending sequence (light green rectangle) and Cascade ascending sequence (dark green rectangle) are compared with the DEV descending and ascending, respectively. In both versions, the target tone fi is embedded in a regular succession of equiprobable tones in both cases. This allows the system to generate a precise prediction or encode that regularity, because it is not violated by the appearance of the target tone fi, as opposed to DEV. (C) Decomposition of the differential response by means of the control condition (green bar), yielding indices of mismatch (iMM, in magenta), prediction error (iPE, in orange), and repetition suppression (iRS, in cyan). Modified after Carbajal and Malmierca, 2020; Carbajal and Malmierca, 2018.
Figure 8

Dependence of the variance of predictive coding indexes on the selectivity index (SI) before acetylcholine (ACh) application, as well as and on auditory cortex (AC) depth.
Violin plots show the distribution of the neuronal mismatch (iMM), prediction error (iPE), and repetition suppression (iRS) indexes based on the SI value before application (a-c; low SI: SI <0.6143; high SI: SI <0.6143, see text) or the AC depth (d-f; deep: >650 µm; superficial: <650 µm). Bar graphs show the variance of the related indexes. Error bars indicate 95% CI. The results before ACh application are shown on a white background (control), while shaded backgrounds represent the results during ACh application (effect). The application of ACh reduced significantly iMM and iPE (a and b, top row) for those frequencies with high baseline SI, as well as iRS (c, top row) for frequencies with low baseline SI. The variance of all indexes increased significantly during ACh application, except for the iPE of the low SI group. Regarding the depth of the recording sites, ACh did not significantly change the values of any indexes, neither for deep nor for superficial units (d-f, top row). However, ACh significantly increased the variance of all indexes for deep units, but not for superficial units (d-f, bottom row). *p<0.05; **p<0.01; ***p<0.001.
-
Figure 8—source data 1
Source data for Figure 8.
- https://cdn.elifesciences.org/articles/91475/elife-91475-fig8-data1-v2.xlsx
Figure 9
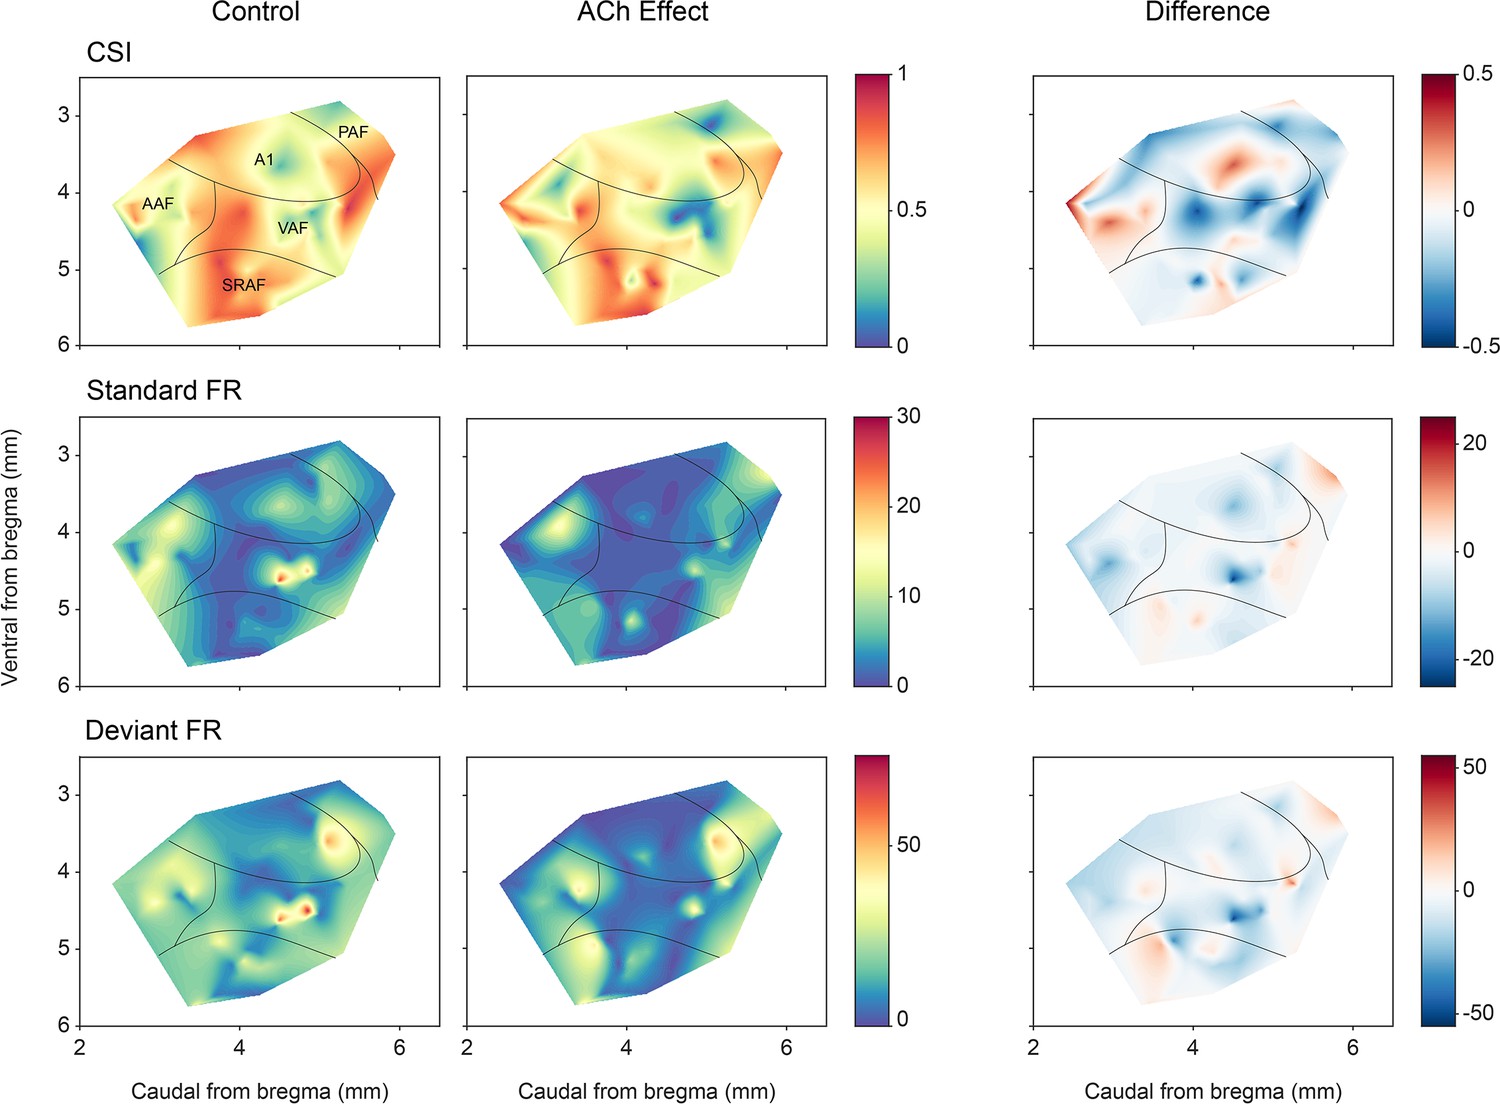
Anatomical localization of common SSA index (CSI) and responses to the deviant and standard tones.
Distribution of CSI (top row) and responses (spikes per trial) for deviant (bottom row) and standard tones (middle row), before and after acetylcholine (ACh) application, as well as the difference between both conditions.
-
Figure 9—source data 1
Source data for Figure 9.
- https://cdn.elifesciences.org/articles/91475/elife-91475-fig9-data1-v2.xlsx
Figure 10
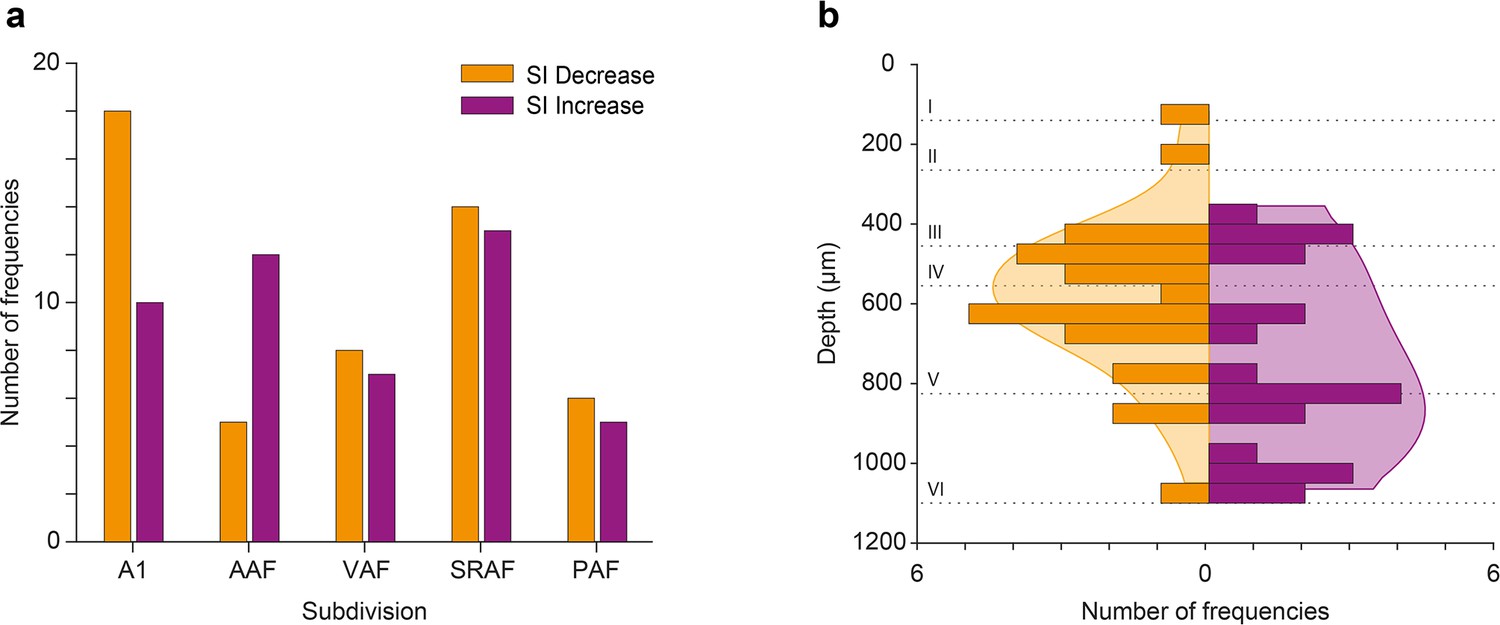
Effect of acetylcholine (ACh) on neuronal mismatch (nMM) in auditory cortex (AC) fields and layers.
(a) Number of tested frequencies in which selectivity index (SI) decreased (orange) or increased (purple) for each AC field. In A1 it is more likely to find frequencies showing SI decrease, while in anterior auditory field (AAF) it is more likely to find those showing SI increase. In VAR, SRAF, and PAF, the likelihood of both types is similar. (b) Distribution of tested frequencies in which SI decreased (orange) or increased (purple) significantly due to the effect of ACh, across AC layers. The shaded background depicts the probability density functions. Note that units experiencing SI decrease are more prevalent around the granular layer (layer IV), while units experiencing SI increase are more commonly found in the infragranular layers.
-
Figure 10—source data 1
Source data for Figure 10.
- https://cdn.elifesciences.org/articles/91475/elife-91475-fig10-data1-v2.xlsx
Figure 11
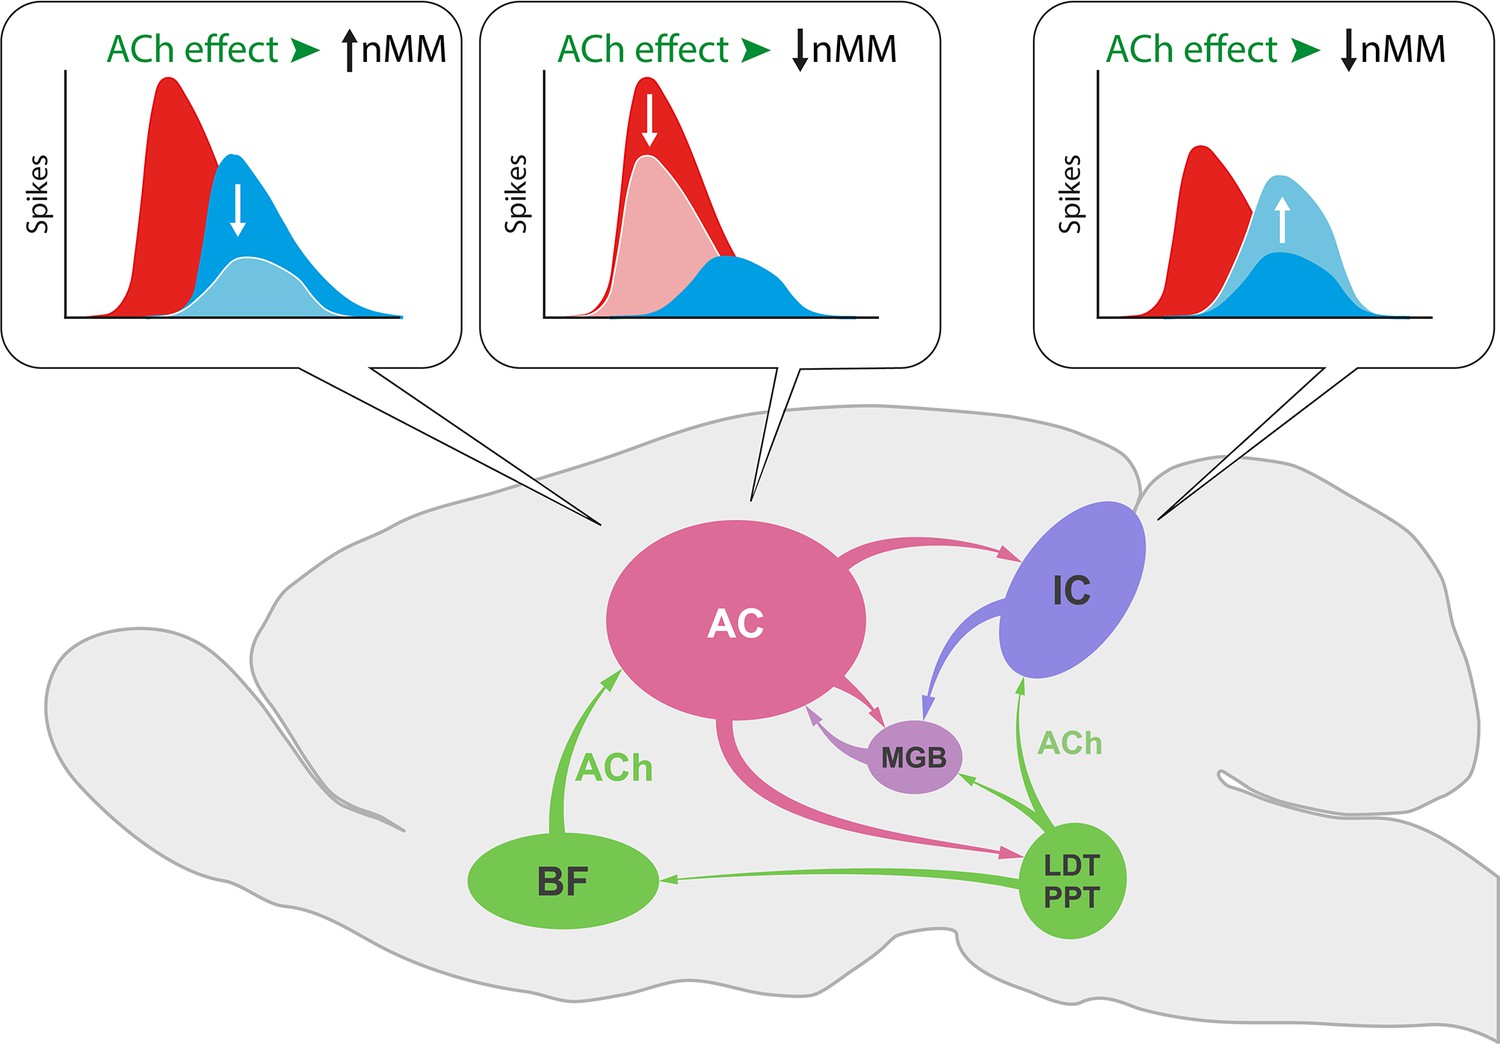
Effect of acetylcholine (ACh) on neuronal mismatch (nMM) in auditory midbrain and cortex.
ACh increases nMM in the auditory cortex (AC) reducing the firing rate in response to either ‘deviants’ or ‘standards,’ while it shows a different effect in the IC, as ACh decreases nMM by increasing the responses to the ‘standard’ tones (Ayala and Malmierca, 2015). These divergent effects may be explained by the different connectivity of both auditory areas. While the AC receives its cholinergic input from the basal forebrain (BF), the IC is innervated by the pedunculopontine (PPT) and laterodorsal tegmental (LDT) regions in the brainstem. This intersection of auditory and cholinergic nuclei creates an intricate network involving ascending and descending projections that ultimately modulate the processing of auditory deviance detection.
Additional files
Download links
A two-part list of links to download the article, or parts of the article, in various formats.
Downloads (link to download the article as PDF)
Open citations (links to open the citations from this article in various online reference manager services)
Cite this article (links to download the citations from this article in formats compatible with various reference manager tools)
Acetylcholine modulates the precision of prediction error in the auditory cortex
eLife 12:RP91475.
https://doi.org/10.7554/eLife.91475.3


