Open-top Bessel beam two-photon light sheet microscopy for three-dimensional pathology
- Department of Mechanical Engineering, Pohang University of Science and Technology, Republic of Korea
- Department of Medicine, University of Ulsan College of Medicine, Seoul, Republic of Korea
- Department of Dermatology, College of Medicine, Yonsei University, Republic of Korea
- Department of Pathology, School of Medicine, Kyungpook National University, Republic of Korea
- Department of Pathology, Asan Medical Center, University of Ulsan College of Medicine, Republic of Korea
- Medical Science and Engineering Program, School of Convergence Science and Technology, Pohang University of Science and Technology, Republic of Korea
- Institute for Convergence Research and Education in Advanced Technology, Yonsei University, Republic of Korea
Figures
Figure 1 with 1 supplement
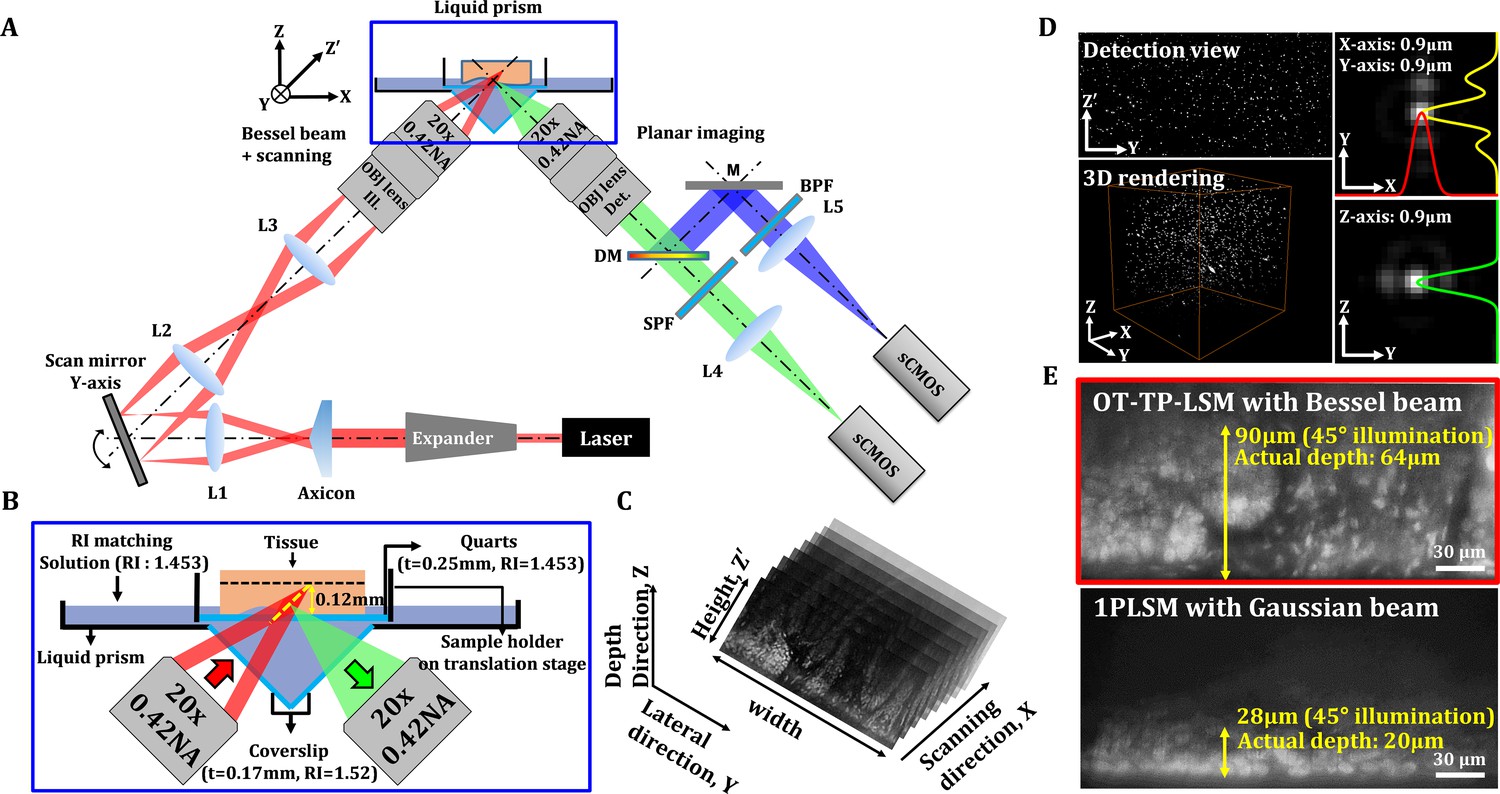
Schematics and characteristics of open-top two-photon light sheet microscopy (OT-TP-LSM).
(A) Overall design of OP-TP-LSM. L: lens; M: mirror; DM: dichroic mirror; SPF: short pass filter; BPF: band pass filter; OBJ: objective lens. (B) Detailed schematic of the sample interface, including the liquid prism filled with refractive index (RI)-matching solution. (C) Illustration of sequential light sheet imaging with stepwise lateral translation. (D) Image resolution characterized by three-dimensional (3D) imaging of 0.5 µm fluorescent microspheres. (E) Imaging depth characterized by imaging a proflavine-labeled fresh human skin specimen in comparison with that of one-photon light sheet microscopy (1PLSM) using Gaussian excitation sheet.
Figure 1—figure supplement 1
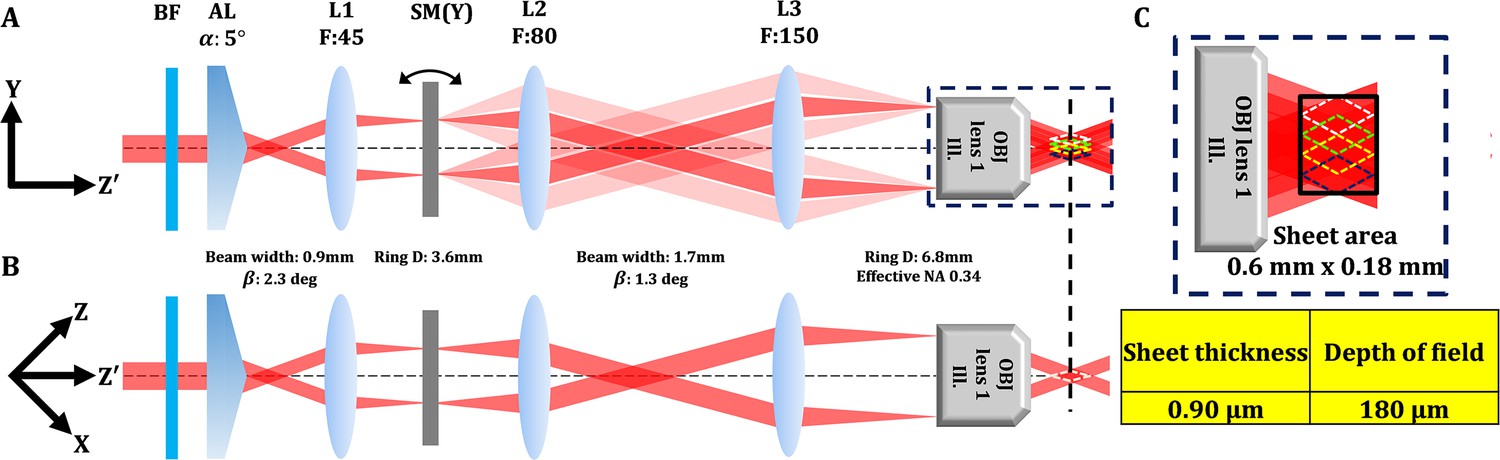
Detail optical configuration of illumination arm in open-top two-photon light sheet microscopy (OT-TP-LSM).
(A) Illustration of beam path at Y-Z' plan. L: lens, BF: barrier filter, AL: axicon lens, SM: scanning mirror, OBJ: objective lens. Two-photon light sheet with extended depth of field (DOF) was generated by scanning a Bessel beam in the Y-axis direction rapidly. (B) Illustration of beam path at Z-X plan. (C) Magnified image and designed dimension of the Bessel beam based light sheet. The excitation light sheet was designed to have a DOF of 180 μm with a thickness of 0.9 μm.
Figure 2 with 1 supplement
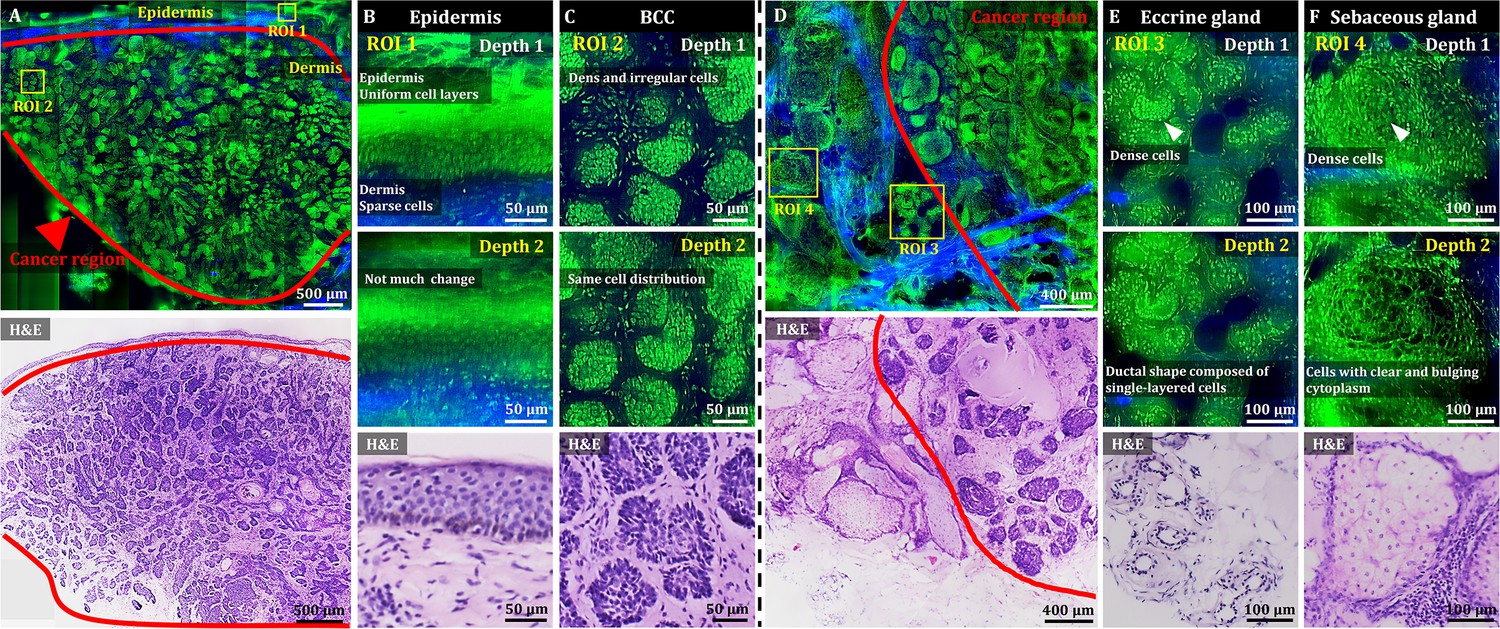
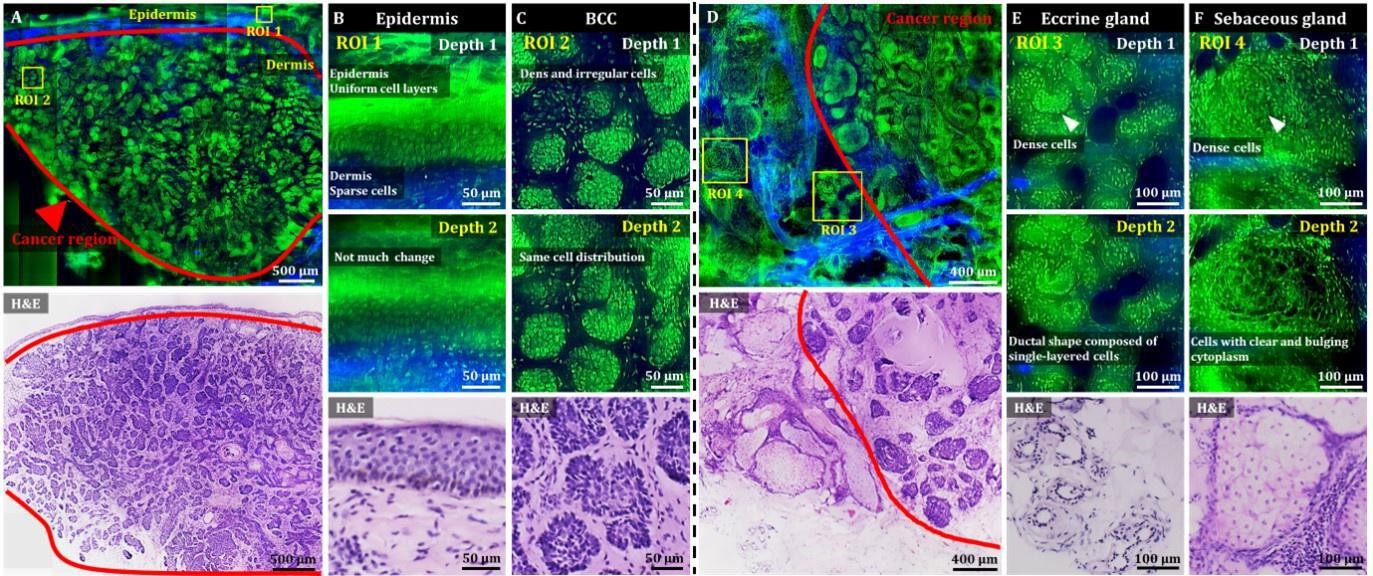
3D OT-TP-LSM images of fresh human skin cancer (basal cell carcinoma, BCC) specimens.
(A) Large-sectional OT-TP-LSM and hematoxylin and eosin (H&E) stained slide images of a BCC case 1. Red solid line indicates BCC area. (B and C) Two magnified images of regions of interest (ROIs) with corresponding H&E images. ROI 1 and 2 were in the epidermis and superficial dermis and the BCC region below, respectively. (D) Large-sectional OT-TP-LSM and H&E images of a BCC case 2. Red solid line indicates BCC area. (E and F) Two magnified images of ROIs with corresponding H&E images. ROI 3 and 4 were in eccrine and sebaceous glands, respectively. Superficial cell layers of both glands are marked with a white arrow. In the OT-TP-LSM images, proflavine fluorescence and second harmonic generation (SHG) are displayed in green and blue, respectively.
Figure 2—video 1
Three-dimensional (3D) visualization of basal cell carcinoma (BCC) structures and normal cell structures.
Figure 3 with 2 supplements
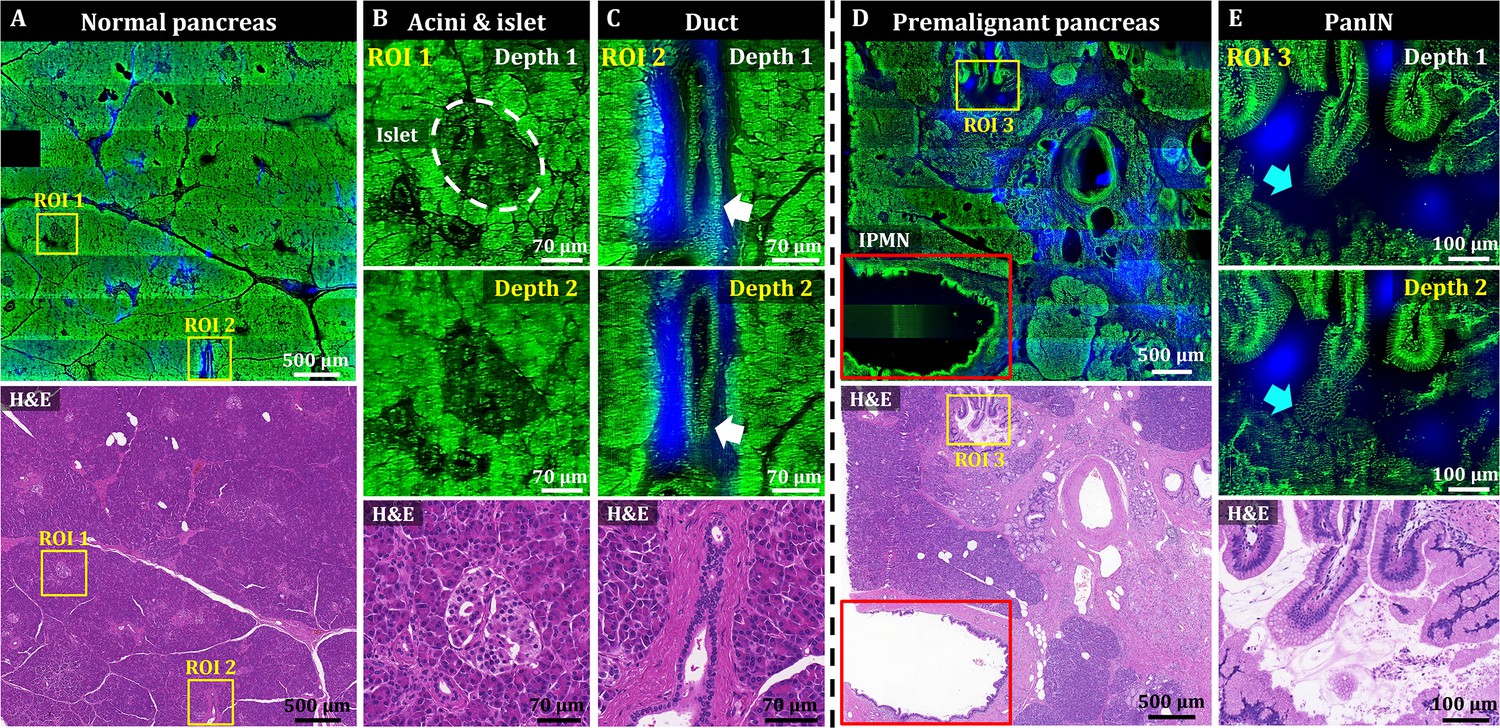
3D OT-TP-LSM images of two human pancreas specimens: normal and premalignant lesion.
(A) Large-area OT-TP-LSM and H&E stained images of normal human pancreas. (B and C) Magnified two-depth OT-TP-LSM images of ROI 1 and 2 in the normal pancreas and the corresponding H&E stained slide images. ROI 1 and 2 were on the acini and islets of Langerhans and the pancreatic duct, respectively. 3D morphological change of the duct was marked with a white arrow. (D) Large-area OT-TP-LSM and H&E stained images of a pancreatic premalignant lesion. Red box indicates the intraductal papillary mucinous neoplasm (IPMN). (E) Magnified two-depth OT-TP-LSM images of ROI 3 and corresponding H&E image of pancreatic intraepithelial neoplasia (PanIN). 3D morphological change of papillary in the PanIN was marked with a cyan arrow. In OT-TP-LSM images, propidium iodide (PI)-labeled cells and SHG-emitting collagen are displayed in green and blue, respectively.
Figure 3—figure supplement 1
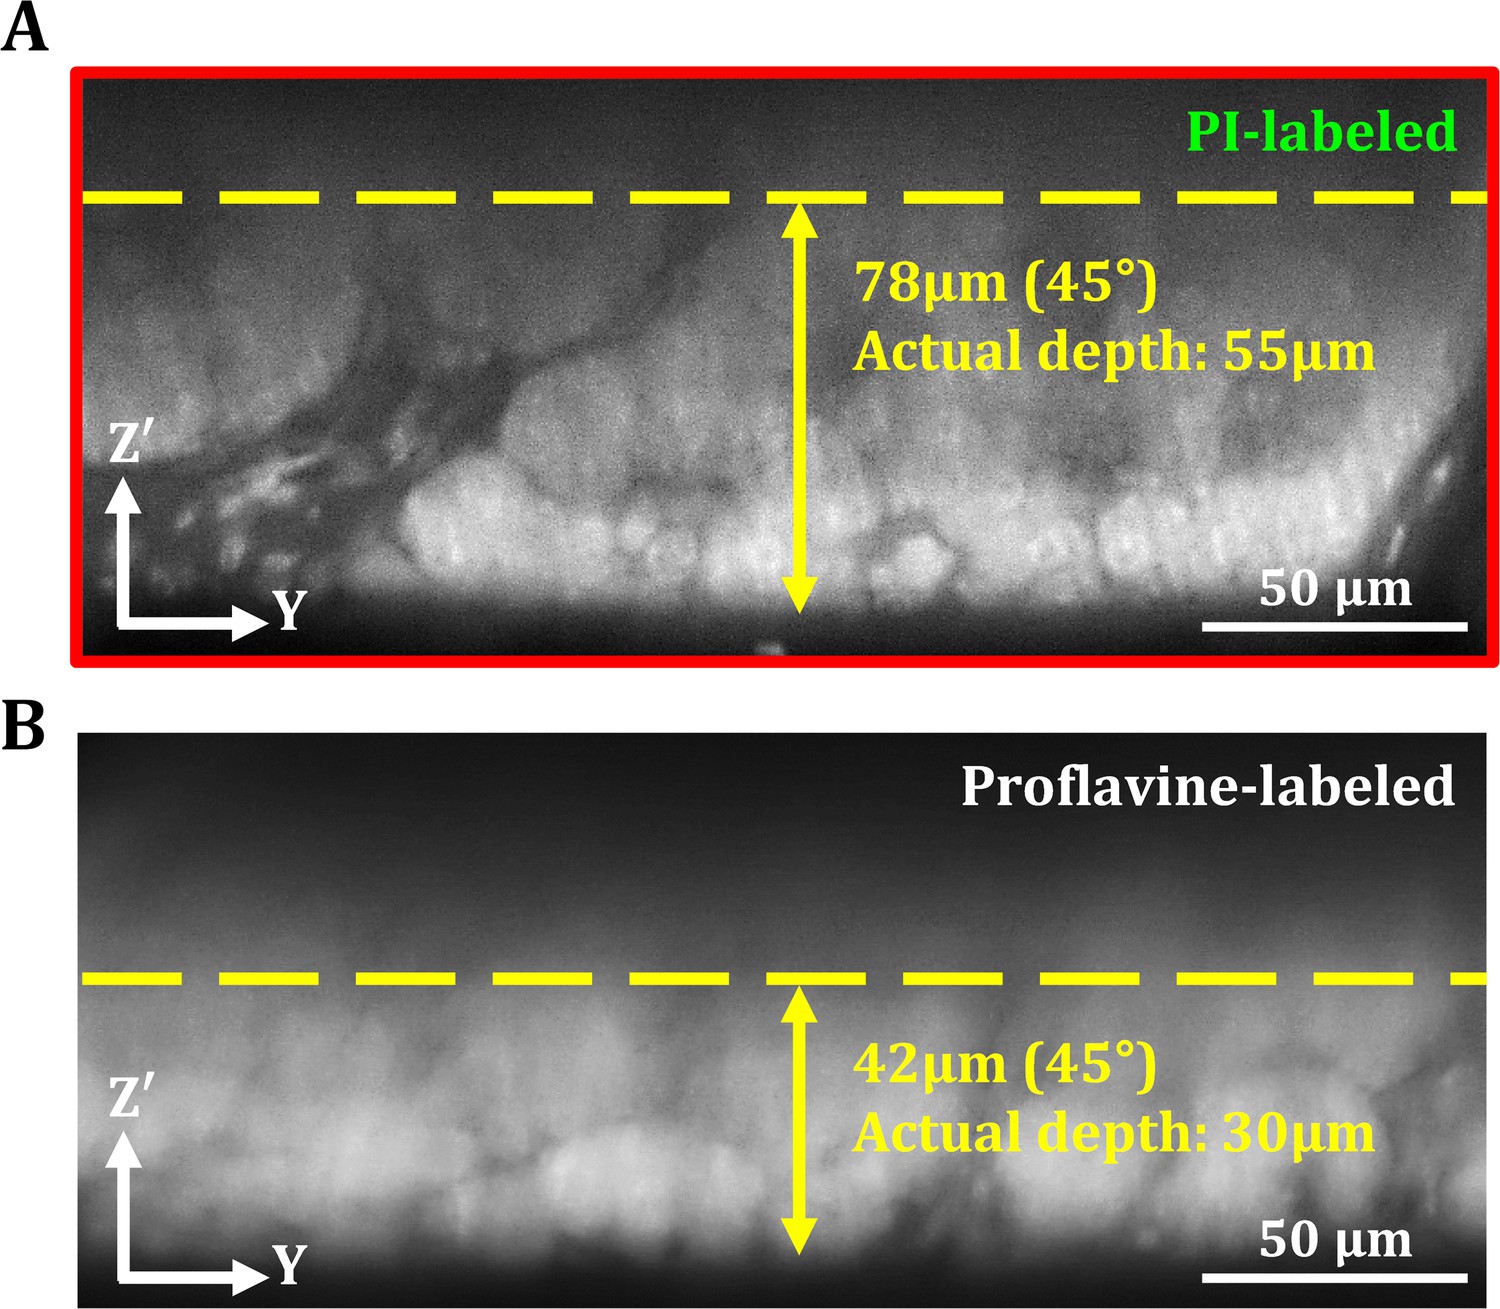
Comparison of imaging depth between propidium iodide (PI) and proflavine in human pancreas.
(A) 45° oblique OT-TP-LSM image of pancreas specimens after PI cell labeling. (B) 45° oblique OT-TP-LSM image of pancreas specimens after proflavine cell labeling. PI labeling enabled the deeper imaging up to approximately 55 µm from the surface owing to its relatively long peak emission wavelength compared to proflavine. Both pancreas specimens were incubated with PI and proflavine for 5 min, respectively.
Figure 3—figure supplement 2
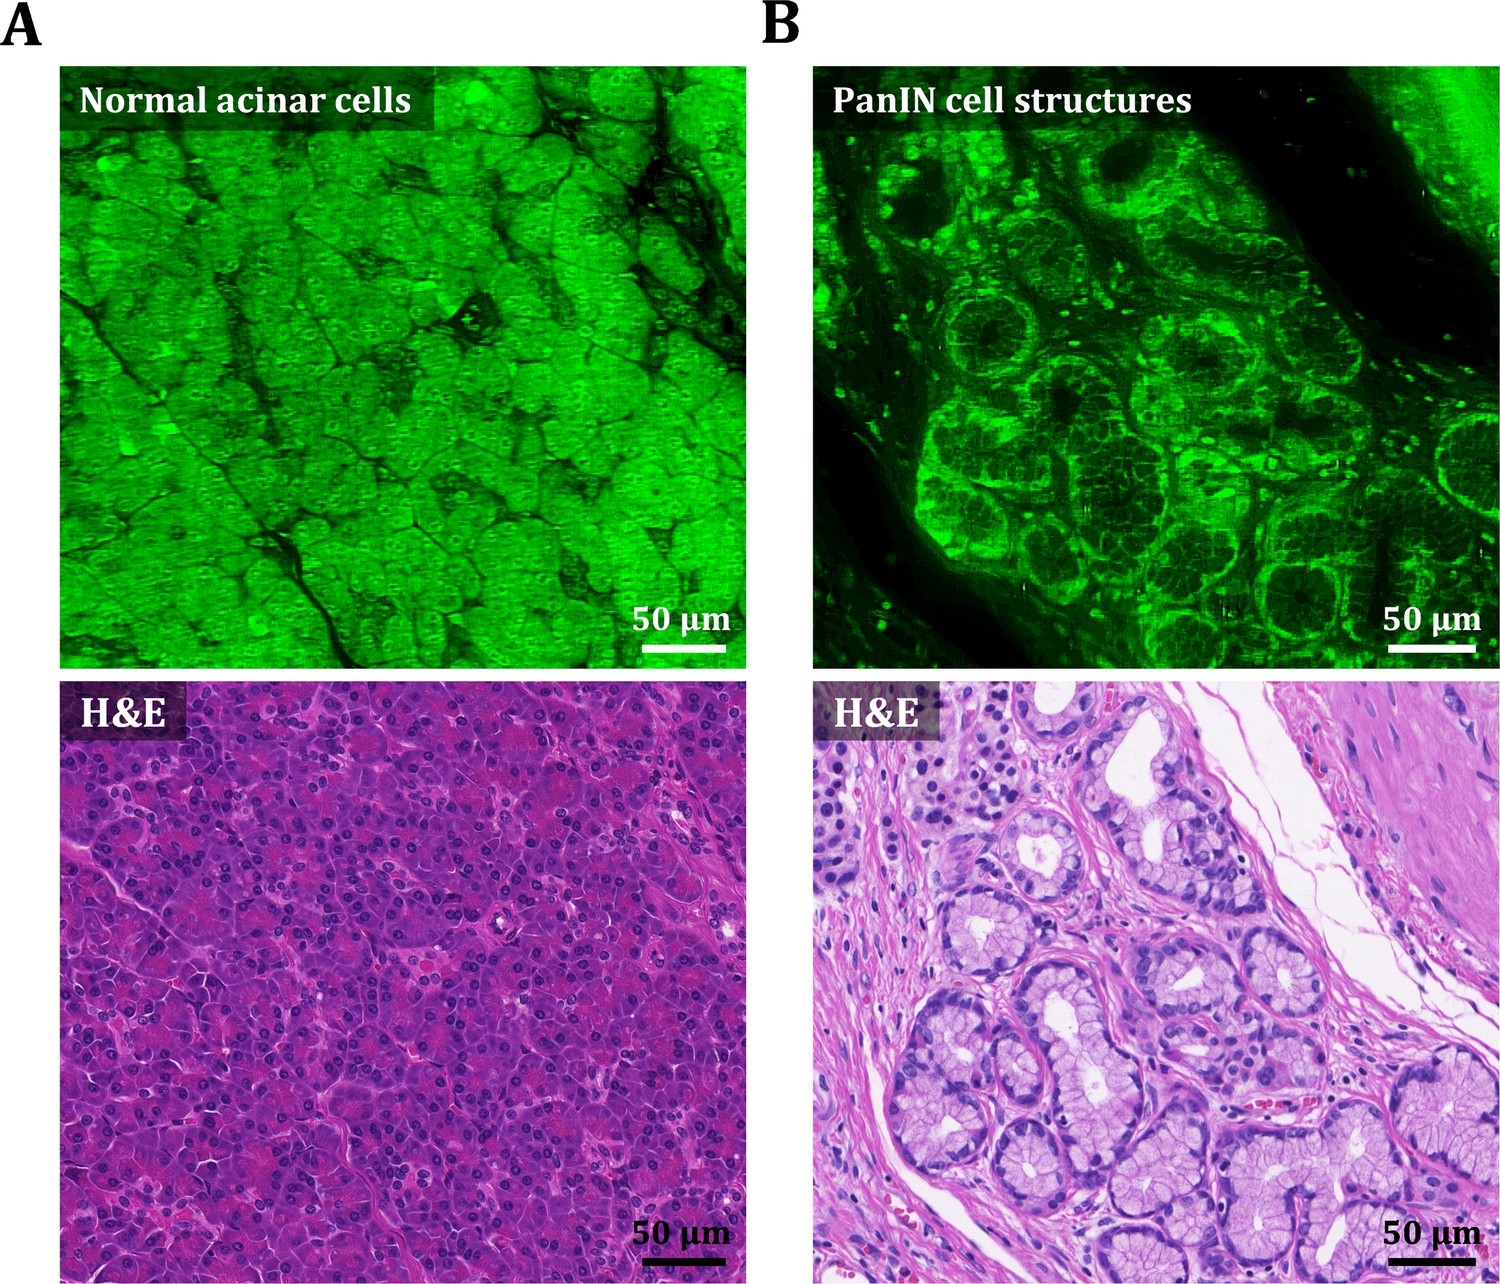
PI cell staining characteristics in human pancreas.
(A) OT-TP-LSM image of acinar cell structures in normal pancreas specimens after PI cell labeling and corresponding H&E image. (B) OT-TP-LSM image of pancreatic intraepithelial neoplasia (PanIN) structures in premalignant pancreas after PI cell labeling and corresponding H&E image. In OT-TP-LSM images, PI fluorescence was displayed in green color. PI showed nuclear and cytoplasmic labeling properties of cells in both acini and neoplastic structures. Cell nuclei were identified with relatively strong and weak fluorescence in the membrane and core, respectively.
Figure 4
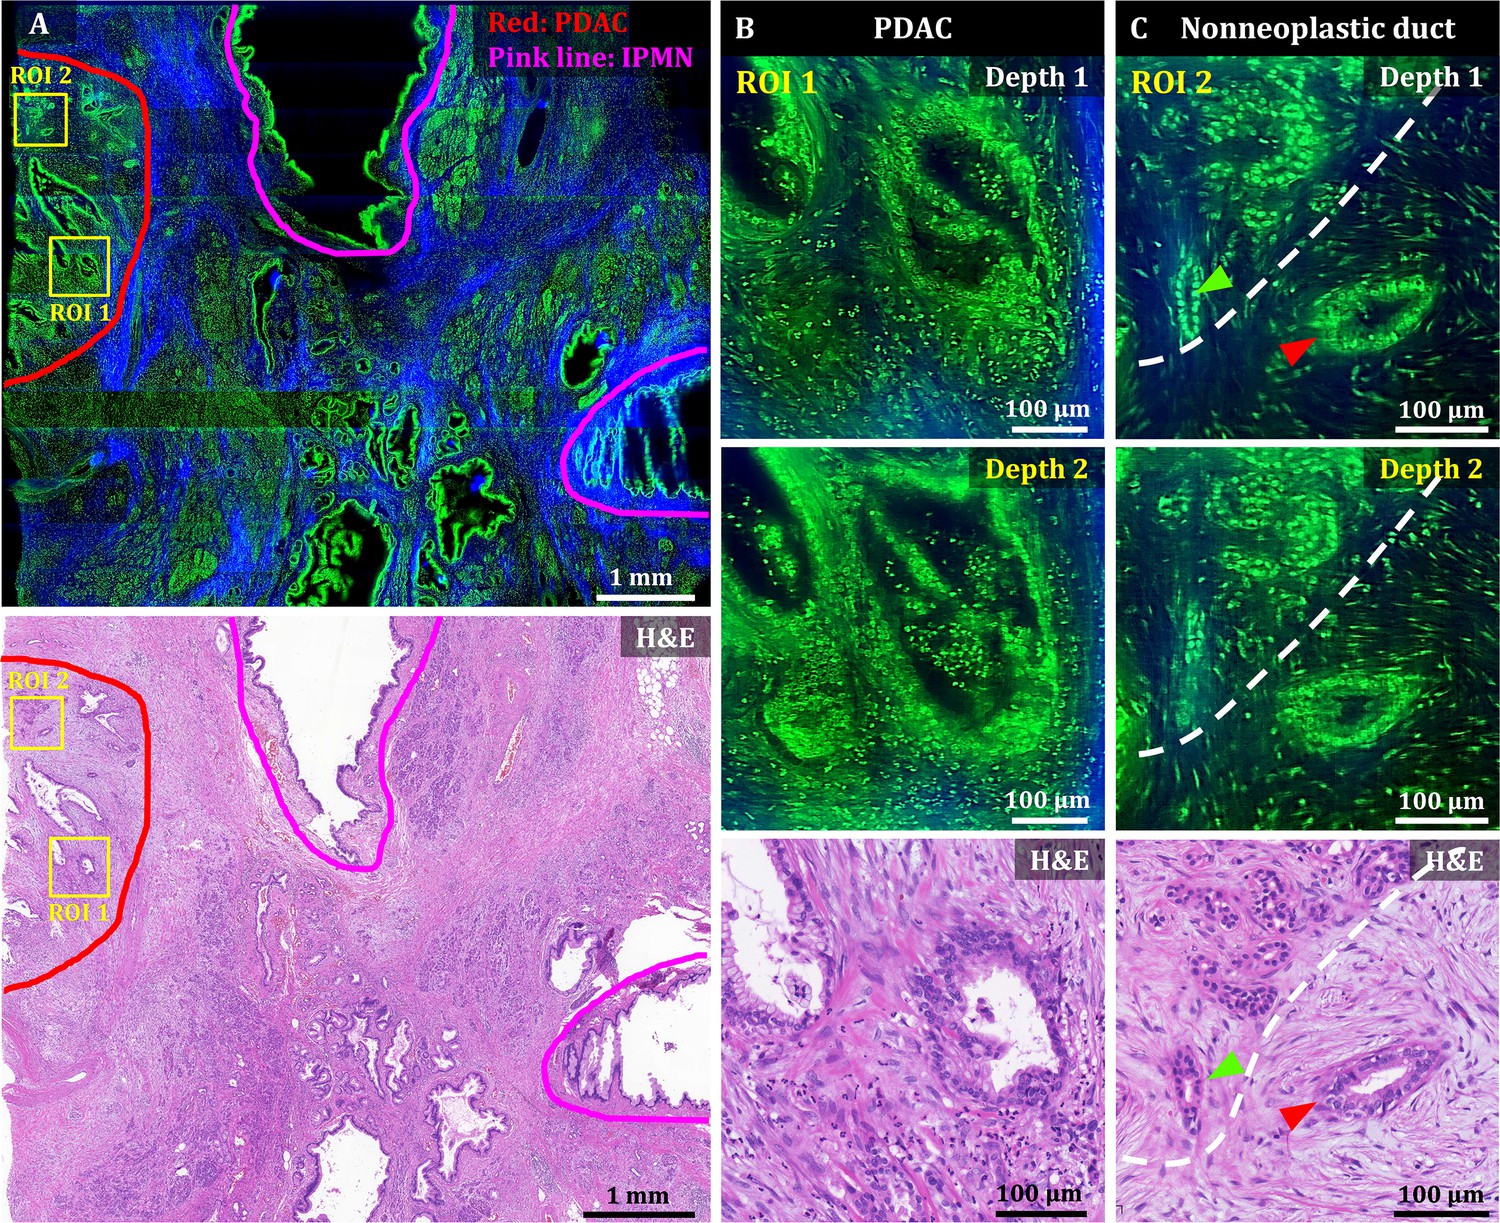
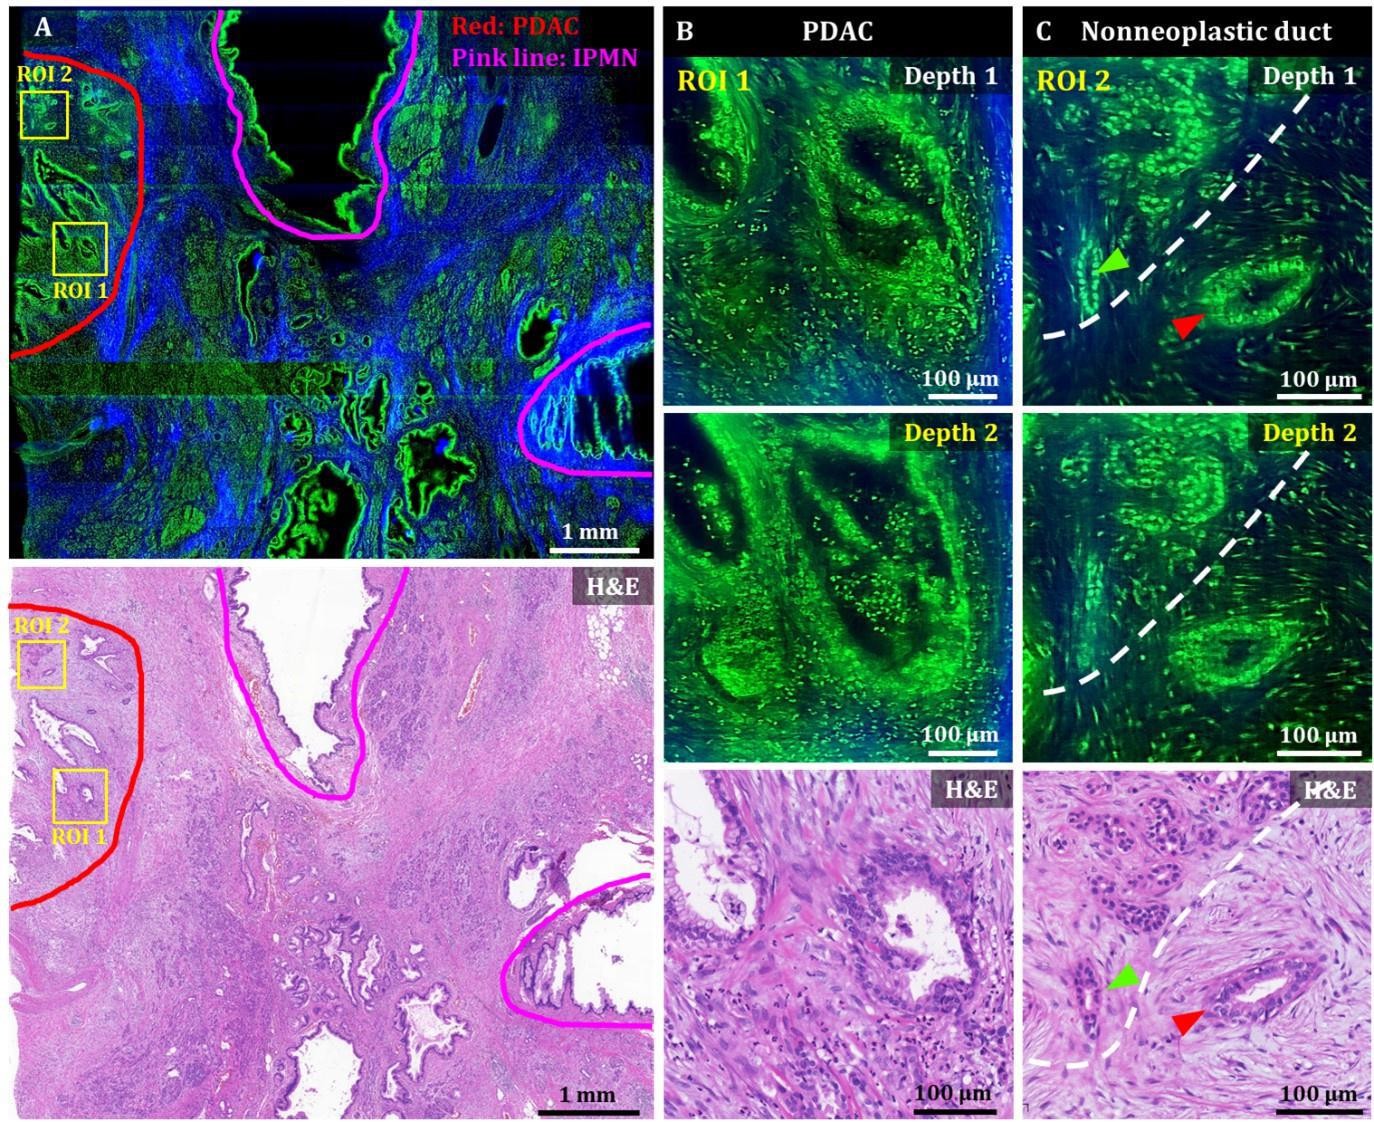
3D OT-TP-LSM images of human pancreatic ductal adenocarcinoma (PDAC).
(A) Large-area OT-TP-LSM and H&E stained slide images of PDAC arising from IPMN specimen. Red and pink solid line indicates the PDAC and the IPMN area, respectively. (B and C) Magnified two-depth OT-TP-LSM images of ROI 1 and 2 in the PDAC region and the corresponding H&E stained images. ROI 1 was on the PDAC, and ROI 2 was on the boundary region between nonneoplastic pancreatitis and PDAC, respectively. A nonneoplastic duct and a PDAC were marked with green and red arrows, respectively. A white dashed line indicated the boundary between nonneoplastic pancreatitis and PDAC. In the OT-TP-LSM images, PI-labeled cells and SHG-emitting collagen are displayed in green and blue, respectively.
Figure 5
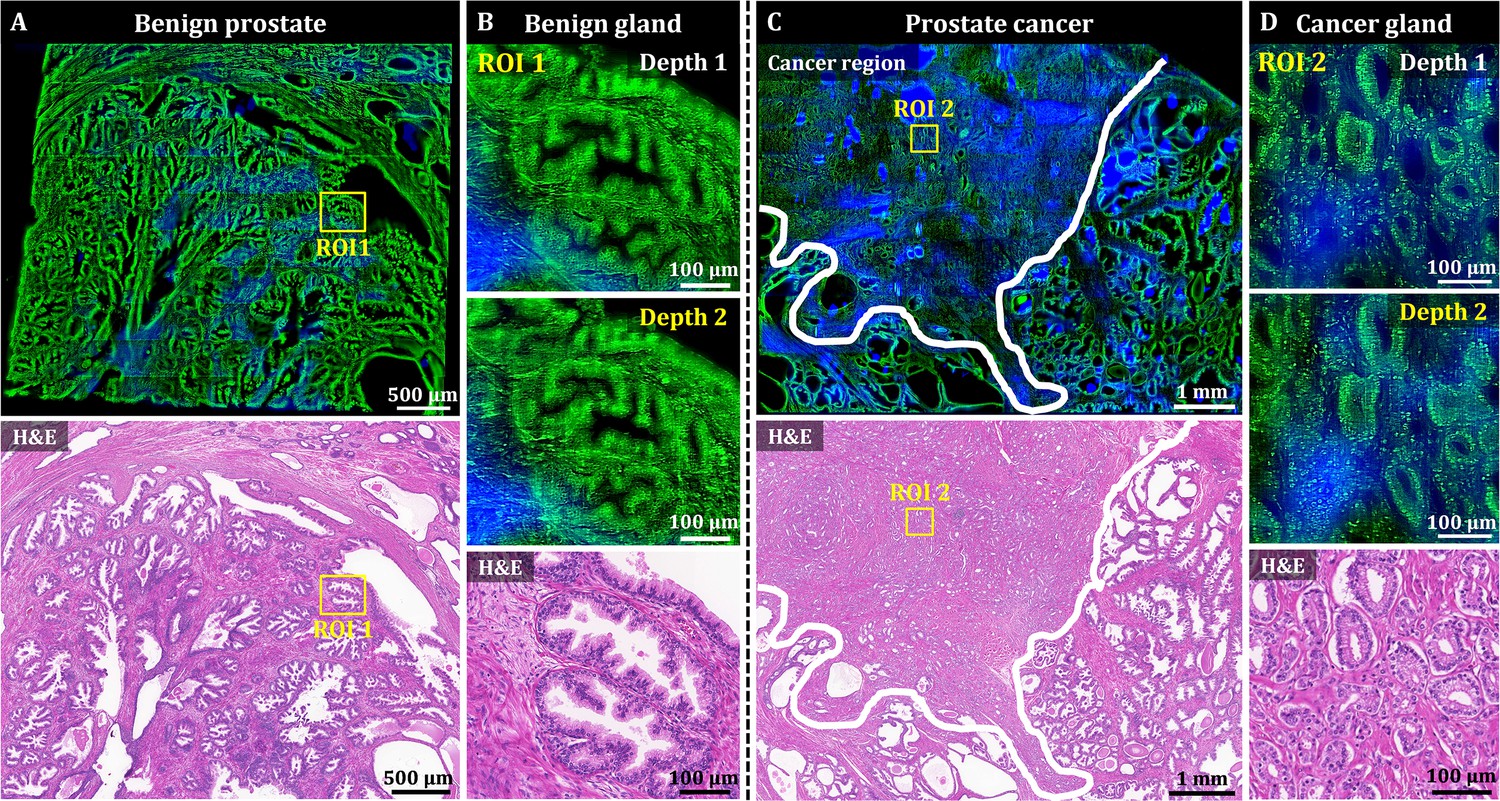
3D OT-TP-LSM images of human prostate specimens: benign and adenocarcinoma.
(A) Large-area OT-TP-LSM and H&E stained slide images of a benign prostate specimen. (B) Magnified two-depth OT-TP-LSM images of ROI 1 in the benign gland and a corresponding H&E image. (C) Large-area OT-TP-LSM and H&E images of a prostatic cancer specimen. A white solid line indicated the boundary between adenocarcinoma and benign regions. (D) Magnified two-depth OT-TP-LSM images of ROI 2 in adenocarcinoma glands and a corresponding H&E image. In OT-TP-LSM images, PI-labeled cells and SHG-emitting collagen were visualized in green and blue, respectively.
Figure 6 with 1 supplement
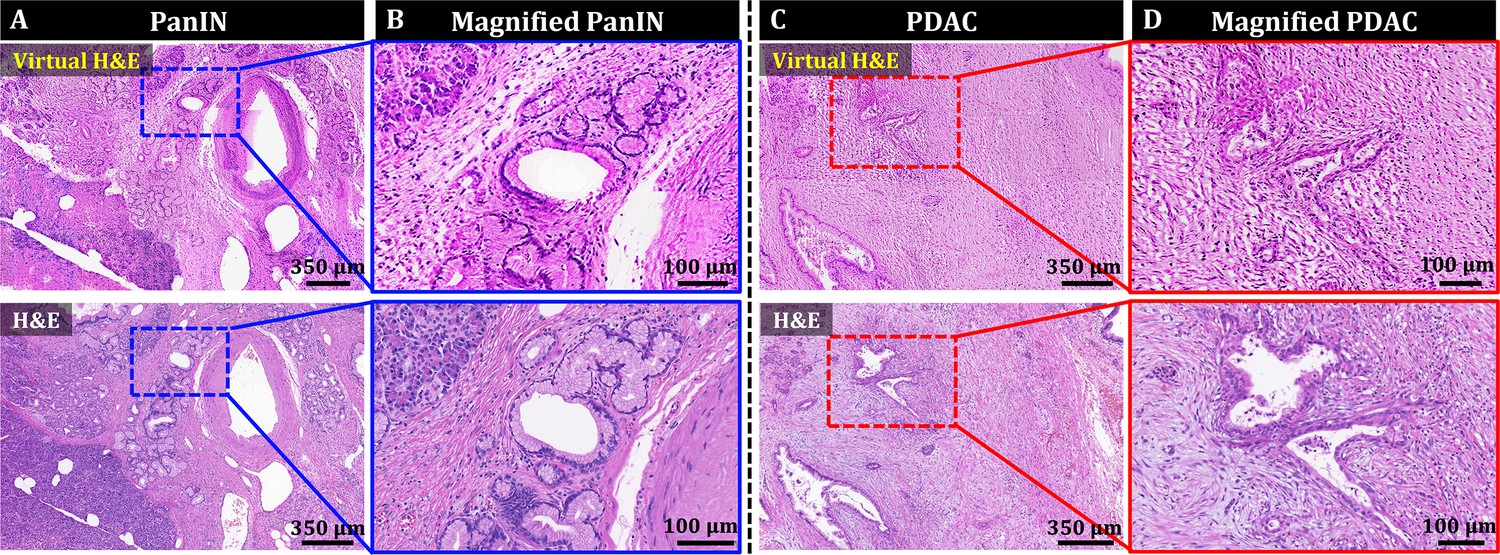
Style transfer of OT-TP-LSM images for virtual H&E by cycle-consistent generational adversarial networks (CycleGAN).
(A and C) Large-area virtual H&E images and corresponding H&E stained slide images of PanIN and PDAC specimens, respectively. (B and D) Magnified virtual H&E images and corresponding H&E stained images of PanIN and PDAC, respectively.
Figure 6—figure supplement 1
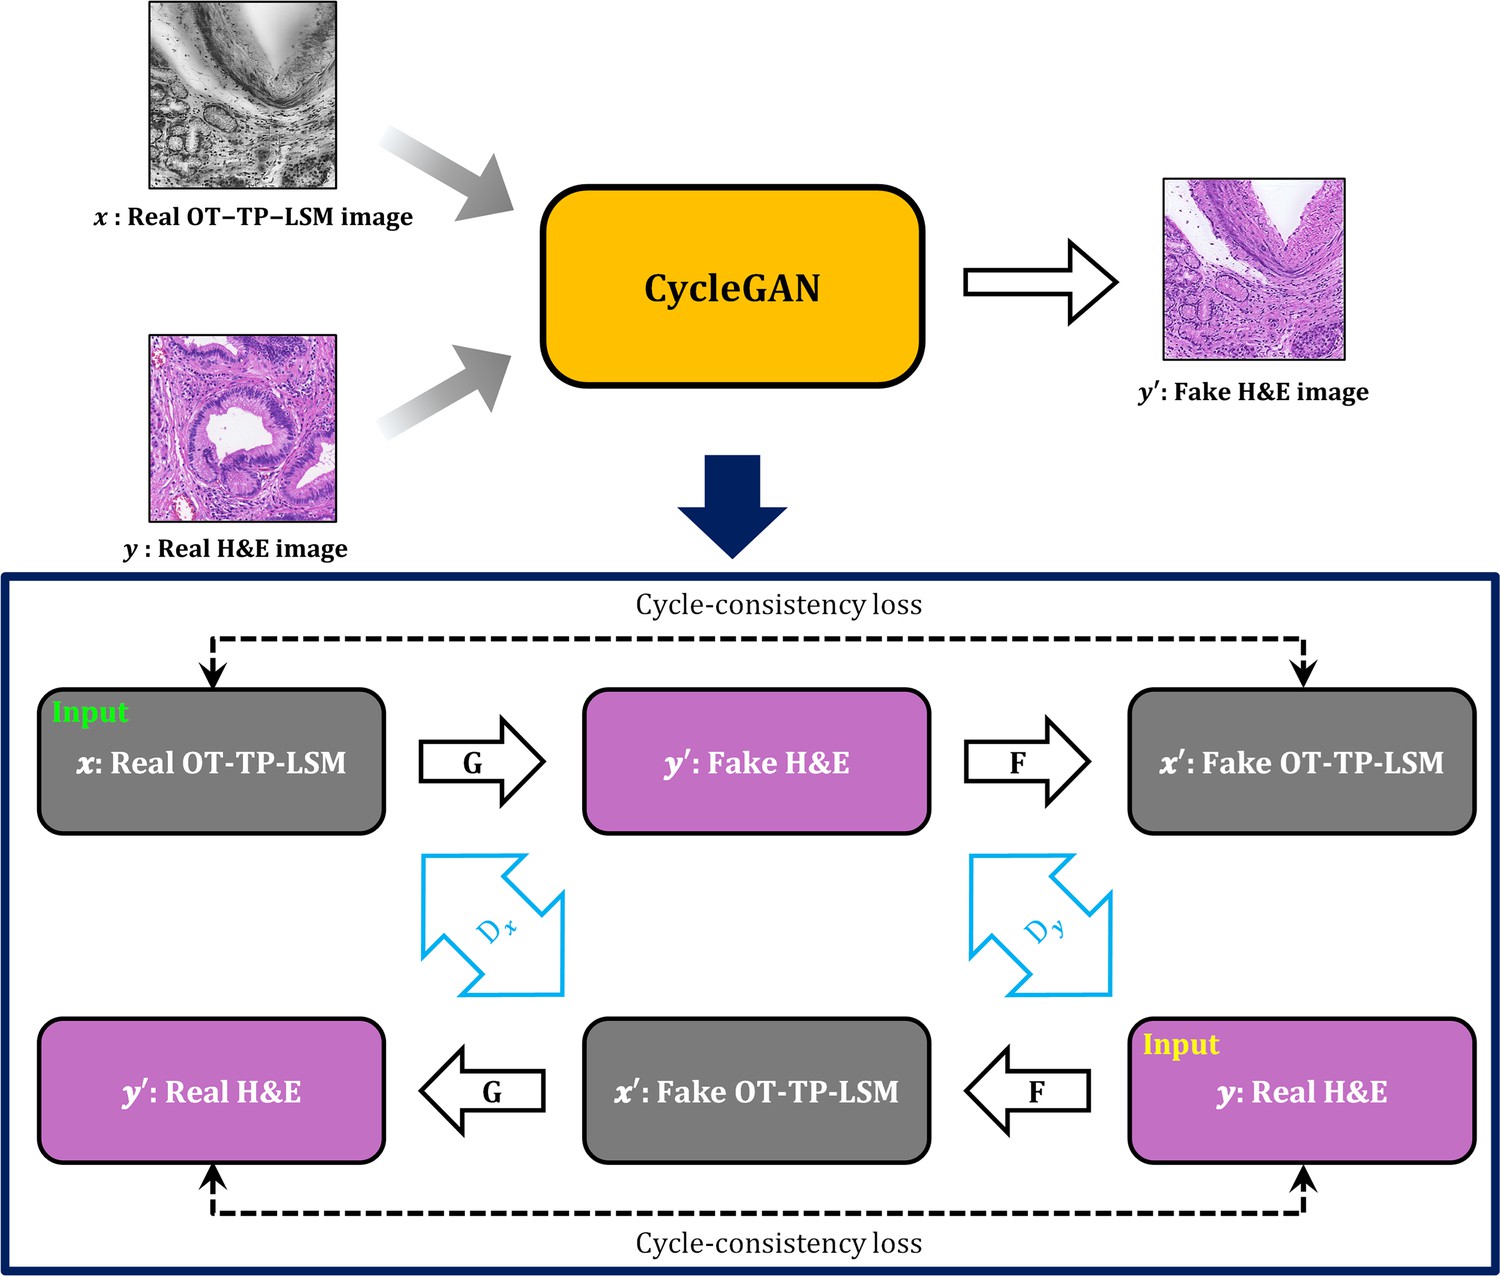
Cycle-consistent generational adversarial networks (CycleGAN) workflow for style transfer of OT-TP-LSM image to virtual hematoxylin and eosin (H&E) image.
Real OT-TP-LSM image and real H&E image were assigned as x and y, and the corresponding fake image is additionally marked with a prime. The generator G transformed the real OT-TP-LSM image into a fake virtual H&E stained image. Generator F transformed the real H&E image into a fake OT-TP-LSM image. The discriminator Dx classifies real OT-TP-LSM image x and fake OT-TP-LSM image x. The discriminator Dy classifies real H&E image y and fake virtual H&E image y. Both Cycle-consistent loss and adversarial loss were used as the loss function, which was to guarantee the performance of inverse transform from G and F by preserving the morphological features of real images.
Author response image 1
Author response image 2
Additional files
Download links
A two-part list of links to download the article, or parts of the article, in various formats.
Downloads (link to download the article as PDF)
Open citations (links to open the citations from this article in various online reference manager services)
Cite this article (links to download the citations from this article in formats compatible with various reference manager tools)
Open-top Bessel beam two-photon light sheet microscopy for three-dimensional pathology
eLife 12:RP92614.
https://doi.org/10.7554/eLife.92614.3


