Mutual inhibition among postmitotic neurons regulates robustness of brain wiring in Drosophila
- VIB, Belgium
- University of Leuven School of Medicine, Belgium
- University of Leuven, Belgium
- Howard Hughes Medical Institute, United States
Figures
Figure 1
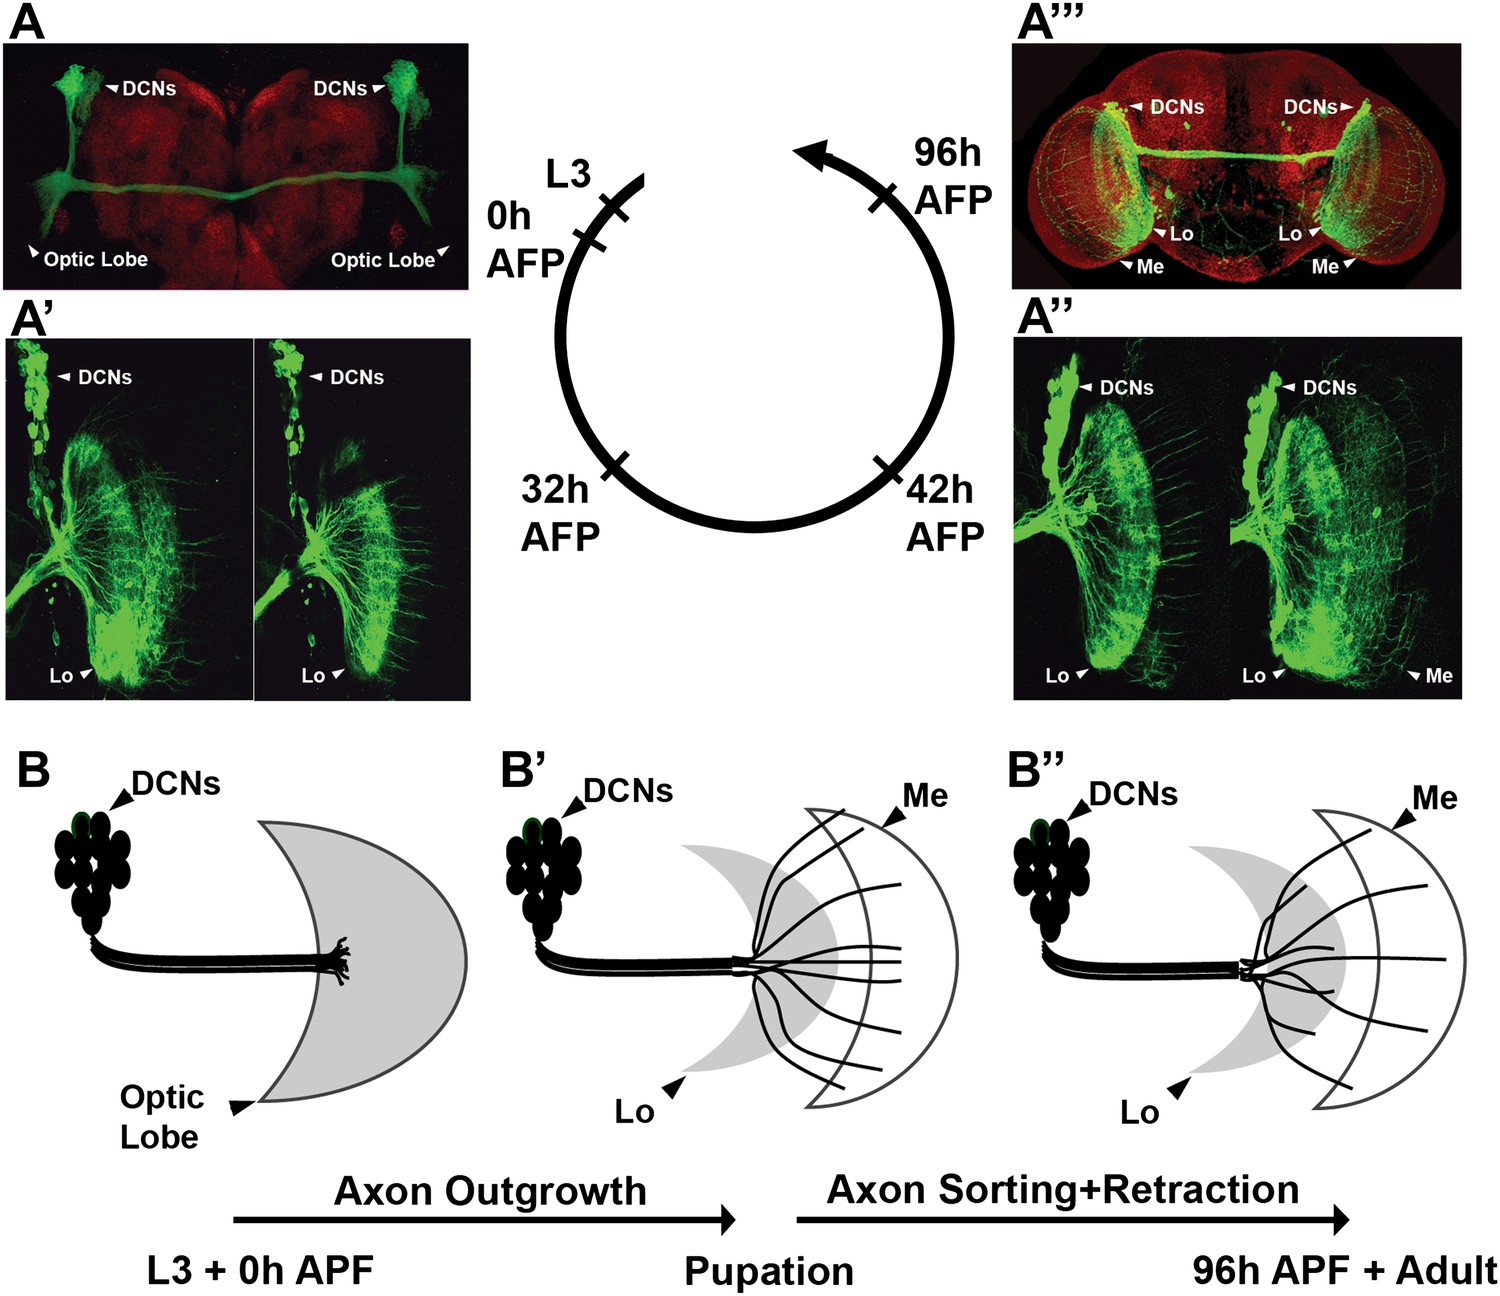
Development of the DCN wiring pattern.
The development of the DCN cluster during various time points. At L3 (A, B) the neurites of the DCNs innervate the optic lobe. (A′, A″, B′) During early pupation, DCN axons innervate the lobula and extend towards the medulla (32 hr APF). (A″) After a retraction process, axons which remain in the medulla start to branch while the other axons retract back to innervate the lobula (42 hr APF). (A‴, B″) At adult stage the axonal pattern of the DCNs is complete (96 hr APF). APF: after puparium formation; DCN: dorsal cluster neurons.
Figure 2 with 1 supplement
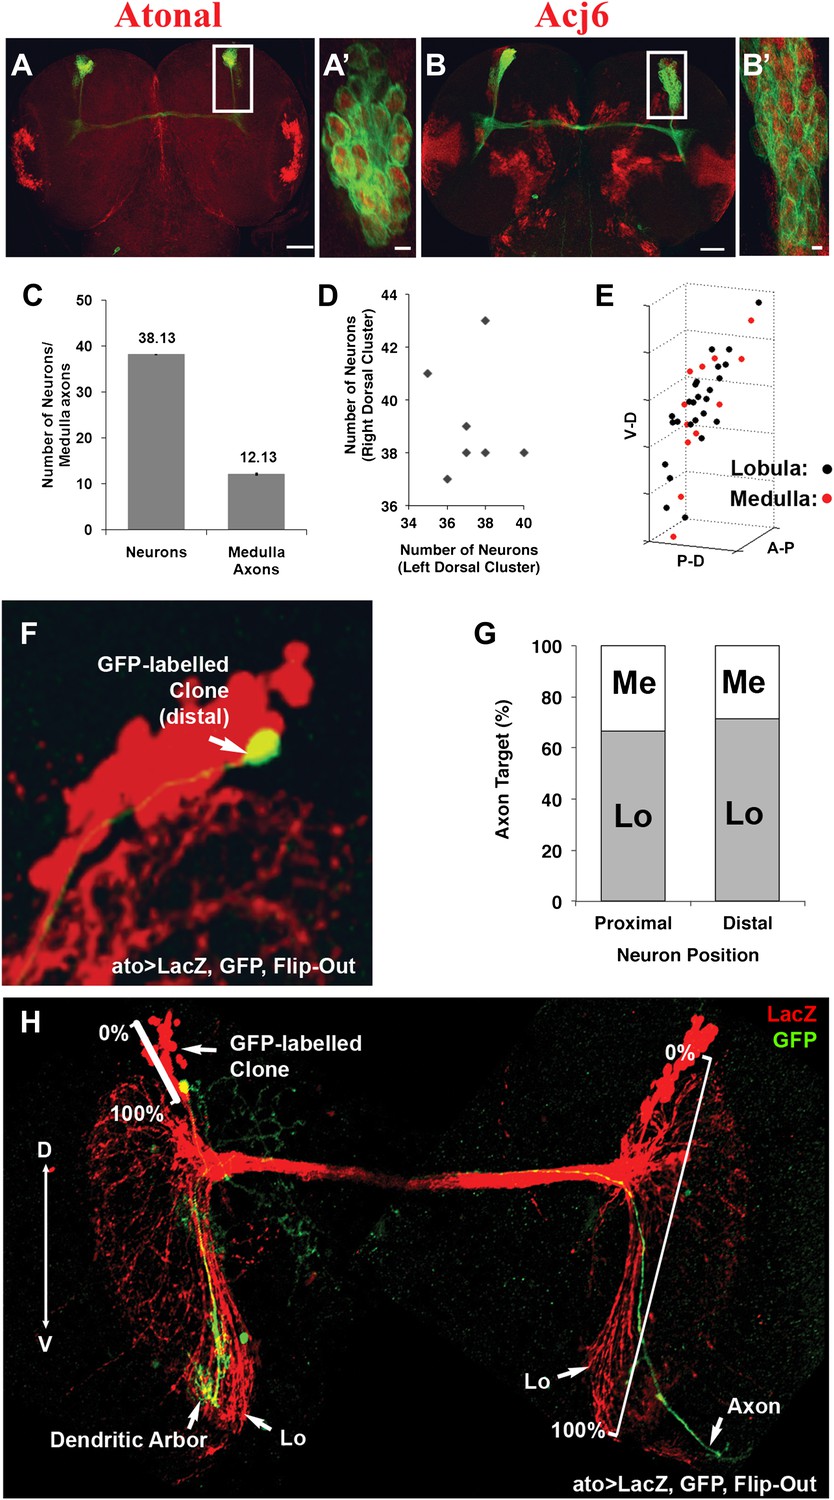
DCNs are equivalent, their lineage is intrinsically variable and does not predict the wiring pattern.
(A, A′) The cell fate marker atonal is expressed at L3 stage in all DCNs. (B, B′) Acj6, a cell fate marker is expressed in all DCNs at L3 stage. (A, B) Scale bar: 50 µm. (A′, B′) Scale bar: 5 µm. (C) Quantification of the number of DCN soma (38.13 ± 2 SD, n = 15) and medulla axons (12.13 ± 1.36 SD) (Data shown as mean ± SEM). (D) There is no correlation detectable between the number of neurons of the left and right clusters in individual brains (r = −0.112, n = 14). (E) 3D reconstruction of a single dorsal cluster. Red cells symbolize neurons innervating the medulla. These neurons are distributed along the D-V axis. (F) An example of a single GFP-positive DCN soma located distally within the dorsal cluster which is marked in red (LacZ). (G) Quantification of the position of a DCN soma (proximal, distal) within the dorsal cluster and its axon target choice of medulla or lobula neuropil (n = 16). There is no preference for axon target choice based on the cell body position within the cluster. (H) An example of the flip out technique used to analyze the relation between neuron position and axon position along the D-V axis. DCN: dorsal cluster neurons; D-V: dorsal–ventral.
Figure 2—figure supplement 1
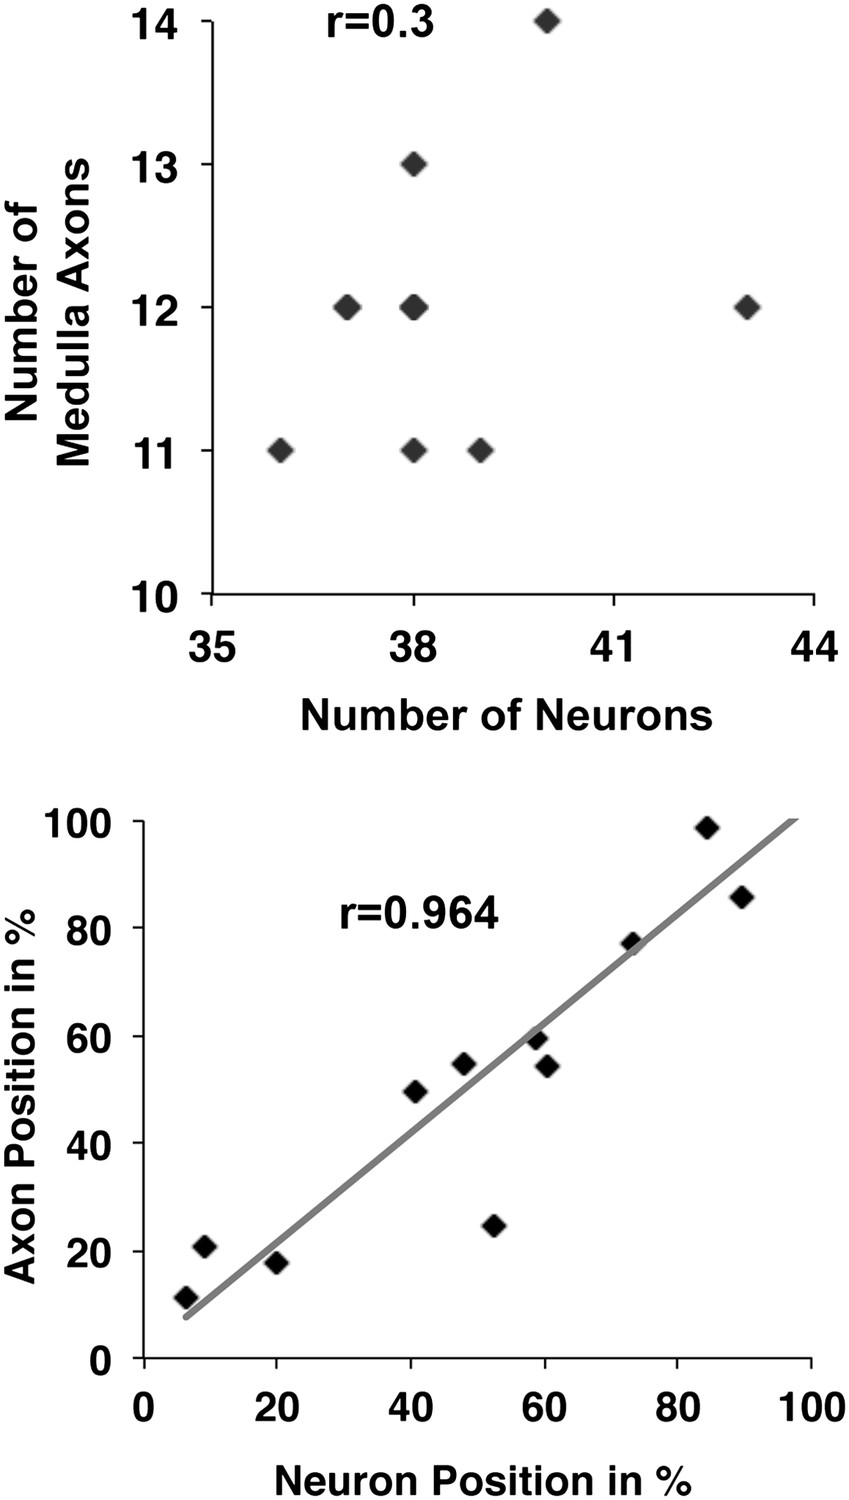
DCN cell body position highly correlates with its D-V axon position.
First, there is no correlation detectable between the number of neurons within a DCN cluster and the number of medulla axons generated by this cluster (r = 0.3, n = 8). Second, the D-V position of a neuronal soma is strongly correlated to the position of its axon along the D-V axis in the target area (r = 0.9637, n = 11). DCN: dorsal cluster neurons; D-V: dorsal–ventral.
Figure 3 with 2 supplements
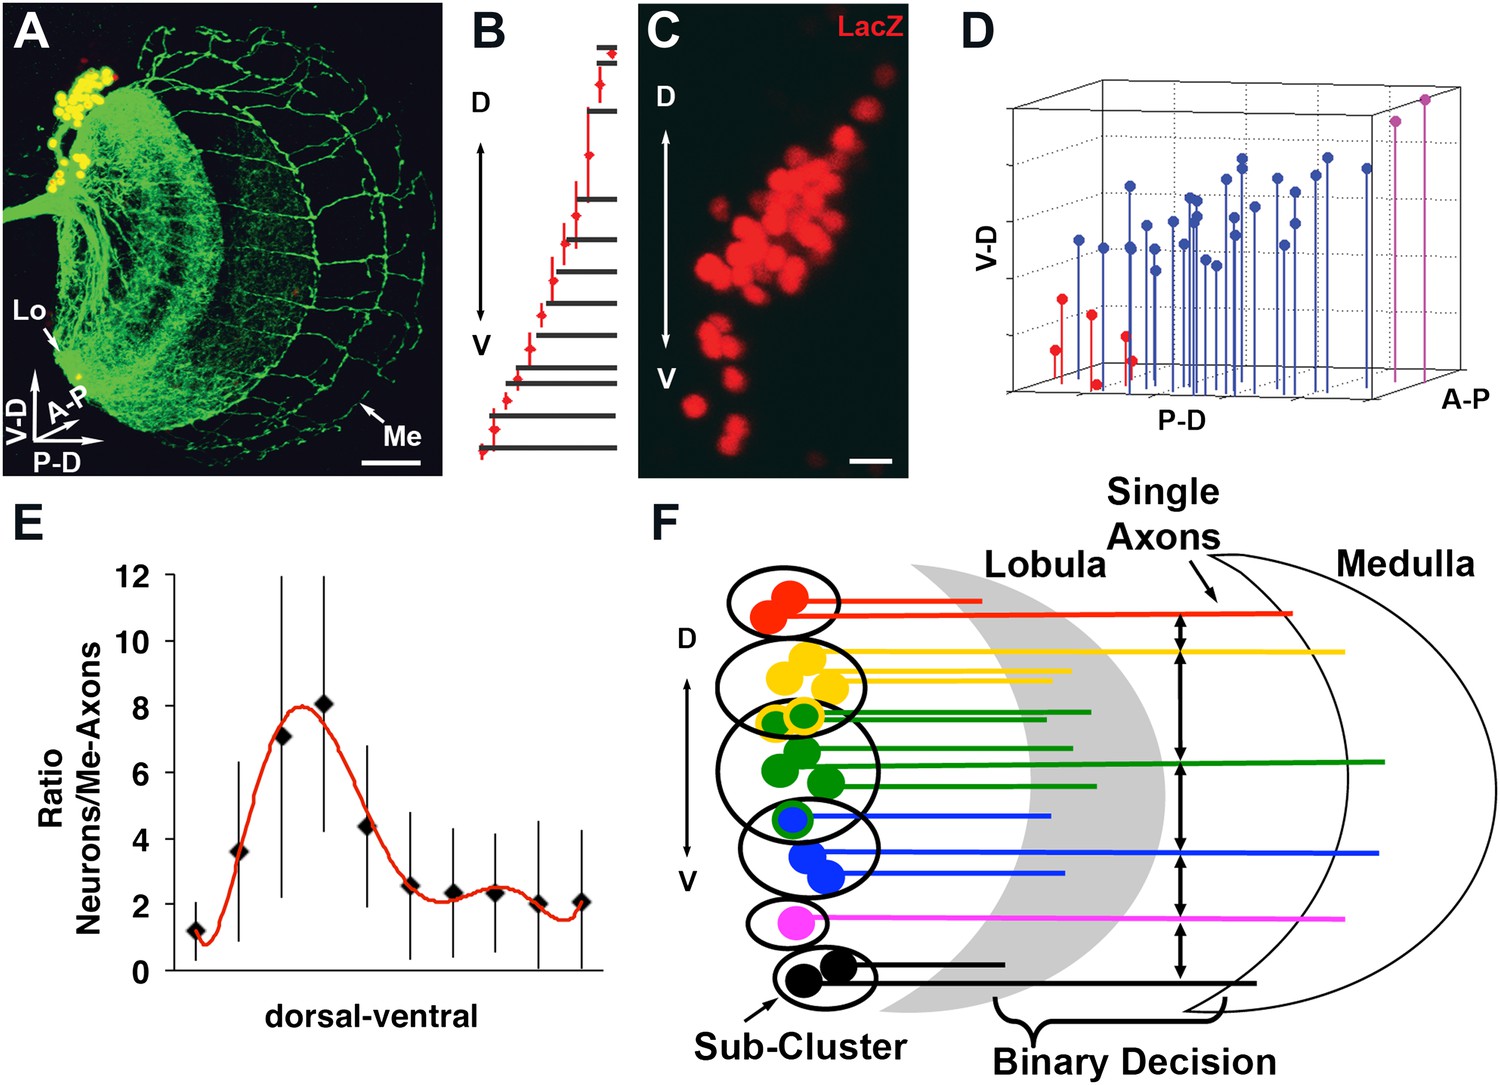
Quantitative analysis of the DCN soma and axon.
(A) A typical DCN axonal pattern showing GFP-labeled neurites (green) and LacZ labeled soma (red). Scale bar: 20 µm. (B) Analysis of interaxonal distances of DCN medulla axons along the D-V and A-P axes. Medulla axons are less dense medially and more dense dorsally and ventrally (n = 16). (C) Projection of a typical DCN cluster with sparse soma dorsally and ventrally and a high soma density medially. Scale bar: 5 µm. (D) 3D stem plot of the DCN cluster shown in (C) displays lines extending form P-D and A-P axis while the 3D position is marked with a filled circle—red indicates ventral cells, blue shows medial, and magenta shows dorsal cells. Vertical lines along the P-D and A-P axes form a representation of the density of the DCNs. (E) Ratio of the number of DCNs and their medulla axons along the D-V axis (n = 16). While dorsally and ventrally 1–2 neurons generate one medulla axon, medially 4–8 neurons produce one medulla axon. (F) Schematic representation of the sub-cluster model: a DCN cluster is divided into several overlapping subsets of neighboring neurons. Each subset provides one medulla axon which leads to pattern of spaced single axons in the medulla. A-P: anterior–posterior; DCN: dorsal cluster neurons; D-V: dorsal–ventral; P-D: proximal–distal.
Figure 3—figure supplement 1
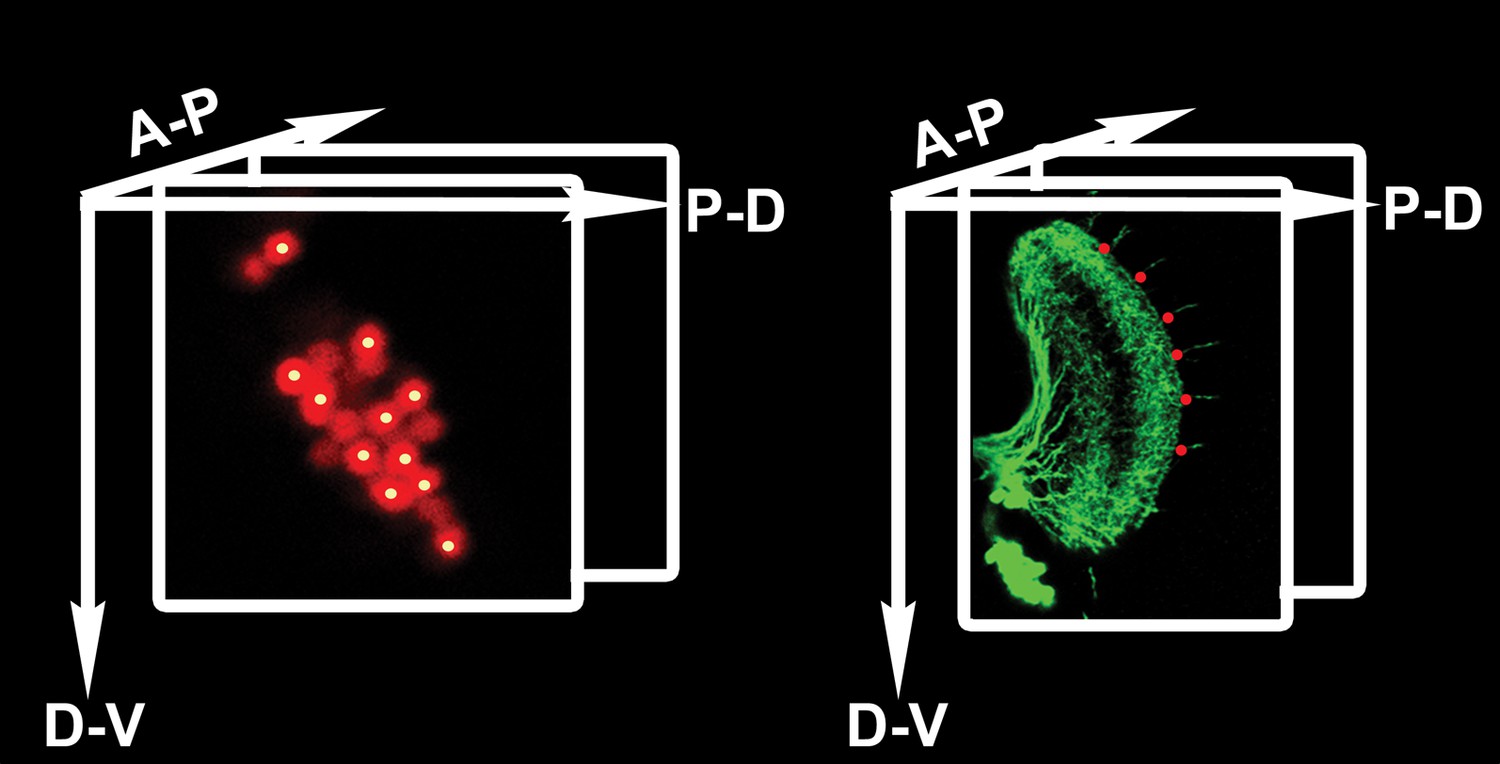
Counting DCN soma and medulla axons.
Technical schematic of the labeling of DCN soma (red) and medulla axons (green) with Cartesian 3D coordinates (yellow dots for DCNs, red dots for medulla axons). DCN: dorsal cluster neurons.
Figure 3—figure supplement 2
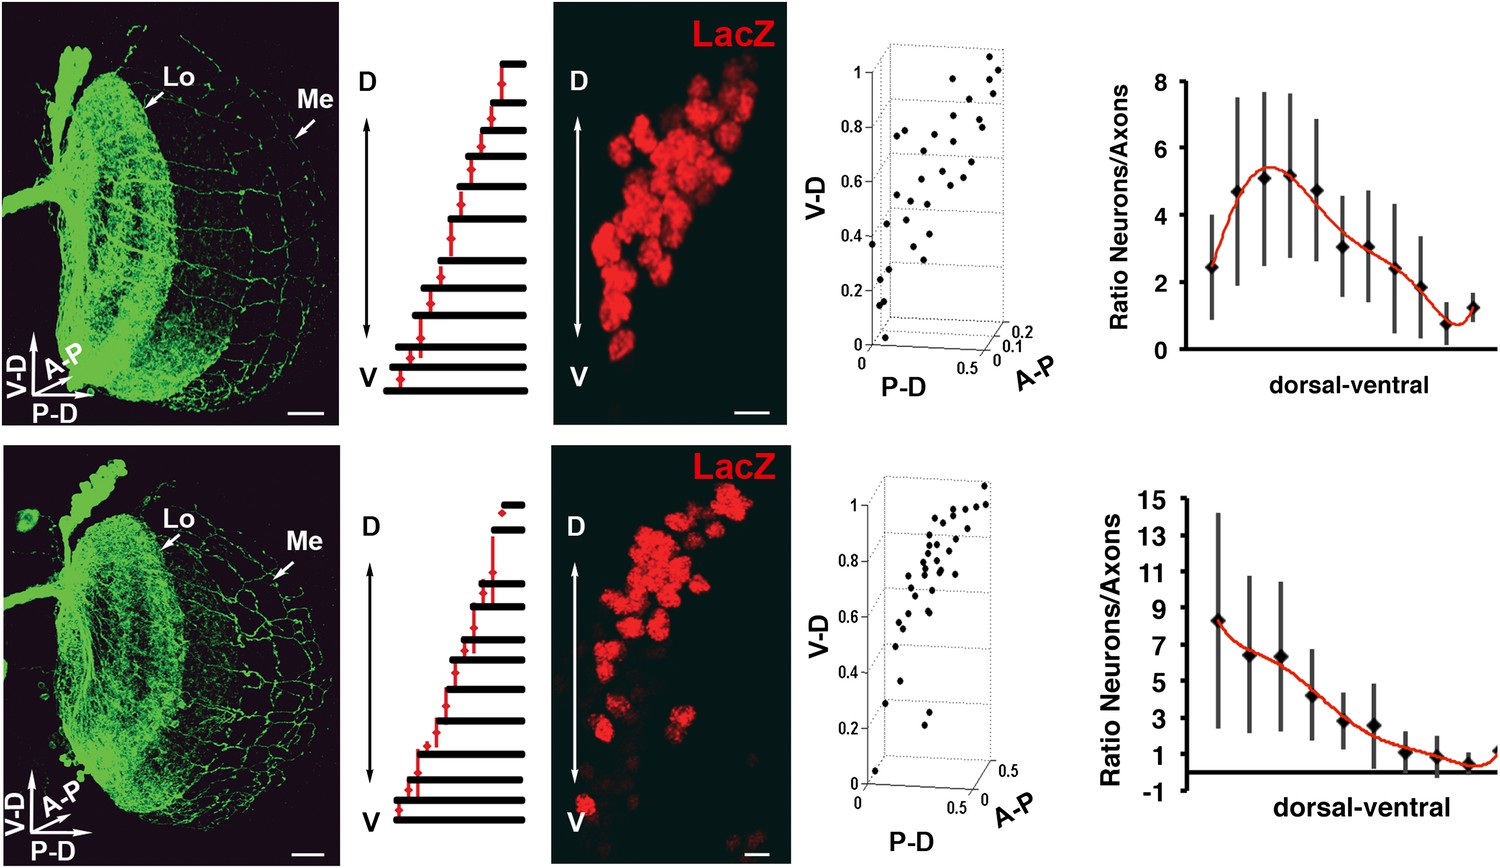
Variability of the DCN cluster shape induces robust wiring pattern.
(Result of a DCN density analysis and their medulla axons in two different genetic backgrounds (first row) n = 20 vs (second row) n = 14. First row, typical pattern of the DCNs and their medulla axons. Scale bar: 20 µm. Density chart of the medulla axons. A typical dorsal cluster of each genetic background. Scale bar: 5 µm. Fourth column, 3D reconstruction of third column. Fifth column, charts representing the ratio between neurons and their medulla axons. The axonal pattern was divided in 10 and 11 subunits according to the genetic background and the axonal pattern. These subunits were transferred to the DCN to count the number of neurons per subunit. DCN: dorsal cluster neurons.
Figure 4
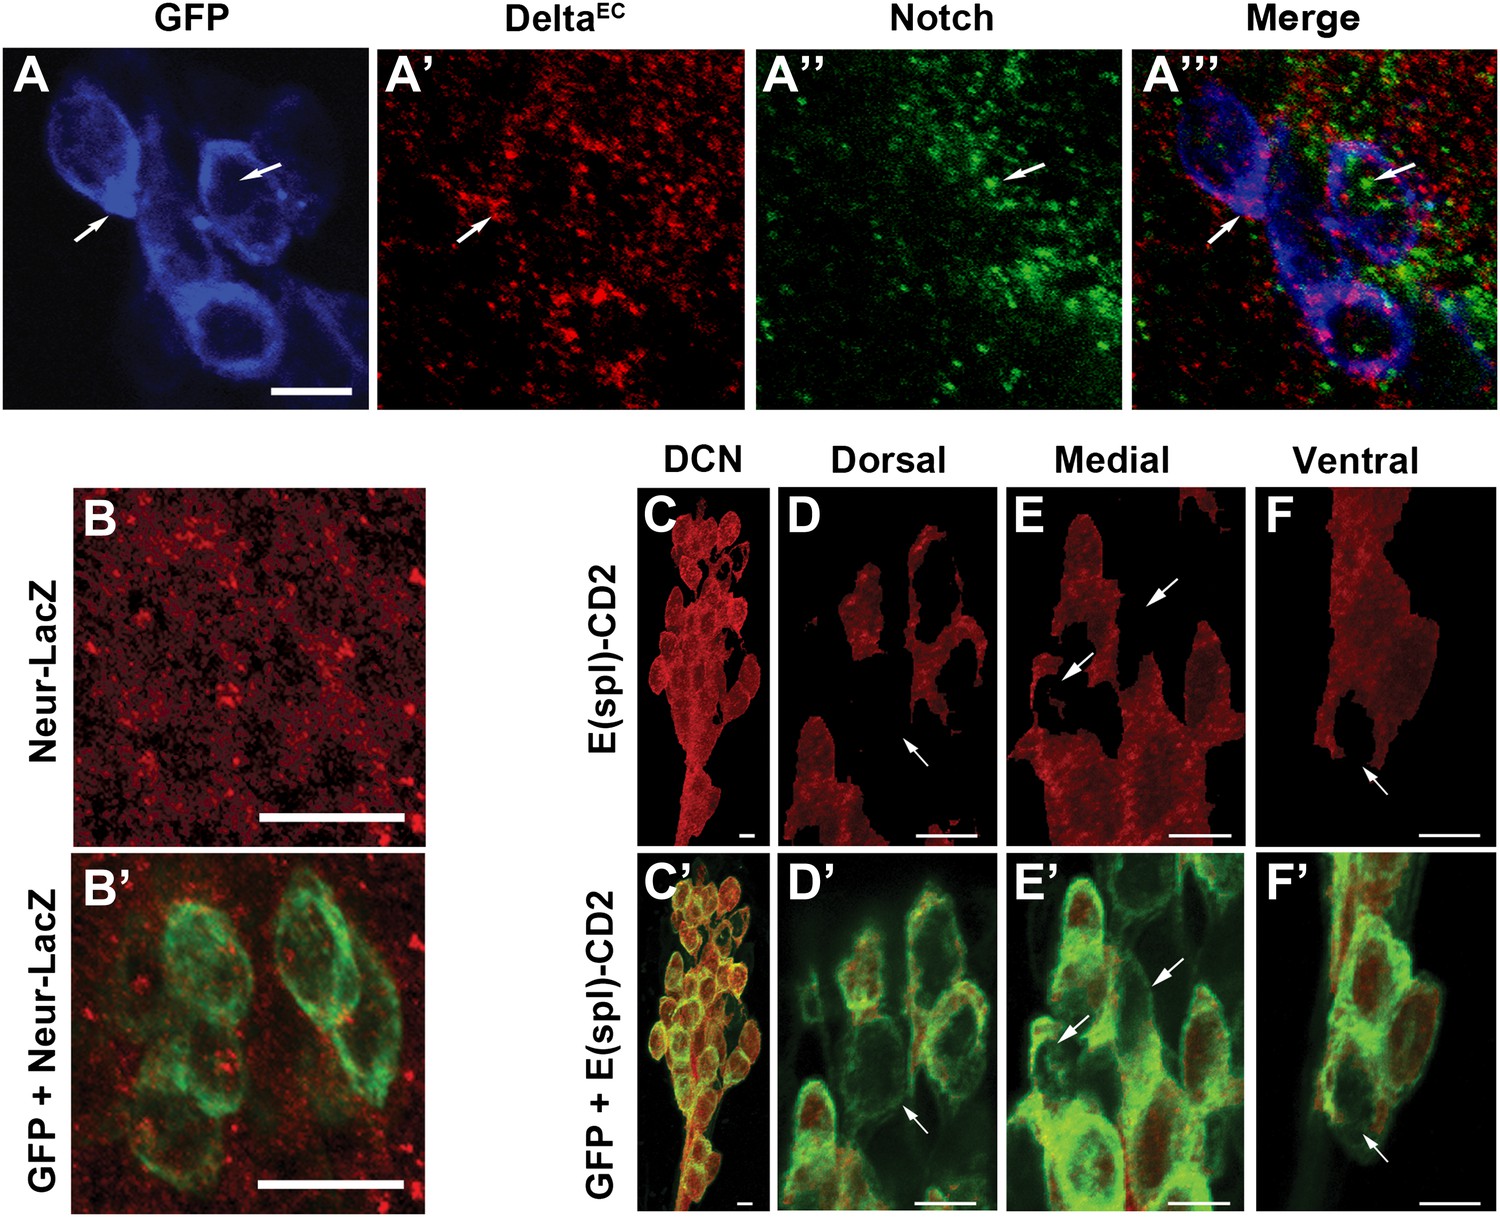
Canonical Notch pathway proteins are expressed during axon targeting.
(A–A‴) Expression of Delta (red) and Notch (green) in GFP-labeled DCNs (blue) at ∼32 hr APF. DCNs express both Delta and Notch and the proteins appear intracellular, indicative of active signaling. Scale bar: 5 µm. (B, B′) Expression of Neur-LacZ (red) in GFP-labeled DCNs (green) at ∼32 hr APF. (C–F) Expression of E(spl)-CD2 reporter (red) in the DCN soma at ∼32 hr APF. Within the dorsal cluster, there are DCN soma with different E(spl) expression levels (marked with white arrows). (C′–F′) Expression pattern of E(spl)-CD2 reporter (red) together with GFP. White arrows indicate DCN soma with little or no E(spl)-CD2 expression. Scale bar: 5 µm. DCN: dorsal cluster neurons.
Figure 5 with 5 supplements
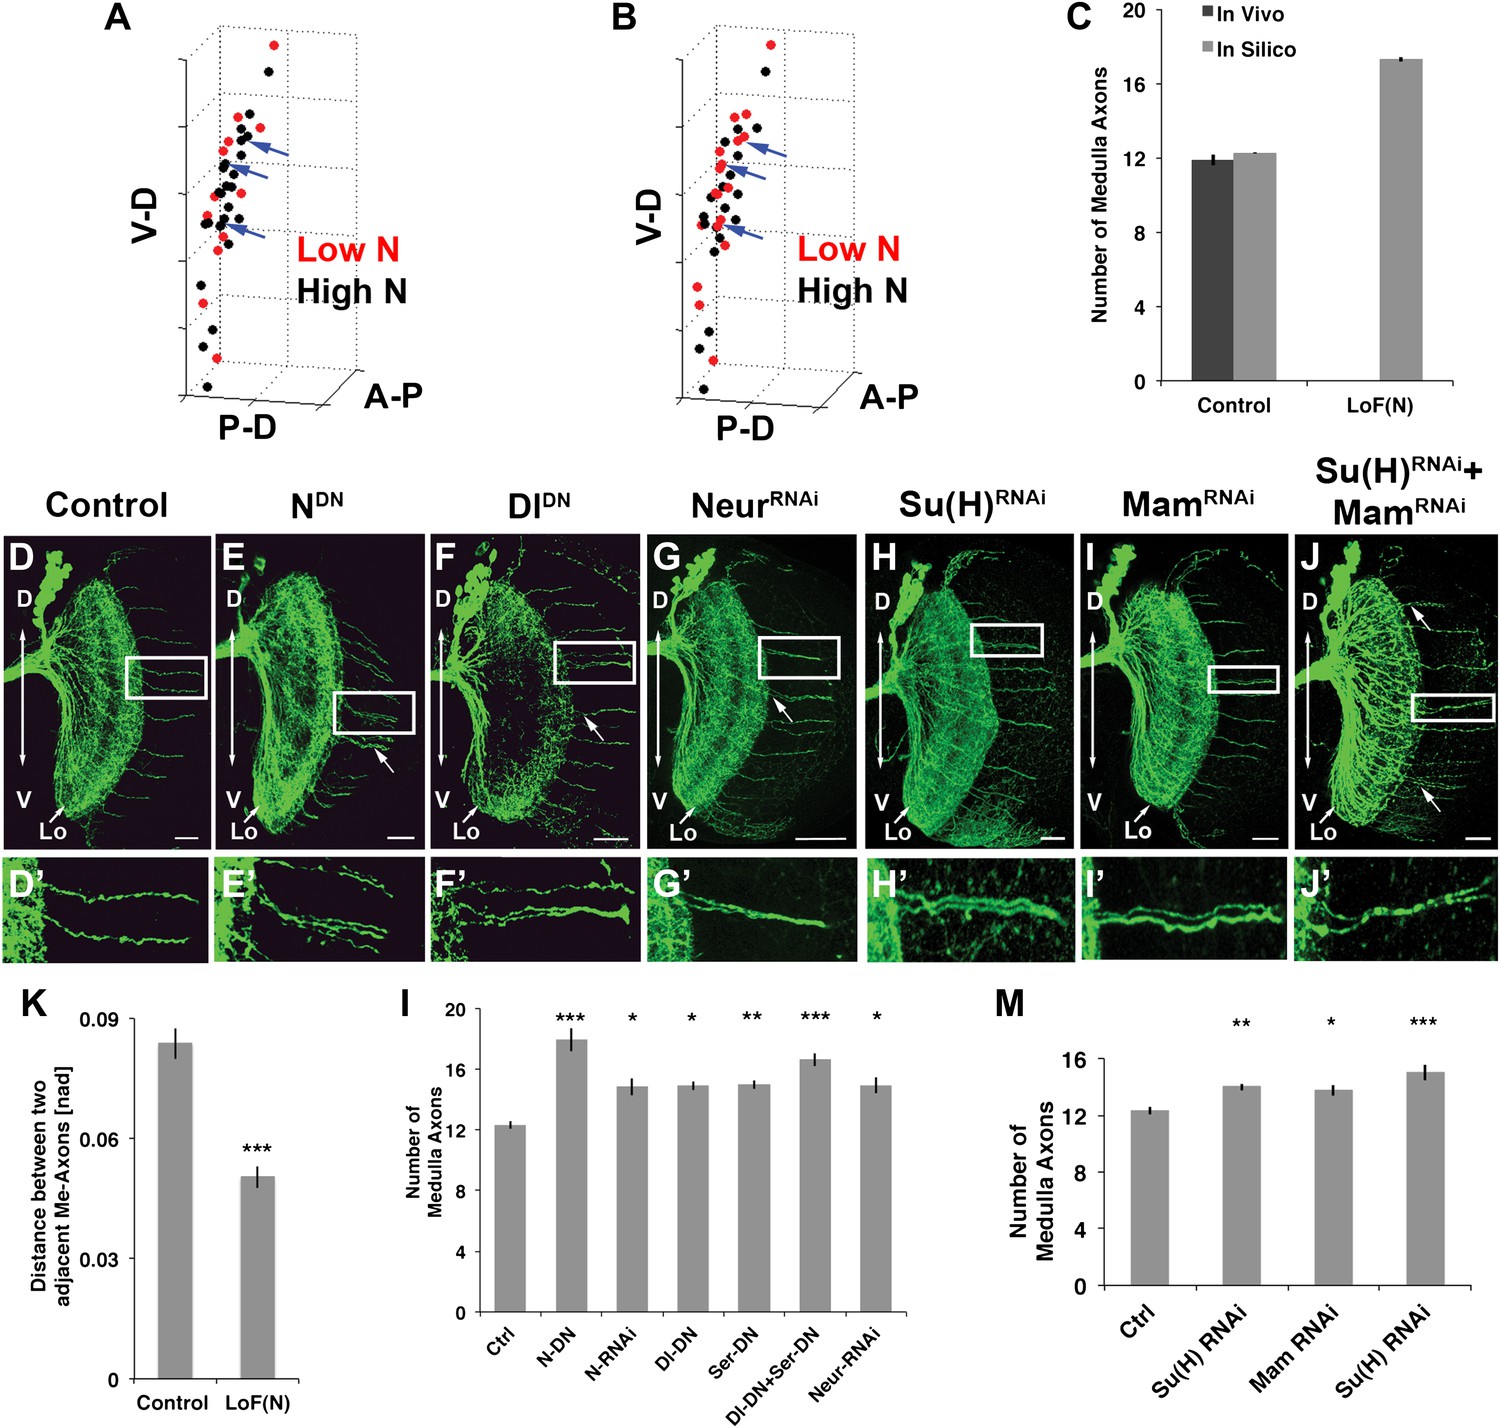
Canoncial Notch pathway genes are required postmitotically for axon targeting.
(A, B) A representation of an in vivo DCN cluster with in silico control (A) and in silico reduced Notch activity conditions (B). Red symbolizes cells with low Notch expression level. These cells will project their axon to the medulla. Black represents cells with high Notch expression level. Black cells will target their axon to the lobula. While in (A) red cells are singular (blue arrows) in (B) red cells located medially appear to be clustered (blue arrows). V-D: ventral–dorsal axis; P-D, proximal–distal axis; A-P, anterior–posterior axis. (C) The in silico predicted number of medulla axons under control resemble the in vivo data. In vivo control 11.88 ± 1.2 SD (n = 16), in silico control 12.26 ± 2.3 SD (p>0.05) (n = 1600). In silico loss of Notch function prediction results in an increase of medulla axons: 17.29 ± 3.96 SD (n = 1600). Data shown: mean ± SEM. (D) Control pattern of spatially separated single medulla axons. (E-G, E′-G′). Reduction of Notch or Delta activity or RNAi knockdown of Neur result in clustered axons. (H-J, H′-J′) RNAi knock-down of Su(H), Mam, or both results in clustered axons. Scale bar: 20 µm. (K) Quantification of the clustered axons observed under loss of Notch condition in comparison to control. Clustered axons were described by distance measurements between two adjacent medulla axons. Distances between two adjacent medulla axons under loss of Notch condition are significantly smaller. Control: 0.084 [nad] (=normalized arbritrary distance) ± 0.044 SD (n = 136), NotchDN 0.050 [nad] ± 0.034 SD (n = 174) (p<0.0001, Mann–Whitney Test, both distribution are non-Gaussian). (L) Inhibition of Notch, the ligands Delta and serrate, and Neuralized increases the number of medulla axons. Control 12.33 ± 0.89 SD (n = 12, Gaussian distribution), NotchDN 17.95 ± 2.67 SD (n = 20, Gaussian distribution) (p<0.001), Notch RNAi 14.83 ± 1.9 SD (n = 12, Gaussian distribution) (p<0.05), DeltaDN 14.92 ± 1 SD (n = 12, Gaussian distribution) (p<0.05), SerrateDN 15.0 ± 1.62 SD (n = 16, Gaussian distribution) (p<0.01), DeltaDN + SerrateDN 16.64 ± 1.92 SD (n = 14, Gaussian distribution) (p<0.001), Neur RNAi 14.93 ± 1.11 SD (n = 15, non-Gaussian distribution) (p<0.05); (non-parameteric Kruskal–Wallis Test, Data shown: mean ± SEM). (M) Inhibition of Su(H), Mam, or both significantly increases the number of medulla axons. Control 12.33 ± 0.89 SD (n = 12, Gaussian distribution), Su(H) RNAi 14.00 ± 0.82 SD (n = 10, Gaussian distribution) (p<0.01), Mam RNAi 13.75 ± 1.22 SD (n = 12, non-Gaussian distribution) (p<0.05), Su(H) RNAi + Mam RNAi 15.0 ± 1.66 SD (n = 9, non-Gaussian distribution) (p<0.001). Non-parameteric Kruskal–Wallis Test, Data shown: mean ± SEM. DCN: dorsal cluster neurons; SD: standard deviation.
Figure 5—figure supplement 1
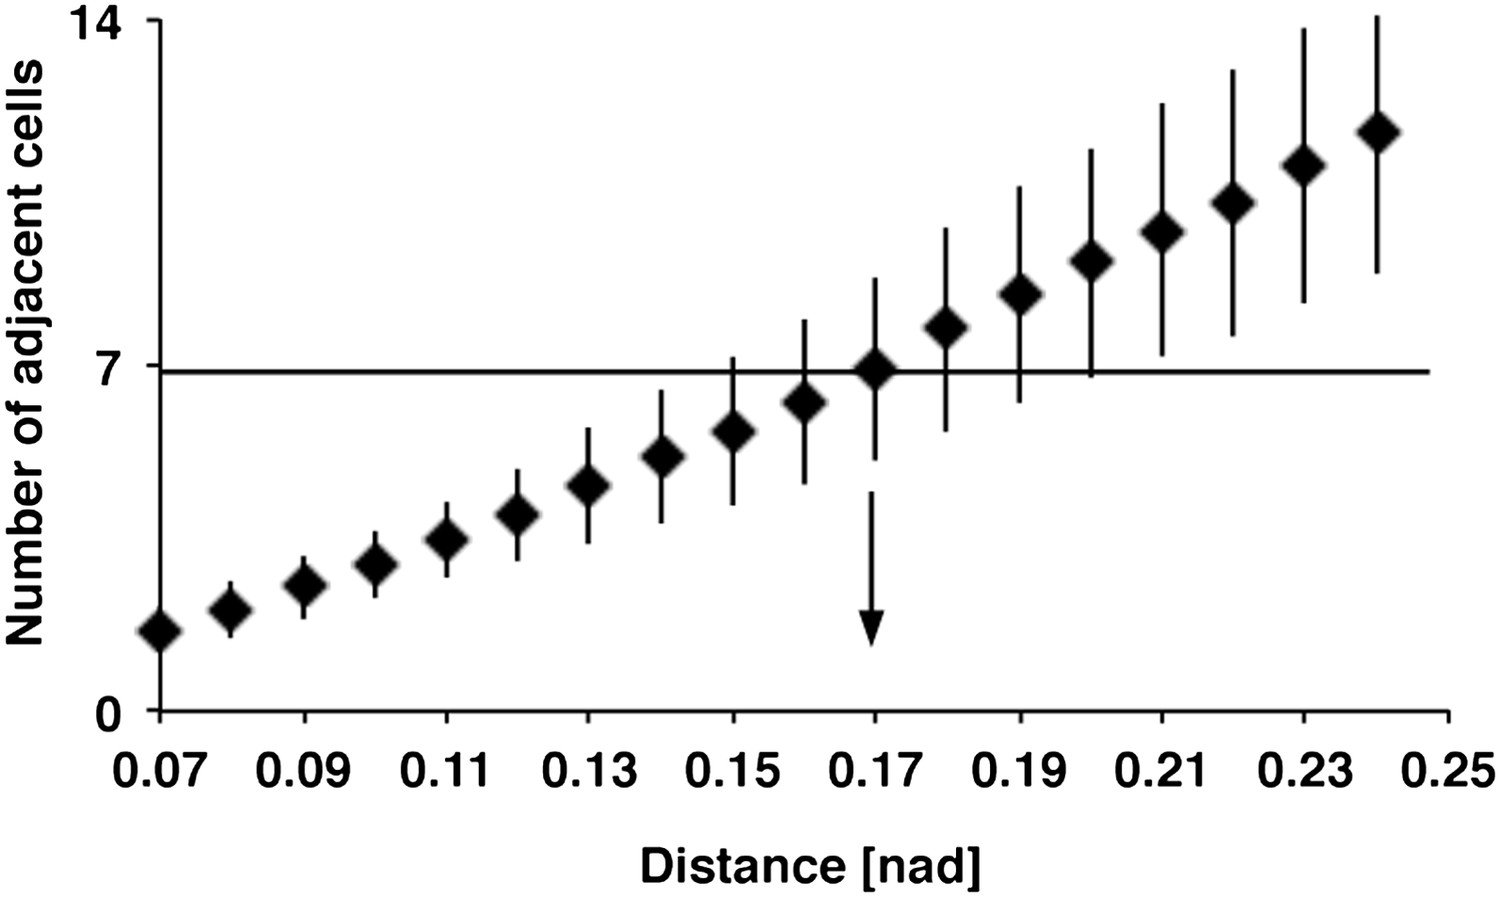
Relation between DCN soma distance and the number of adjacent cells within a subcluster
Detailed analysis of distances between DCN soma and theoretical sub-cluster sizes. The number of adjacent cells within the subcluster highly correlates with the Euclidean 3D distance between two DCN soma. An Euclidean 3D distance of 0.17 [nad] (=normalized arbritrary distance) provides subclusters with an average of seven adjacent cells.
Figure 5—figure supplement 2
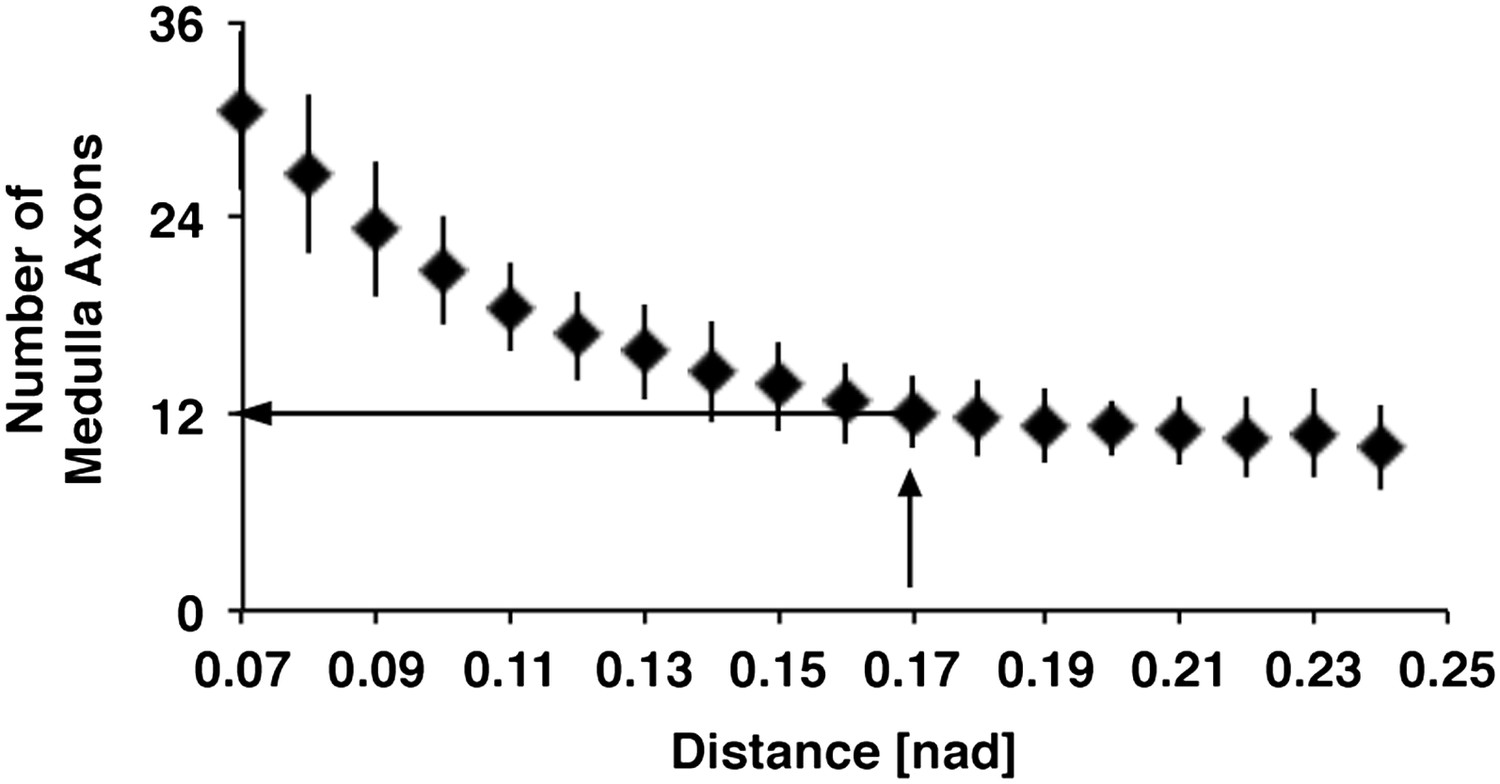
Relation between distances of DCN soma and number of medulla axons.
Using the euclidean 3D distance of 0.17 [nad] the in silico model predicts approximately 12 medulla axons under control conditions. DCN: dorsal cluster neurons.
Figure 5—figure supplement 3
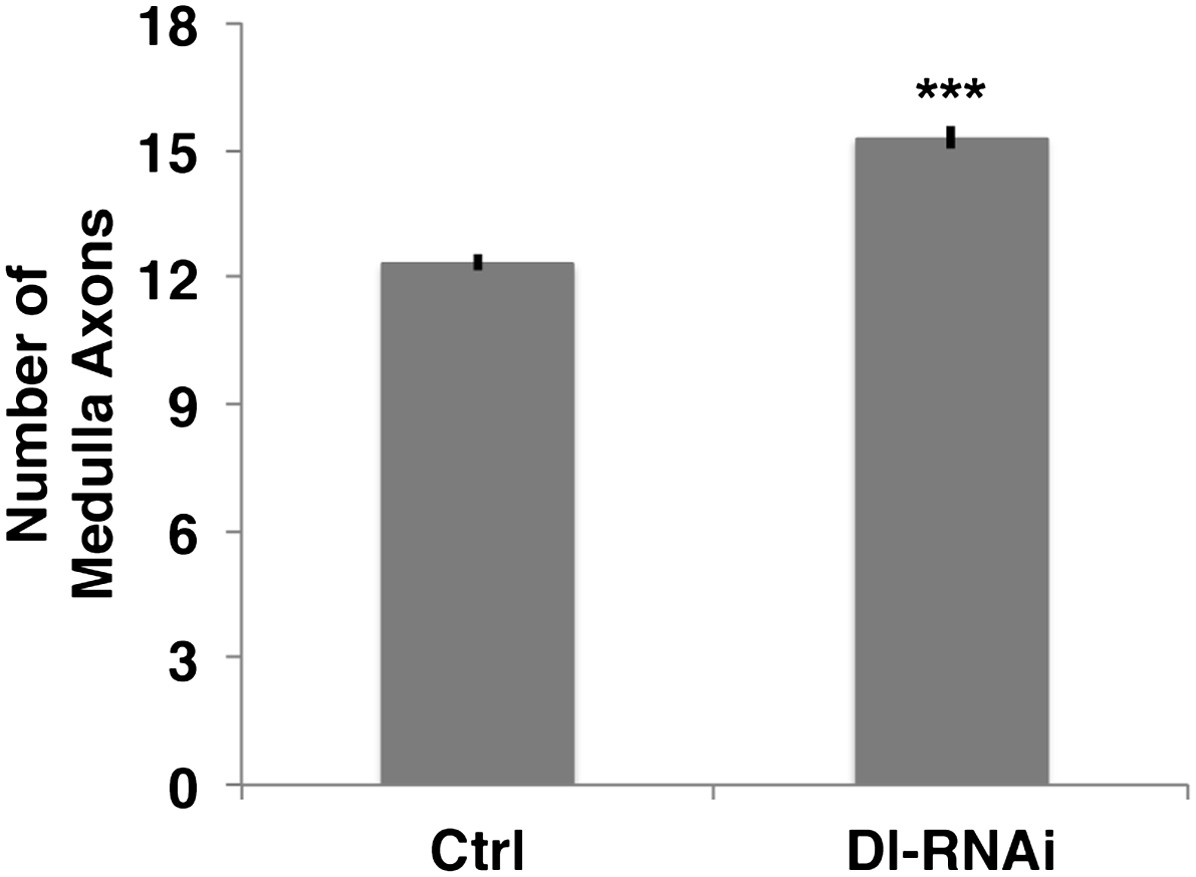
Loss of Delta increase the number of medulla axons.
Delta knockdown via RNAi increases the number of medulla axons. Control 12.33 ± 0.89 SD (n = 12, Gaussian distribution), Delta RNAi 15.29 ± 1.26 (n = 17, Gaussian distribution) (p<0.0001 unpaired t-test, Data: mean ± SEM). SD: standard deviation; SEM: standard error of the mean.
Figure 5—figure supplement 4
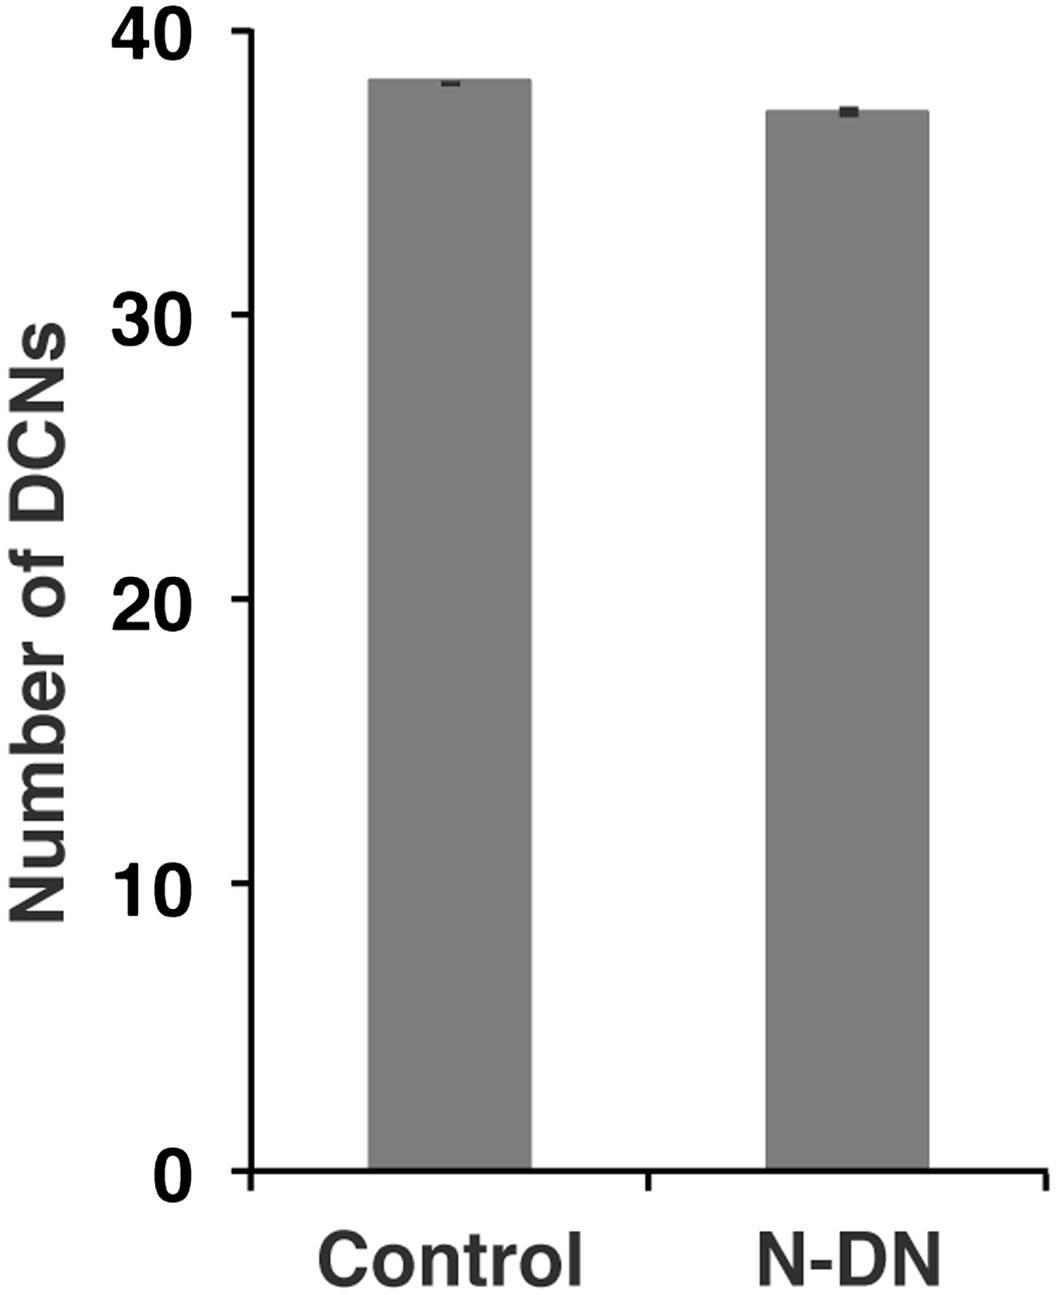
No function of Notch in DCN cell number.
Postmitotic silencing of Notch does not alter DCN cell number. Control 38.13 ± 2 SD (n = 15, non-Gaussian distribution), NotchEC-DN 37.12 ± 3.1 SD (n = 16 Gaussian distributed). There is no significance detectable. (p>0.05 Mann–Whitney Test, Data: mean ± SEM). DCN: dorsal cluster neurons; SD: standard deviation; SEM: standard error of the mean.
Figure 5—figure supplement 5
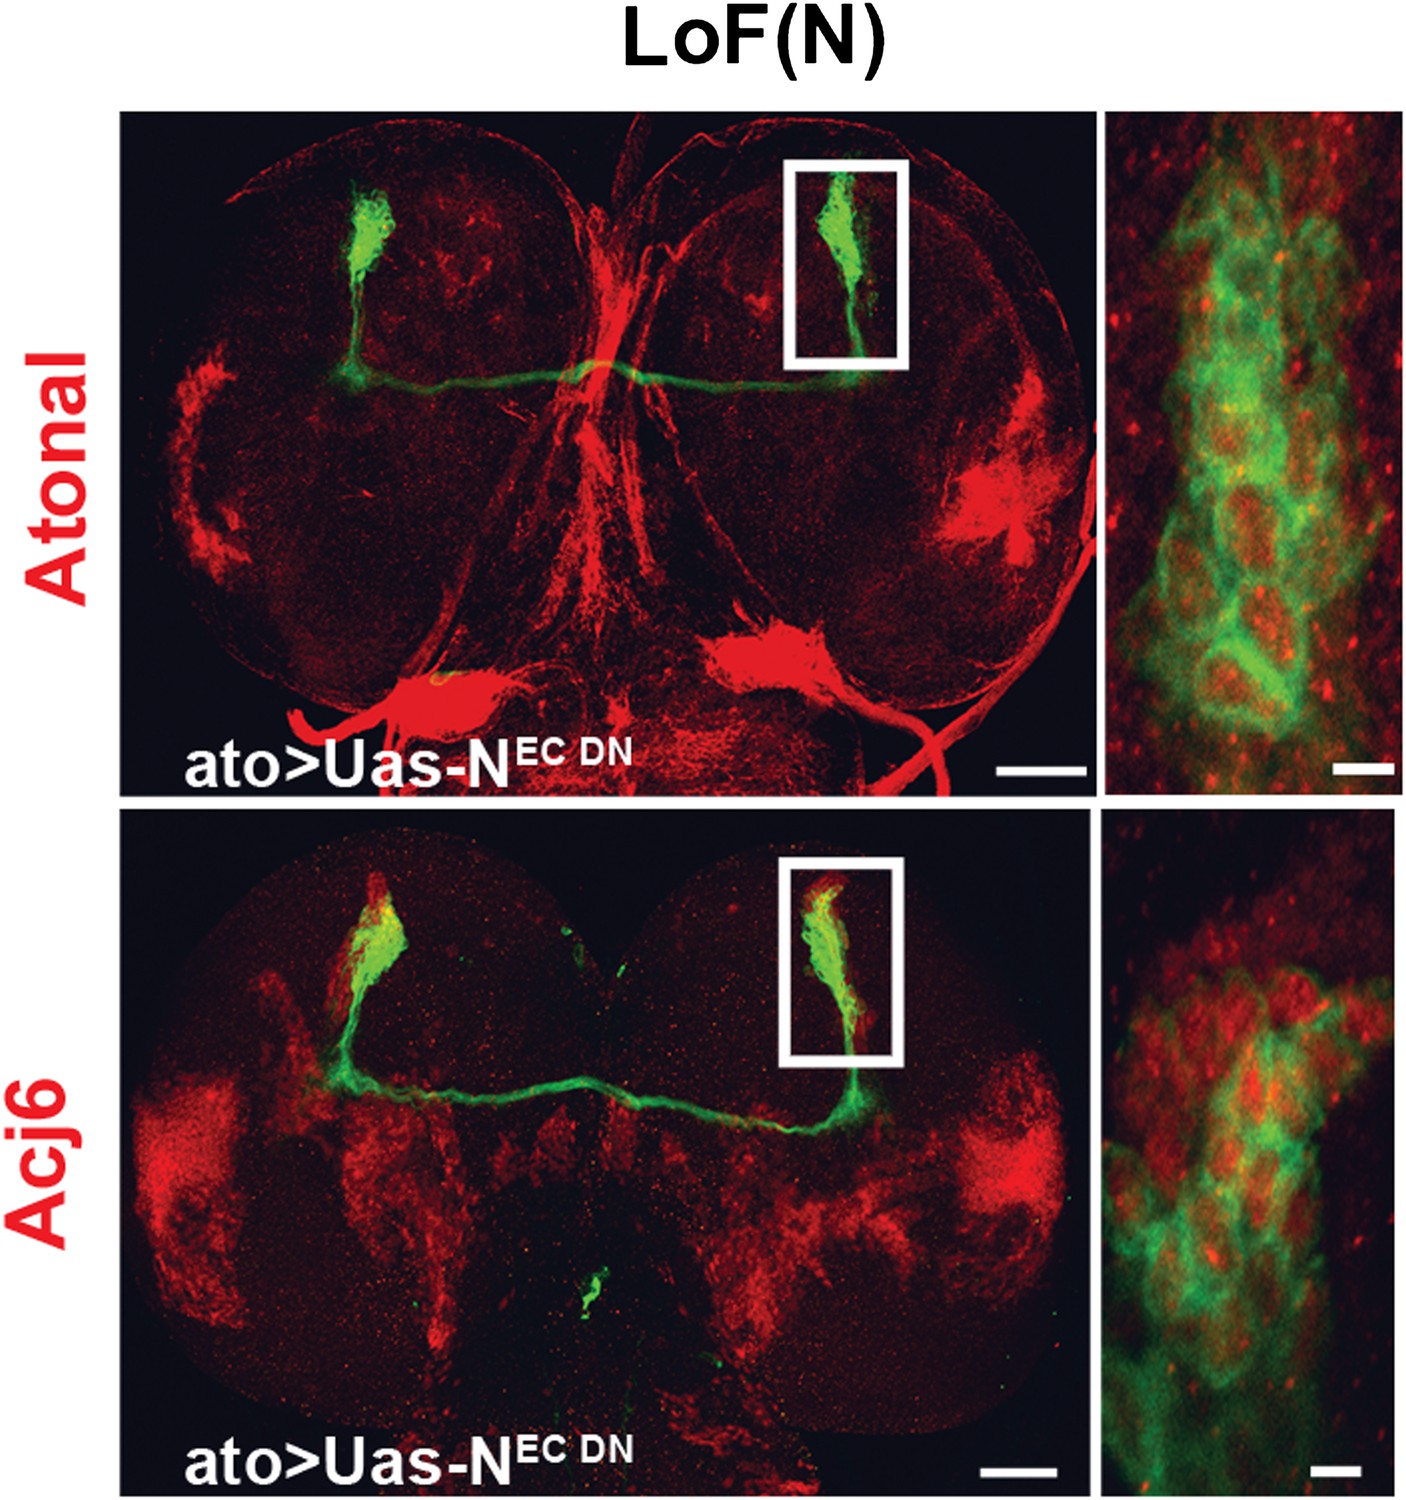
Cell fate marker is expressed in every single neuron at L3.
The cell fate marker atonal top row is expressed under loss of Notch conditions in each neuron at L3 stage as well as the cell fate marker Acj6 (bottom row). Left, scale bar: 50 µm. Right, scale bar: 5 µm.
Figure 6
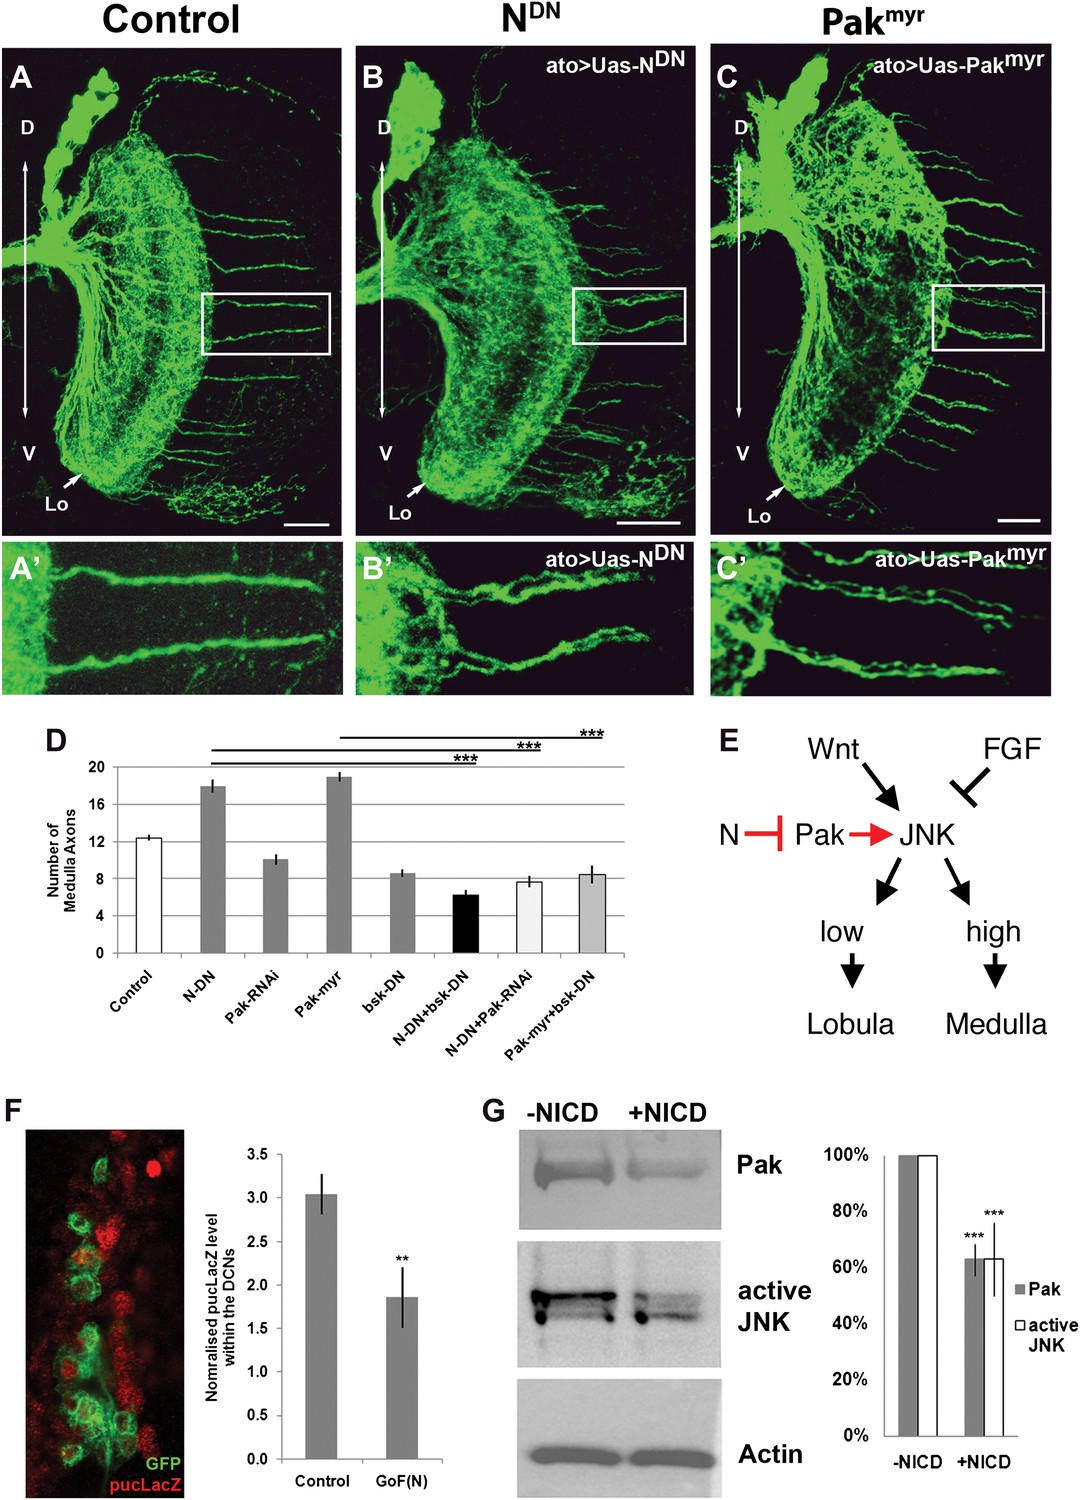
Notch signaling attenuates JNK activity via Pak (A–C′) loss of Notch signaling as well as constitutive Pak activation result in clustered axons. Data shown: mean ± SEM. Scale bar: 20 µm. (D) Analysis of the number of medulla innervations under the following conditions: Control 12.33 ± 0.89 SD, NotchDN 17.95 ± 3.19 SD (p<0.05 to Control), Pak RNAi 10.1 ± 1.73 SD, Pakmyr 19 ± 1.8 SD (p<0.05 to control), bskDN 8.6 ± 1.26 SD, NotchDN and bskDN 6.3 ± 1.57 SD (p<0.001 to NotchDN), NotchDN + Pak RNAi 9.25 ± 2.38 SD (p<0.001 to NotchDN), and Pakmyr + bskDN 8.5 ± 2.35 SD (p<0.001 to Pakmyr). (E) Schematic of the interaction between Notch, Pak and JNK signaling to determine axonal target choice. (F) A subset of DCNs marked with GFP (green) and pucLacZ (red) shown in the left panel. Analysis of pucLacZ in control and gain of Notch function DCNs (3.04 ± 0.24 SD vs 1.86 ± 0.35 SD, n = 3, (p=0.01, Student's t-test)). pucLacZ level within the DCNs were normalized by measurements of pucLacZ level of the entire image except the DCNs. (G) The effects of Notch gain of function (by transfection of NICD) on Pak expression and JNK activity in Drosophila neuronal cell line DmBG2-c3. Western blot and quantification of the effects on Pak (1.0 ± 0.0 vs 0.628 ± 0.05 SD [p<0.001] Student's t-test) and phospho-JNK (active JNK) levels (1.0 ± 0.0 vs0.63 ± 0.129 SD [p<0.001, Student's t-test]). DCN: dorsal cluster neurons; NICD: intracellular domain of Notch; SD: standard deviation; SEM: standard error of the mean.
Figure 7
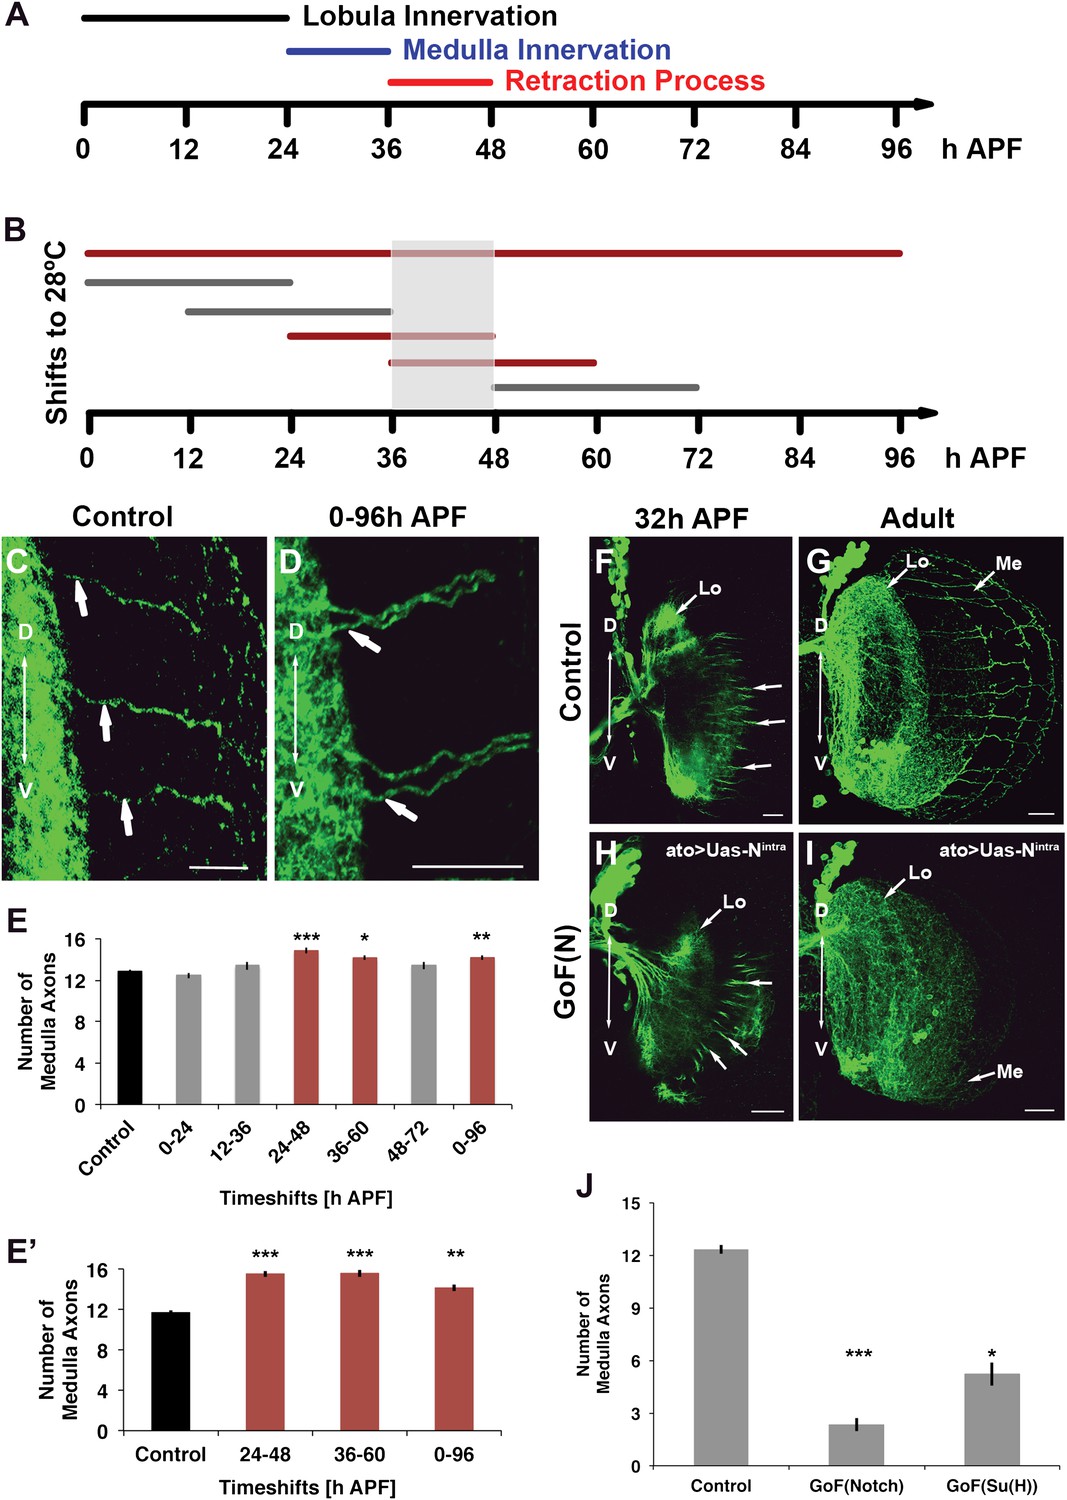
Notch acts specifically during the axon sorting phase to regulate DCN axon targeting. (A) Schematic of the axonal dynamics of DCNs during pupal development. (B) Schematic of the temperature shift experiments (to 28°C) to determine the temporal requirement for Notch during pupal development. (C–D) Reduction of Notch activity (using Notchts) during all of pupation leads to clustered axons in comparison to control. Scale bar: 20 µm. (E) Reduced Notch activity (Nts) alters the medulla innervation pattern at 24–60 hr APF, but neither before nor after. Control 12.86 ± 0.66 SD (n = 14, non-Gaussian distribution), 0–96 hr APF 14.18 ± 0.92 SD (n = 18, non-Gaussian distribution) (p<0.01), 0–24 hr APF 12.46 ± 0.97 SD (n = 13, Gaussian distribution), 12–36 hr APF 13.38 ± 1.39 SD (n = 14, non-Gaussian distribution), 24–48 hr APF 14.86 ± 1.03 SD (n = 14, non-Gaussian distribution) (p<0.001), 36–60 hr APF 14.15 ± 0.69 SD (n = 13, not Gaussian distributed) (p<0.01), 48–72 hr APF 13.4 ± 1.07 SD (n = 10, non-Gaussian distribution). Non-parametric Kruskal–Wallis Test. (E′) Confirmation of the requirement of Notch signaling during pupation using tubGal80ts: Control 11.71 ± 0.92 SD (n = 17, non-Gaussian distribution), 24–48 hr APF 15.55 ± 1.04 SD (n = 17, non-Gaussian distribution) (p<0.001), 36–60 hr APF 15.60 ± 1.17 SD (n = 18, Gaussian distribution) (p<0.001), 0–96 hr APF 14.15 ± 1.11 SD (n = 13, non-Gaussian distribution) (p<0.01). (F–I) comparison of axonal pattern formation at two different time points under control and gain of Notch activity. Scale bar: 20 µm. At 32 hr APF the axonal extension process is still active. Under both conditions (control (F) and gain of Notch function (H)) axons extend toward the medulla. (G, I) Axonal pattern of the DCNs at adult stage. While the control brain shows the normal pattern of medulla axons (G), under gain of Notch function there is only one medulla axon visible (I). (J) Quantification of the number of medulla axons using gain of Notch function and gain of Su(H) function. Activation of the canonical Notch pathway decreases the number of medulla axons significantly in comparison to the control. Control 12.33 ± 0.89 SD (n = 12, Gaussian distribution), gain of Notch function 2.33 ± 1.24 SD (n = 15, non-Gaussian distribution) (p<0.001), gain of Su(H) function 5.22 ± 1.99 SD (n = 9, Gaussian distribution) (p<0.05) (E, E′, J: non-parametric Kruskal Wallis Test, Data shown: mean ± SEM). APF: after puparium formation; DCN: dorsal cluster neurons; NICD: intracellular domain of Notch; SD: standard deviation; SEM: standard error of the mean.
Figure 8 with 3 supplements
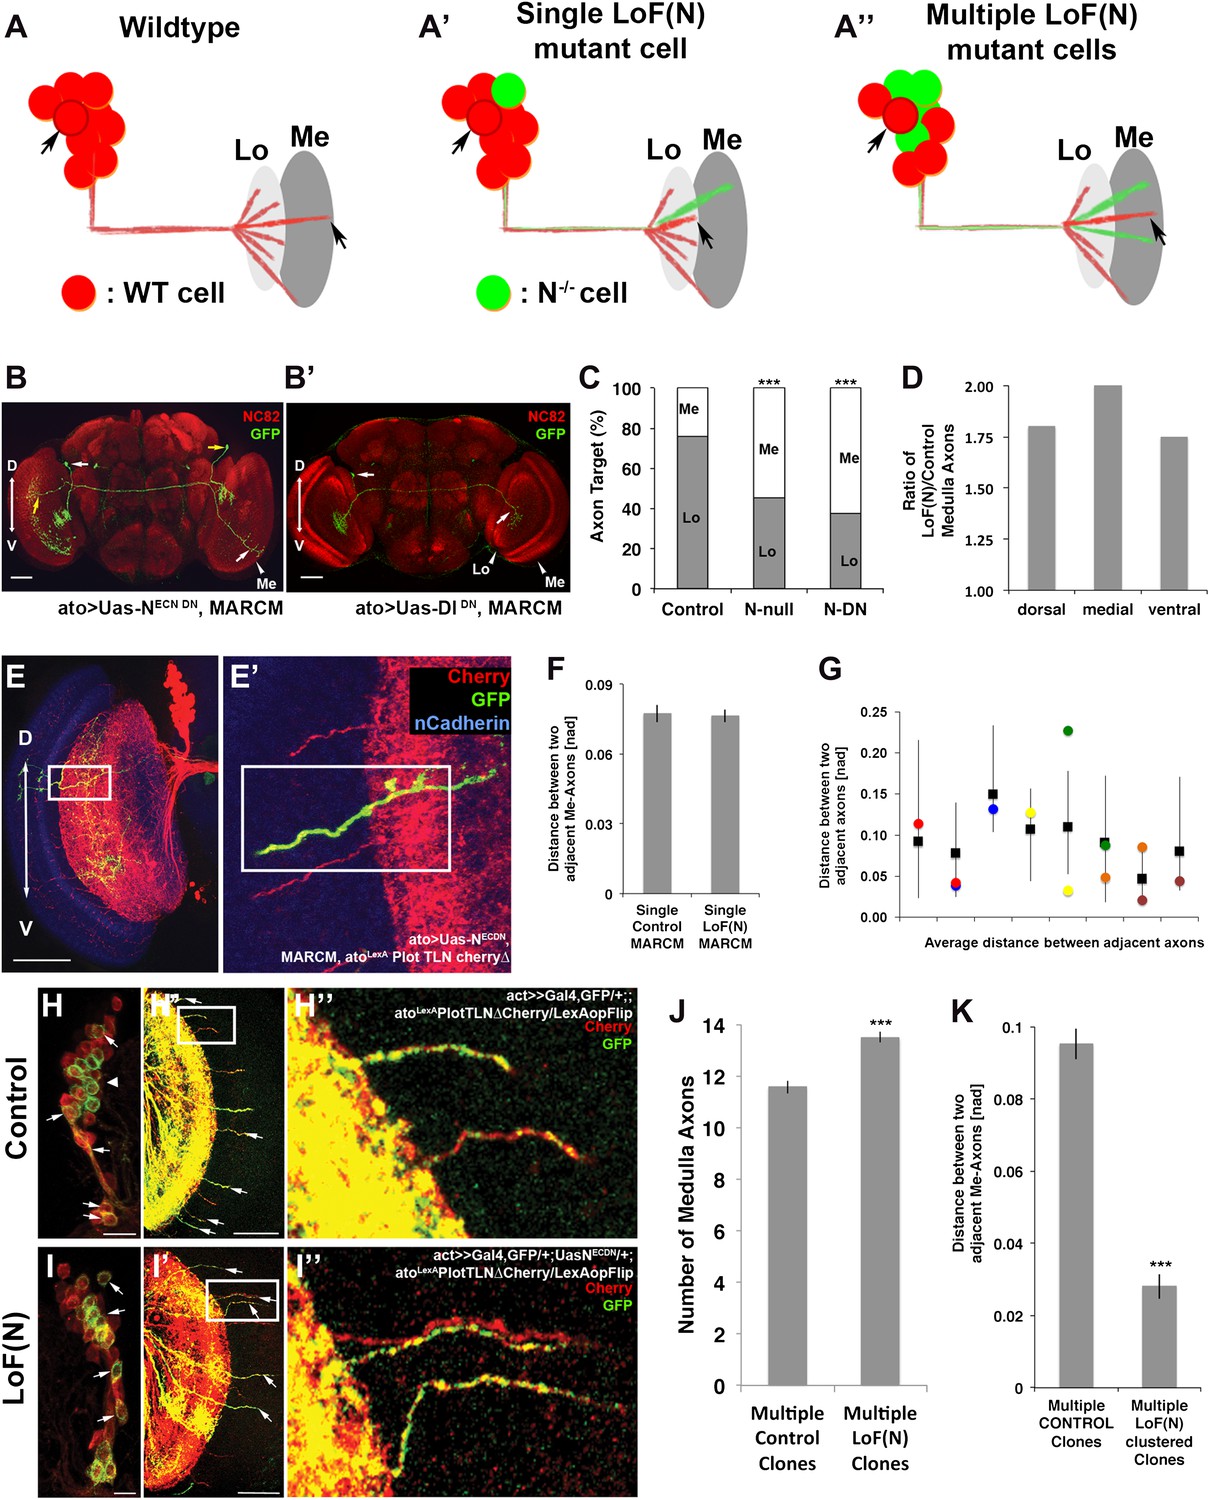
Notch cell autonomously regulates axon targeting.
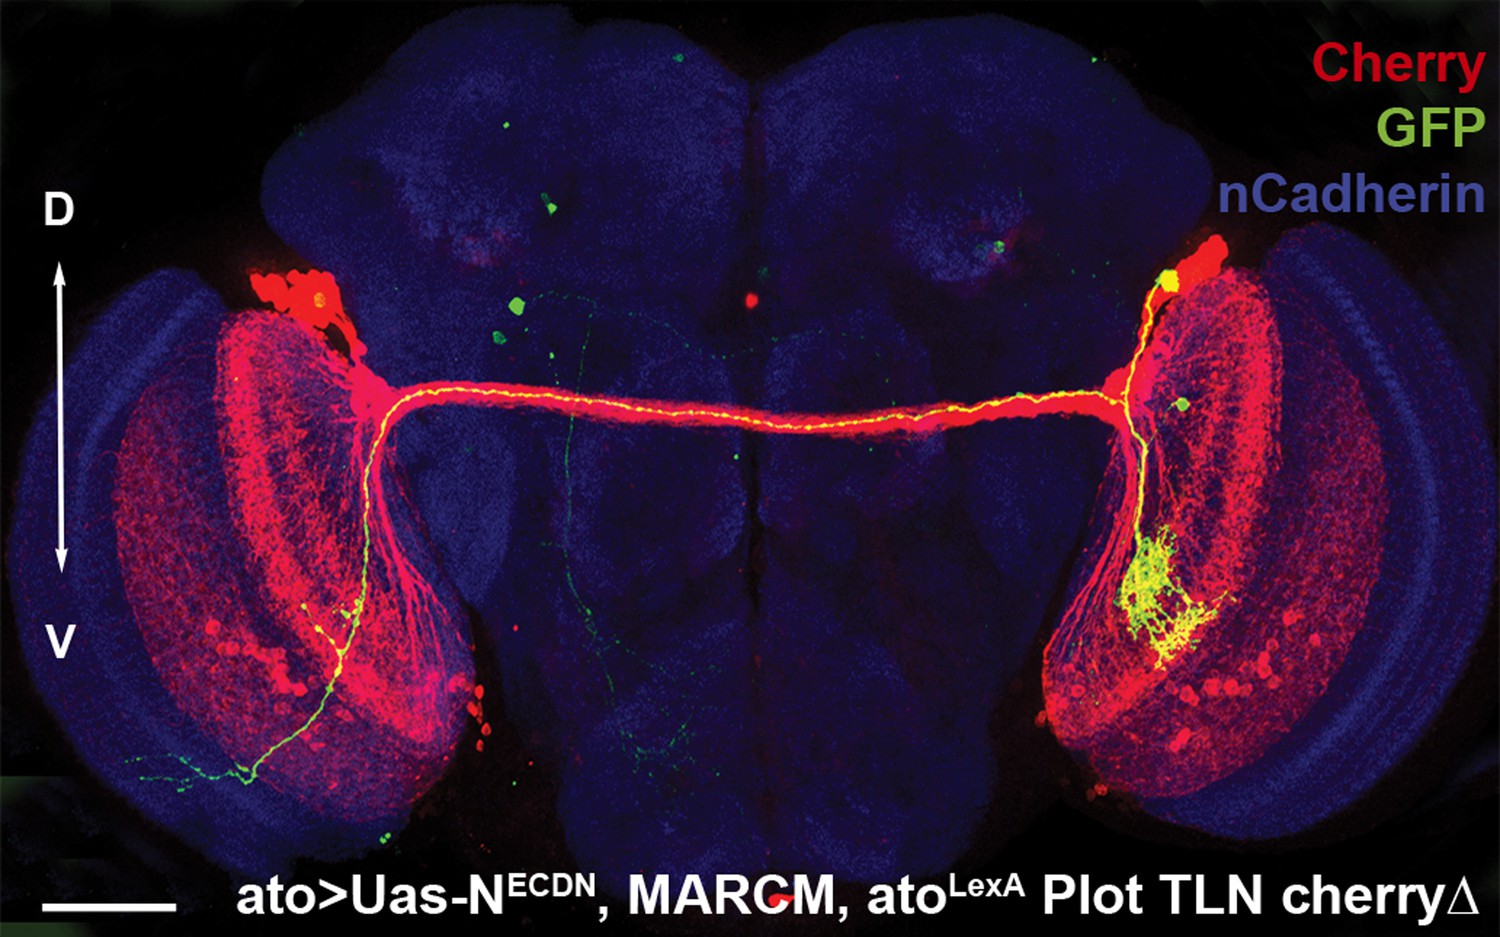
(A–A″) Schematic of a mutual inhibition hypothesis of DCN axon sorting under control and Notch loss of function conditions. (A) Under control conditions only single axons innervate the medulla neuropil from each interacting subcluster. The red cell represents one of the wild-type neurons. (A′) A single Notch mutant cell (green cell) will project its axon towards the medulla neuropil and consequently adjacent cells will retract back towards the lobula to ensure single medulla innervations. (A″) In contrast to the single Notch mutant cell situation, multiple Notch mutant cells will not compensate and generate multiple clustered medulla axons. (B) Adult Drosophila fly brain in which the neuropil is marked with mAb nc82 (red). Single GFP-positive Notch mutant DCNs is generated using the MARCM technique. White and yellow arrows mark DCN soma and their respective medulla axons. Scale bar: 50 µm. (B′) Single GFP-positive Delta mutant DCN is generated using the MARCM technique. White arrows mark DCN soma and their respective lobula axon. Scale bar: 50 µm. (C) Analysis of the MARCM experiment represented in (B). Approximately 24% of all control single cell clones project toward the medulla (n = 33). In contrast, Notch mutant single cell clones using either a null allele (N55e11) or NotchDN innervate the medulla 55% or 63% of the time (n = 22 and 24), respectively (Control vs N55e11, p<0.001; Control vs NotchDN, p<0.001; Fisher's exact test). (D) The probability of a single DCN with no Notch activity to target the medulla is twice as high medially in comparison to the control, 1.8 times higher dorsally and 1.75 times higher ventrally (n = 22). (E–E′) DCN cluster labeled with the general membrane marker TLNΔCherry (Nicolai et al., 2010) (red) driven by the LexA operon (LexAop) and a LexA knock-in into the atonal locus using the IMAGO (Choi et al., 2009) technique. A single GFP-positive (green) cell clone expressing NotchDN was generated using MARCM technique in this background. The mutant GFP-positive medulla axon does not show clustering with neighboring control axons (red). Scale bar: 50 µm. (F) Comparison of distances between two adjacent medulla axons: Single control MARCM 0.077 ± 0.048 SD (n = 189, not Gaussian distributed), single loss of Notch function MARCM 0.076 ± 0.051 SD (n = 177, non-Gaussian distribution) (p>0.05, Mann–Whitney Test). (G) Individual distances between six loss of Notch function single MARCM clones and their two adjacent medulla axons in comparison to median control distances. The distances of 5/6 loss of Notch function medulla axons (colored squares) are within control range (black squares + range bars). Black squares represent the average distance between two adjacent medulla axons, whereas the bar represent minimum and maximum distance between two neighboring medulla axons under control condition. (H–H″, I–I″) Multiple in vivo DCN soma were mutated for Notch activity using a combination of IMAGO knock-in of LexA into the atonal locus and the flip-out technique to activate Gal4 stochastically during DCN axon outgrowth. An example of multicell DCN clones under control (H–H″) and loss of Notch function conditions (I–I″). While the control clone displays single medulla axons (H′, H″), clustered medulla axons are visible under loss of Notch function condition (I′, I″). The D-V axis correlation between a DCN soma and its axon is maintained under loss of Notch function conditions (white arrows). (J) A comparison between multiple control and multiple loss of Notch function clones demonstrates that DCN patterns with clustered axons show a significant increased number of medulla axons. Multicell control clones 11.6 ± 1.19 SD (n = 20, non-Gaussian distribution), multicell loss of Notch function clones 13.65 ± 1.09 SD (n = 20, non-Gaussian distribution) (p<0.001, Mann–Whitney Test). Data shown: mean ± SEM. (K) Comparison of distances between two adjacent axons considering only GFP-positive axons under multiple control and multiple loss of Notch function clones. Multiple control clones: 0.09 [nad] (=normalized arbritrary distance) ± 0.053 (n = 165, non-Gaussian distribution), multiple loss of Notch function clones: 0.028 ± [nad] 0.015 (n = 19, Gaussian distribution) (p<0.001, Mann–Whitney Test). DCN: dorsal cluster neurons; D-V: dorsal–ventral; SD: standard deviation; SEM: standard error of the mean.
Figure 8—figure supplement 1
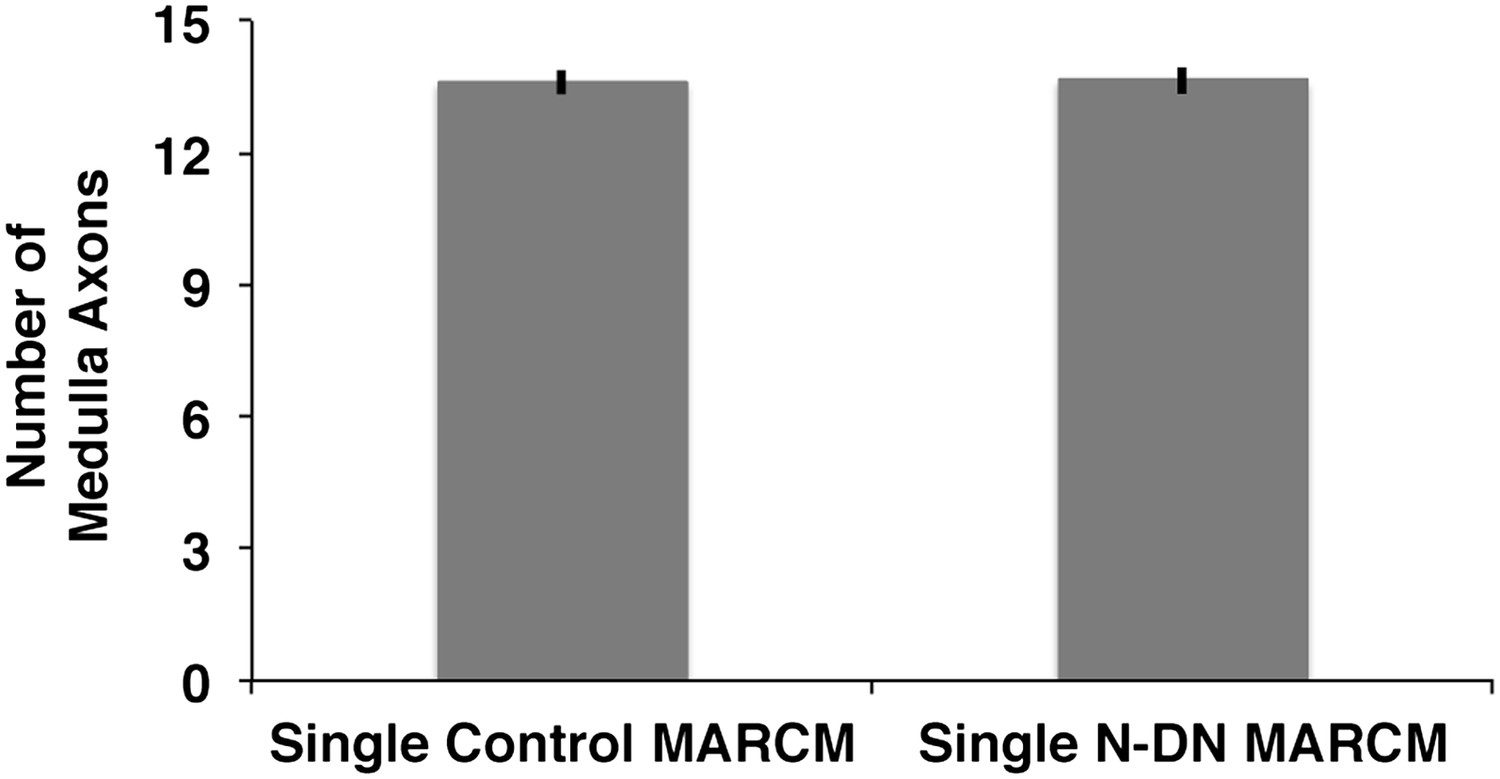
Analysis of medulla axons in a genetic MARCM background.
Analysis of number of medulla innervations, using MARCM technique in combination with a background visualization (Cherry). Single control MARCM 13.6 ± 1.12 SD (n = 15, non-Gaussian distribution), single NDN MARCM 13.64 ± 1.08 SD (n = 14, non-Gaussian distribution) (p>0.05, Mann–Whitney Test). Data shown: mean ± SEM. SD: standard deviation; SEM: standard error of the mean.
Figure 8—figure supplement 2
Loss of Notch function does not alter the D-V position.
An adult fly brain showing the entire DCN pattern marked with Cherry and a single GFP-positive NDNDCN clone with its neurites, generated using MARCM. The D-V position of the DCN soma and its neurites is maintained. Scale bar: 50 µm. DCN: dorsal cluster neurons; D-V: dorsal–ventral.
Figure 8—figure supplement 3

Multi-cell loss of N clone provides clustered axons.
An additional example for multi-cell NDNDCN clone with clustered (GFP-positive) medulla axons.
Download links
A two-part list of links to download the article, or parts of the article, in various formats.
Downloads (link to download the article as PDF)
Open citations (links to open the citations from this article in various online reference manager services)
Cite this article (links to download the citations from this article in formats compatible with various reference manager tools)
Mutual inhibition among postmitotic neurons regulates robustness of brain wiring in Drosophila
eLife 2:e00337.
https://doi.org/10.7554/eLife.00337


