A global change in RNA polymerase II pausing during the Drosophila midblastula transition
- Stowers Institute for Medical Research, United States
- University of Kansas Medical Center, United States
Figures
Figure 1 with 4 supplements
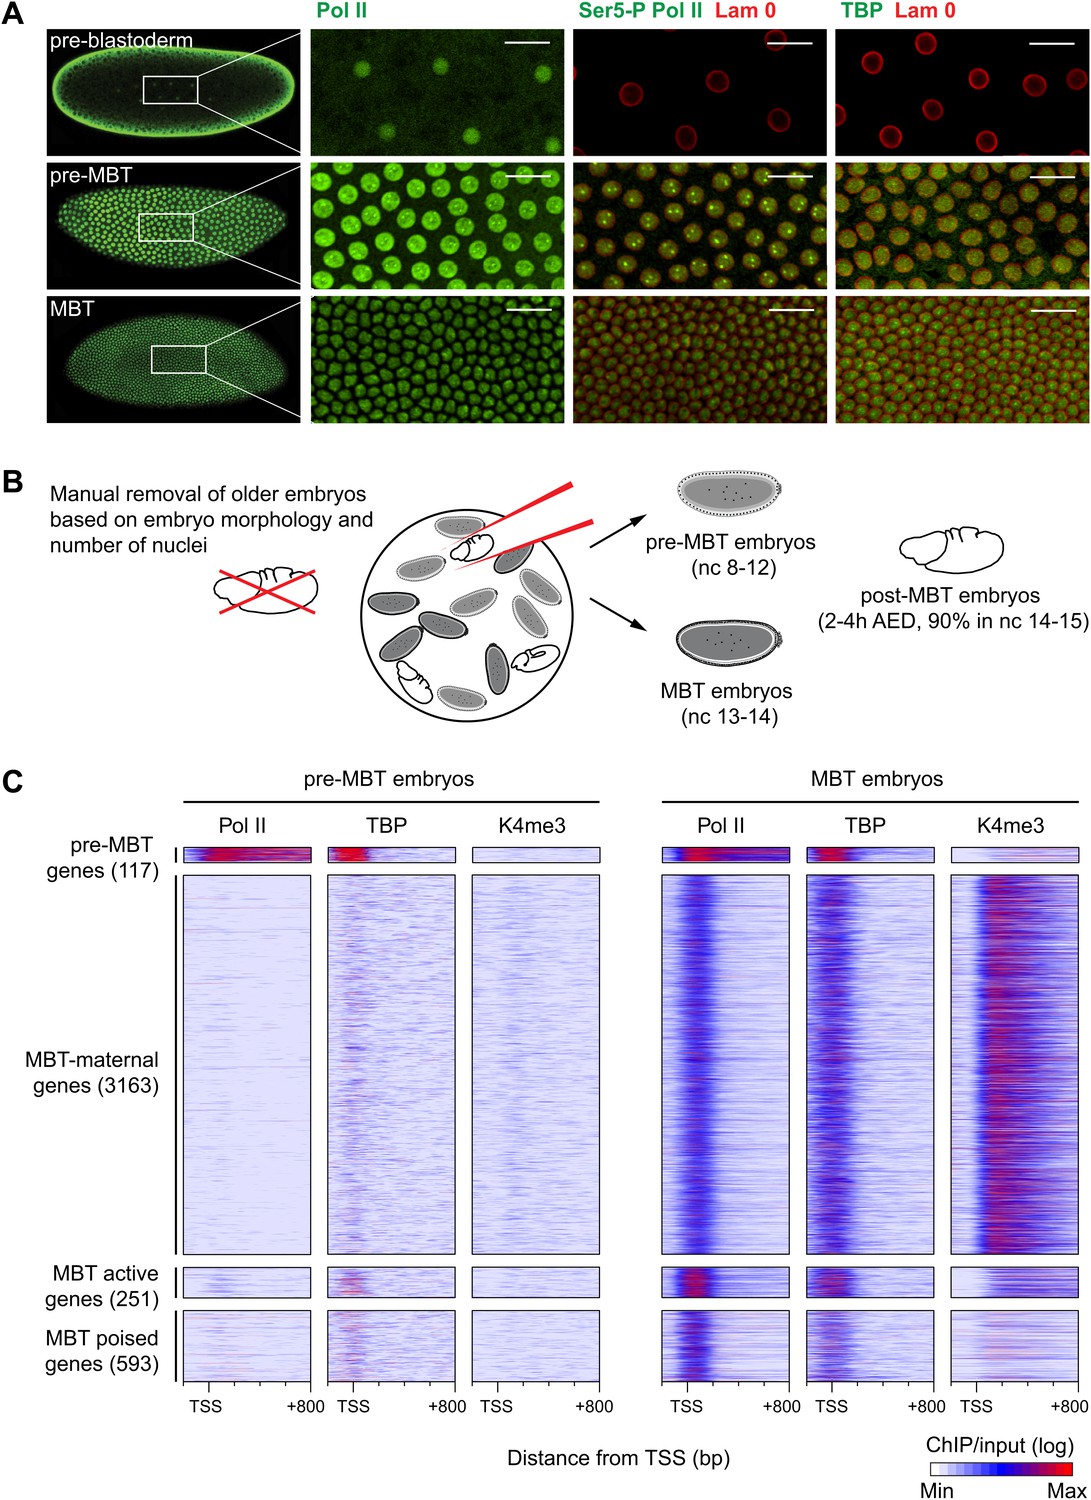
Global recruitment of Pol II during the Drosophila midblastula transition.
(A) Immunostainings of embryos during pre-blastoderm stages (nc 1–7), pre-MBT (nc 8–12) and MBT (nc 13–14) suggest that the initiated form of Pol II (serine-5-phosphorylation of the CTD repeats—Ser5-P), as well as TBP are only detectible in the nuclei (outlined by the Lam 0 in red) of pre-MBT embryos when zygotic transcription begins (scale = 20 μm). (B) Outline of the hand-sorting of embryo collections for ChIP-Seq experiments. (C) Heat map of ChIP-seq enrichments across all genes that are significantly bound by Pol II during MBT. Pre-MBT genes are also significantly bound in the pre-MBT sample; MBT-maternal genes also have maternally provided transcripts in the early embryo (RPKM > 1 during nc 10); the remaining genes are MBT-zygotic genes. Among the latter group, MBT active genes are expressed during the MBT (RPKM > 5 at nc 14D), while the transcript levels of MBT poised genes are below this threshold. Each line shows the normalized enrichments for a gene from −200 bp to +800 bp from the TSS. Note that Pol II is only bound to few pre-MBT genes before the MBT and that there is massive de novo recruitment of Pol II during the MBT. AED = after egg deposition, nc = nuclear cycle.
Figure 1—figure supplement 1
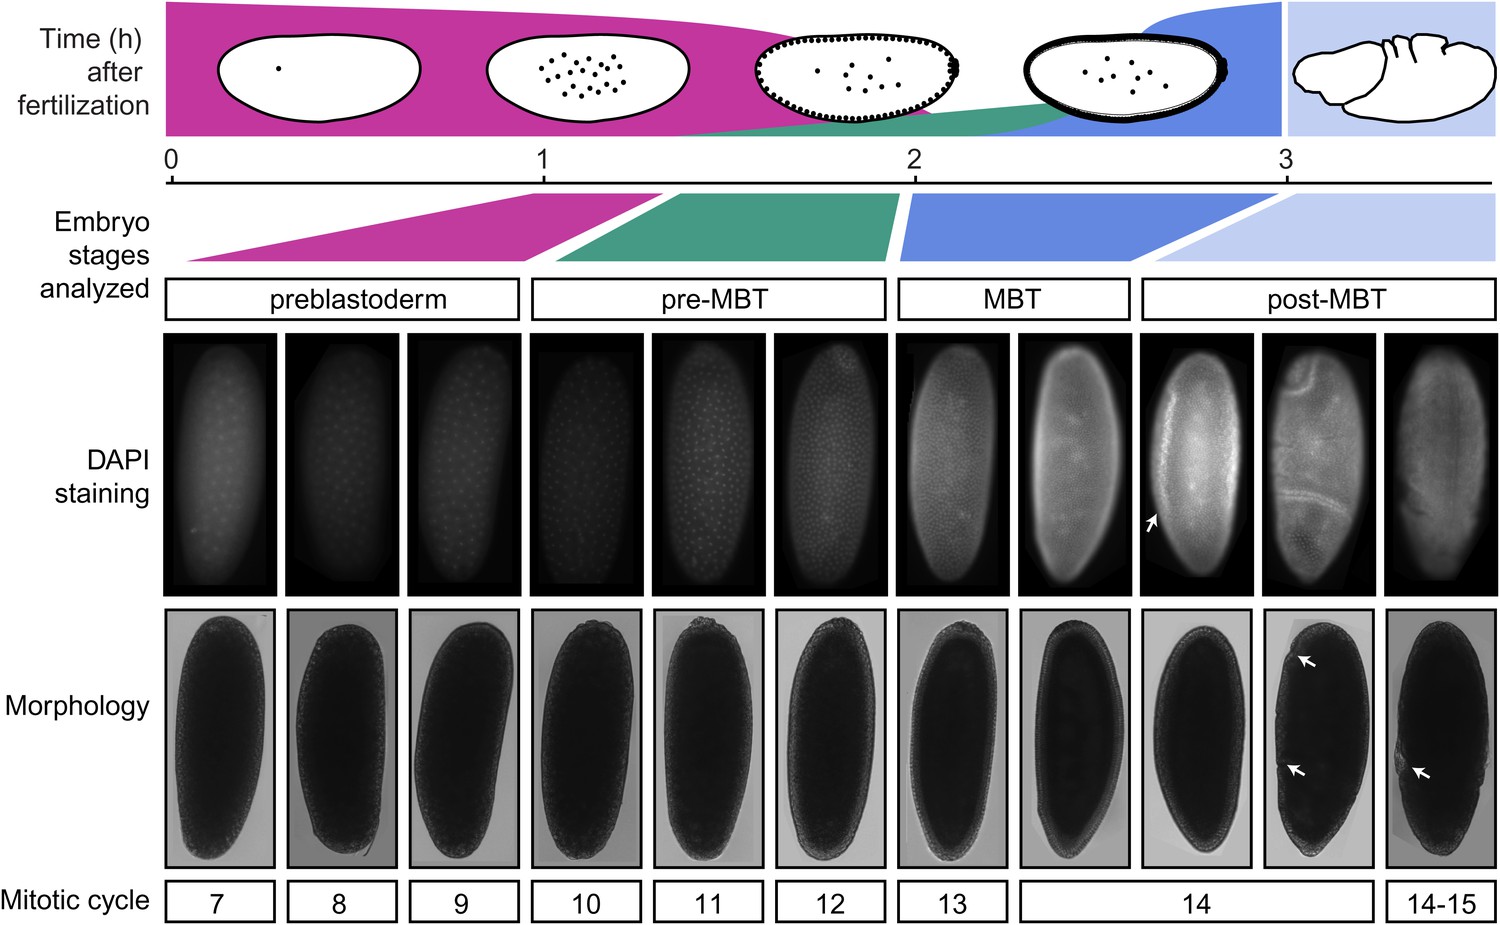
Standards for staging pre-MBT and MBT embryos.
Embryos from a pre-MBT collection (1–2 hr) were screened for embryos in nuclear cycle 13–14 or later and removed. Using DIC, these embryos were recognized by the cellularization or gastrulation furrow (marked by arrows in the post-MBT embryos), were removed. Under UV light, these embryos were recognized based on their number of nuclei with DAPI staining. Likewise, for MBT collections (2–3 hr), embryos with visible furrow formation or high DAPI staining were removed. The small number of embryos that were younger than the desired nuclear cycles were tolerated in both pre-MBT and MBT collections since they do not contribute a significant fraction of nuclei.
Figure 1—figure supplement 2
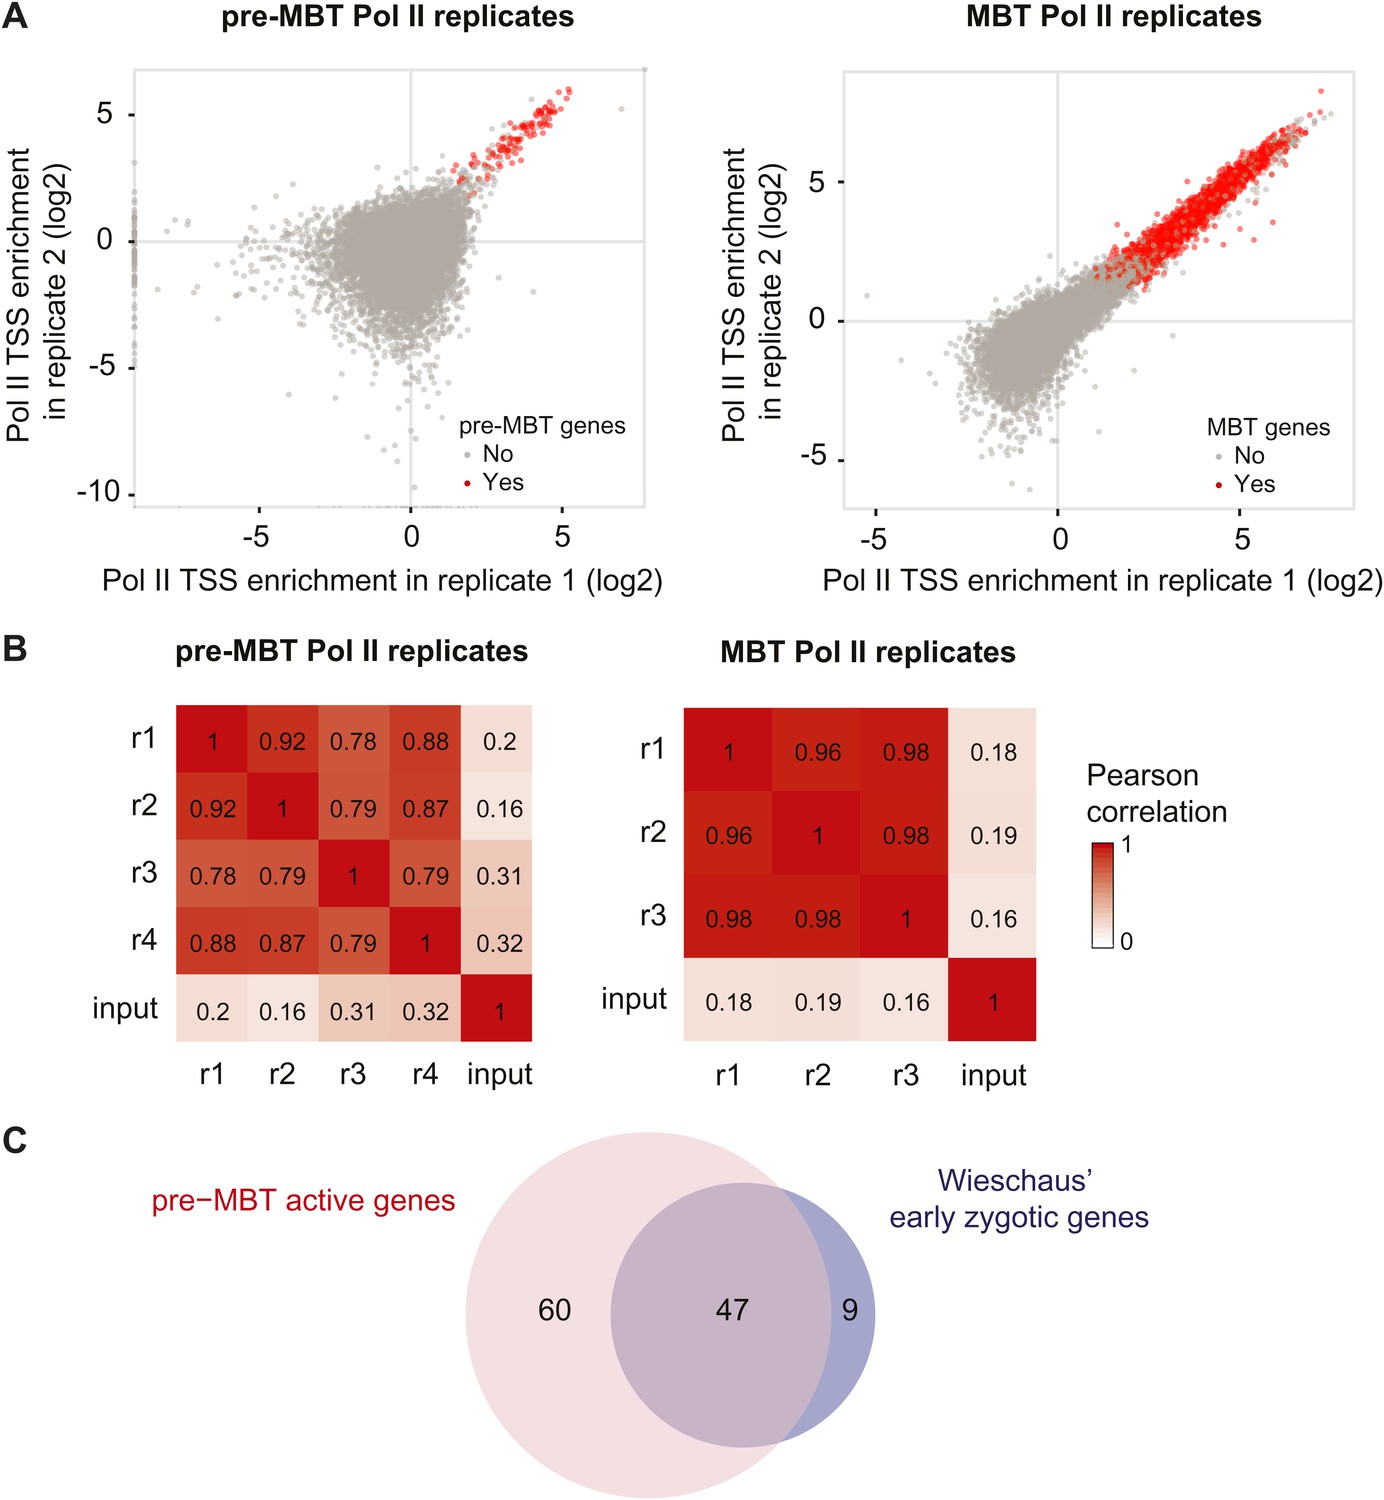
High reproducibility of pre-MBT and MBT Pol II ChIP-seq data and agreement with previous mRNA data.
(A) Scatterplot comparing two pre-MBT Pol II and two MBT Pol II replicates. For each replicate, the enrichment over background in each TSS region (first 200 bp) is displayed. Genes that qualified as pre-MBT genes or MBT genes based on all replicates are shown in red. (B) Pearson correlations between all Pol II ChIP replicates in pre-MBT and MBT embryos. The TSS read counts from each Pol II replicate (numbered from r1 to r4) are compared with each other and with the input (starting material for the ChIP) for each stage. Note that the replicates have high correlations with each other, which far exceed the correlation with the input. (C) Venn diagram showing the strong overlap between pre-MBT active genes (those in the ‘dual’ and ‘not paused’ group) and early zygotic genes identified previously by mRNA microrarray analysis by Wieschaus et al. (De Renzis et al., 2007).
Figure 1—figure supplement 3
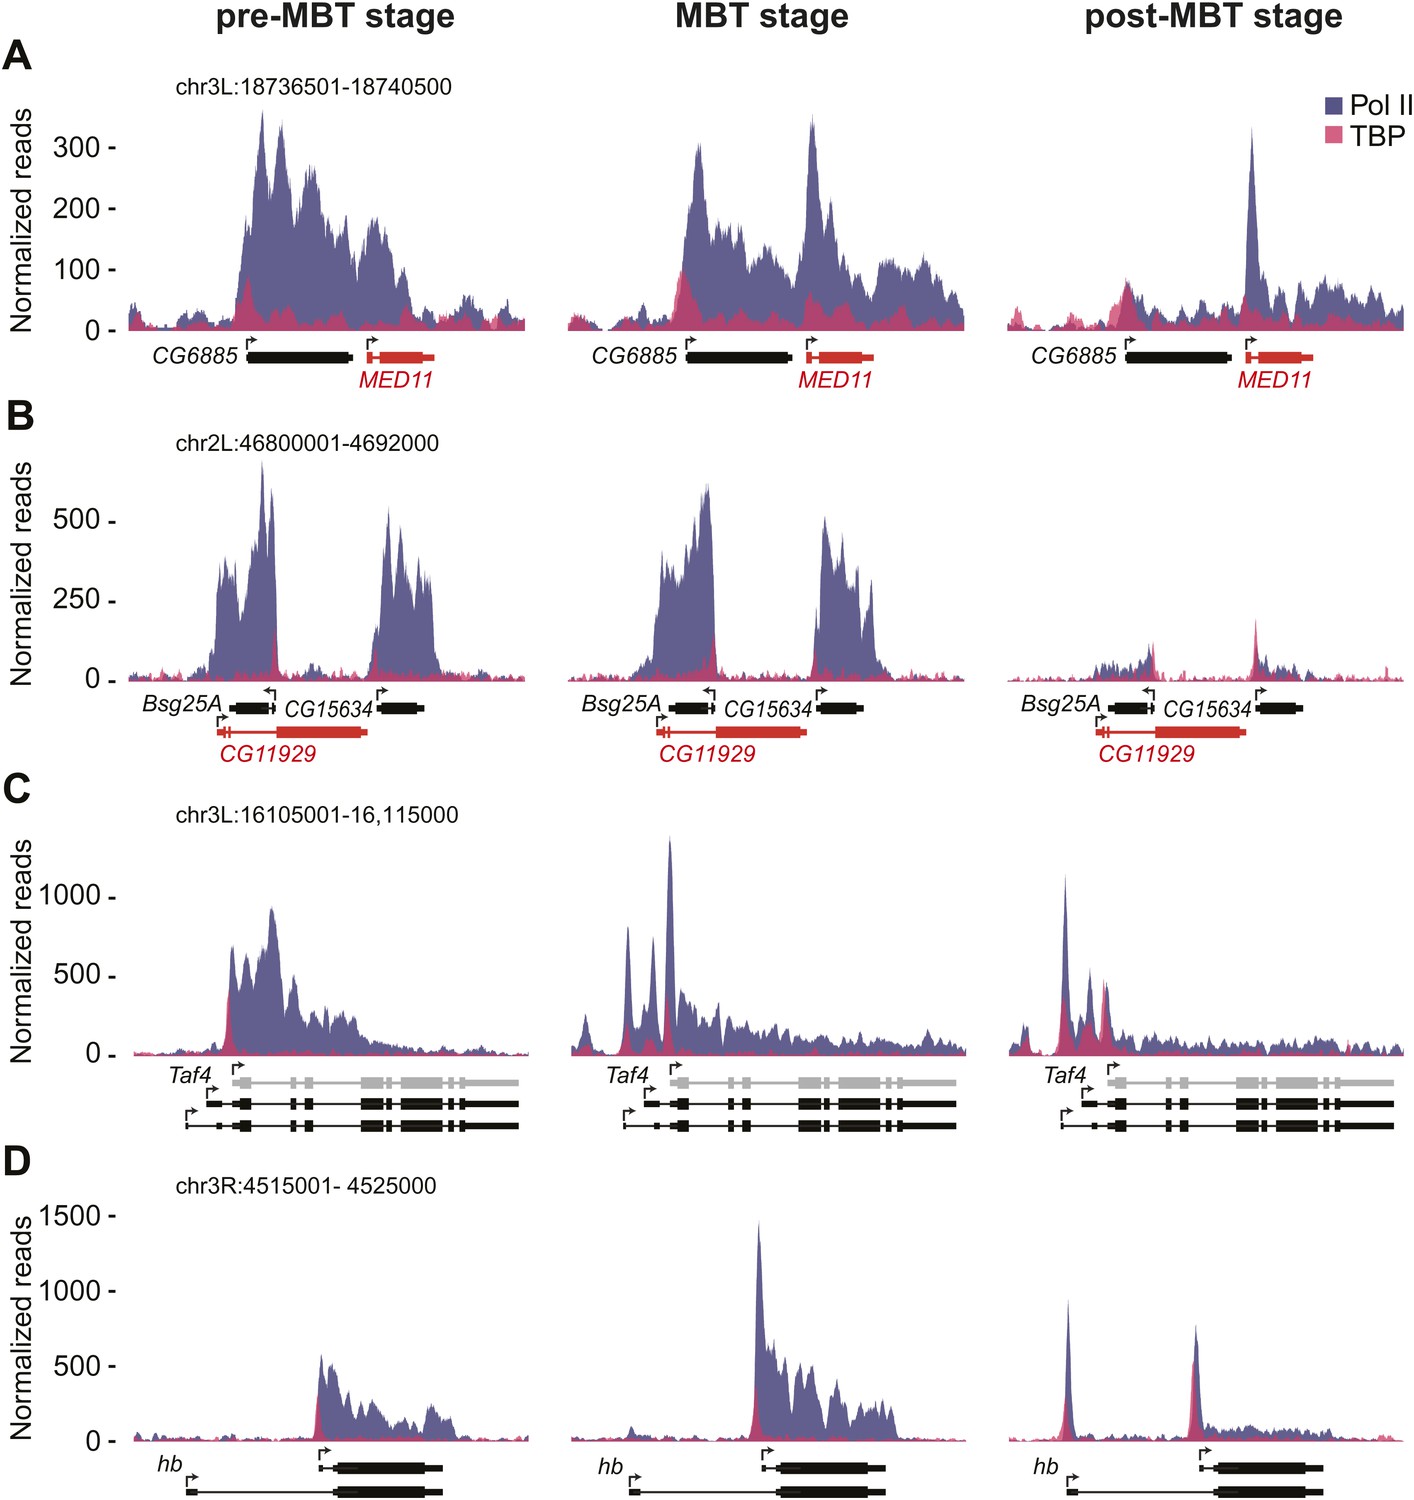
ChIP-seq occupancy of Pol II and TBP at pre-MBT genes with complex patterns. The reads were normalized to the total read count.
(A) MED11, shown in red, is an example of a false pre-MBT gene due to read-through signal from an upstream gene, CG6885. (B) CG11929, shown in red, is an example of a false pre-MBT gene due to signal from an overlapping gene, Bsg25A. (C) Taf4 has an un-annotated more proximal TSS (light grey) that is used during the pre-MBT stage. The two distal known TSSs are used during MBT. (D) hb, a pre-MBT dual gene has two known alternative TSSs that are differentially used during early development. While the most proximal TSS is preferentially used in pre-MBT and MBT embryos, the distal TSS is used mostly in the post-MBT stage.
Figure 1—figure supplement 4
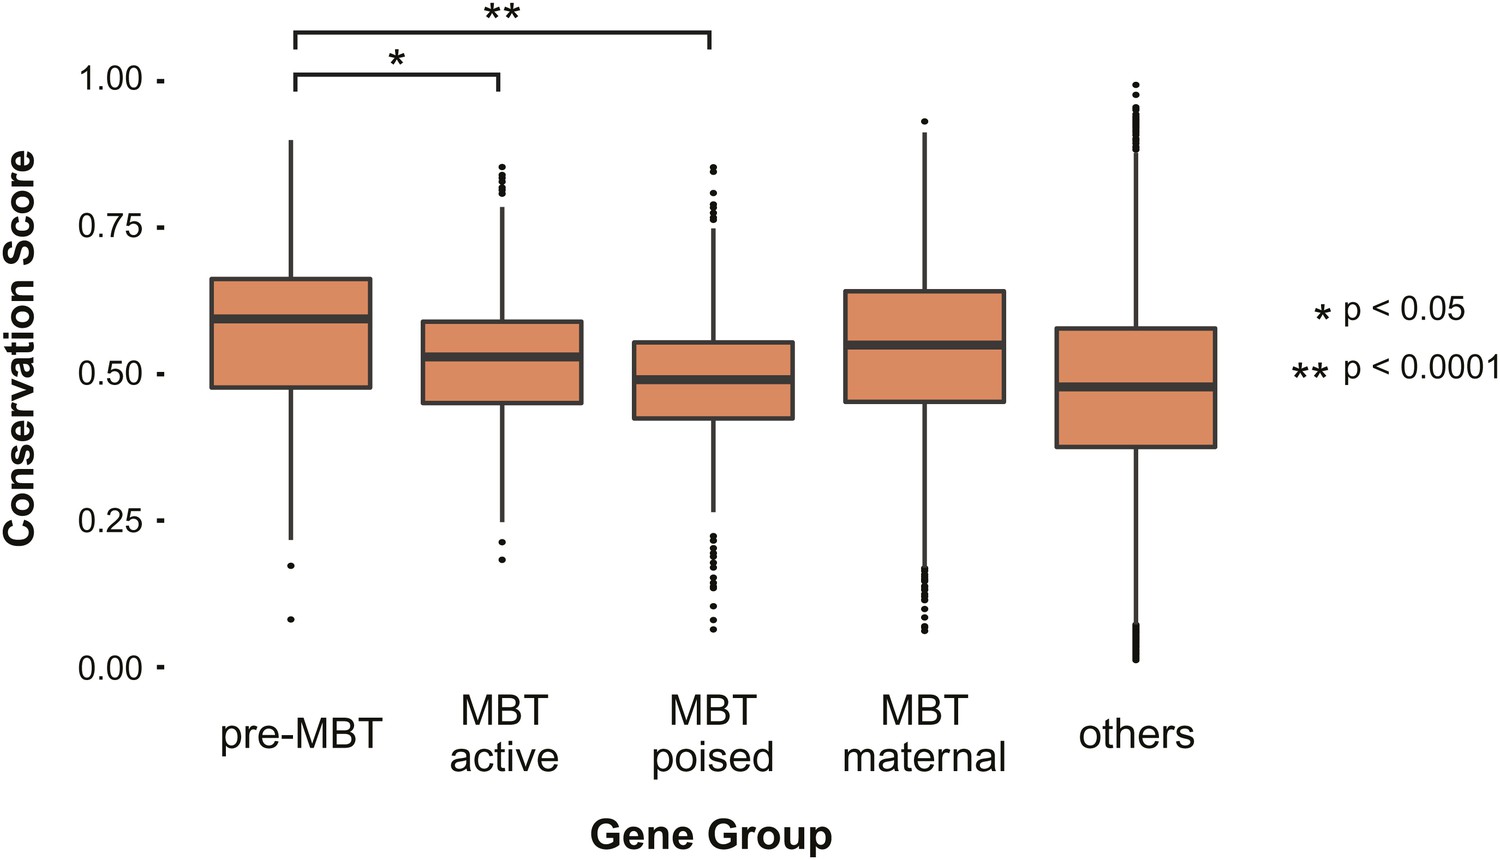
Pre-MBT genes identified by ChIP-Seq show high conservation scores among insect genomes.
Boxplot comparing conservation scores between gene groups. Each transcript’s score is the mean of the phastCons scores (http://genome.cshlp.org/content/15/8/1034) along its annotated location from Flybase.
Figure 2
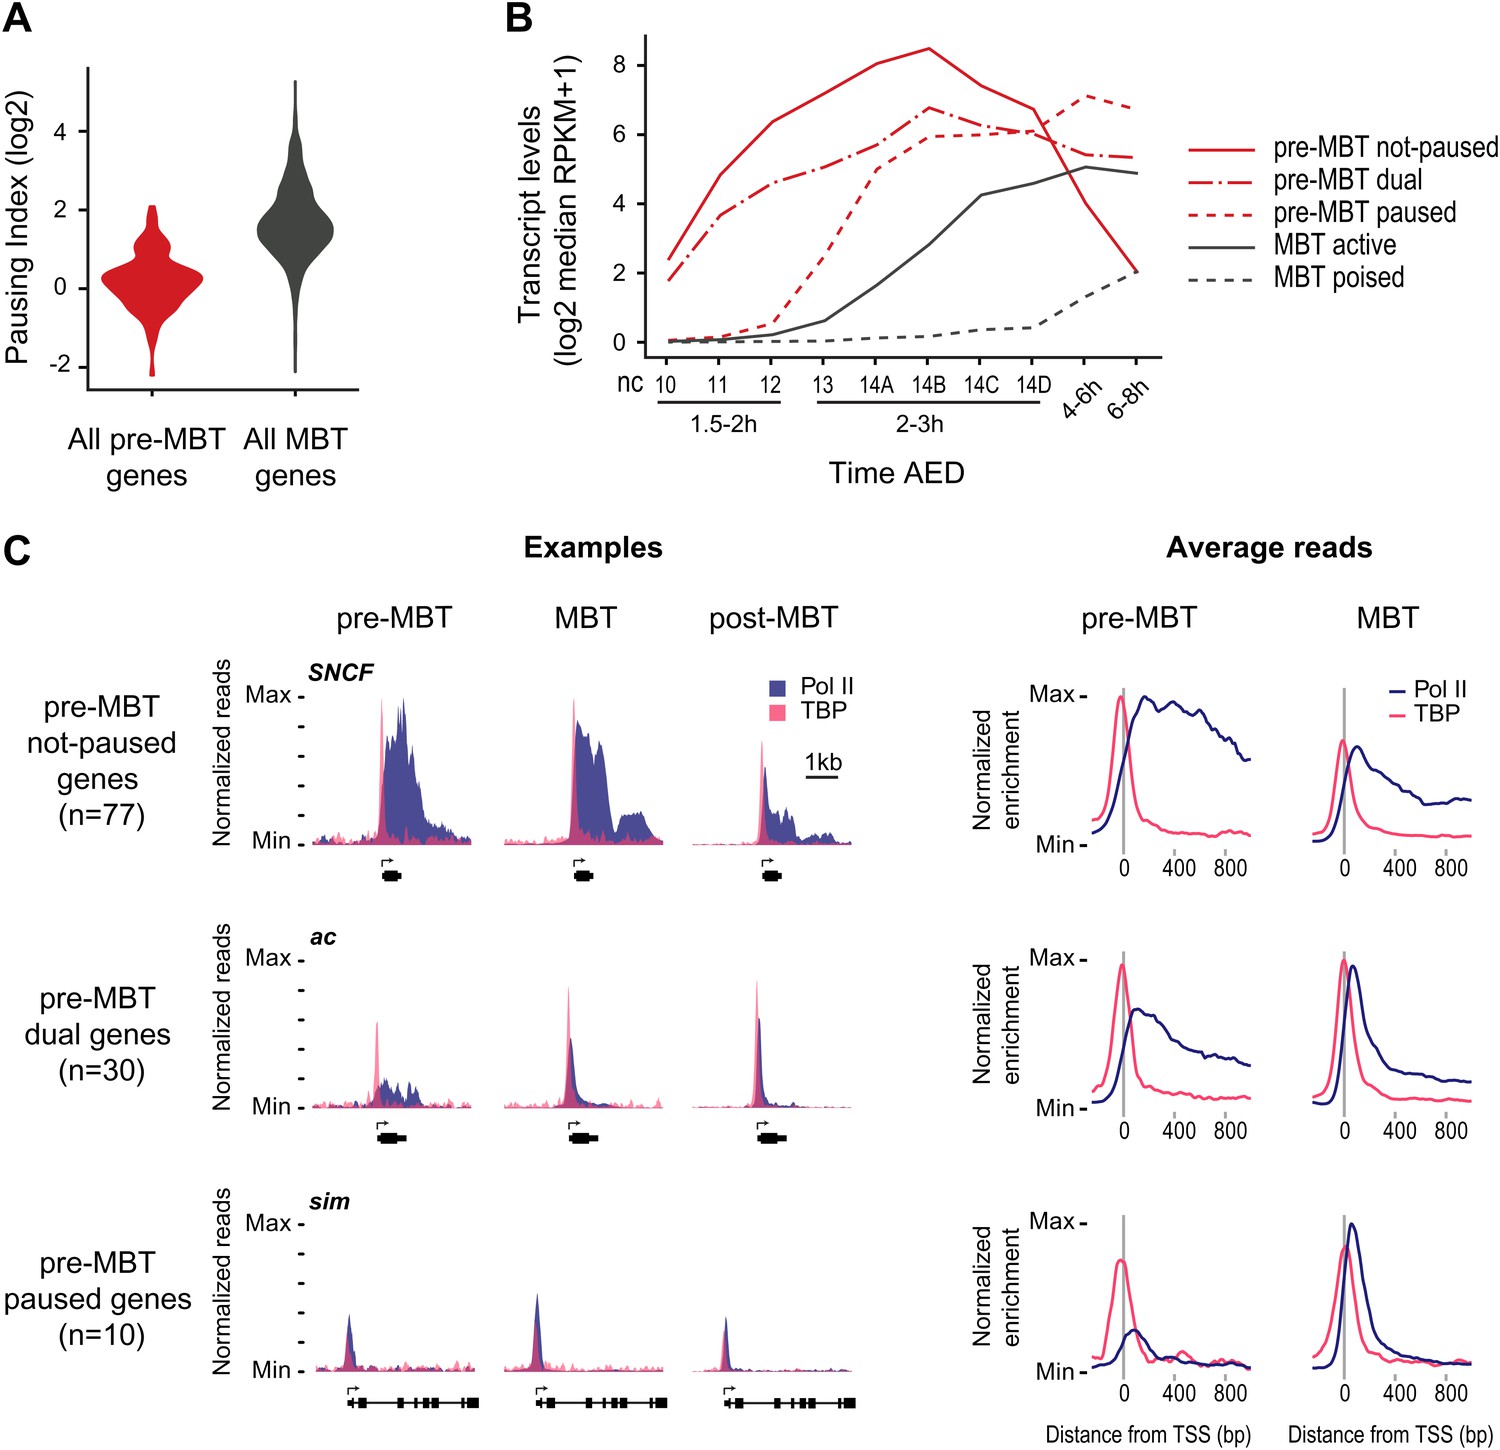
Minimal Pol II pausing before the MBT.
(A) Violin plot of the Pol II pausing index distribution shows that pre-MBT genes (during pre-MBT stages) display less Pol II pausing than MBT genes (during the MBT stage). The width of a violin plot is equivalent to a density curve showing the distribution of values (here pausing indices) within a dataset. (B) Median RNA-seq expression data (Lott et al., 2011) of the three pre-MBT groups and the two MBT groups shows that paused genes are expressed at lower levels and tend to be induced later. (C) Examples and average enrichment of Pol II occupancy (blue) and TBP occupancy (pink) for the three pre-MBT gene groups. Examples are shown as normalized reads while average enrichment is normalized to input. Note that pre-MBT not-paused genes have a non-paused Pol II profile since they do not show elevated Pol II levels at the pause site during pre-MBT and MBT stages. Pre-MBT dual genes switch from an initial non-paused profile during pre-MBT stages to a paused profile during the MBT. Pre-MBT paused genes appear to be paused even during pre-MBT stages. AED = after egg deposition, nc = nuclear cycle.
Figure 3
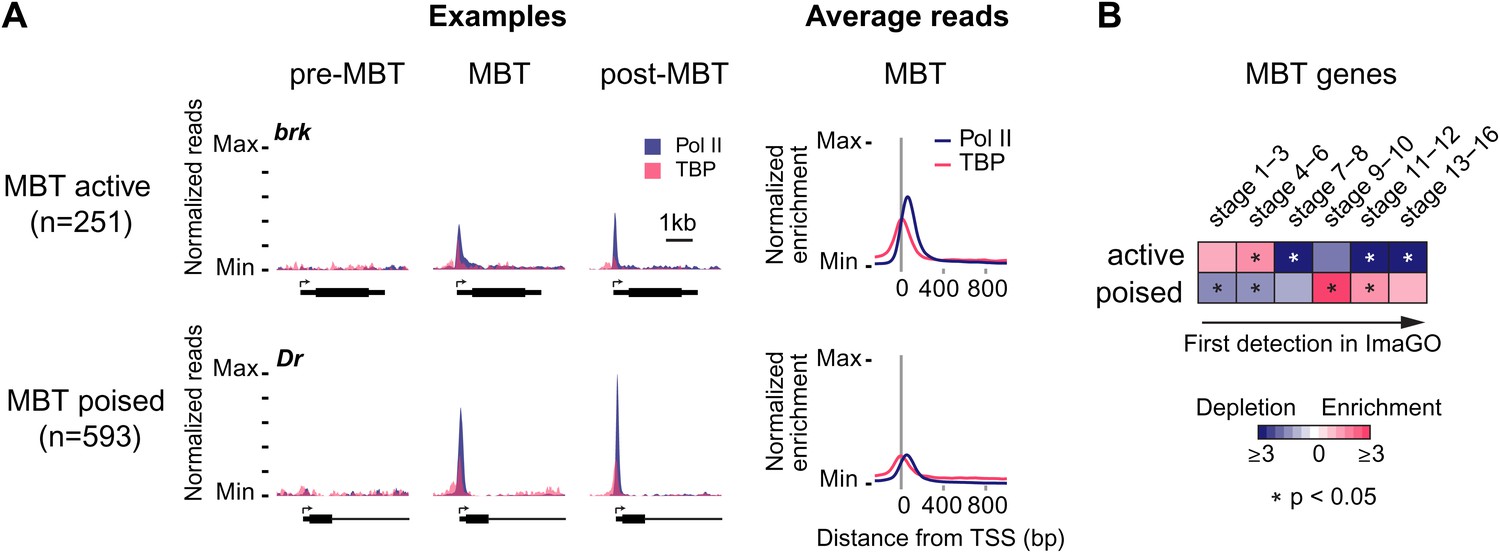
Widespread Pol II pausing of MBT genes and poising for later activation.
(A) Examples and average normalized enrichment (as in Figure 2C) of Pol II occupancy (blue) and TBP occupancy (pink) for the MBT-zygotic genes that are significantly transcribed during MBT (MBT active) or not (MBT poised). Both groups show widespread Pol II pausing. (B) Analysis of large scale in situ hybridizations (ImaGO database, see ‘Materials and methods’) confirms the earlier initial expression of MBT active genes (mostly stage 4–6, peri-cellularization) and shows that many MBT poised genes are first transcribed at later stages of embryogenesis (mostly stage 9–10, post-gastrulation).
Figure 4
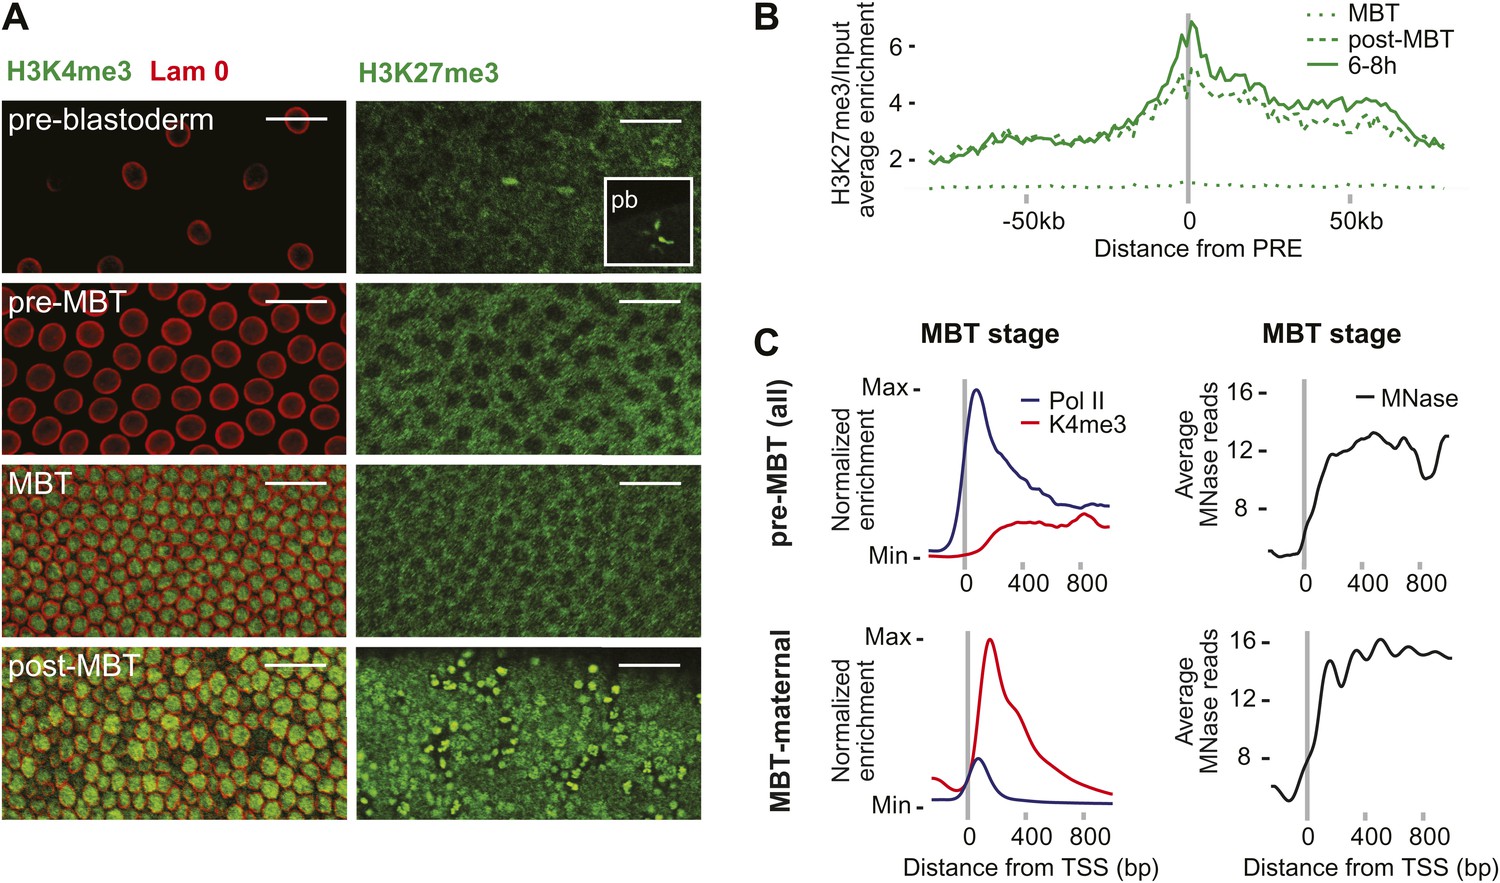
Absence of bivalent domains in pre-MBT embryos.
(A) Lack of detectable H3K4me3 immunostaining in nuclei of embryos before MBT. H3K27me3 is observed in nuclei and polar bodies (pb) of early pre-blastoderm nuclei but not during pre-MBT or MBT stages. H3K27me3 first becomes detectable again in post-MBT embryos (scale = 20 μm). (B) ChIP-seq experiments also suggest that H3K27me3 is absent during the MBT but that the levels increase soon after. Shown is the average pattern of H3K27me3 signal over input surrounding 441 previously identified Polycomb response elements (PREs). (C) Despite high levels of Pol II occupancy, H3K4me3 average gene enrichments are low at pre-MBT genes (top left). This is in contrast to MBT-maternal genes, which have high H3K4me3 enrichment that peaks ∼200 bp downstream of the TSS (bottom left). All enrichments are calculated over input and normalized (see ‘Materials and methods’). The overall nucleosome occupancy, as measured by MNase digestion, shows more pronounced nucleosome positioning at MBT maternal genes but the overall nucleosome occupancy is not dramatically different (compare top and bottom panels at the right). Average read counts from a Micrococcal Nuclease (MNase) experiment are shown.
Figure 5 with 2 supplements
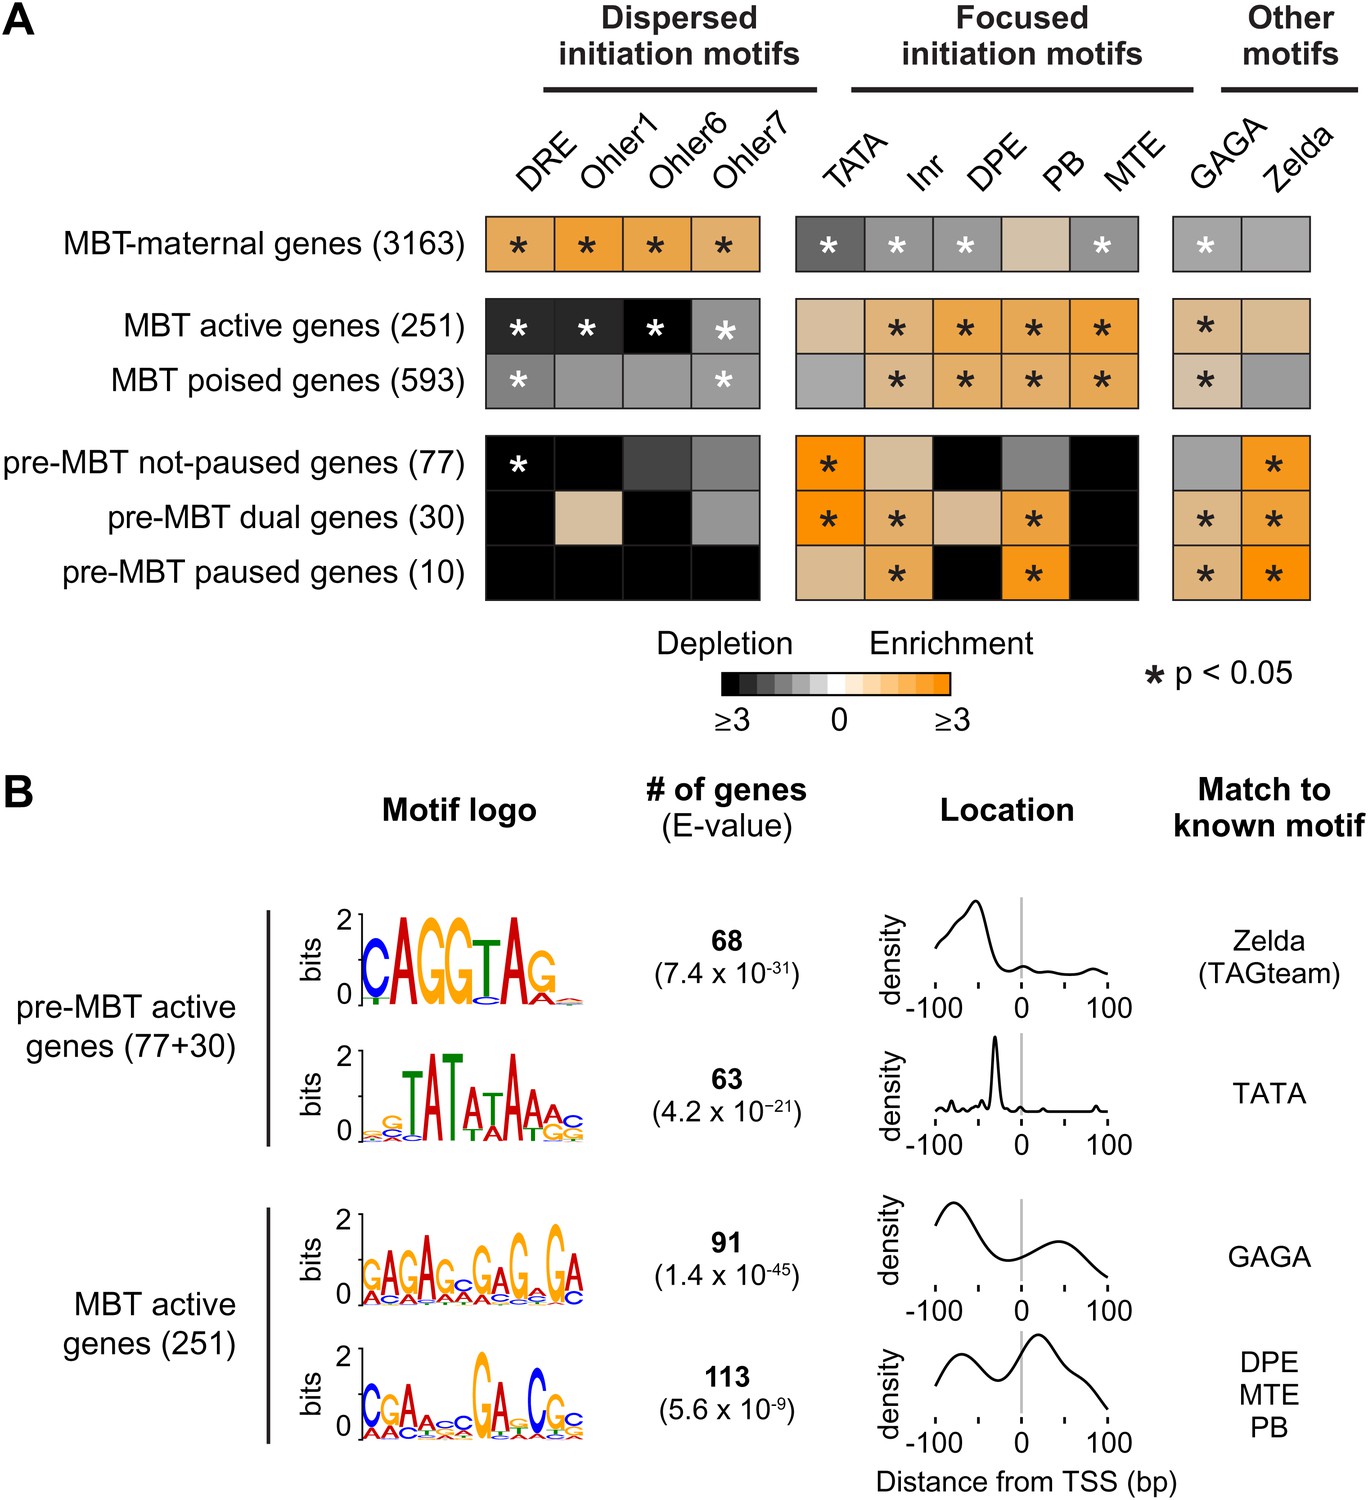
Differential usage of core promoter elements during the zygotic genome activation.
(A) Promoter analysis of all previously identified gene groups. Shown is the enrichment of known core promoter elements found in promoters with dispersed initiation or focused initiation, as well as in the binding motifs for GAGA factor (GAF) and Zelda. Only occurrences close to the known location of the motif relative to the TSS were scored (see Table 3). The star indicates significant enrichment (orange) or depletion (black). Note that the three pre-MBT groups with different Pol II pausing patterns are enriched for distinct core promoter elements. (B) The top two known motifs identified by de novo motif analysis for active pre-MBT genes and active MBT genes. The analysis was performed with MEME on the 200 bp long region centered on the TSS. The number of occurrences, p-value and the density distributions relative to the TSS of the identified motifs are shown on the right. Note that all motifs are found with the highest frequency at the expected location but that the DPE/MTE/PB is less specific and more frequently found at positions where it is unlikely to be functional.
Figure 5—figure supplement 1
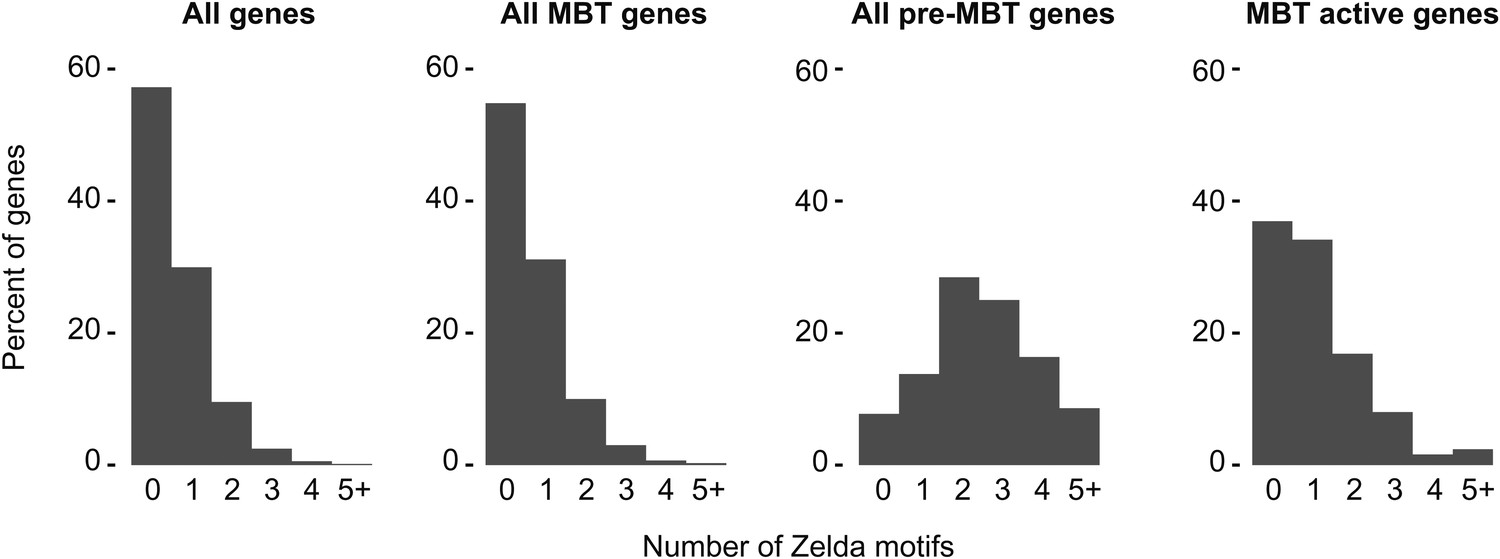
High frequency of Zelda motifs in the promoter region of pre-MBT genes.
Histograms showing the distribution of the number of Zelda motifs found in each promoter region (2 kb upstream of the TSS, see ‘Materials and methods’) among all genes, all MBT genes, all pre-MBT genes, and MBT active genes. Pre-MBT genes are significantly enriched for Zelda motifs (p<0.005). MBT active genes may also show a small enrichment (p<0.1).
Figure 5—figure supplement 2
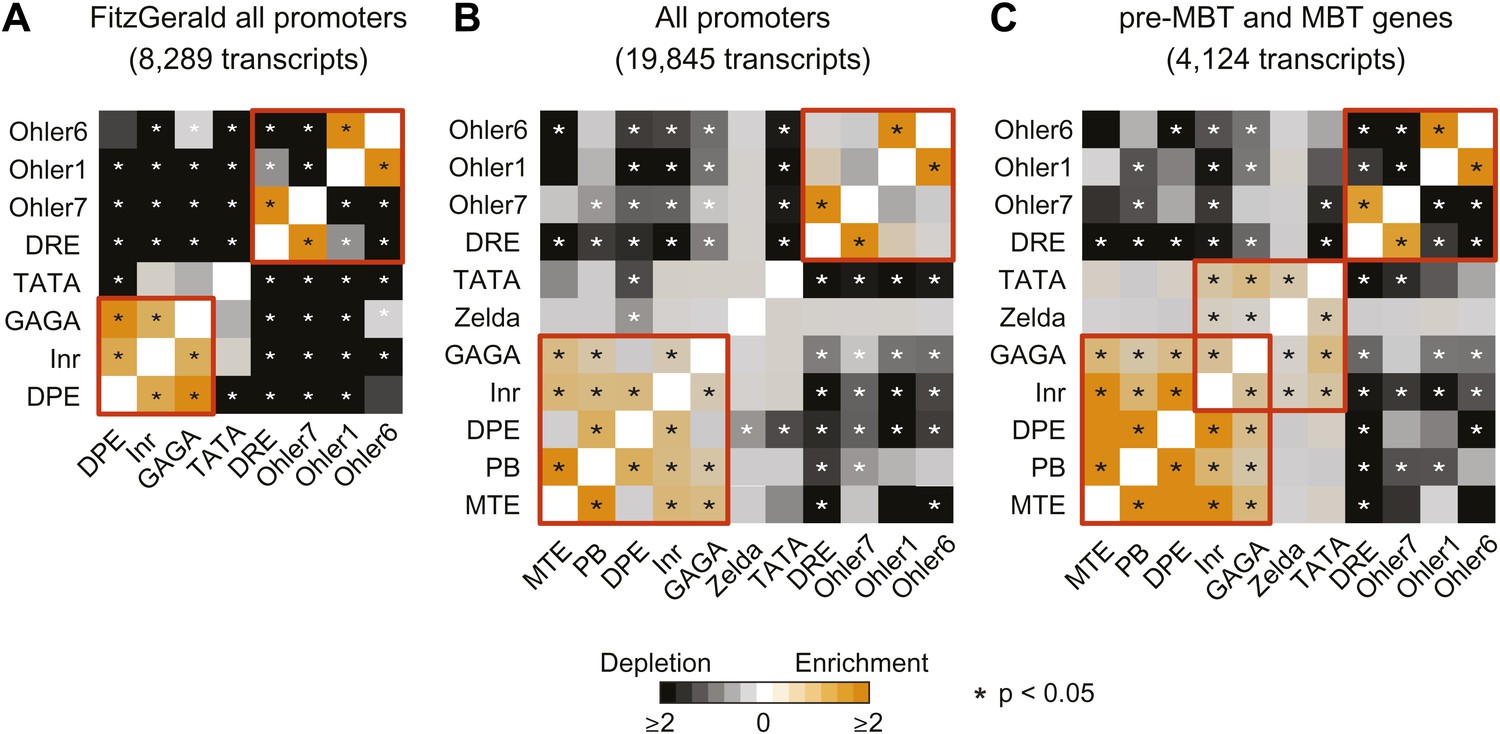
Analysis of the co-occurrence of promoter elements among all genes and early genes.
The relative enrichment or depletion of the co-occurrences compared to the frequency expected by random chance is shown. Significant values (p<0.05, Fisher test) are marked with a star. The order of the motifs is based on hierarchical clustering of the enrichment values shown in C. Groups of co-occurring motifs are highlighted in red. Our analysis for all genes produces similar results to those published previously by FitzGerald et al. (2006). The results from the FitzGerald analysis (which included 8,289 transcripts available at the time) are graphically visualized by our method (A). Our updated analysis using all current FlyBase promoters (19,845 transcripts) and additional motifs are shown in comparison (B). The co-occurrence of pausing elements (MTE, PB, DPE, Inr, GAGA) and dispersed promoter elements (DRE, Ohler7, Ohler1, Ohler6), respectively, are marked with a red box. Note that the motifs in the FitzGerald analysis deviate in some cases from our promoter elements (e.g., GAGA), which explains some differences. We then compared the results to our ‘pre-MBT and MBT’ set (C). The co-occurrence of TATA, Inr and Zelda (as well as with GAGA, which is found in dual genes) is significant in this set (marked with a red box), suggesting that promoters with this combination of motifs are preferentially found among early genes.
Figure 6
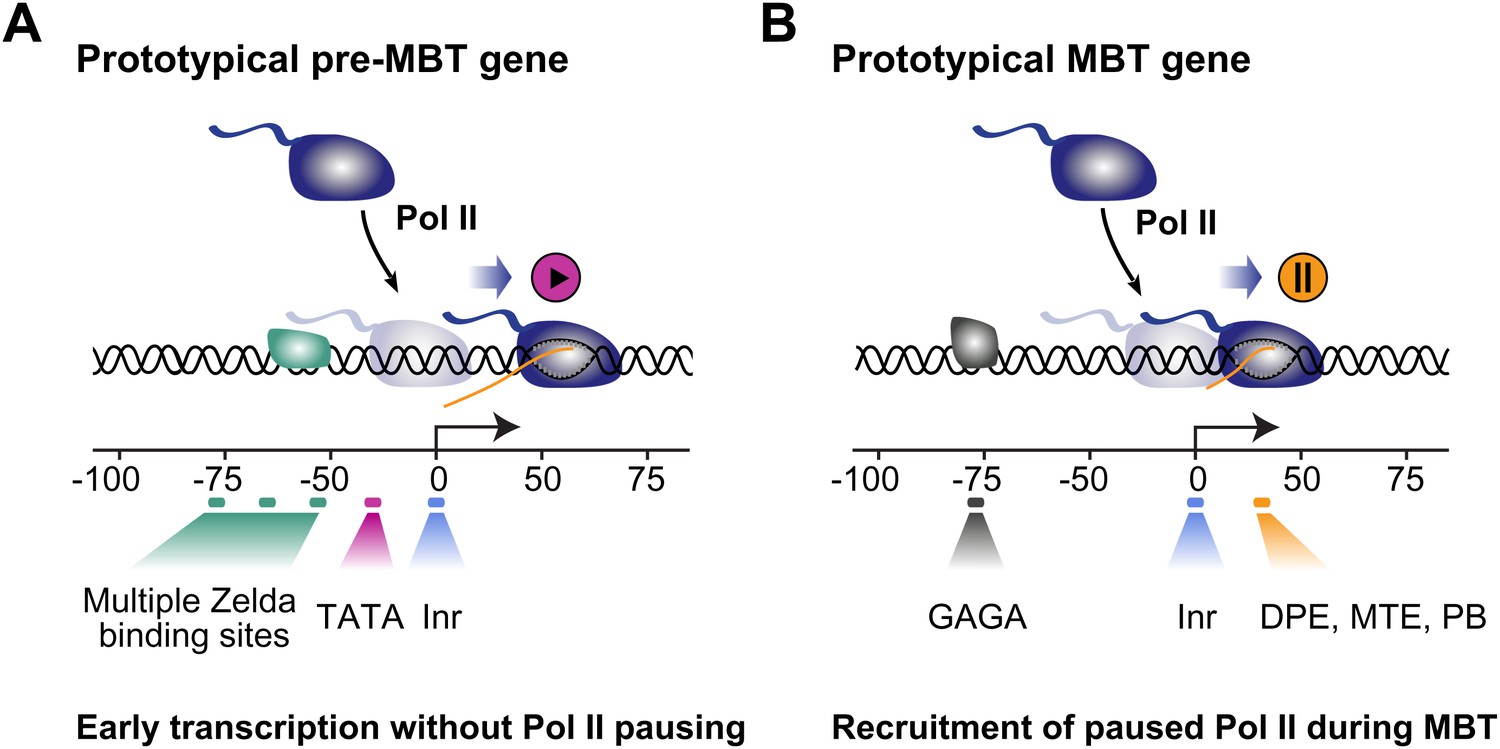
Proposed model for the two main modes of Pol II recruitment and elongation behavior during the zygotic genome activation.
Before the midblastula transition, when the cell cycle is fast, efficient transcription occurs through a TATA promoter with multiple Zelda sites upstream. This combination leads to transcription without pausing, presumably due to fast re-initiation. During the midblastula transition, Pol II is recruited de novo to many genes and pausing is established with the help of GAGA factor and core promoter elements associated with pausing such as DPE, MTE and PB. Note that genes can have core promoter elements of both modes (e.g., TATA and PB), leading them to switch from a non-pausing behavior to a pausing behavior during the midblastula transition. It is likely that transcription factors in addition to Zelda and GAF also influence the Pol II behavior at genes.
Tables
Table 1
Classification of pre-MBT genes
| Function | Gene names |
|---|---|
| Sex determination | Dpn, sisA, Sxl, os |
| Cellularization | nullo, Sry-alpha, kuk, bnk, slam |
| Anterio-posterior patterning | cad, hb, gt, kni, tll, eve, h, run, slp1, odd, ftz, Egfr |
| Dorso-ventral patterning | sna, esg, Nrt, glec, ac, l(1)sc, Tom, BobA, m4, zen, zen2, tsg, tld, scw, Neu2, sc, fd19B, bnb, Bro, Brd, Ocho, amos, ato, sim, lea |
| Other function | Taf4, wech, Corp, toc, spri, Z600, halo, SNCF, CG4570, spo, hrg, sca, Lac, RpL3, btsz, αTub84B |
| Non-coding RNA | mir-9a, mir-309, roX1, snRNA:U5:34A, snRNA:U4atac:82E, snRNA:U1:82 Eb, snRNA:U5:23D, snRNA:U5:38ABb, snRNA:U5:14B, snRNA:U4:38AB, snRNA:U1:95Cc |
| Unknown function | |
| Localized expression | gk, CG9894, CG5059, sala, term, CG14427, CG8960, CG13711, CG13713, CG15876, CG6885, CG7271, CG14014 |
| Ubiquitous expression | Bsg25A, Bsg25D, CG15634, CG15382 |
| Others | CG2201, CG42666, CG43659, CG13716, CG13712, CG13000, CG13465, CG14561, CG18269, CG14915, CG16813, CG15479, CG15480, CG4440, CG14317, CG13427, CG34137, CG34214, CG34224, CG34266, CG16815, CG42762, CG43184, CG 9775, CG9883, CR43887, CG9821, CG33232 |
-
Bold marks the pre-MBT dual genes and italic marks the pre-MBT paused genes.
Table 2
Size and intron difference between pre-MBT and MBT zygotic genes
| Transcript size | Shortest transcript usage | Intron content | ||||
|---|---|---|---|---|---|---|
| Gene group | Gene count | Median width (bp) | Genes with multiple TSS | Genes using shortest transcript (%) | Gene count (protein-coding) | Genes with no introns (%) |
| All pre-MBT | 117 | 1228* | 35 | 22 (62.9%)† | 97 | 53 (54.6%)‡ |
| MBT maternal | 3163 | 3322 | 1125 | 308 (27.4%) | 3163 | 228 (7.2%) |
| MBT zygotic | 844 | 6042 | 284 | 87 (30.6%) | 736 | 68 (9.2%) |
| active | 251 | 5422 | 191 | 50 (26.2%) | 251 | 35 (13.9%) |
| poised | 593 | 6771 | 93 | 37 (39.8%) | 485 | 33 (6.8%) |
-
*
Mann–Whitney test for pre-MBT vs MBT zygotic transcript size: p<10−20.
-
†
Fisher test for pre-MBT vs MBT zygotic: p<0.0003.
-
‡
Fisher test for pre-MBT vs MBT zygotic: p<10−23.
Table 3
Drosophila promoter elements analyzed in this study
| Motif name | IUPAC consensus | Directional | Window (bp from TSS) | Transcript count | Reference | Note |
|---|---|---|---|---|---|---|
| DRE | WATCGATW | Yes | −100 to 0 | 2111 | (Hochheimer et al., 2002) | Dispersed initiation |
| Ohler1 | YGGTCACACTR | Yes | −100 to 50 | 609 | (Ohler et al., 2002) | |
| Ohler6 | YRGTATWTTY | Yes | −150 to 25 | 840 | (Ohler et al., 2002) | |
| Ohler7 | CAKCNCTR | Yes | −100 to 50 | 2190 | (Ohler et al., 2002) | |
| TATA | STATAWAWR | Yes | −100 to 0 | 1503 | (Goldberg, 1979) | Focused initiation |
| Inr | TCAKTY | Yes | −50 to 50 | 5965 | (Smale and Baltimore, 1989) | |
| DPE | KCGGTTSK | Yes | 0 to 75 | 537 | (Burke and Kadonaga, 1996) | |
| PB | KCGRWCG | Yes | −50 to 100 | 2093 | (Hendrix et al., 2008) | |
| MTE | CSARCSSA | Yes | 0 to 30 | 212 | (Lim et al., 2004) | |
| GAGA | GAGA | No | −100 to 0 | 9559 | (Stark et al., 2007) | Other motifs |
| Zelda | YAGGTAR | No | −2000 to 0 | 9798 | (Liang et al., 2008; ten Bosch et al., 2006) |
Download links
A two-part list of links to download the article, or parts of the article, in various formats.
Downloads (link to download the article as PDF)
Open citations (links to open the citations from this article in various online reference manager services)
Cite this article (links to download the citations from this article in formats compatible with various reference manager tools)
A global change in RNA polymerase II pausing during the Drosophila midblastula transition
eLife 2:e00861.
https://doi.org/10.7554/eLife.00861


