Structural basis for activation and non-canonical catalysis of the Rap GTPase activating protein domain of plexin
- University of Texas Southwestern Medical Center, United States
Figures
Figure 1
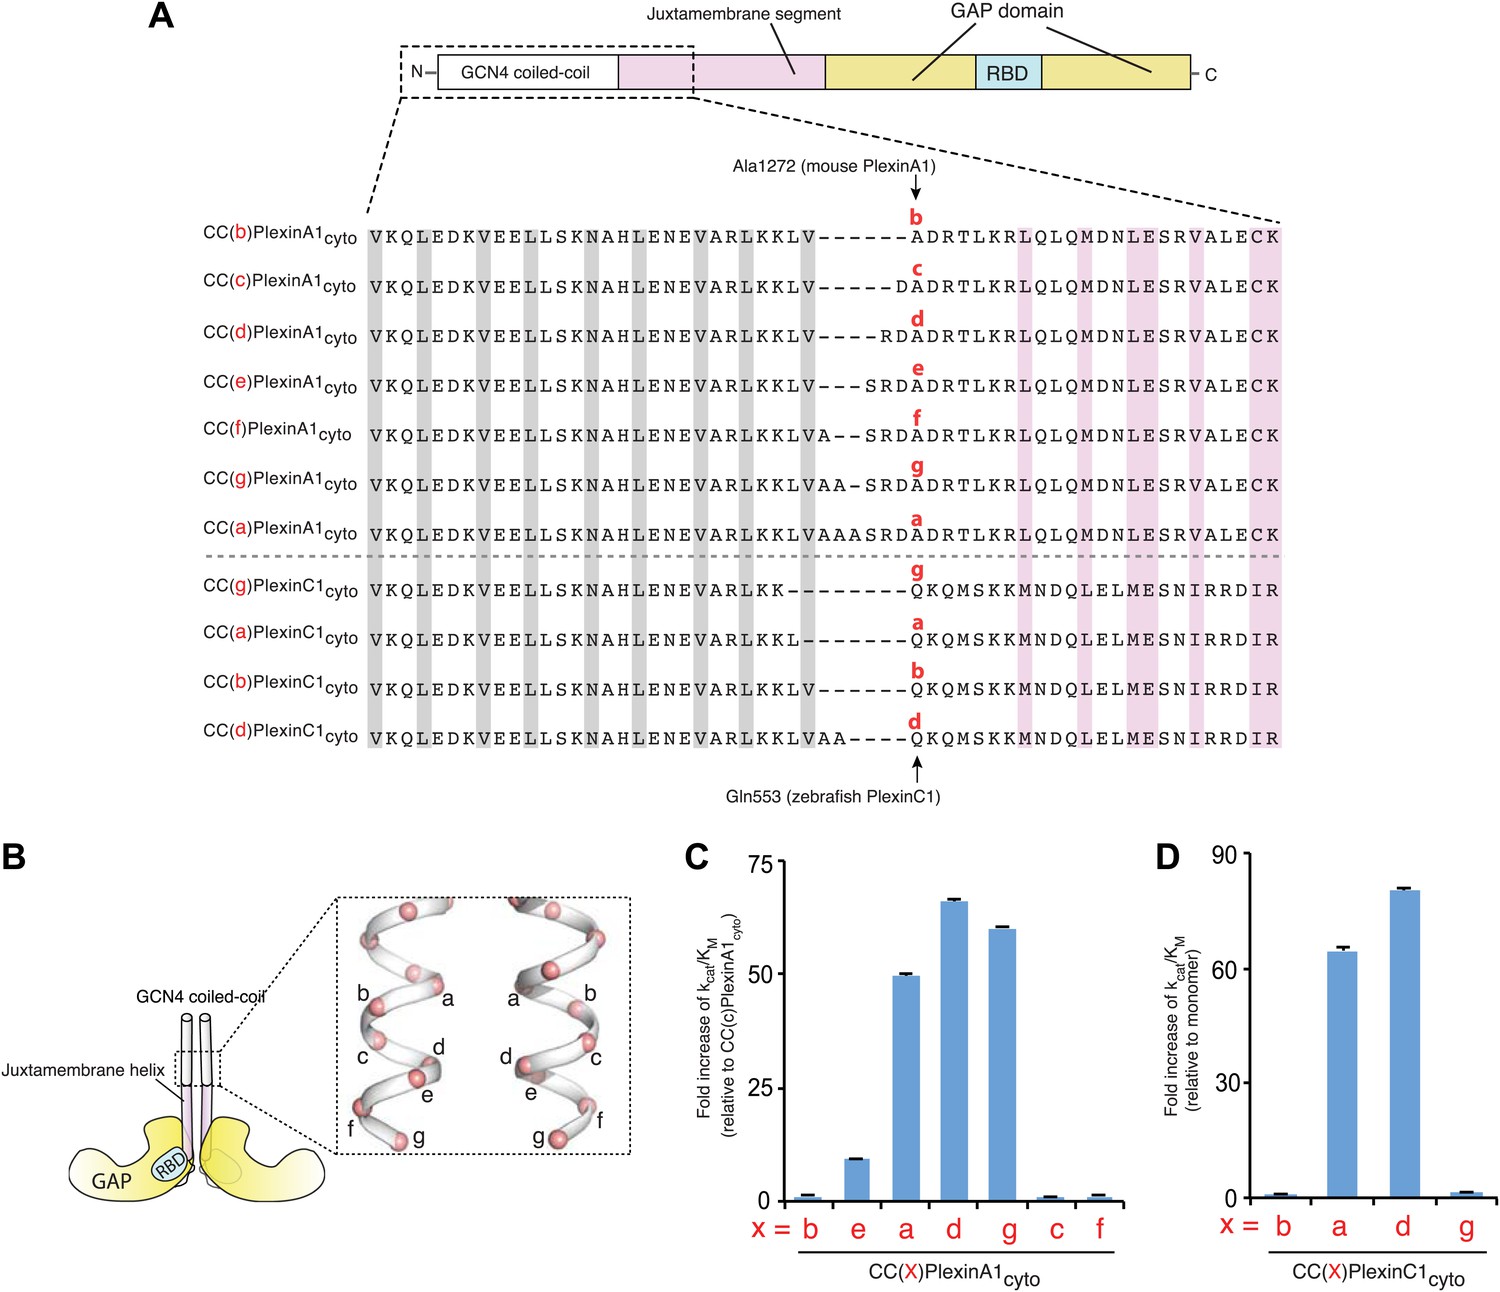
Activation of the plexin GAP by coiled-coil fusion.
(A) Design of the coiled-coil fusions of mouse PlexinA1cyto and zebrafish PlexinC1cyto. The juxtamembrane segment sequences from mouse PlexinA1cyto and zebrafish PlexinC1cyto are aligned. The constructs are named CC(x)Plexincyto, where ‘x’ (in red) is the position of Ala1272 in PlexinA1 or Gln553 in PlexinC1 on the heptad repeat. The ‘a’ and ‘d’ positions in the GCN4 coiled-coil are highlighted gray. Residues at the active dimer interface are highlighted pink. (B) Diagram of the CC(x)Plexincyto constructs. (C) GAP activity of mouse CC(x)PlexinA1cyto. Activity of monomeric PlexinA1cyto is too low to be measured reliably. The fold increase of kcat/KM is calculated relative to CC(c)PlexinA1cyto, which is the least active among the dimers but approximately 10-fold more active than the monomer. (D) GAP activity of zebrafish CC(x)PlexinC1cyto. In both (C) and (D), error bars represent standard error of the kcat/KM.
Figure 2
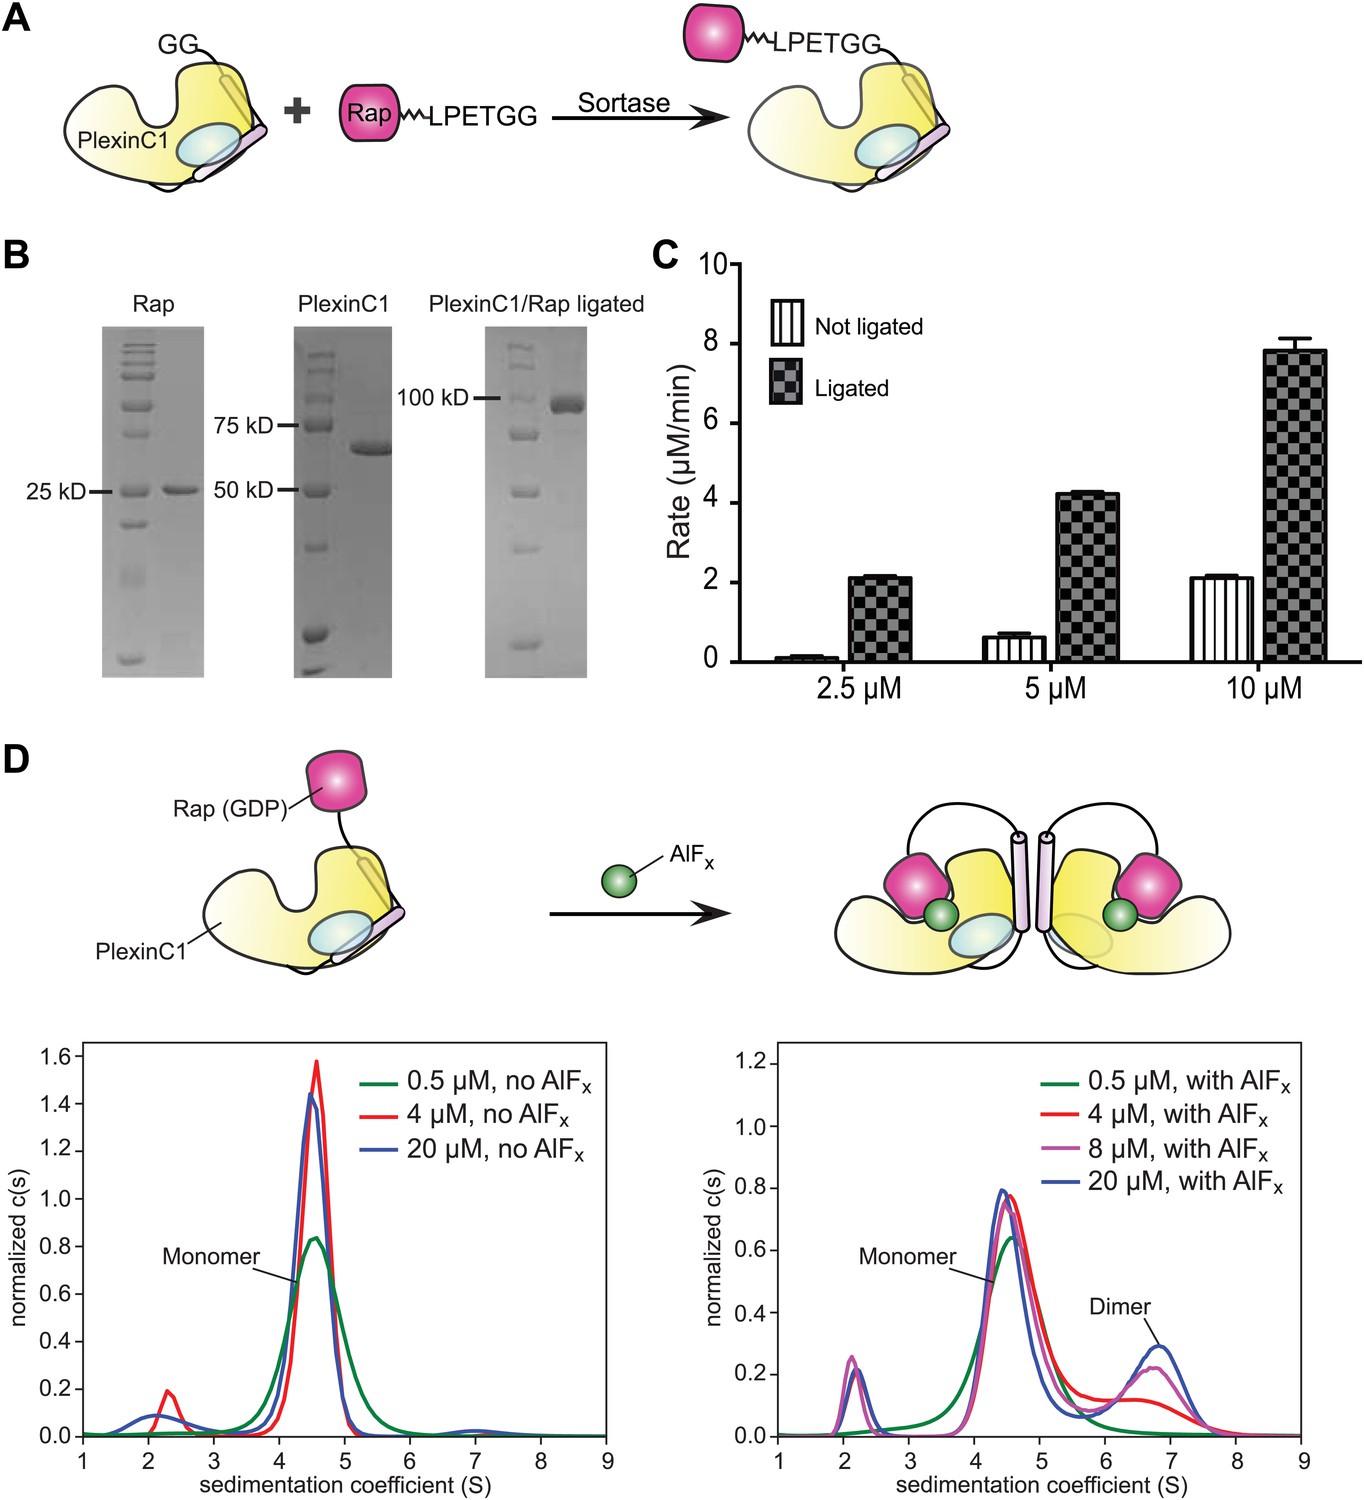
Sortase-mediated ligation and characterization of the ligated PlexinC1cyto/Rap1B complex.
(A) Scheme of the sortase-mediated ligation. (B) Representative gels of purified PlexinC1cyto, Rap1B and the ligated PlexinC1cyto/Rap1B complex with the 24-residue linker and the ‘LPETGG’ sortase recognition motif. (C) Comparison of the GTP hydrolysis activity between the ligated complex and the individual PlexinC1cyto and Rap1B proteins mixed at the same concentrations. The hydrolysis rates are averages of three replicates. Error bars represent standard deviation of the mean. (D) Analytical ultracentrifugation showing AlFx-induced dimerization of the ligated PlexinC1cyto/Rap1B complex. In the absence of AlFx (the left panel), the majority of the complex behaves as a monomer with a sedimentation coefficient of 4.5 S. In the presence of AlFx (the right panel), a dimeric species (sedimentation coefficient of 6.7 S) appears and becomes more abundant at higher protein concentrations.
Figure 3
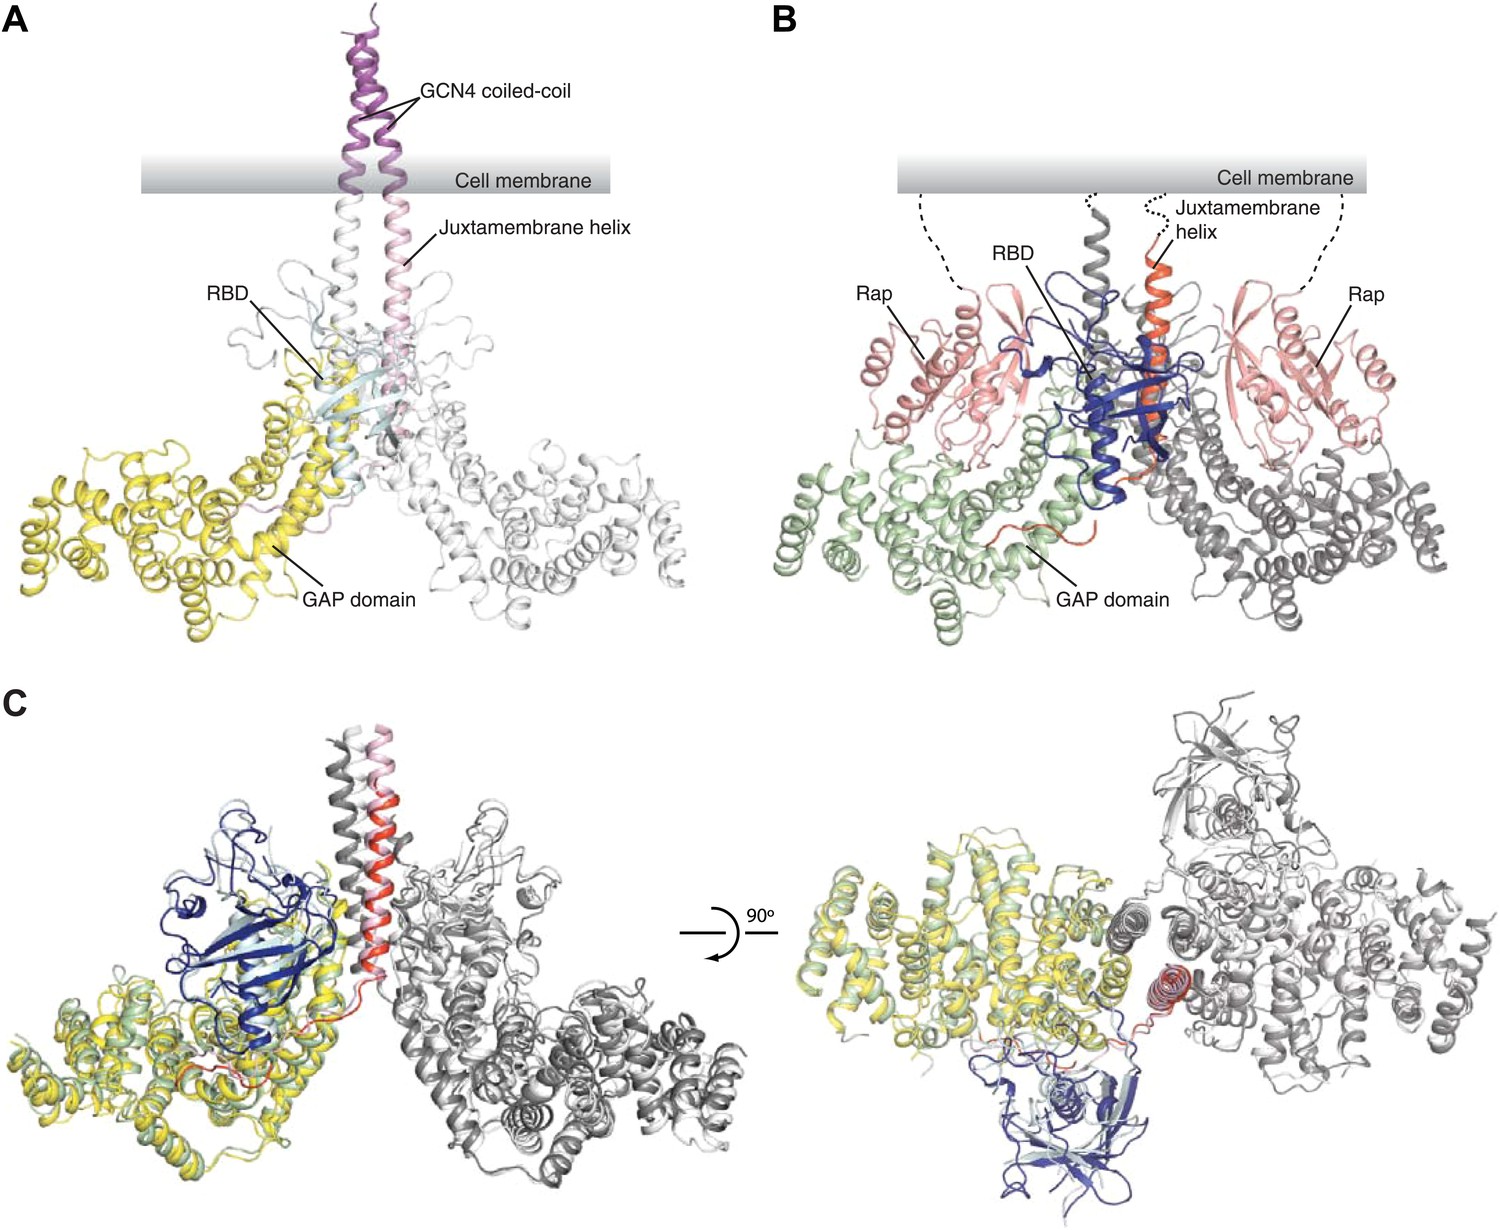
Overall structures of the zebrafish CC(a)PlexinC1cyto active dimer and the PlexinC1cyto/Rap1B complex.
(A) Structure of the CC(a)PlexinC1cyto dimer. (B) Structure of the PlexinC1cyto/Rap1B complex. One of the two active dimers of plexin with Rap1B bound in the asymmetric unit is shown. In both (A) and (B), domains from one plexin monomer in the dimer are colored and labeled. The other monomer is shown in white in (A) and gray in (B). (C) Comparison of the active dimers in the structures of CC(a)PlexinC1cyto and the PlexinC1cyto/Rap1B complex. The coiled-coil moiety is omitted for clarity. The color schemes are the same as in (A) and (B).
Figure 4
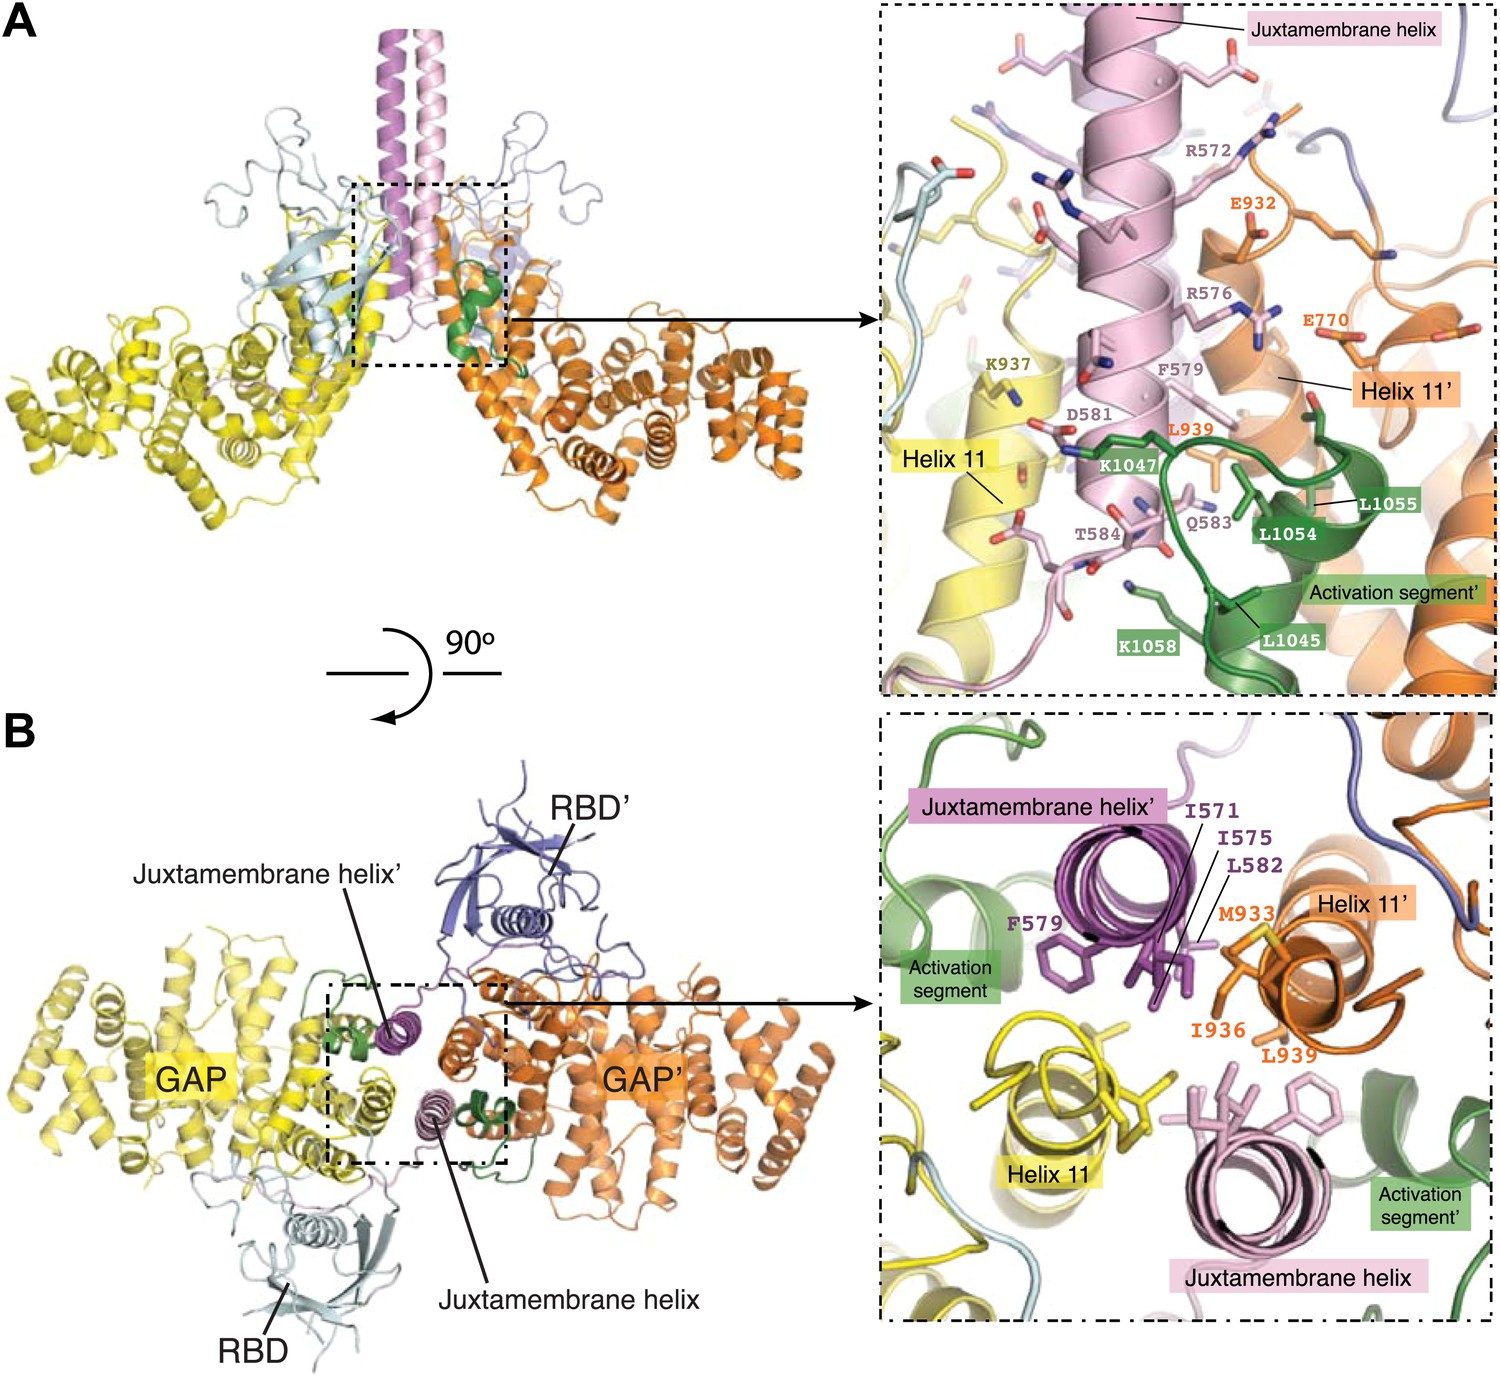
The dimer interface in the CC(a)PlexinC1cyto structure.
(A) Periphery of the dimer interface. The coiled-coil moiety is not shown. (B) Hydrophobic core of the dimer interface. Residue labels for one monomer are omitted for clarity.
Figure 5
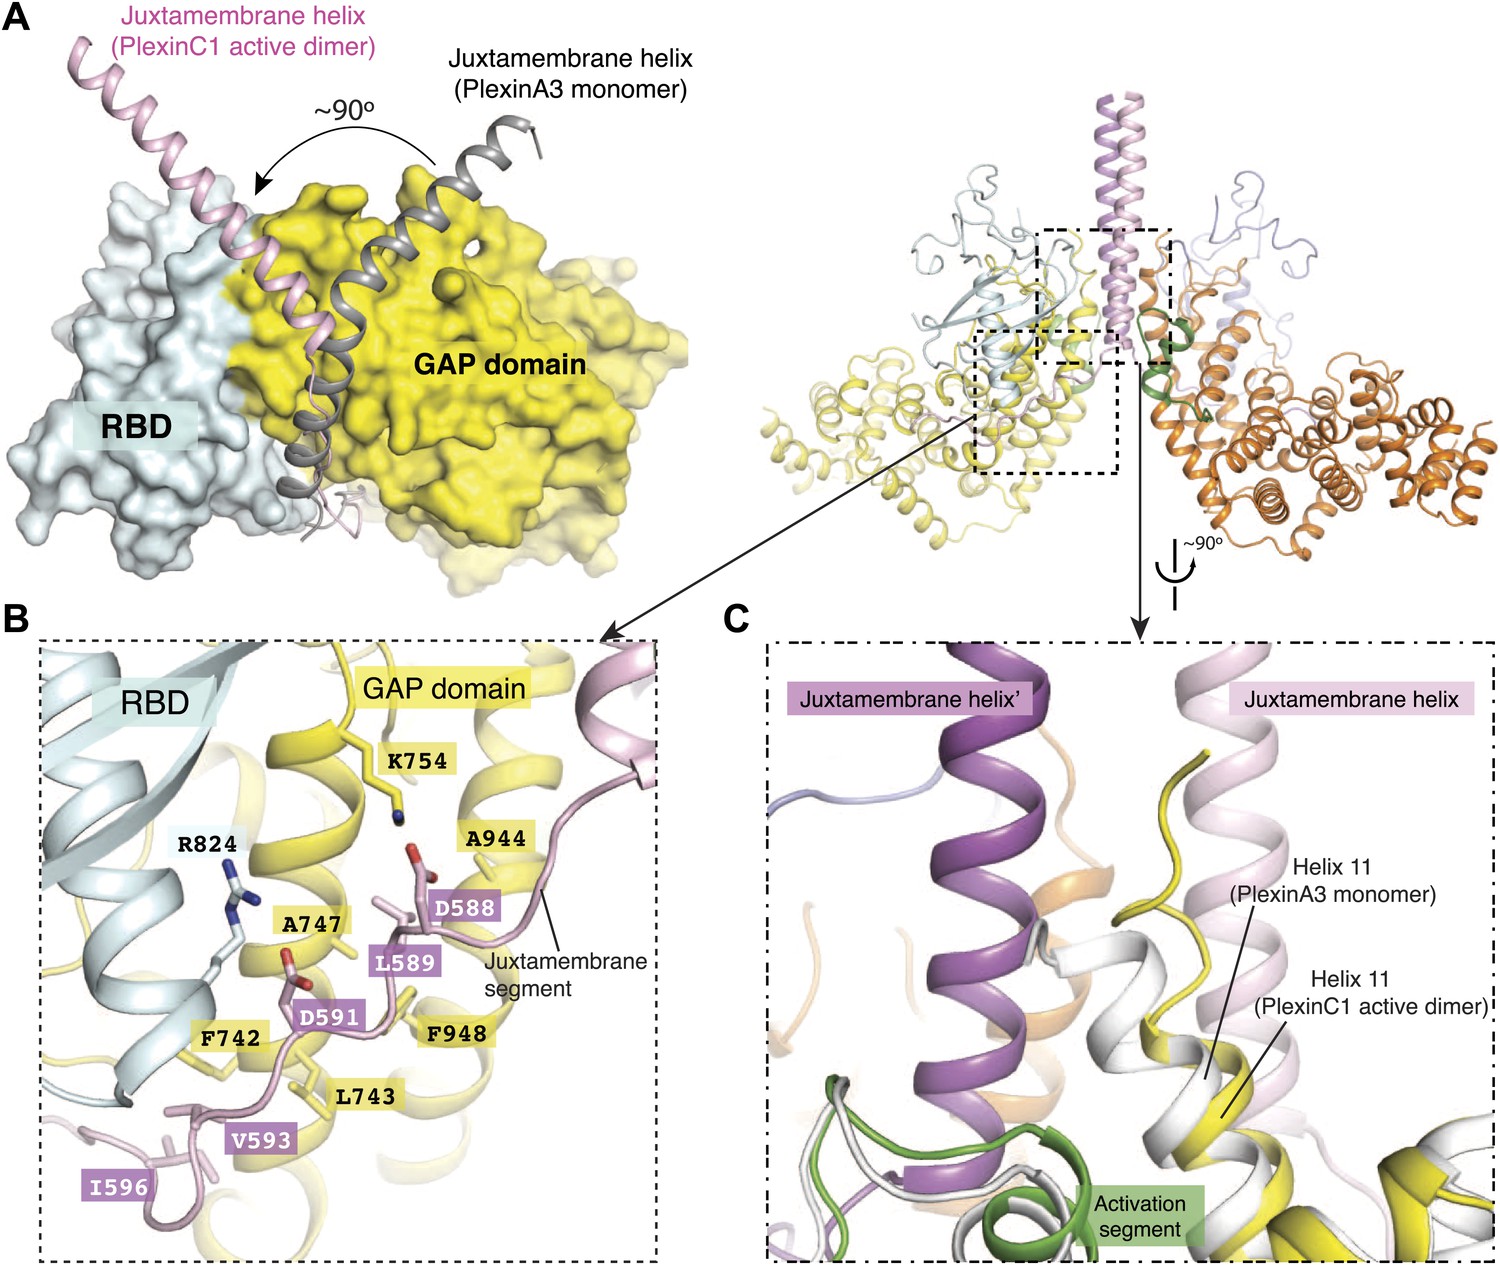
Dimerization-induced conformational changes of the juxtamembrane helix and helix 11.
(A) Conformational change of the juxtamembrane helix. One monomer in the PlexinC1cyto active dimer is superimposed onto the monomeric PlexinA3cyto structure (PDB code: 3IG3). The GAP domain and RBD of PlexinA3cyto are shown in the surface representation. (B) Intra-molecular interactions made by the extended portion of the juxtamembrane segment in the CC(a)PlexinC1cyto structure. (C) Conformational change of helix 11. The structure superimposition is the same as in (A).
Figure 6
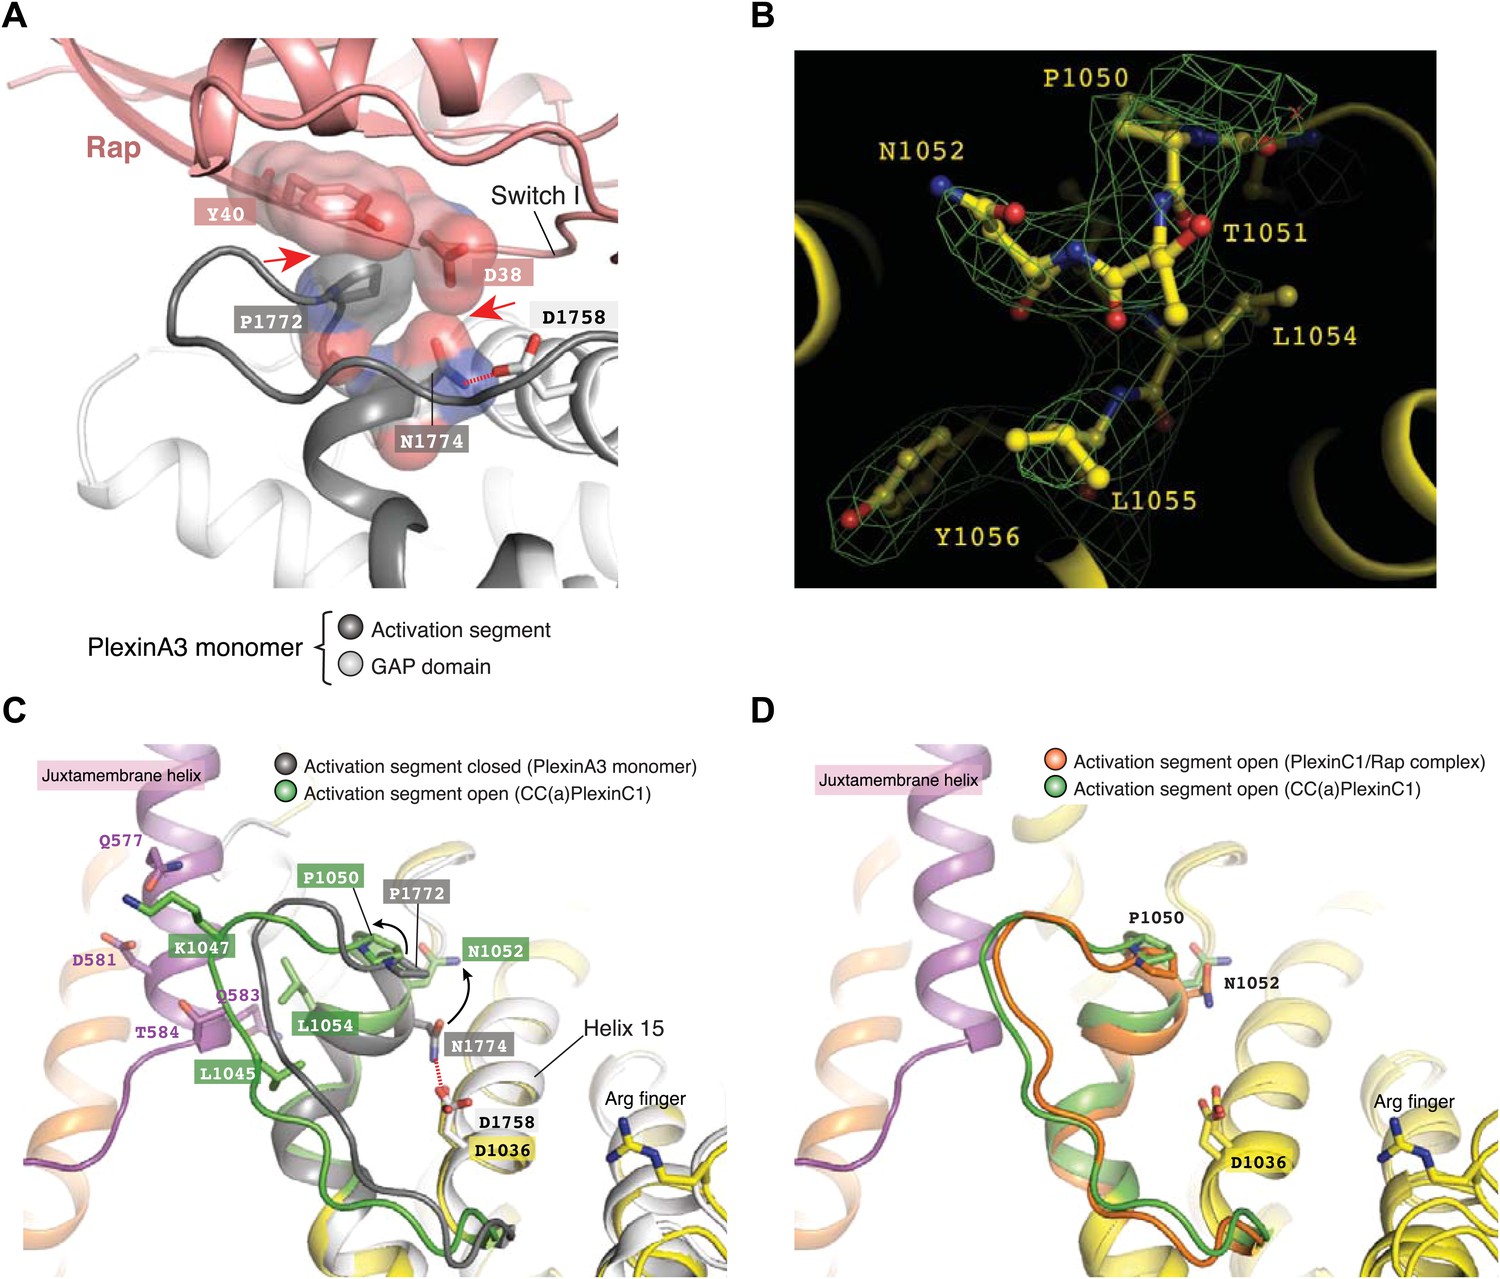
Dimerization-induced opening of the activation segment.
(A) Docking of Rap to the inactive PlexinA3cyto structure (PDB code: 3IG3). The docking is based on a superimposition between PlexinA3 and PlexinC1 in the PlexinC1/Rap complex structure (see ‘Materials and methods’ for details). Red dashed line: hydrogen bond. Red arrows: steric clashes and unfavorable interactions. (B) Sigma-A weighted simulated annealing omit map of the activation segment in CC(a)PlexinC1cyto. The map was calculated using the model with residues 1050–1056 in one of PlexinC1 molecules removed. The map was contoured at 3σ, with the final model shown. (C) Comparison of the activation segment in the structures of CC(a)PlexinC1cyto and PlexinA3cyto. Conformational differences important for GAP activation are highlighted by black arrows. (D) Comparison of the activation segment in the structures of CC(a)PlexinC1cyto and the PlexinC1cyto/Rap complex.
Figure 7
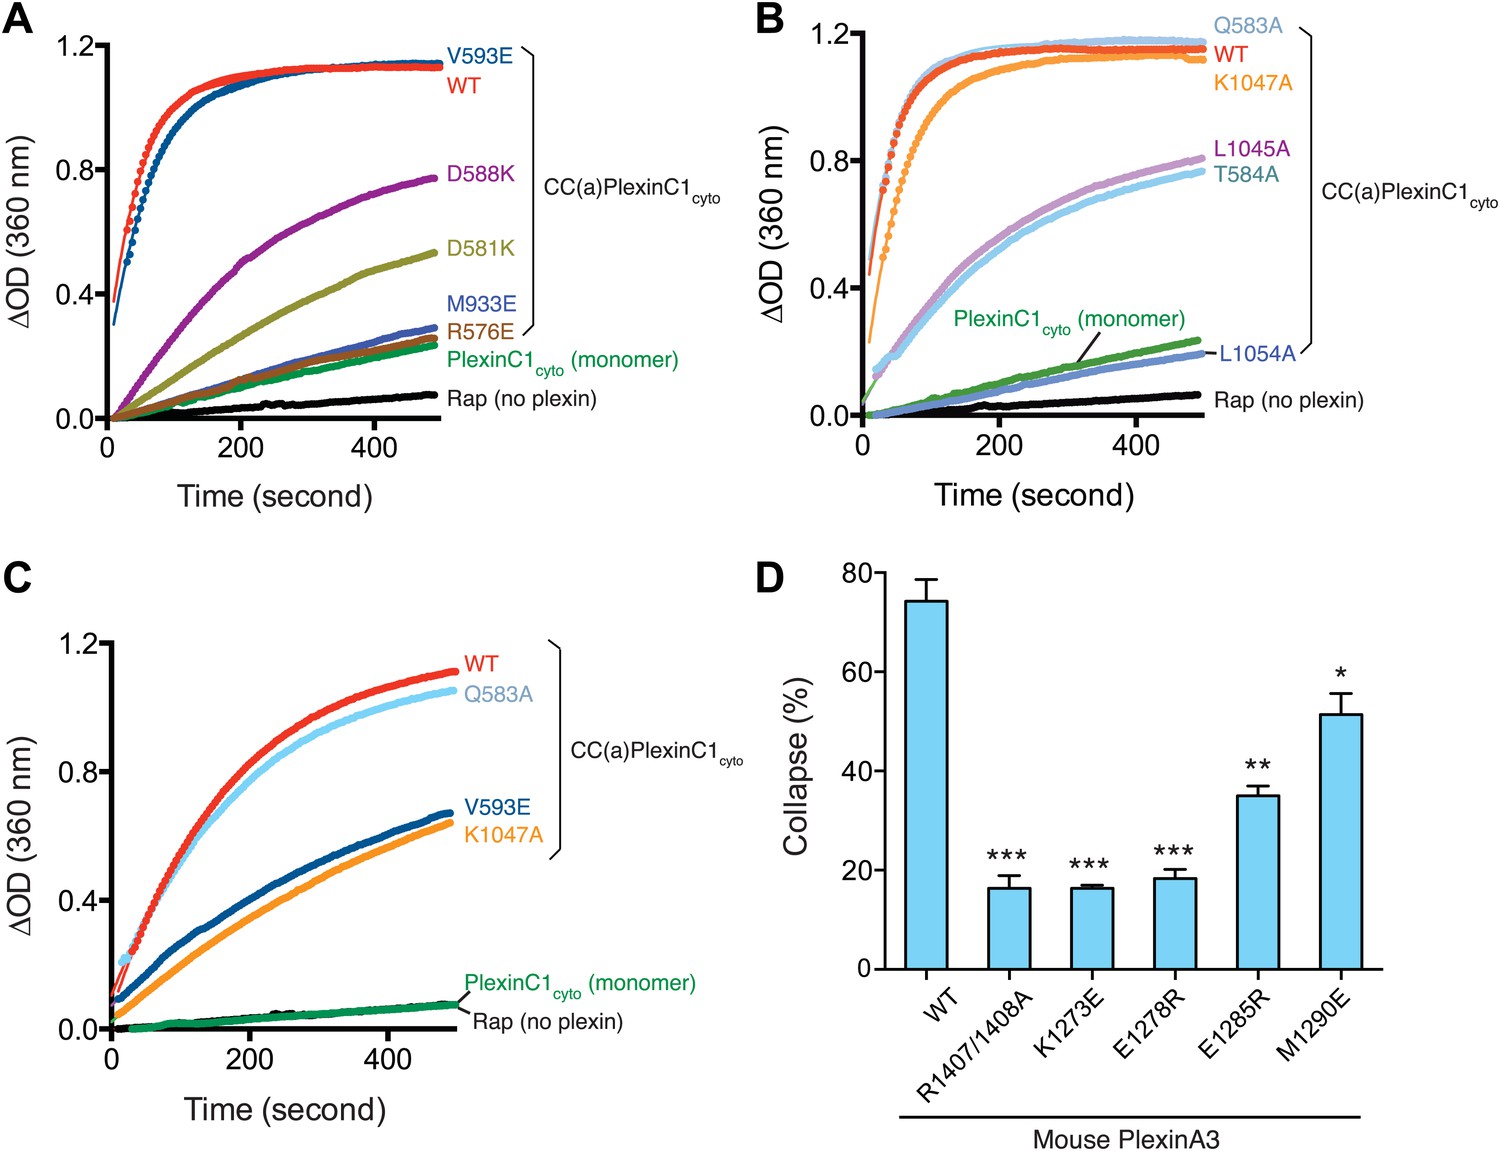
Mutational analyses of the dimerization-driven activation mechanism.
(A–C) Mutational analyses of the activation mechanism using the GAP activity assay. Residues mutated in (A) are involved in stabilizing the active dimer, whereas residues in (B) couple the dimer formation to the opening of the activation segment. In (A) and (B) the concentration of plexin is 2 µM. In (C), the concentration of plexin is 0.25 µM. The Rap concentration is 120 µM for all the assays. Data shown are representative of three replicates. (D) Mutational analyses using the COS7 cell collapse assay. The results for the wild type and the arginine-finger mutant (R1407/1408A) are shown as positive and negative controls, respectively. Error bars represent standard error of the mean from three independent experiments. At least 150 cells were counted for each sample in each experiment. Statistical significance between wild type and each mutant is determined by two-tailed Student’s t-test (*p<0.05; **p<0.01; ***p<0.001).
Figure 8
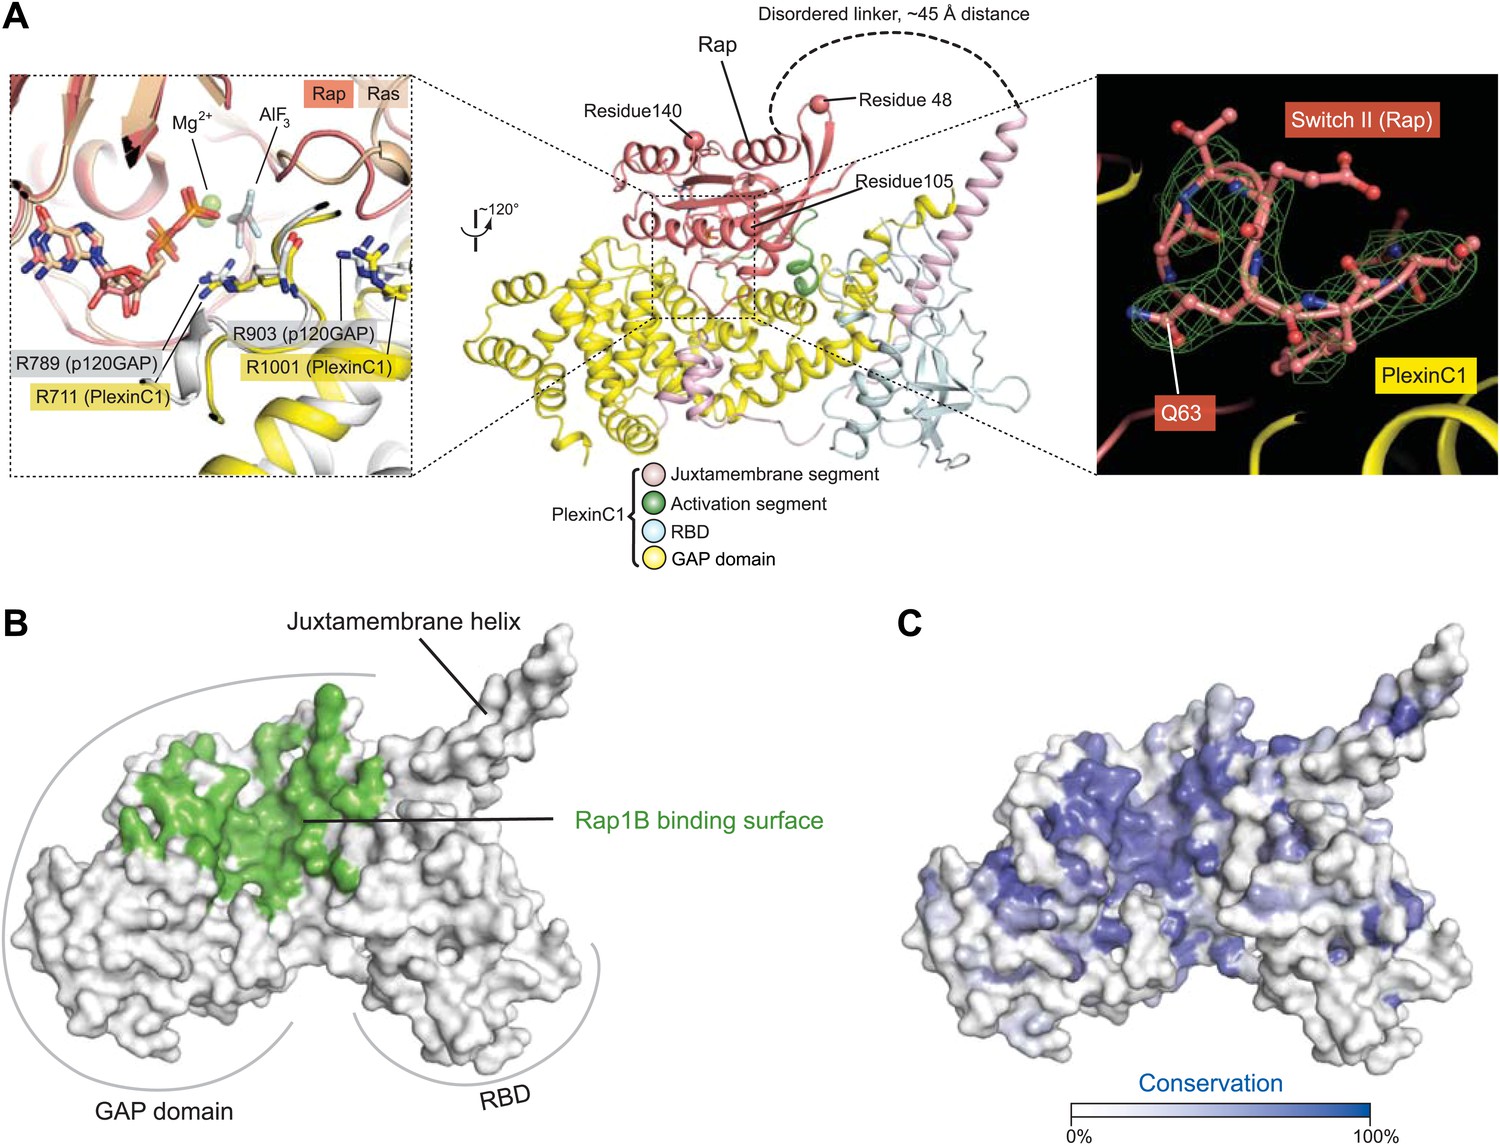
Overall view of the interface between zebrafish PlexinC1cyto and human Rap1B in the complex structure.
(A) The PlexinC1cyto/Rap interface and its comparison with that in the p120GAP/Ras complex structure. The middle panel shows the overall structure of the PlexinC1cyto/Rap complex, with the three residues (48, 105 and 140) different between human and zebrafish Rap1B highlighted. The left panel shows a superimposition of the active sites in the PlexinC1cyto/Rap1B and p120GAP/Ras (PDB ID: 1WQ1) structures. The superimposition is based on Rap1B and Ras. The right panel shows a Sigma-A weighted simulated annealing omit map of Switch II in Rap, calculated using the model with residues 60–66 in one of the Rap1B molecules removed. The map is contoured at 3σ, with the final model of the structure shown. (B) Rap-binding surface on PlexinC1cyto. Residues in PlexinC1 within 4 Å distance of the bound Rap1B molecule are colored green. (C) Sequence conservation projection on the molecular surface of PlexinC1cyto. The conservation scores were calculated based on an alignment of zebrafish PlexinC1 and all the plexins from mouse (Plexin A1, A2, A3, A4, B1, B2, B3, C1 and D1).
Figure 9
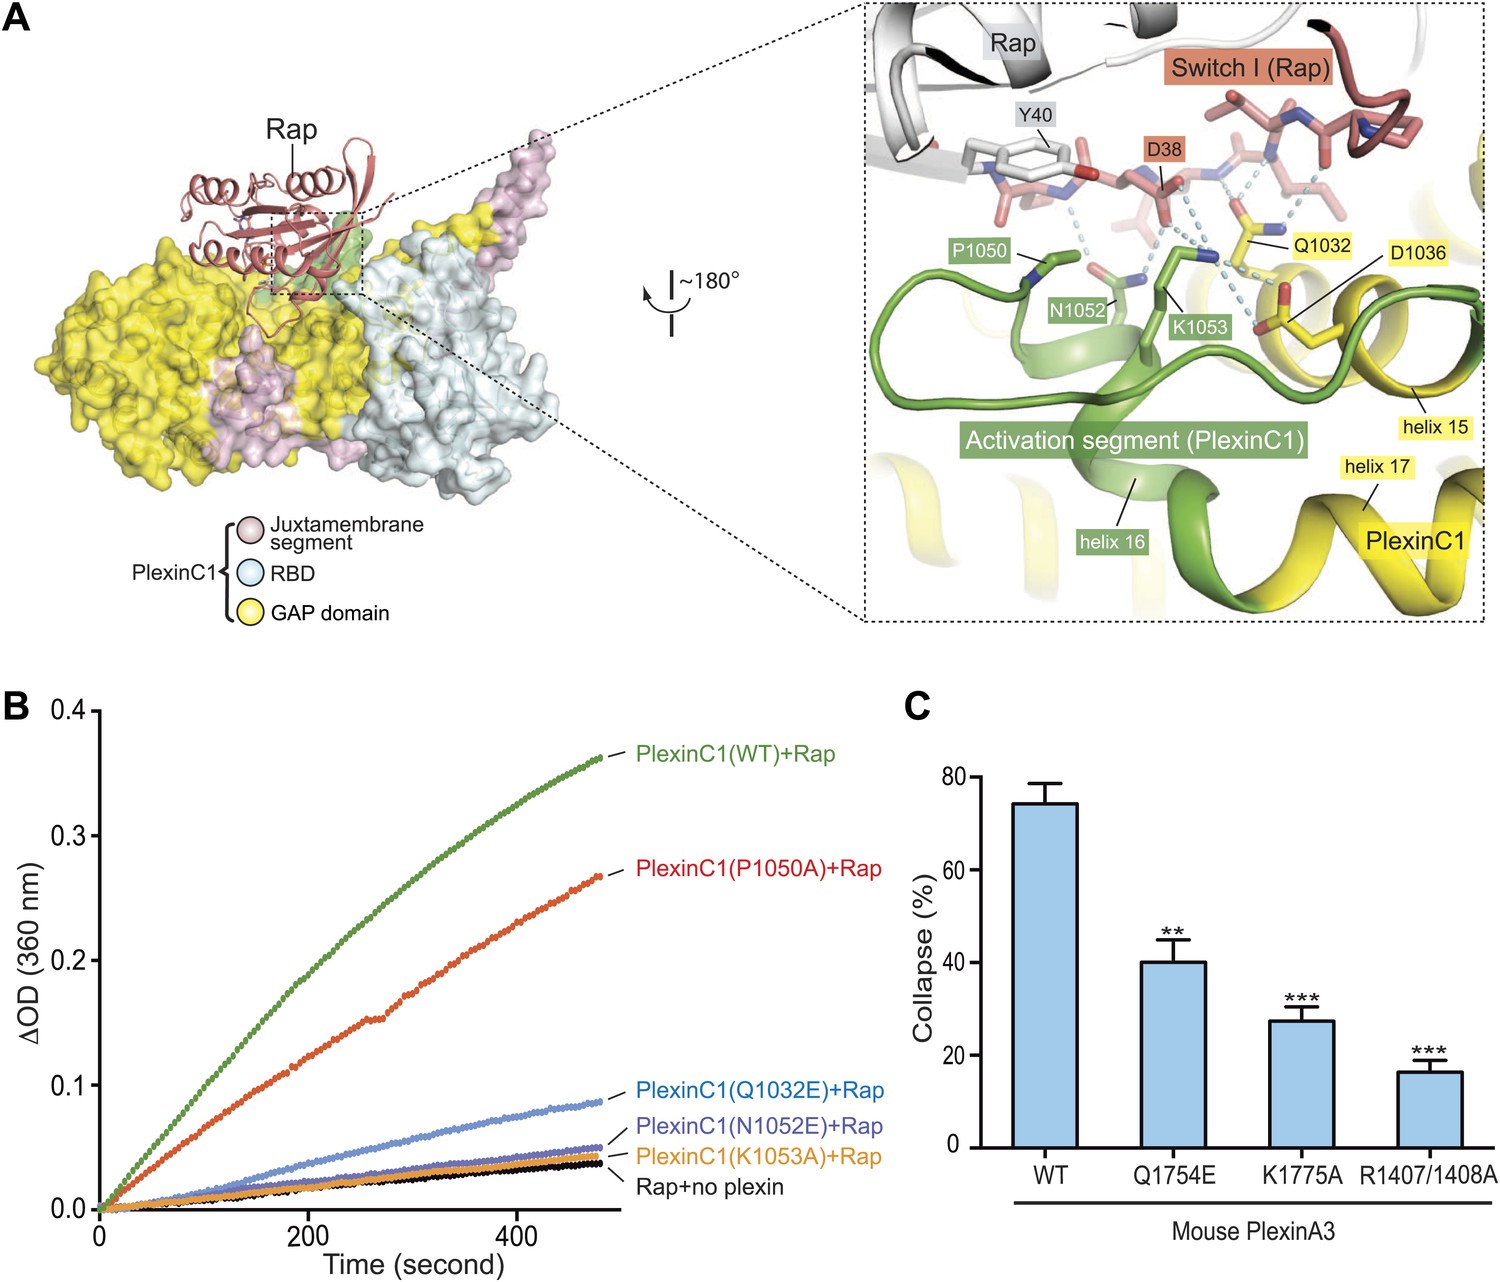
Interaction between the activation segment in PlexinC1 and Switch I in Rap.
(A) Interface between the activation segment and Switch I. Polar interactions and potential hydrogen bonds are indicated by dashed lines. (B) GAP activity assays for mutations at the activation segment/Switch I interface. Monomeric PlexinC1cyto was used in these assays. The plots are representatives of three replicates. (C) COS7 cell collapse assays for mutations at the activation segment/Switch I interface. Q1754E, and K1775A of mouse PlexinA3 correspond to Q1032E and K1053A of zebrafish PlexinC1, respectively. The data analysis and presentation are the same as in Figure 7D.
Figure 10

The Gln63-in conformation of Switch II in the PlexinC1cyto/Rap1B complex.
(A) Sequence alignment of human Rap1B, R-Ras, M-Ras and Ras. Black circles denote residues in Rap1B that are involved in binding PlexinC1cyto. Gln63 in Rap1B and Gln61 in Ras are highlighted by blue arrows. (B) Comparison of Switch II in the PlexinC1/Rap and the p120GAP/Ras (PDB ID: 1WQ1) complexes. The nucleophilic H2O is not included in the PlexinC1cyto/Rap1B structure due to low resolution of the density map. (C) Comparison of Switch II in the PlexinC1/Rap and the RapGAP/Rap (PDB ID: 3BRW) complexes. (D) Specific interactions between PlexinC1 and Switch II in Rap1B. Polar interactions and potential hydrogen bonds are indicated by dashed lines. (E) Interaction between Pro611 in PlexinC1 and Thr65 in Rap1B. (F) GAP activity assays for mutations at the plexin/Switch II interface. Monomeric PlexinC1cyto was used in these assays. The plots are representatives of three replicates. (G) COS7 cell collapse assays for mutations at the plexin/Switch II interface. The data analysis and presentation are the same as in Figure 7D.
Figure 11
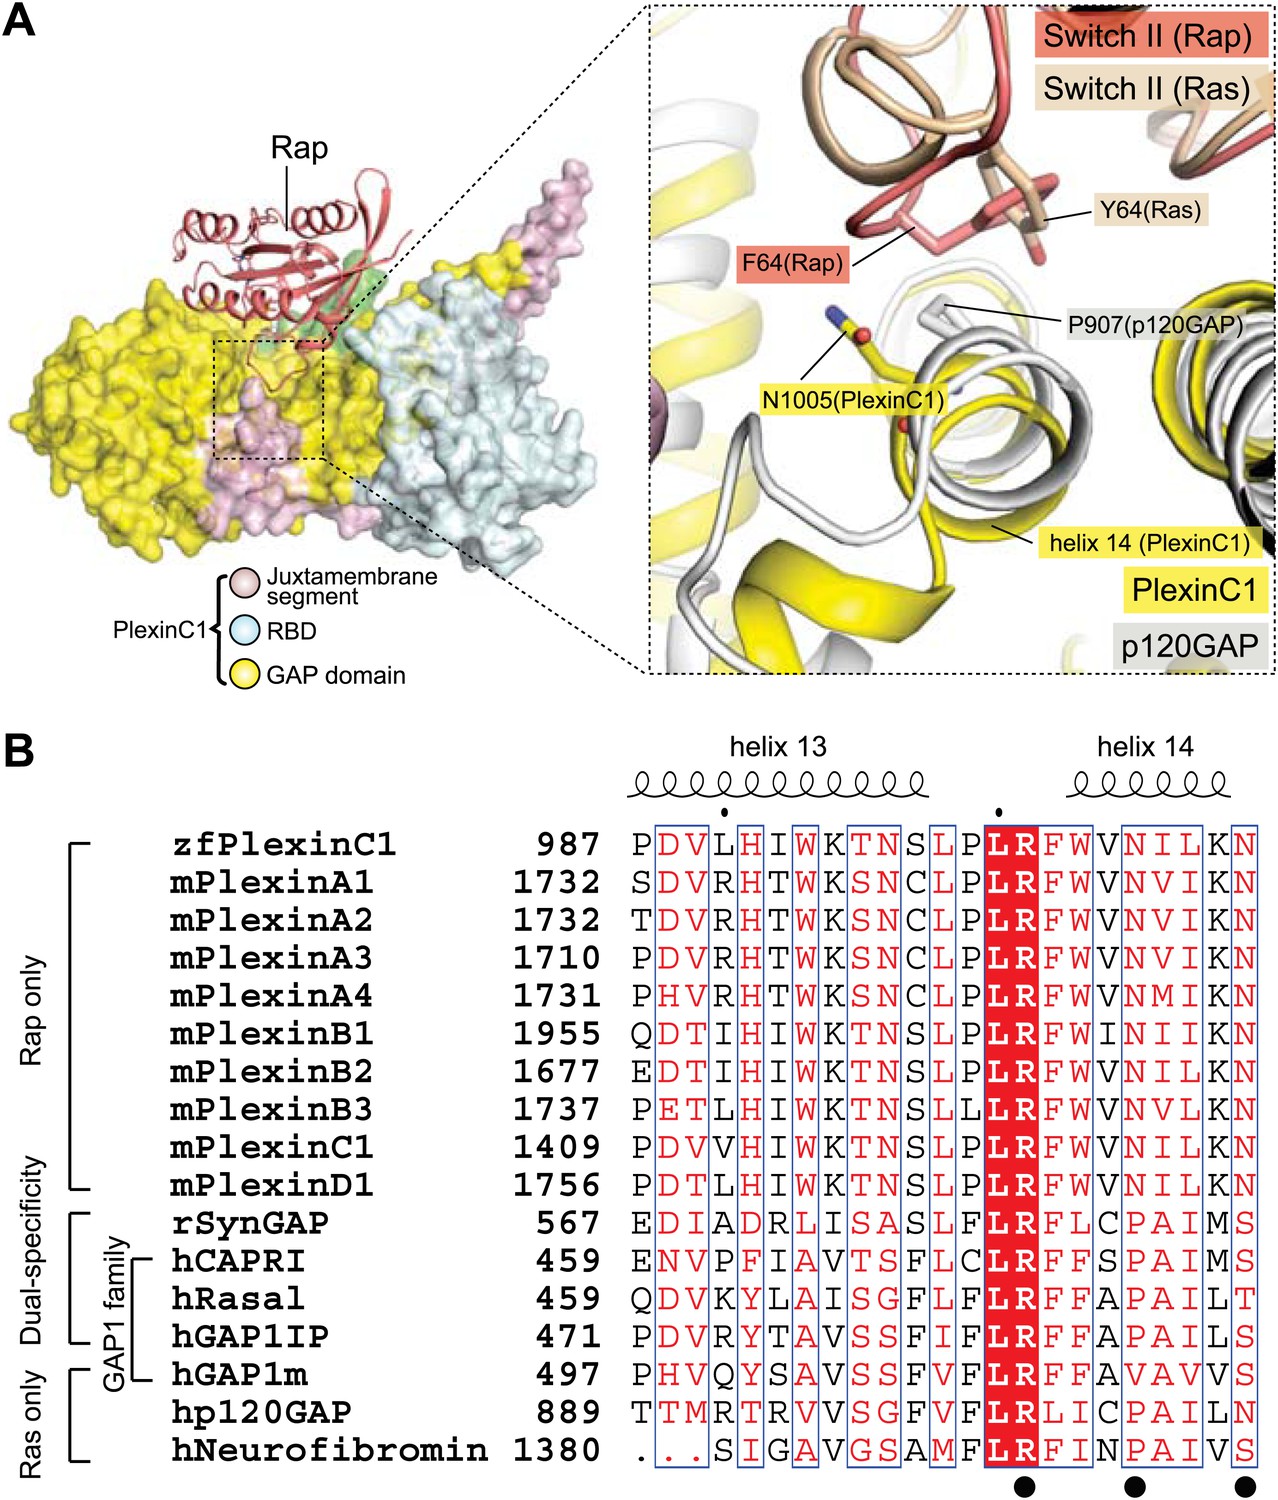
Comparison of the Switch II-interacting region between plexin, RasGAPs and dual-specific GAPs.
(A) Packing interactions made by Phe64 in Rap1B with PlexinC1 and Tyr64 in Ras with p120GAP. The PlexinC1ctyo/Rap1B and the p120GAP/Ras structures are superimposed by using Rap1B and Ras as references. (B) Sequence alignment of the major Switch II-interacting segment in plexins, RasGAPs and dual-specificity GAPs. The black circles highlight the three residues (Arg1001, Asn1005 and Asn1009) in zebrafish PlexinC1 that make critical interactions with Switch II of Rap. zf: zebrafish; m: mouse; h: human; r: rat.
Figure 12
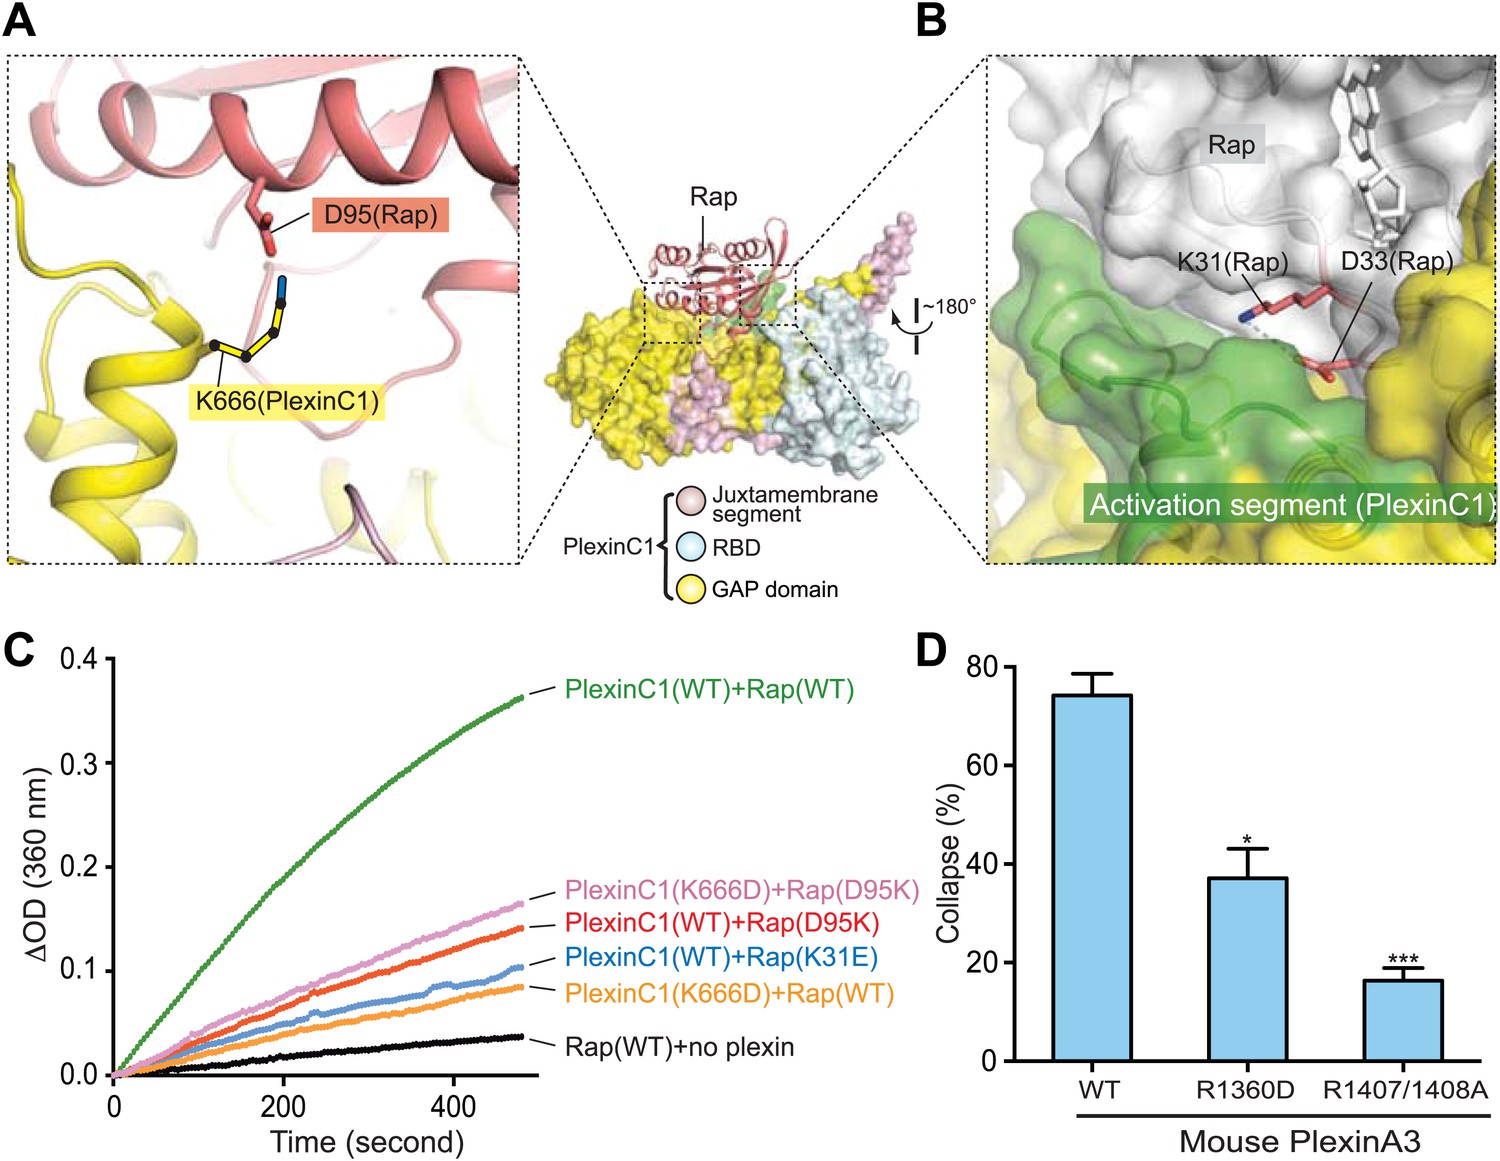
Additional specificity determinants in the PlexinC1/Rap1B complex.
(A) Potential interaction between Lys666 in PlexinC1 and Asp95 in Rap. The side chain of Lys666 in PlexinC1 is not built in the final model due to weak electron density. It is modeled to show its potential interaction with Asp95 in Rap. (B) Burial of Lys31 in Rap1B at the PlexinC1/Rap1B interface. (C) GAP activity assays for the specificity determinants. Monomeric PlexinC1cyto was used in these assays. The plots are representatives of three replicates. (D) COS7 cell collapse assays for the R1360D mutant of mouse PlexinA3 (equivalent to K666D of zebrafish PlexinC1). The data analysis and presentation are the same as in Figure 7D.
Figure 13
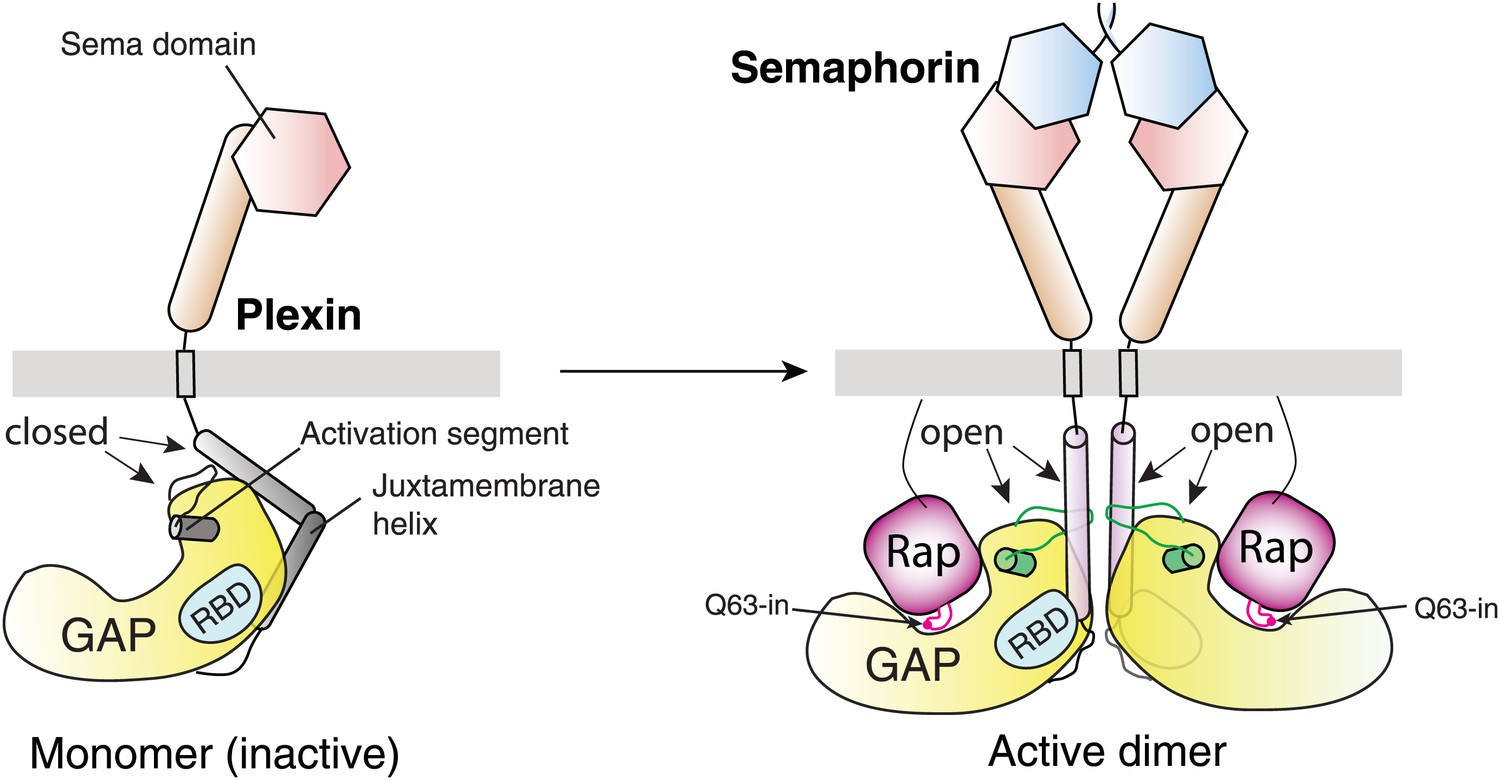
Schematic model for the activation of the plexin RapGAP by semaphorin-induced dimerization.
https://doi.org/10.7554/eLife.01279.016Videos
Video 1
Dimerization-induced activation of plexincyto and binding of Rap to the GAP active site.
The video is based on the crystal structures of inactive monomeric PlexinA3cyto (PDB ID: 3IG3), CC(a)PlexinC1cyto and the PlexinC1cyto/Rap1B complex. It is rendered for illustrating the dimerization-induced structural rearrangements and the binding mode between plexin and Rap. The actual order of the events and conformational transition trajectories likely do not follow those in the video.
Tables
Table 1
Data collection and refinement statistics
| Data collection | ||
| Crystal | CC(a)PlexinC1cyto | PlexinC1cyto/Rap1B |
| Space group | P212121 | P1 |
| Cell dimensions | ||
| a, b, c (Å) | 53.22, 146.10, 209.58 | 76.28, 84.73, 138.75 |
| α, β, γ (°) | 90, 90, 90 | 91.09, 95.15, 90.32 |
| Resolution (Å) | 50.0–3.30(3.36–3.30)* | 50.0–3.30(3.36–3.30)* |
| Rsym | 11.1(86.8) | 5.2(48.7) |
| I/σ | 19.7(1.4) | 18.6(1.6) |
| Completeness (%) | 95.8(79.5) | 91.0(89.2) |
| Redundancy | 10.4(4.3) | 1.9(1.9) |
| Refinement | ||
| Resolution (Å) | 3.30 | 3.30 |
| No. reflections | 21,087 | 47,207 |
| Completeness(%) | 83.32† | 90.23 |
| Rwork/Rfree (%) | 22.6/28.2 | 24.3/30.0 |
| No. atoms | 8888 | 22,228 |
| Protein | 8871 | 22,086 |
| Ligand/ion | 0 | 132 |
| Water | 17 | 10 |
| B-factors | ||
| Protein | 98.9 | 143.5 |
| Ligand/ion | – | 128.2 |
| Water | 49.3 | 89.7 |
| R.m.s deviations | ||
| Bond lengths (Å) | 0.005 | 0.004 |
| Bond angles (°) | 0.85 | 0.70 |
| Ramanchandran plot | ||
| Favored (%) | 91.7 | 93.1 |
| Allowed (%) | 8.1 | 6.7 |
| Disallowed (%) | 0.2 | 0.2 |
-
*
Highest resolution shell is shown in parenthesis.
-
†
The data were corrected for anisotropy in HKL2000. This treatment eliminated many weak reflections and reduced the completeness of the data used for refinement compared to the completeness reported for data collection.
Table 2
Protein concentrations and fitting methods used for determining kcat/KM of plexins
| Plexin construct | Plexin concentration* (µM) | Rap-GTP concentrations (µM) | Data fitting method† |
|---|---|---|---|
| CC(a)PlexinA1cyto | 1.0 | 50.0, 75.0, 100.0, 150.0 | Single-exponential |
| CC(b)PlexinA1cyto | 5.0 | 50.0, 75.0, 100.0, 150.0 | Linear |
| CC(c)PlexinA1cyto | 5.0 | 50.0, 75.0, 100.0, 150.0 | Linear |
| CC(d)PlexinA1cyto | 1.0 | 50.0, 75.0, 100.0, 150.0 | Single-exponential |
| CC(e)PlexinA1cyto | 5.0 | 50.0, 75.0, 100.0, 150.0 | Single-exponential |
| CC(f)PlexinA1cyto | 5.0 | 50.0, 75.0, 100.0, 150.0 | Linear |
| CC(g)PlexinA1cyto | 1.0 | 50.0, 75.0, 100.0, 150.0 | Single-exponential |
| Monomer PlexinC1cyto | 2.0 | 25.0, 50.0, 75.0, 100.0, 150.0 | Linear |
| CC(a)PlexinC1cyto | 2.0 | 50.0, 75.0, 100.0, 150.0 | Single-exponential |
| CC(b)PlexinC1cyto | 2.0 | 25.0, 50.0, 75.0, 100.0, 150.0 | Linear |
| CC(d)PlexinC1cyto | 2.0 | 50.0, 75.0, 100.0, 150.0 | Single-exponential |
| CC(g)PlexinC1cyto | 2.0 | 25.0, 50.0, 75.0, 100.0, 150.0 | Linear |
-
*
The plexin concentrations were chosen in order for the reaction rates to be within the dynamic range of the assay.
-
†
Linear fitting: kcat/KM determined by fitting data to V0 = (kcat/KM) [E][S]; Single-exponential fitting: kcat/KM determined by fitting data to A(t) = (Amax − Amin) (1 − exp (−kt)) + Amin, in which k= kcat/KM[E] and was fitted as a global parameter.
Download links
A two-part list of links to download the article, or parts of the article, in various formats.
Downloads (link to download the article as PDF)
Open citations (links to open the citations from this article in various online reference manager services)
Cite this article (links to download the citations from this article in formats compatible with various reference manager tools)
Structural basis for activation and non-canonical catalysis of the Rap GTPase activating protein domain of plexin
eLife 2:e01279.
https://doi.org/10.7554/eLife.01279


