Deregulated FGF and homeotic gene expression underlies cerebellar vermis hypoplasia in CHARGE syndrome
- King’s College London, United Kingdom
- University of Groningen, Netherlands
- Montefiore Medical Center, United States
- Howard Hughes Medical Institute, New York University School of Medicine, United States
- University College London Institute of Child Health, United Kingdom
Figures
Figure 1
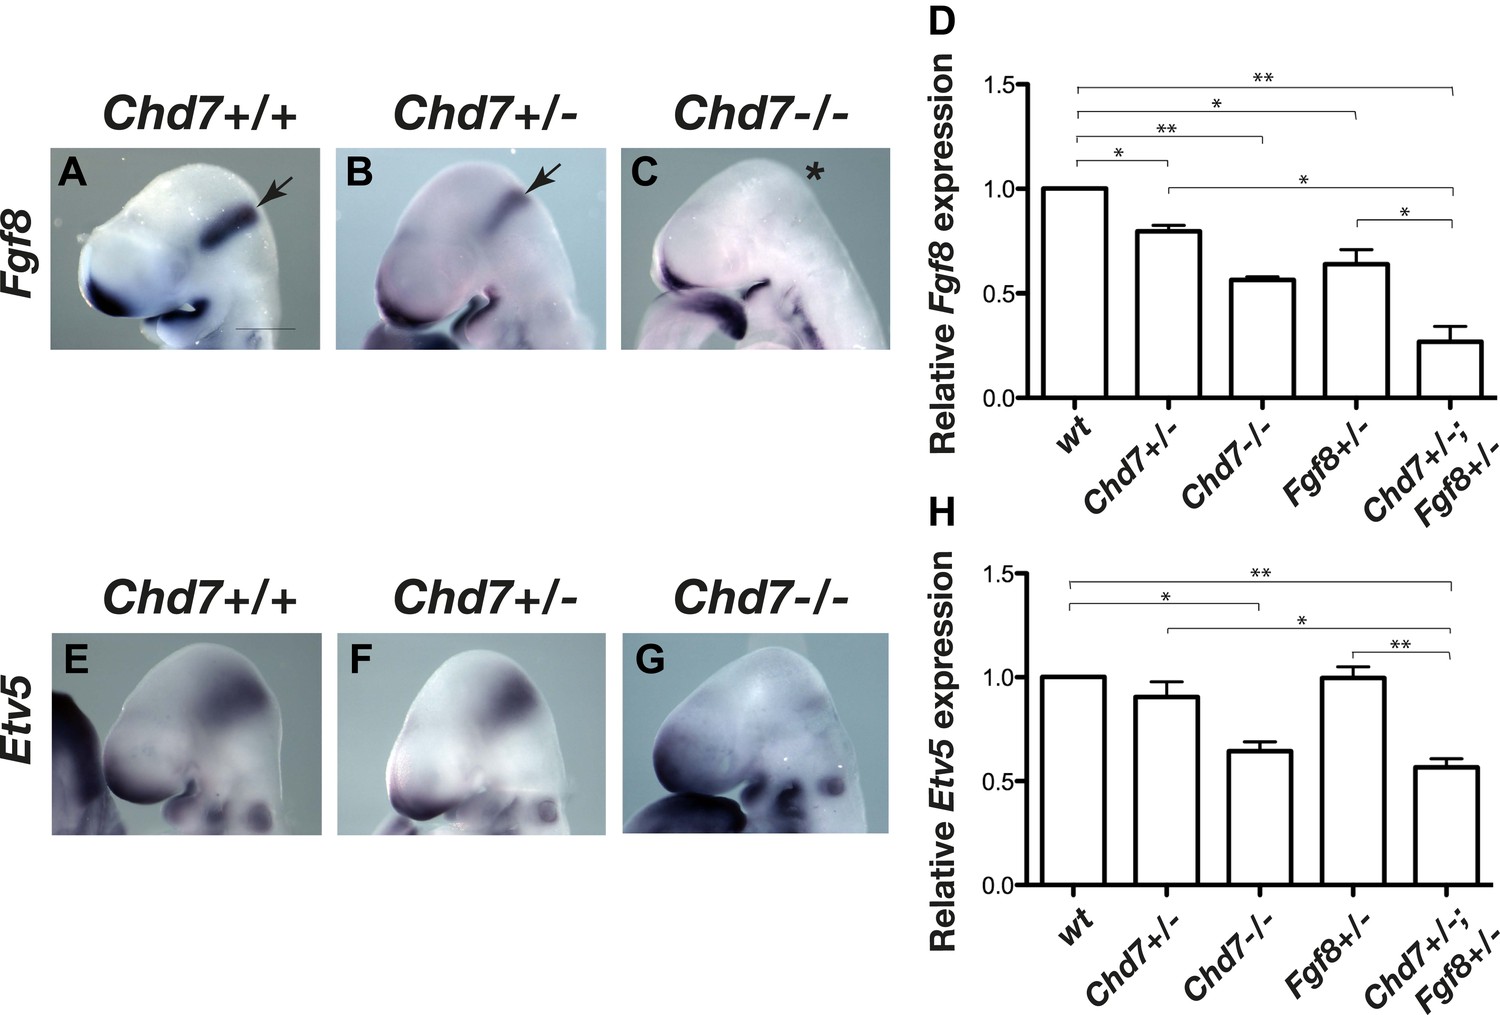
Reduced Fgf8 expression and FGF signalling during early cerebellar development in Chd7-deficient embryos.
(A–C) In situ hybridisation for Fgf8 at E9.5 shows a Chd7 gene dosage-dependent reduction in Fgf8 expression in the mid-hindbrain isthmus organiser (IsO, arrows). Scale bar = 0.5 mm. (D) Quantification of Fgf8 transcript levels in the mes/r1 region of E9.5 embryos. (E–G) Expression of the FGF-regulated gene Etv5 in E9.5 mouse embryos visualised by in situ hybridisation. (H) Quantification of Etv5 gene expression in mes/r1 tissue confirms the in situ hybridisation data and indicates a significant reduction in FGF signalling in Chd7+/−;Fgf8+/− and Chd7−/− embryos. Data represents mean ± standard error of the mean (SEM) from three individual samples for each genotype. *p<0.05, **p<0.001.
Figure 2
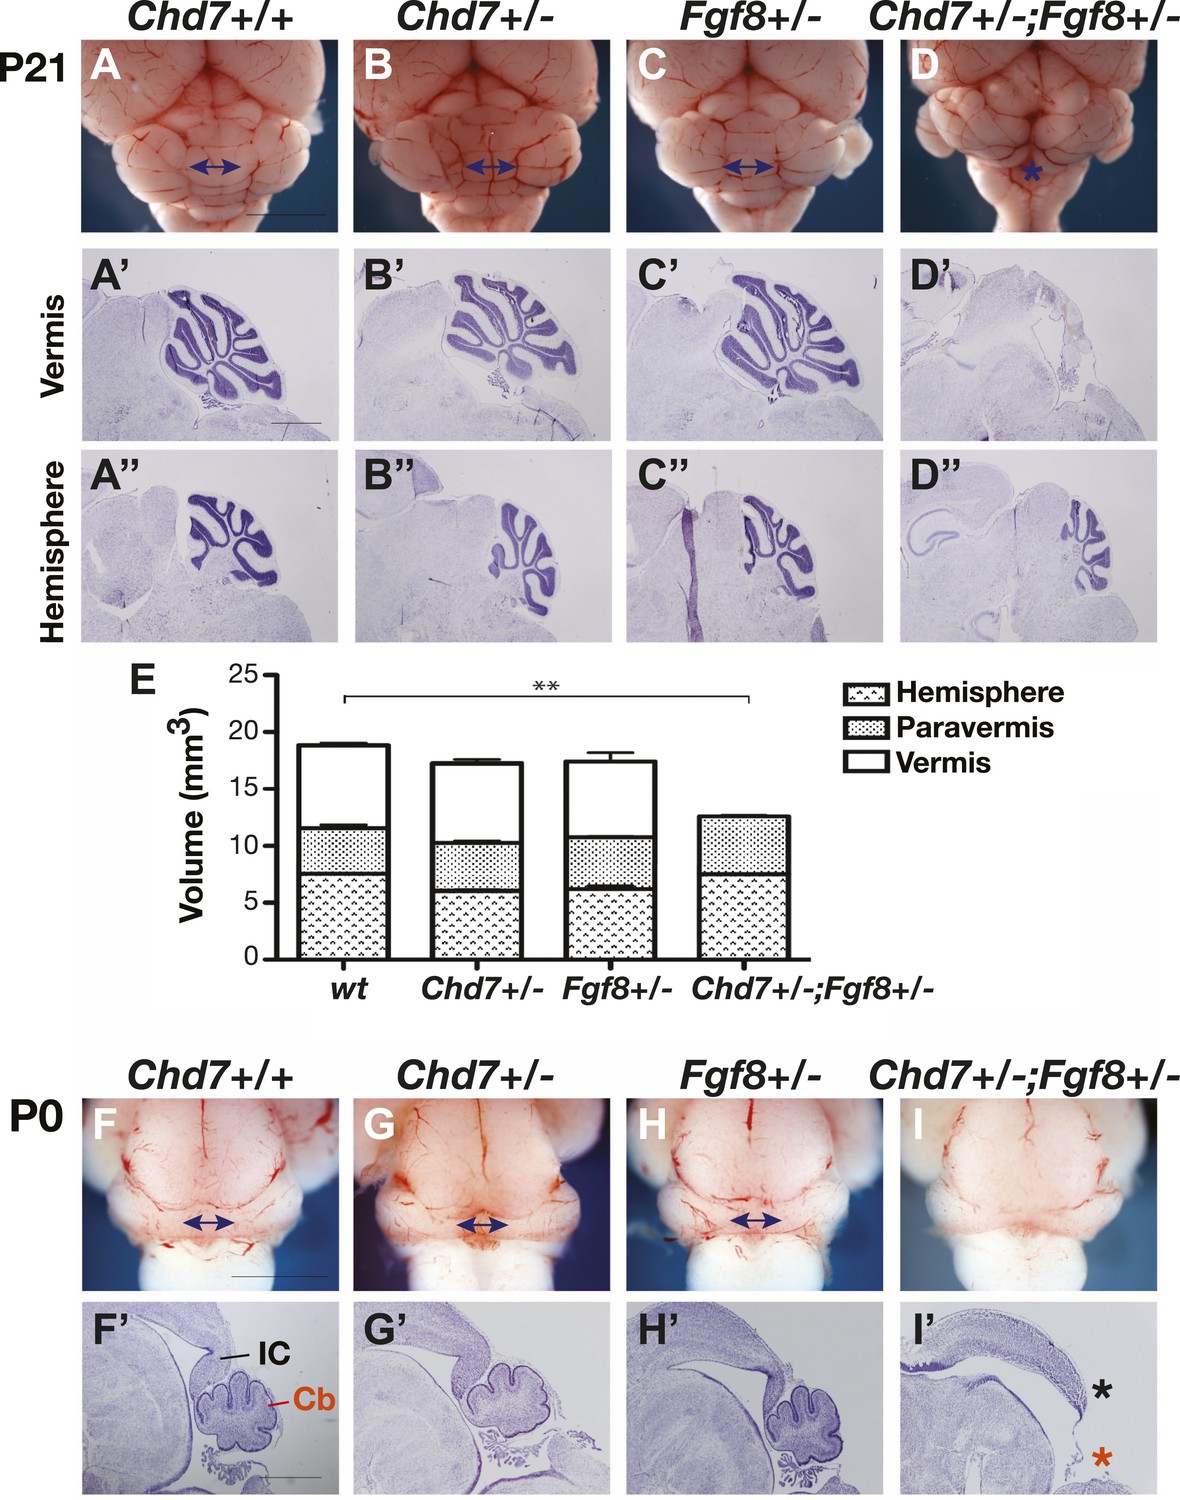
Chd7 and Fgf8 loss-of-function alleles interact to cause cerebellar vermis aplasia in the mouse.
(A–D) Wholemount views of the mouse cerebellum at P21. The cerebellar vermis is indicated by a double-headed arrow. Chd7+/− animals have normal cerebella, indistinguishable from wildtype and Fgf8+/− control littermates. Chd7+/−;Fgf8+/− animals exhibit vermis aplasia (asterisk in D). Scale bar = 5 mm. (A’-D’) Cresyl violet-stained sagittal sections through the cerebellar vermis. Note the absence of cerebellar vermis tissue in Chd7+/−;Fgf8+/− embryos (D’). (A”–D”) Sagittal sections through cerebellar hemispheres. (E) Measurements of cerebellar vermis, paravermis and hemisphere sizes in brains from the indicated genotypes. The data represents the mean of three samples with error bars indicating SEM. **p<0.001. (F–I) Wholemount views of cerebella at birth (P0), with vermis indicated by arrows. (F’–I’) Sagittal sections through P0 brains with inferior colliculus (IC) and cerebellum (Cb) indicated. Note the loss of cerebellar vermis (red asterisk) and abnormal IC (black asterisk) in Chd7+/−;Fgf8+/− animals (I’). Scale bar = 1 mm.
Figure 3
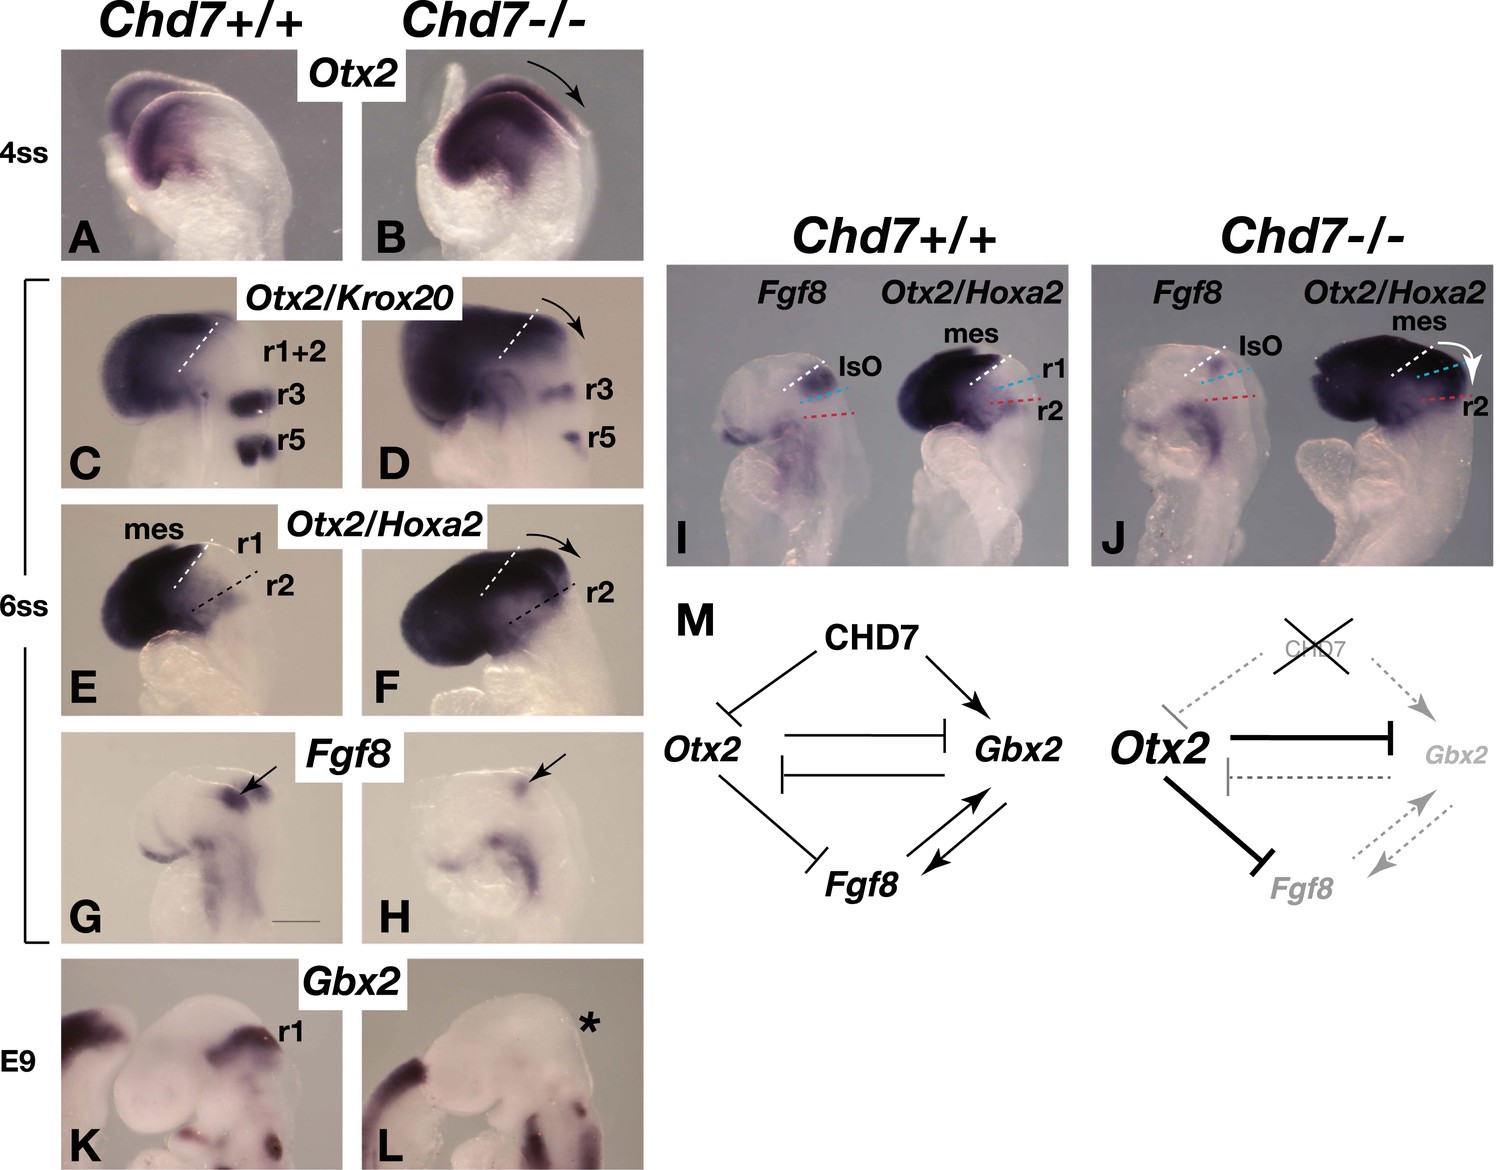
Chd7 loss results in Otx2 de-repression, loss of rhombomere 1 identity and reduced Fgf8 expression.
(A and B) In situ hybridisation for Otx2 in 4 somite stage (ss) embryos. Note the posterior expansion of Otx2 expression in the mutant embryo (arrow in B). (C and D) In situ hybridisation for Otx2 and Krox20 to mark the forebrain/mesencephalon and rhombomeres 3 and 5 (r3 and r5), respectively in 6 ss embryos. Note the posterior expansion of Otx2 (arrow) towards r3. (E and F) In situ hybridisation for Otx2 and Hoxa2, to mark the forebrain/mesencephalon and r2, respectively in 6 ss embryos. Note the posterior expansion of Otx2 (arrow) and apparent loss of the Otx2-Hoxa2-negative r1 in the Chd7−/− embryo. (G and H) Fgf8 in situ hybridisation on 6 ss embryos. Note the initiation of Fgf8 expression at the correct position in the mutant (H), despite posteriorised Otx2 expression. (I and J) Side-by-side comparison of Fgf8 and Otx2/Hoxa2 expression in 6 ss Chd7+/+ and Chd7−/− embryos. Note the posterior expansion of Otx2 expression (white arrow) and downregulated Fgf8 expression in the Chd7−/− embryos, compared to wildtype controls. Also note that Fgf8 expression is initiated at the correct position in the Chd7−/− embryo, with no evidence of a repositioning of the IsO in response to posterior expansion of Otx2 at this stage of development. (K and L) In situ hybridisation for Gbx2 suggesting the loss of r1 identity by E9. (M) Summary of regulatory interactions at the IsO in Chd7+/+ vs Chd7−/− embryos. The loss of Otx2 repression and Gbx2 maintenance by CHD7 are predicted to result in reduced Fgf8 expression in Chd7-deficient embryos. mes = mesencephalon, r1 = rhombomere 1, r2 = rhombomere 2, IsO = isthmus organiser.
Figure 4
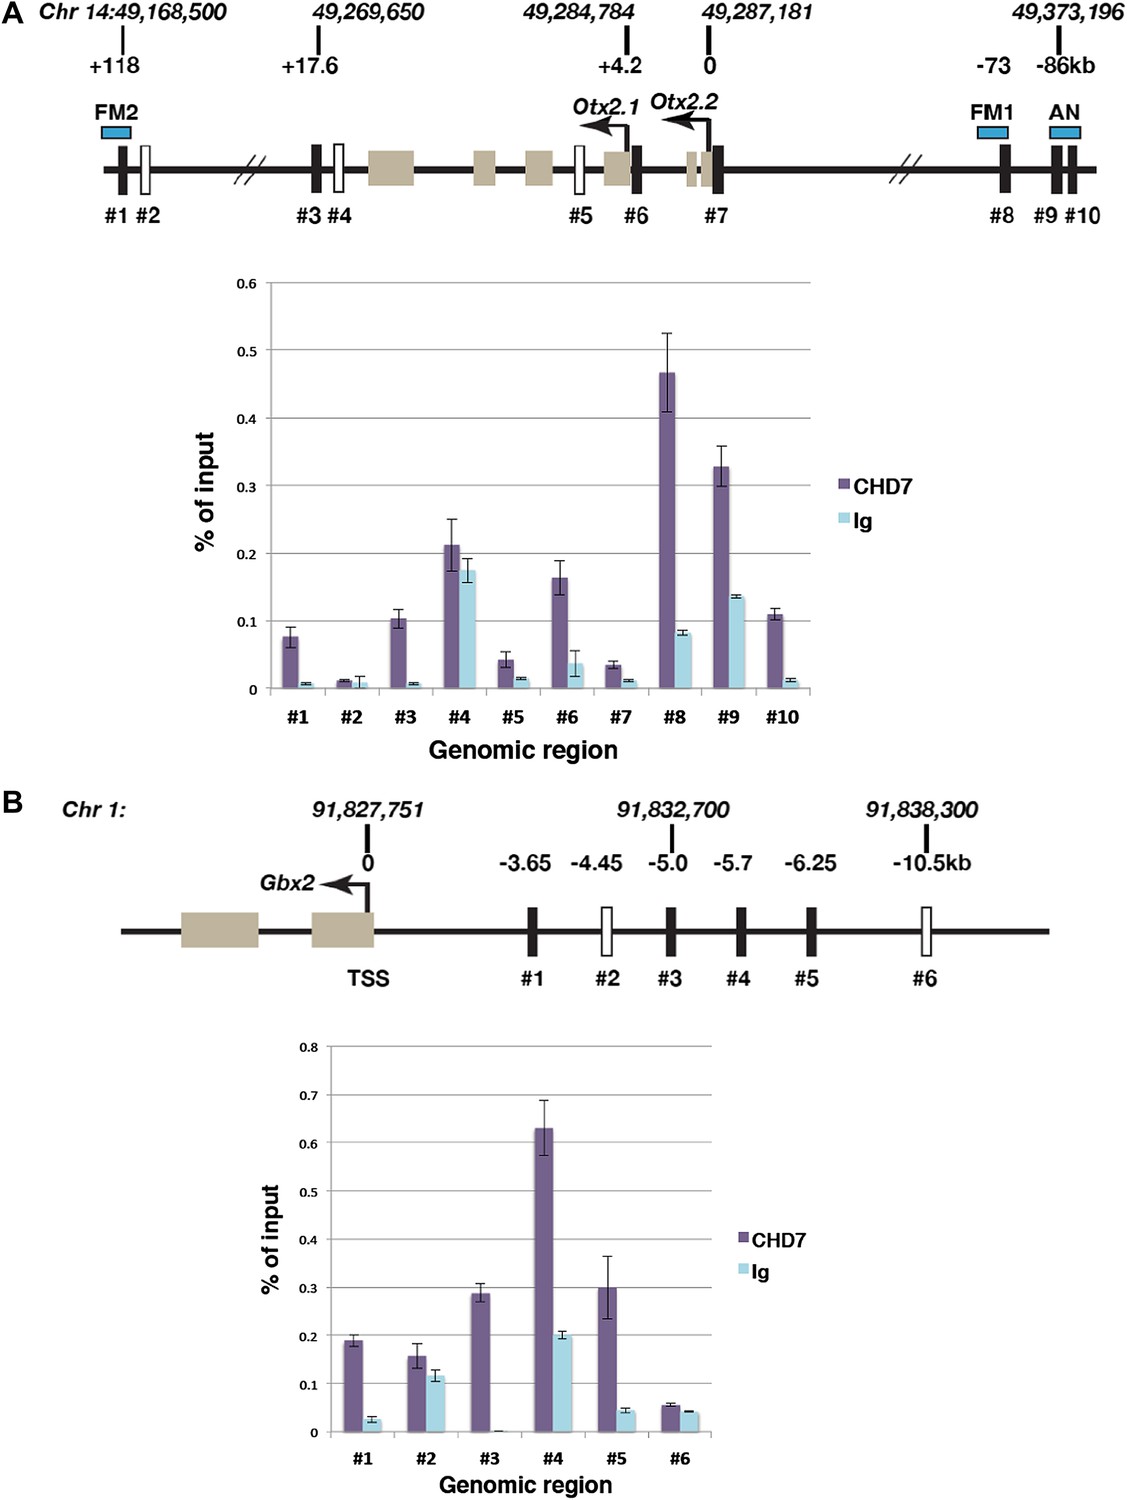
Association of CHD7 with Otx2 and Gbx2 regulatory regions in the mes/r1 region.
(A) Genomic map of the mouse Otx2 locus. The transcriptional start sites of Otx2.1 and Otx2.2 transcripts are indicated by arrows and exons by tan-coloured boxes. Positions on chromosome 14 indicated above the diagram are according to the mm9 genome assembly and numbers below the horizontal lines indicate approximate positions relative to the Otx2.2 transcriptional start site. Known Otx2 enhancer regions FM1, FM2 and AN are indicated by blue boxes (Kurokawa et al., 2004a, 2004b). The location of DNA fragments amplified by qPCR after ChIP are indicated by rectangular boxes numbered #1–#10. Open boxes indicate negative control regions. ChIP-qPCR data are presented in a graph, with % of input DNA on the Y-axis and amplified region on the X-axis. Results from ChIP reactions using a CHD7-specific antiserum are in magenta and control Ig in turquoise. Error bars indicate standard deviation from reactions performed in triplicate. (B) Genomic map of the mouse Gbx2 locus with the transcriptional start site (TSS) indicated by an arrow and exons by tan-coloured boxes. Positions on chromosome 1 indicated above the diagram are according to the mm9 genome assembly and numbers below the horizontal lines indicate approximate positions relative to the TSS. The location of DNA fragments amplified by qPCR after ChIP are indicated by rectangular boxes numbered #1–#6. Open boxes indicate negative control regions. ChIP-qPCR data are presented in a graph, with % of input DNA on the Y-axis and amplified region on the X-axis. Results from ChIP reactions using a CHD7-specific antiserum are in magenta and control Ig in turquoise. Error bars indicate standard deviation from reactions performed in triplicate.
Figure 5
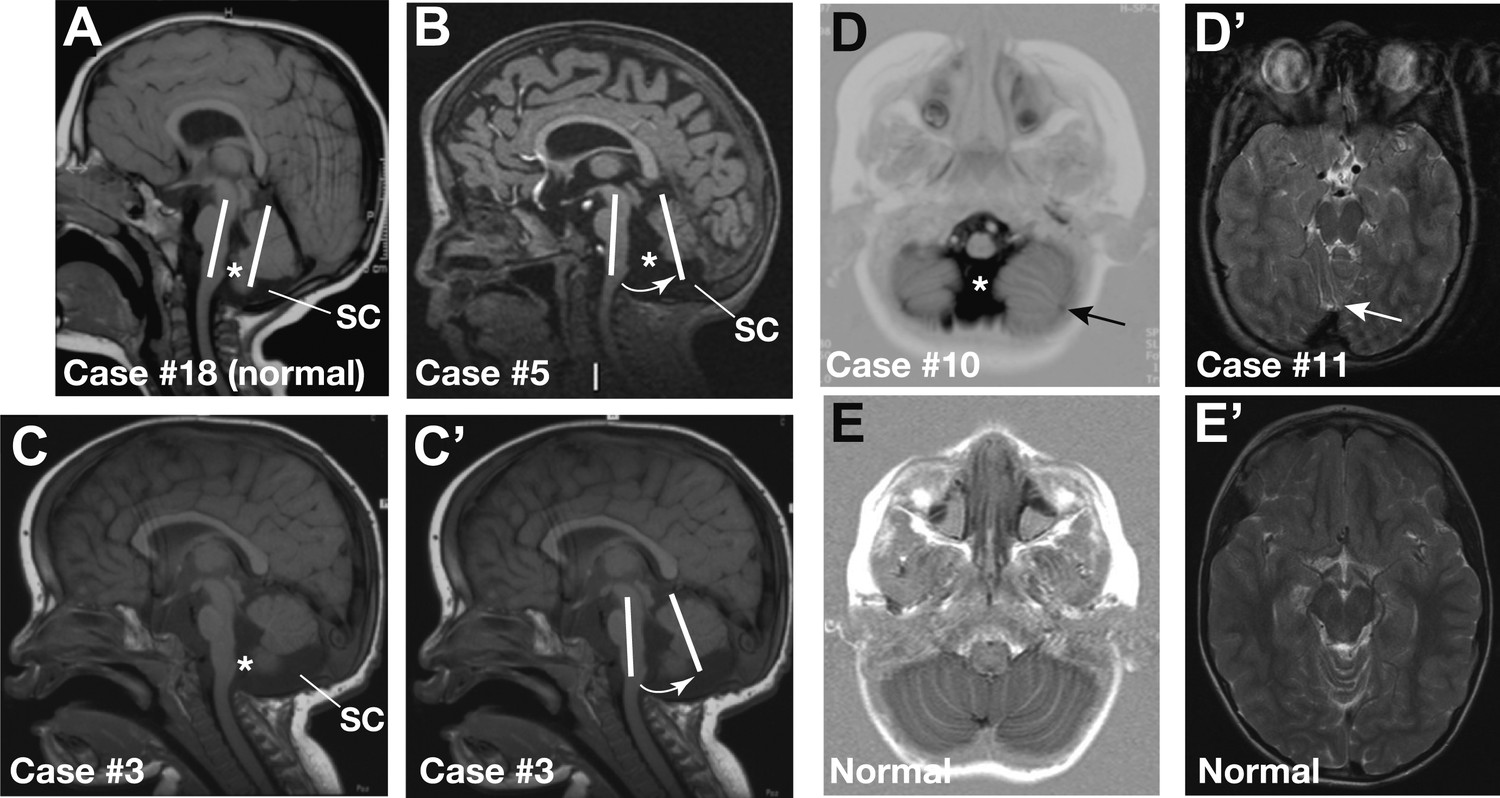
Representative sagittal MRI scans of CHARGE syndrome patients.
(A) Sagittal T1 scan of patient #18 showing a normal vermis with a normal position, foramen of Magendi (asterisk) and subcerebellar cistern (SC). The orientation of the cerebellum relative to the brainstem is indicated by two parallel white lines. (B) Sagittal T1 scan of patient #5 showing pronounced vermis hypoplasia with an anticlockwise rotated axis relative to the axis of the brainstem (arrow), and ensuing large foramen of Magendi (asterisk) and subcerebellar cistern (SC). Cerebellar hemispheres are normal (not shown). (C and C’) Illustrative sagittal T1 MRI images of patient #3 showing a slightly hypoplastic vermis. The white lines and arrow in C’ indicate the anticlockwise-rotated axis of the vermis compared to the axis of the brainstem, with ensuing large foramen of Magendi (asterisk) and subcerebellar cistern (SC) indicated in C. (D) Transverse Inversion Recovery MRI image of patient #10 showing abnormal foliation in the caudal cerebellar hemispheres extending into the cerebellar tonsils (arrow). Also note a wide foramen of Magendi (asterisk). (D’) Transverse T2 MRI image of patient #11, with abnormal foliation in the anterior vermis indicated by an arrow. (E) Transverse Inversion Recovery image and (E’) T2 MRI image of a control patient with normal cerebellum.
Tables
Table 1
Cerebellar findings on MRI scans
| Patient | Sex; age at MRI (y;m) | Cerebellum | Suggestive neurological features* (age at last examination, y;m) | CHD7 mutation | |
|---|---|---|---|---|---|
| 1 | M (1;1) | Pronounced vermis hypoplasia with anticlockwise rotated axis, large foramen of Magendi and large subcerebellar cistern, fissure vermis | None (1;1) | nonsense | 934C>T |
| 2 | M (0;1) | Slight caudal vermis hypoplasia with slightly anticlockwise rotated axis, abnormal foliation, large foramen of Magendi, normal subcerebellar cistern | Ataxic gait (4;4) | nonsense | 7160C>A |
| 3 | M (1;0) | Slight caudal vermis hypoplasia with anticlockwise rotated axis, large foramen of Magendi, large subcerebellar cistern (Figure 5C,C’) | None (12;4) | deletion | 3202-?8994?del |
| 4 | F (0;3) | Slight caudal vermis hypoplasia, with anticlockwise rotated axis, large foramen of Magendi, normal subcerebellar cistern | None (2;2) | frameshift | 7106delT |
| 5 | M (5;7) | Pronounced vermis hypoplasia, with anticlockwise rotated axis, large foramen of Magendi and large subcerebellar cistern (Figure 5B) | None (7;10) | frameshift | 4779delT |
| 6 | M (0;1) | Slight caudal vermis hypoplasia, with anticlockwise rotated axis, large foramen of Magendi and large subcerebellar cistern | None (5;2) | frameshift | 5680_5681delAG |
| 7 | F (2;9) | Slight caudal vermis hypoplasia, with slightly anticlockwise rotated axis, large foramen of Magendi and large subcerebellar cistern | Broad gait (11;6) | missense | 3973T>G |
| 8 | M (1;8) | Large foramen of Magendi, large fourth ventricle (only on sagittal scans), normal subcerebellar cistern | None (12;2) | splice site | 5535-7G>A |
| 9 | M (2;2) | Large foramen of Magendi, large fourth ventricle (only on sagittal scans), normal subcerebellar cistern. Abnormal foliation in anterior vermis | None (6;2) | nonsense | 3173T>A |
| 10 | F (1;1) | Abnormal foliation caudal cerebellar hemispheres and tonsils, large foramen of Magendi (Figure 5D) | None (13;0) | splice site UV | 3340A>T |
| 11 | F (15;10) | Abnormal foliation in anterior vermis (Figure 5D’) | None (18;0) | splice site | 3990-1G>C |
| 12 | M (10;3) | Abnormal foliation in anterior vermis | Motor dyspraxia (16;10) | frameshift | 5564dupC |
| 13 | M (0;1) | Normal (indented cranial pons) | None (0;11) | frameshift | 1820_1821insTTGT |
| 14 | F (15;10) | Normal (large fourth ventricle) | None (20;6) | nonsense | 4015C>T |
| 15 | F (0;1) | Normal, (split caudal vermis) | None (5;9) | nonsense | 7879C>T |
| 16 | M (0;6) | Normal | Broad gait (10;6) | splice site | 2238+1 G>A |
| 17 | M (1;10) | Normal | None (6;4) | nonsense | 1480C>T |
| 18 | F (2;10) | Normal (Figure 5A) | None (17;3) | frameshift | 7769delA |
| 19 | M (1;0) | Normal | None (16;9) | nonsense | 1714C>T |
| 20 | M (6;3) | Normal | None (12;10) | splice site | 2443+5 G>C |
-
*
all children show motor delay due to vestibular defects.
Table 2
Otx2 qPCR primers
| Region | Forward | Reverse |
|---|---|---|
| #1 | AAACTCACCATAATCCTCCTGCC | TCCTCCCCTTCTCCTCTAAACAGC |
| #2 | CTGCTCTCCTCAACCTTCAGACTC | TTGCGTGCCTTACCTTACCG |
| #3 | CAACCACTCAAGTCAAGCCTATCTG | TCTTCCTCTGCCTCCCAAGTTC |
| #4 | CTGGCTGGTGGCTTCTGATT | TTAGGTATCGCCAGGTTGCC |
| #5 | ACACCAACTTGCTGAACAACA | TCCAGACTACTAATTAGGTGAAAATGA |
| #6 | GAAAACCAAAACCCAAACCACG | GAATGGAATCCTTAGCAAGCGG |
| #7 | AACAGGCTTGTGTCCGTCTACG | CGCTTTCTCAGCAAATCTCCC |
| #8 | CATTTTCTTGCCGTCCTGCC | AAAGTGTGCCTCCTGTGGTTCC |
| #9 | AAAAACACTGGGGAAGAAAGGG | AAATAAGAGTCAGAAGAGCGGTGC |
| #10 | GCTGAATCAAACATGAATGAGCC | CTGGGAGTAGACAACTGAGACA |
Table 3
Gbx2 qPCR primers
| Region | Forward (5’–3’) | Reverse (5’–3’) |
|---|---|---|
| #1 | CCCTTGGCTGGCTTTGAAAT | TCTGCCTTTTGTCCTGGAGA |
| #2 | TGAATCCATAGCTTACCCGC | AGGAACAAAGGGGGAAAGAA |
| #3 | CCAGGCTTTCATCTCTCGCA | ATAGGCCAAGCTAAGCACCC |
| #4 | GGGAATGGTGGAATGAATGGC | TGAGGAGTGTGCTGAAGGGACAAC |
| #5 | GTTGGCTGCCCTTTTCTTCA | ACCTCCATCTCCTCAGGCTA |
| #6 | TGTAAACACTCCCTTCCCCGTATC | CCACCCTAAACCGAAATGCG |
Download links
A two-part list of links to download the article, or parts of the article, in various formats.
Downloads (link to download the article as PDF)
Open citations (links to open the citations from this article in various online reference manager services)
Cite this article (links to download the citations from this article in formats compatible with various reference manager tools)
Deregulated FGF and homeotic gene expression underlies cerebellar vermis hypoplasia in CHARGE syndrome
eLife 2:e01305.
https://doi.org/10.7554/eLife.01305


