pH- and sodium-induced changes in a sodium/proton antiporter
- Max Planck Institute of Biophysics, Germany
Figures
Figure 1

Physiological roles of EcNhaA and MjNhaP1.
(A) EcNhaA is a sodium pump driven by the proton-motive force, exchanging one sodium ion against two protons (Taglicht et al., 1991), enabling E. coli to survive at high sodium and alkaline pH. (B) MjNhaP1 is thought to act mainly as a proton pump driven by the sodium gradient, exchanging one proton against one sodium ion. Like the homologous NHE1 in mammals (Lee et al., 2012), MjNhaP1 plays a critical role in pH homeostasis and enables M. jannaschii to survive at low pH (4–6) and sodium concentrations up to 0.9 M (Jones et al., 1983; Hellmer et al., 2002).
Figure 2
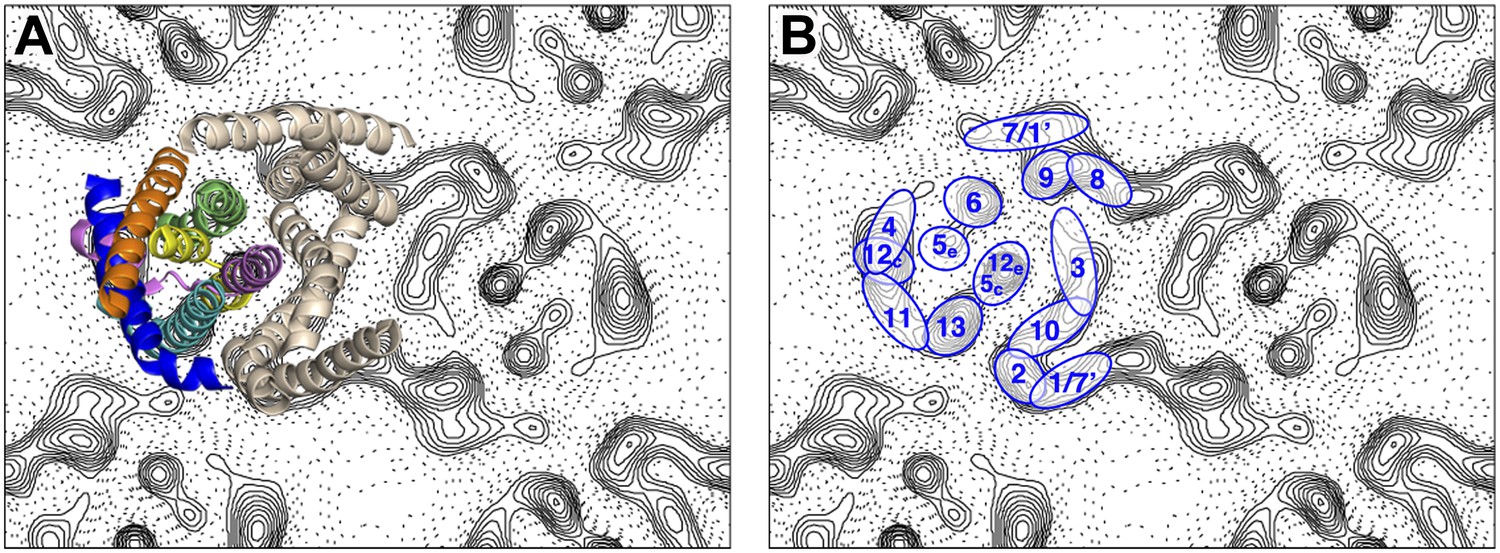
Helix assignment.
6 Å projection map of the MjNhaP1 dimer in two-dimensional membrane crystals at pH 4 with 500 mM NaCl. (A) Superposition of one protomer of the MjNhaP1 3D EM model (Goswami et al., 2011). The model is seen from the extracellular space. The 6-helix bundle is colour-coded, while the 7 TMH at the dimer interface are neutral. (B) TMHs are shown as ovals and numbered as in the MjNhaP1 model. Identities of TMH 1 and 7 in the model were ambiguous.
Figure 3

pH-induced conformational changes in absence of sodium.
Difference maps at 6 Å resolution between projection maps of MjNhaP1 2D crystals grown without sodium at different pH: (A) pH 4 minus pH 6; (B) pH 8 minus pH 6; and (C) pH 4 minus pH 8. (D) Helix assignment as in Figure 2B. Blue contours indicate positive differences, negative differences are shown in red.
Figure 4
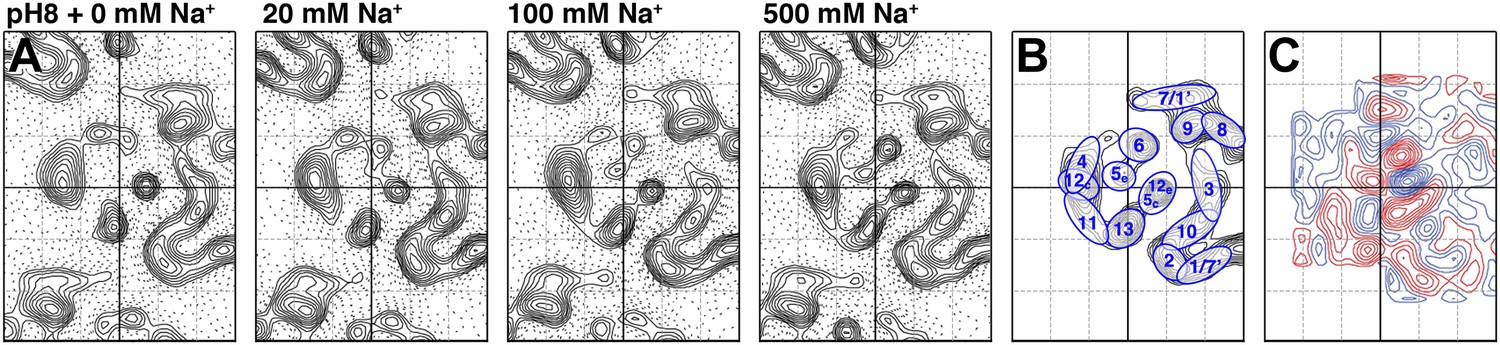
Sodium-induced conformational changes at pH 8.
(A) 6 Å projection maps of MjNhaP1 crystals at pH 8 without sodium (left) and at increasing sodium concentration. (B) Helix assignment as in Figure 2B. (C) Difference map at 6 Å resolution between projection maps of MjNhaP1 at pH 8 in absence of sodium and at 500 mM NaCl. Blue contours indicate positive differences, negative differences are shown in red.
Figure 5 with 3 supplements

Sodium-induced conformational changes at different pH.
Matrix of 6 Å difference maps between projections of MjNhaP1 2D crystals in absence of sodium and the sodium concentrations indicated at pH 8 (A), pH 6 (B) and pH 4 (C). Clusters of predominant positive/negative difference peaks are outlined by ovals, single positive difference peaks are circled. The arrow indicates a broad difference peak observed at pH 4. Helices are assigned to regions of the projection maps at the end of each row. The first column shows control difference maps calculated from datasets split randomly into two halves to assess the level of background noise, which was estimated at around ±2 contour lines. Blue contours indicate positive differences, negative differences are shown in red.
Figure 5—figure supplement 1
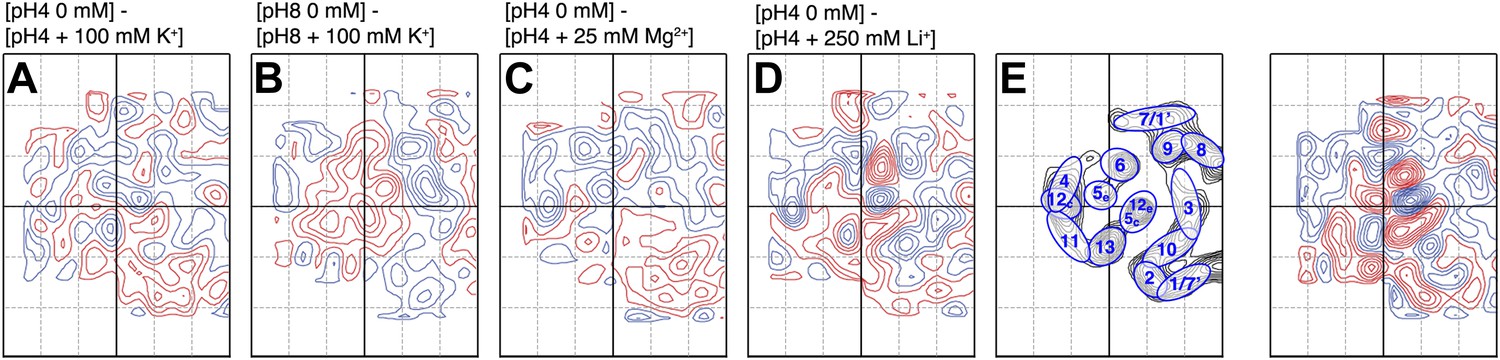
Substrate specificity.
Difference maps of MjNhaP1 monomer at 6 Å resolution in response to ions other than Na+. Respective pH and salt conditions are indicated. (C) Mg2+ ions have no major impact on the structure of MjNhaP1. (A and B) K+ ions, which may bind (Alhadeff et al., 2011) but are not transported cause changes above background level which are different from those observed with the substrate ions Na+ (Figure 5) and Li+ (D). (E) Helix assignment as in Figure 2B. Blue contours indicate positive differences, negative differences are shown in red.
Figure 5—figure supplement 2

Difference maps calculated for TtNapA.
(A) The similarity of projection maps at 6 Å resolution indicates that TtNapA is a structural homologue of MjNhaP1. On the left is the outward-open TtNapA X-ray structure (PDB ID 4BWZ). The inward-open TtNapA model, which was built as described by Lee et al. 2013, is shown on the right. (B) Difference map at 6 Å resolution between the two TtNapA projections in (A). (C) Difference map at 6 Å resolution between projection maps of MjNhaP1 at pH 8 in absence of sodium (outward-open) and at 500 mM NaCl (inward-open). Blue contours indicate positive differences, negative differences are shown in red.
Figure 5—figure supplement 3
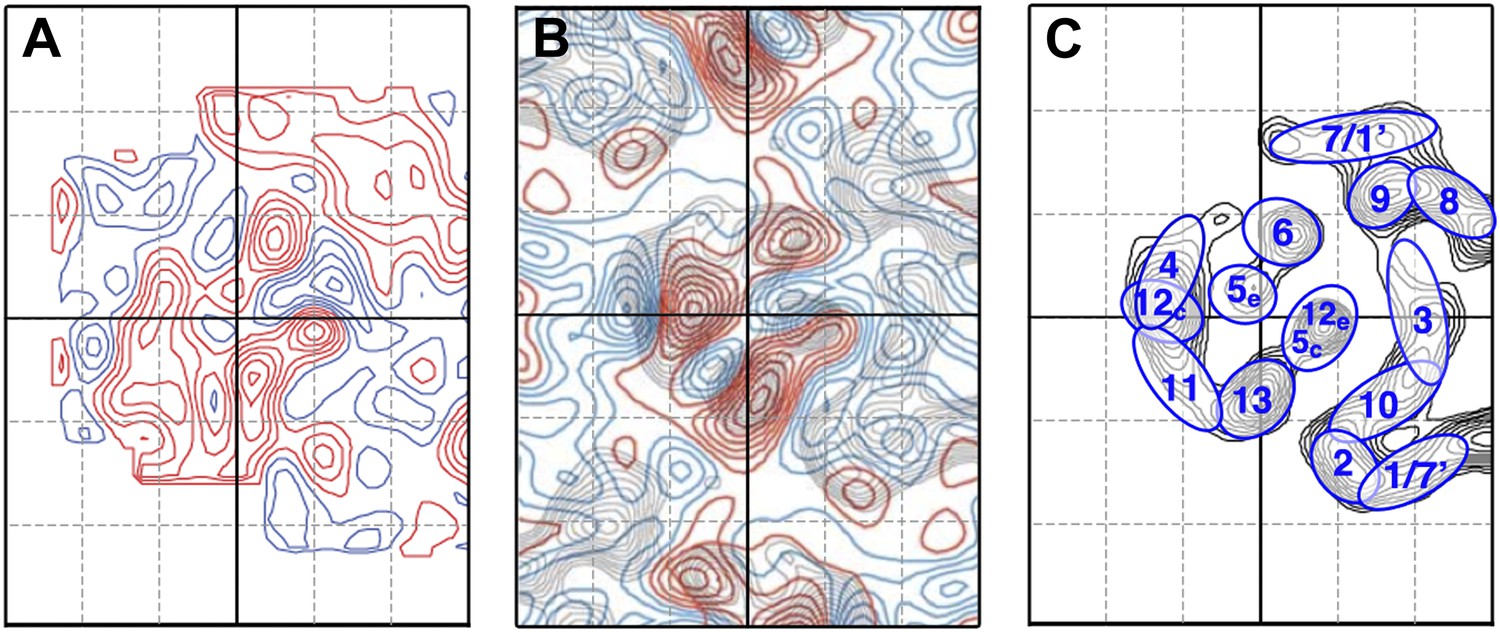
Comparison to the difference map obtained by Vinothkumar et al. (2005).
(A) Difference map of MjNhaP1 monomer at 6 Å resolution at pH4 + 150 mM NaCl minus projection map of crystals grown with 200 mM sodium and washed on the grid with pH 8 buffer without sodium, reproducing the experimental conditions in Vinothkumar et al. (2005) as closely as possible. (B) Difference map reproduced from Figure 7 in Vinothkumar et al. (2005) (published in EMBO Journal, copyright original authors). (C) Helix assignment as in Figure 2B. Red contours indicate positive differences, while negative differences are shown in blue.
Figure 6

pH dependence of apparent dissociation constants for Na+ in MjNhaP1.
The number of contour lines (peak-to-trough) was counted for each set of positive/negative difference peaks in the difference maps shown in Figure 5 including maps generated for 50 mM NaCl at pH 8 and 150 mM NaCl at pH4 (not shown, see Supplementary file 1) and plotted against the Na+ concentration at pH 8 (A) and pH 4 (B). Apparent dissociation constants for Na+ were calculated (C). Contour levels observed in the same regions of control difference maps in absence of sodium (first column) were set to zero and subtracted from all subsequent values.
Figure 7
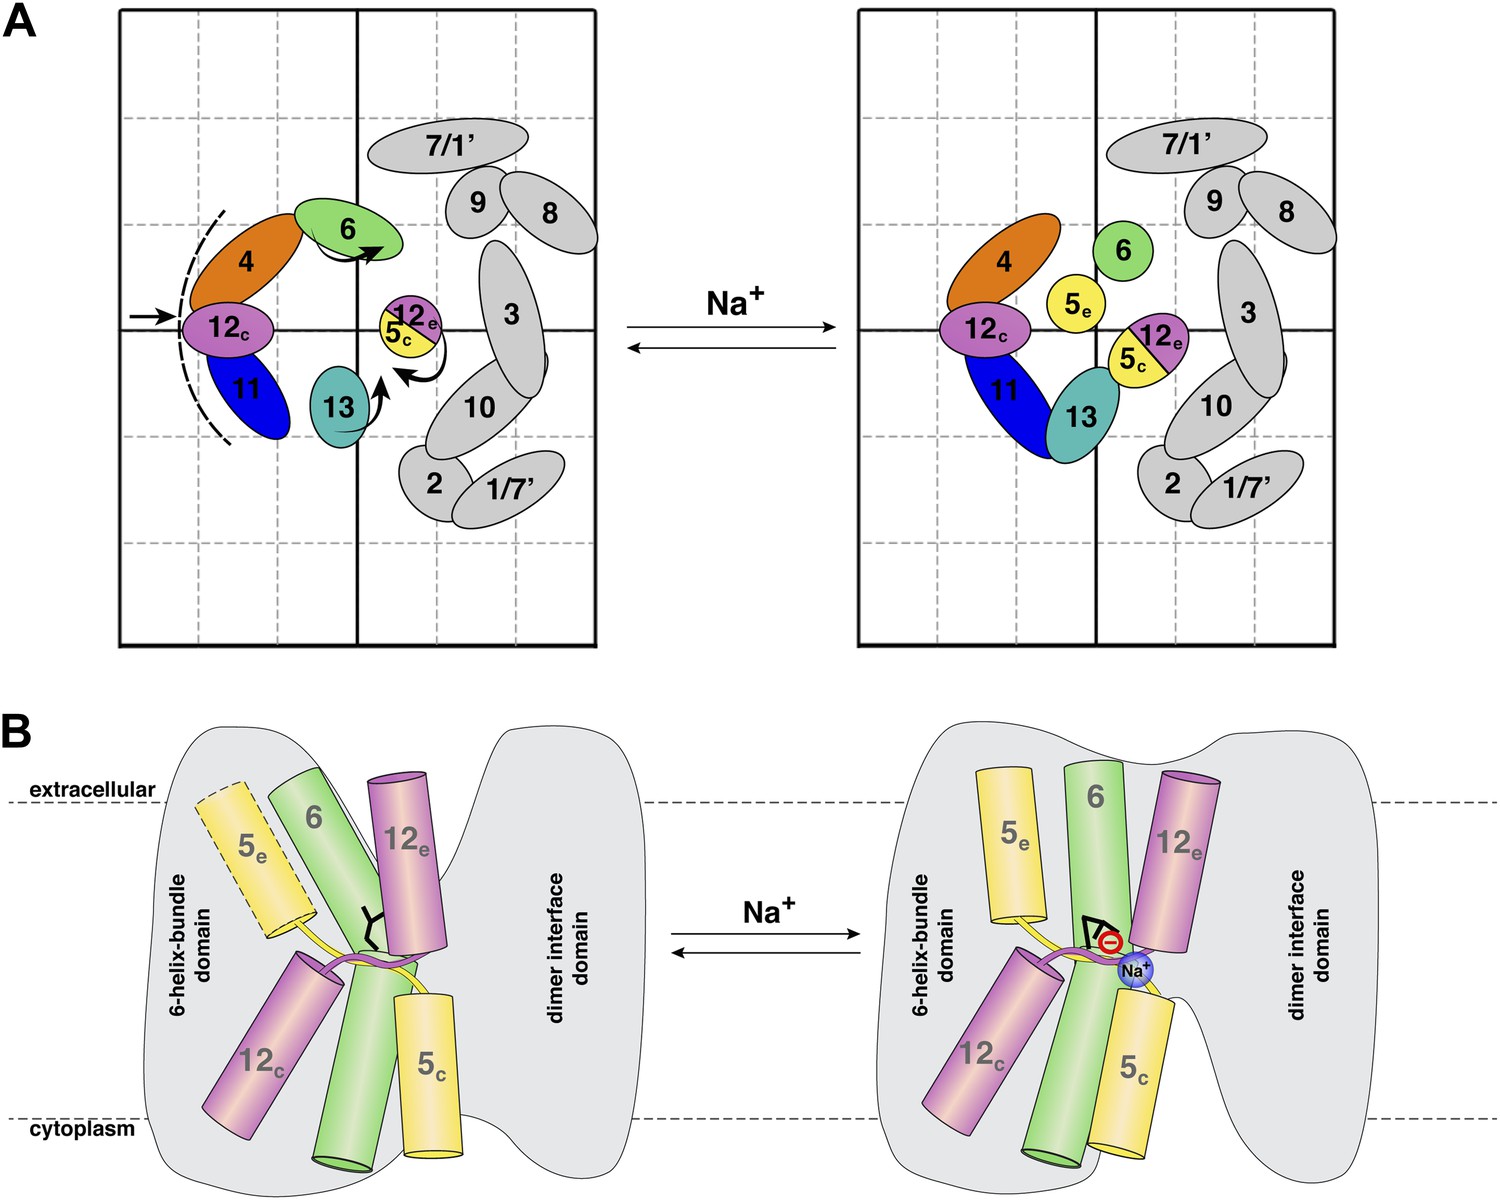
Na+ -induced conformational changes in MjNhaP1.
(A) Summary of observed helix movements in response to Na+ binding. Schematic helix positions in absence of NaCl (left) or at pH 4 and pH 8 at >250 mM NaCl (right). Helix movements are indicated by arrows. Helix projections are shown as circles or ovals. The 6-helix bundle is color-coded as in Figure 2A. Helices at the dimer interface are grey. (B) Model drawing of changes in the positions of TMH 5, 6 and 12 that respond most strongly to Na+ binding. Residue D161 in TMH 6, thought to be directly involved in substrate binding, is shown in black. Na+ binding results in a transition from the apo or proton-bound state, where the putative ion-binding site is likely to be more accessible form the extracellular space (left), to a Na+-bound state, which we propose to be open to the cytoplasm (right).
Additional files
-
Supplementary file 1
Electron crystallographic data.
Lower table legend: a Calculated from the program AVRGAMPS: mean weighted squared distance of the phase values from the averaged value (90° = random) b Calculated from the program FOMSTATS: averaged phase values from the symmetry-constrained target values of 0° or 180° (45° = random). a,b Reflections with IQ ≤ 7 Å were included.
- https://doi.org/10.7554/eLife.01412.013
Download links
A two-part list of links to download the article, or parts of the article, in various formats.
Downloads (link to download the article as PDF)
Open citations (links to open the citations from this article in various online reference manager services)
Cite this article (links to download the citations from this article in formats compatible with various reference manager tools)
pH- and sodium-induced changes in a sodium/proton antiporter
eLife 3:e01412.
https://doi.org/10.7554/eLife.01412


