Symmetry breaking in reconstituted actin cortices
- Technion–Israel Institute of Technology, Israel
Figures
Figure 1 with 3 supplements
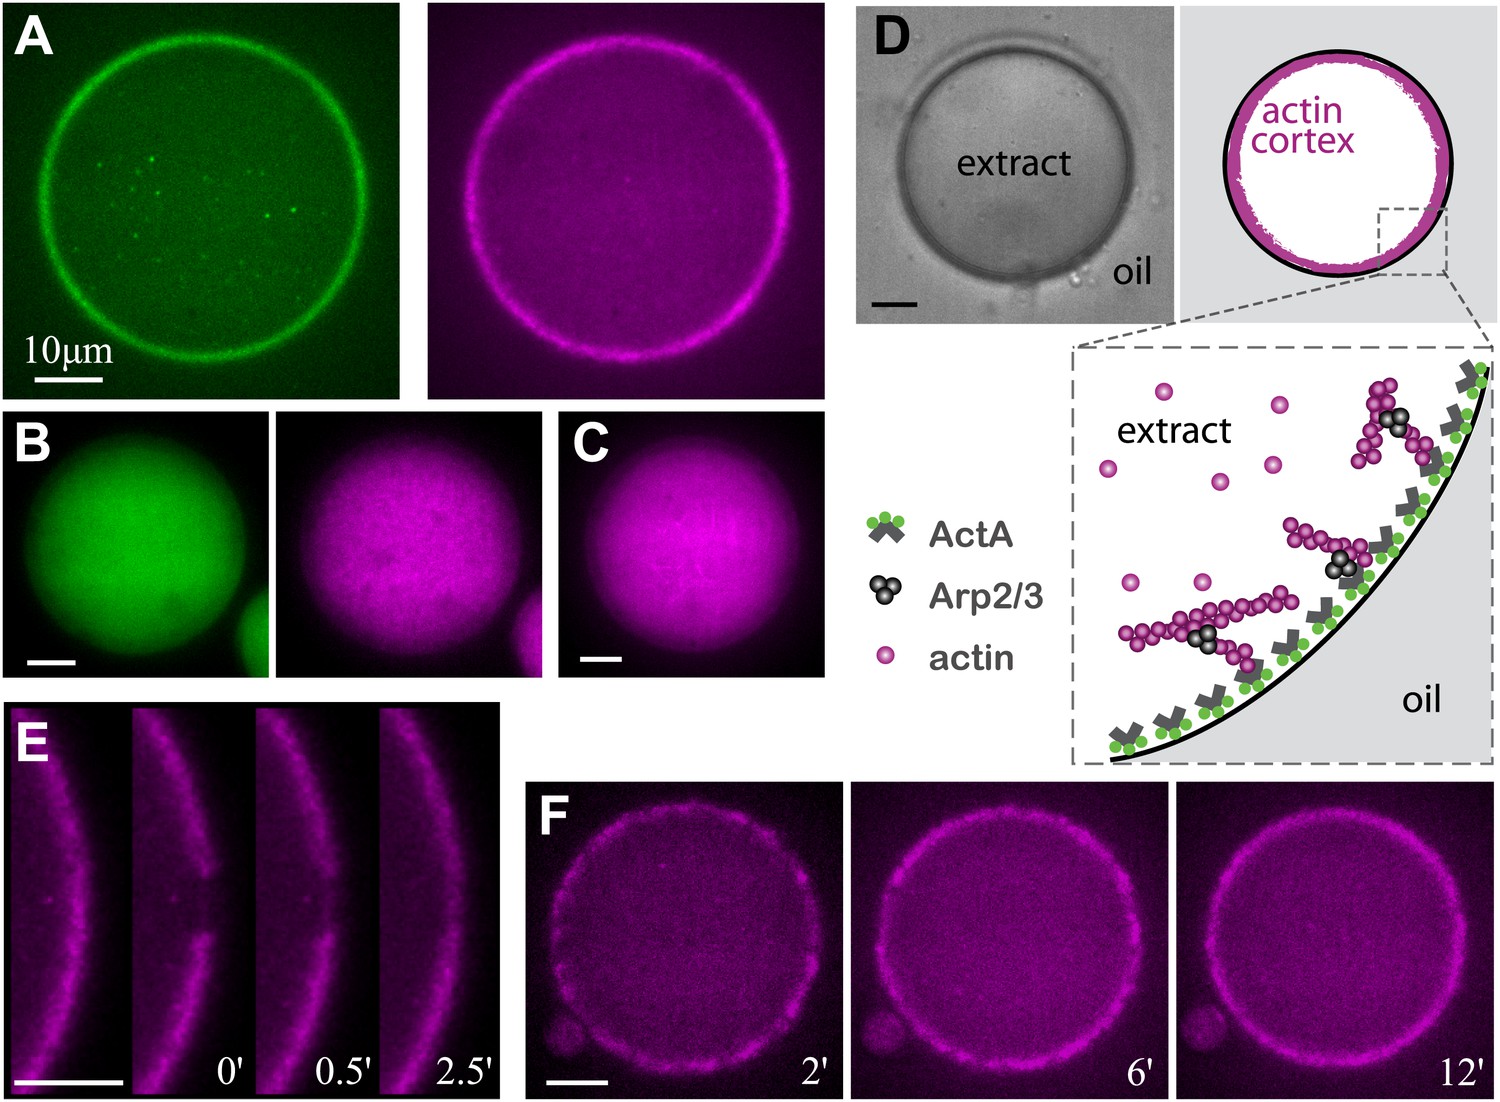
Reconstitution of actin cortices within water-in-oil emulsions.
(A) Spinning disk confocal images of bodipy-conjugated ActA (left) and rhodamine-labeled actin (right) in a water-in-oil emulsion. The bodipy-conjugated ActA localizes to the water–oil interface, and induces the formation of an actin cortex there. The actin signal reflects the distribution of actin monomers and filaments. (B) Images of AlexaFluor488-conjugated ActA (left panel) and rhodamine-labeled actin (right) in a water-in-oil emulsion. The hydrophilic ActA and the actin remain dispersed throughout the emulsion. (C) Image of rhodamine-labeled actin in a water-in-oil emulsion in the absence of ActA. The actin is distributed within the emulsion. (D) Schematic illustration of the actin cortex formed at the inner interface of a water-in-oil emulsion. A bright-field image (top left) and a scheme (top right) of an actin cortex at the inner interface of an aqueous droplet surrounded by oil. The zoomed scheme (bottom) illustrates the localization of the amphiphilic bodipy-conjugated ActA to the water–oil interface, which leads to local activation of Arp2/3 and nucleation of a cortical actin network. (E) Scanning confocal images showing cortical recovery in a photobleaching experiment (Video 1). The time after photobleaching is indicated. (F) Spinning disk confocal images from a time-lapse video showing the formation of a homogenous actin cortex. The time after droplet formation is indicated. Scale bars: 10 µm.
Figure 1—figure supplement 1
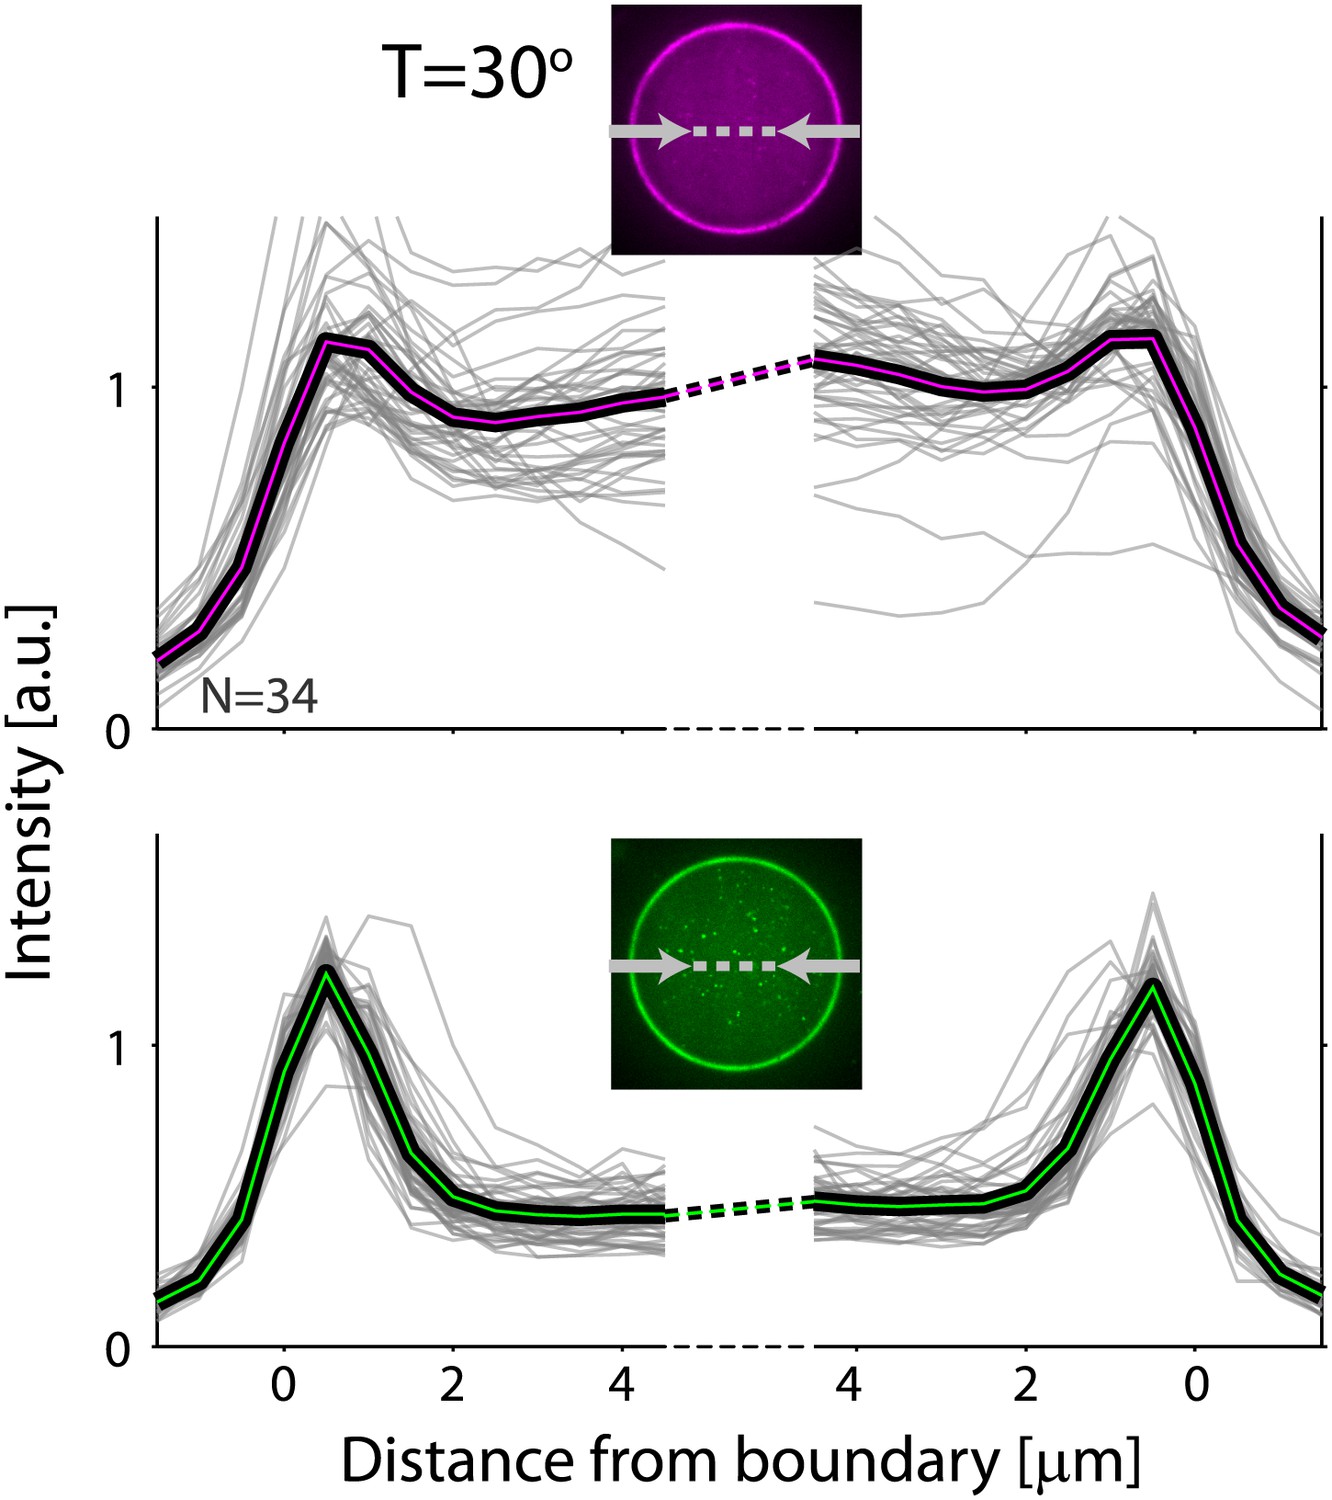
Actin and ActA distributions in water-in-oil emulsions.
The fluorescence intensity cross-sections of rhodamine-labeled actin (top) and bodipy-conjugated ActA (bottom) extracted from spinning disk confocal images (inset) are plotted as a function of distance from the emulsion boundaries. Data for individual emulsions incubated at 30°C (grey lines) is shown together with the population average (thick lines). The cross-section intensity for each emulsion was normalized to the mean intensity along the emulsion boundary (Figure 2A,B; bottom). The actin signal reflects the distribution of actin monomers and filaments. A homogeneous cortical actin shell with a thickness of ∼1.5 µm is apparent.
Figure 1—figure supplement 2
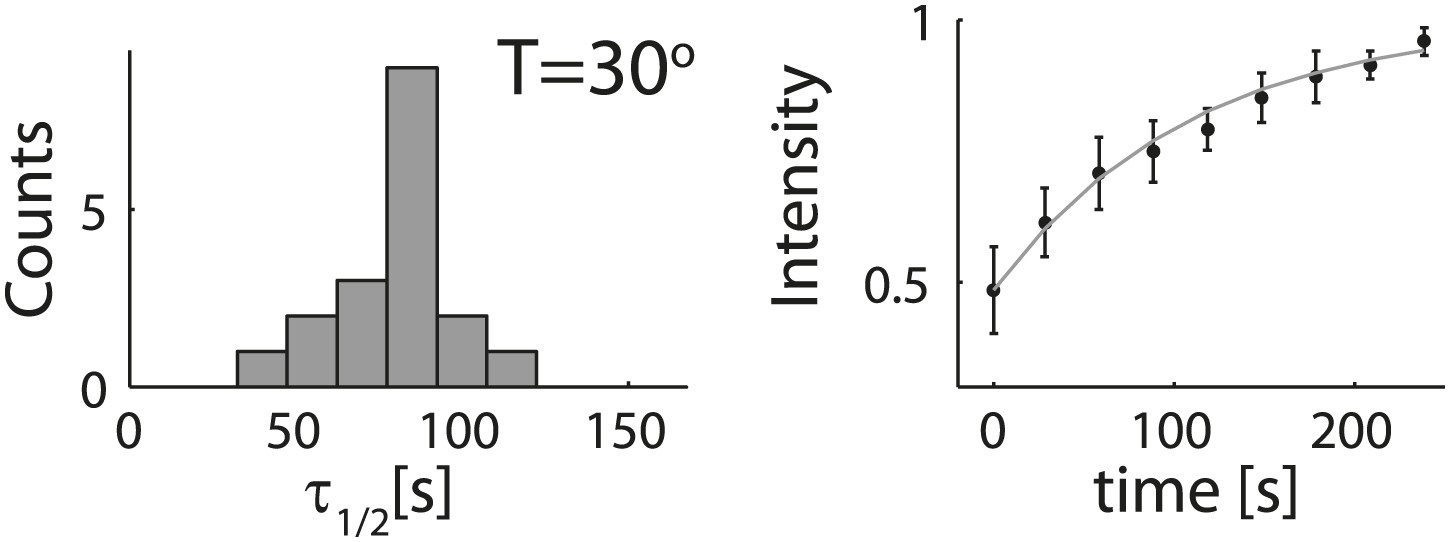
Analysis of photobleaching experiments.
FRAP experiments were performed on reconstituted cortices at 30°C using a scanning confocal microscope (‘Materials and methods’). A region of the cortex at the bottom of an emulsion was bleached and its recovery was followed over time. Analysis of the recovery following photobleaching was done using the ZEN software by fitting to a single exponent, and using an unbleached region of the cortex as a reference. Left: histograms of the half time for recovery are shown. The average half time at 30°C was τ½ = 81 ± 18 s (mean ± STD; N = 18). Right: graphs showing the normalized intensity as a function of time following photobleaching. The mean normalized intensity (mean ± STD) averaged over different emulsions at 30°C is shown. The solid line depicts a fit to a single exponent. The cortices typically exhibited only partial recovery after bleaching, usually returning to ∼50% of their initial intensity. This partial recovery appeared to be a result of photodamage during the bleaching step.
Figure 1—figure supplement 3
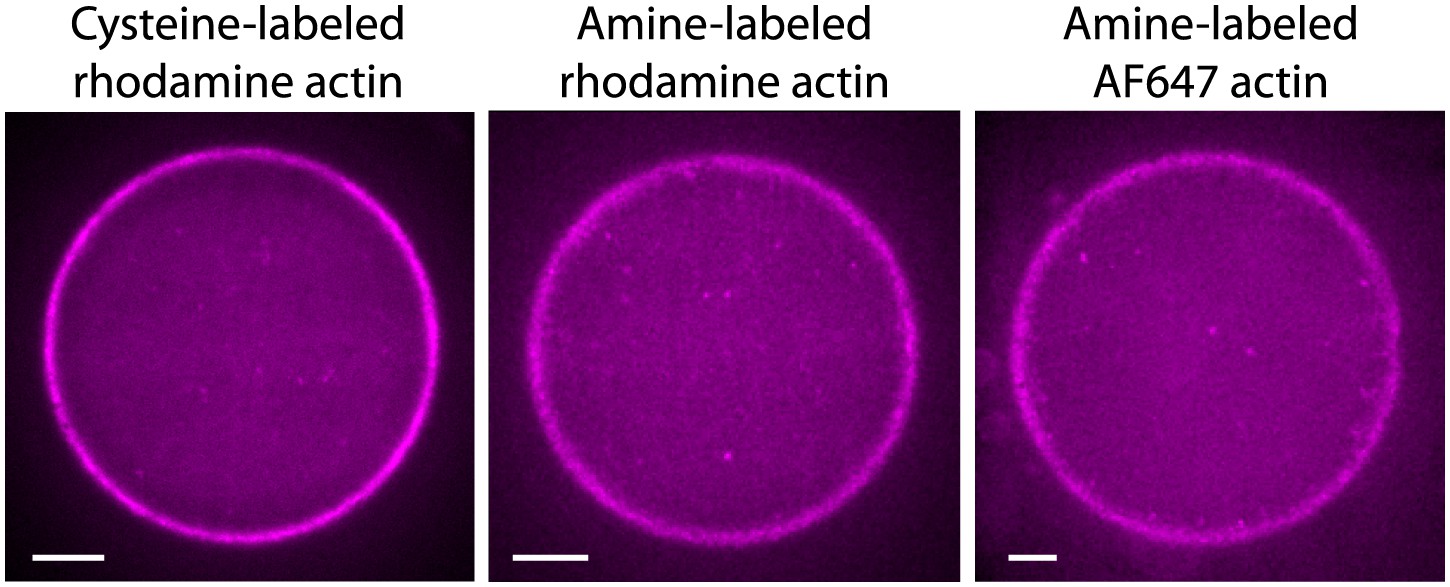
Actin cortices formed with different types of labeled actin.
Spinning disk confocal images of actin cortices prepared with different types of labeled actin, as indicated. Similar behavior was observed in all cases. Scale bars: 10 µm.
Figure 2 with 6 supplements
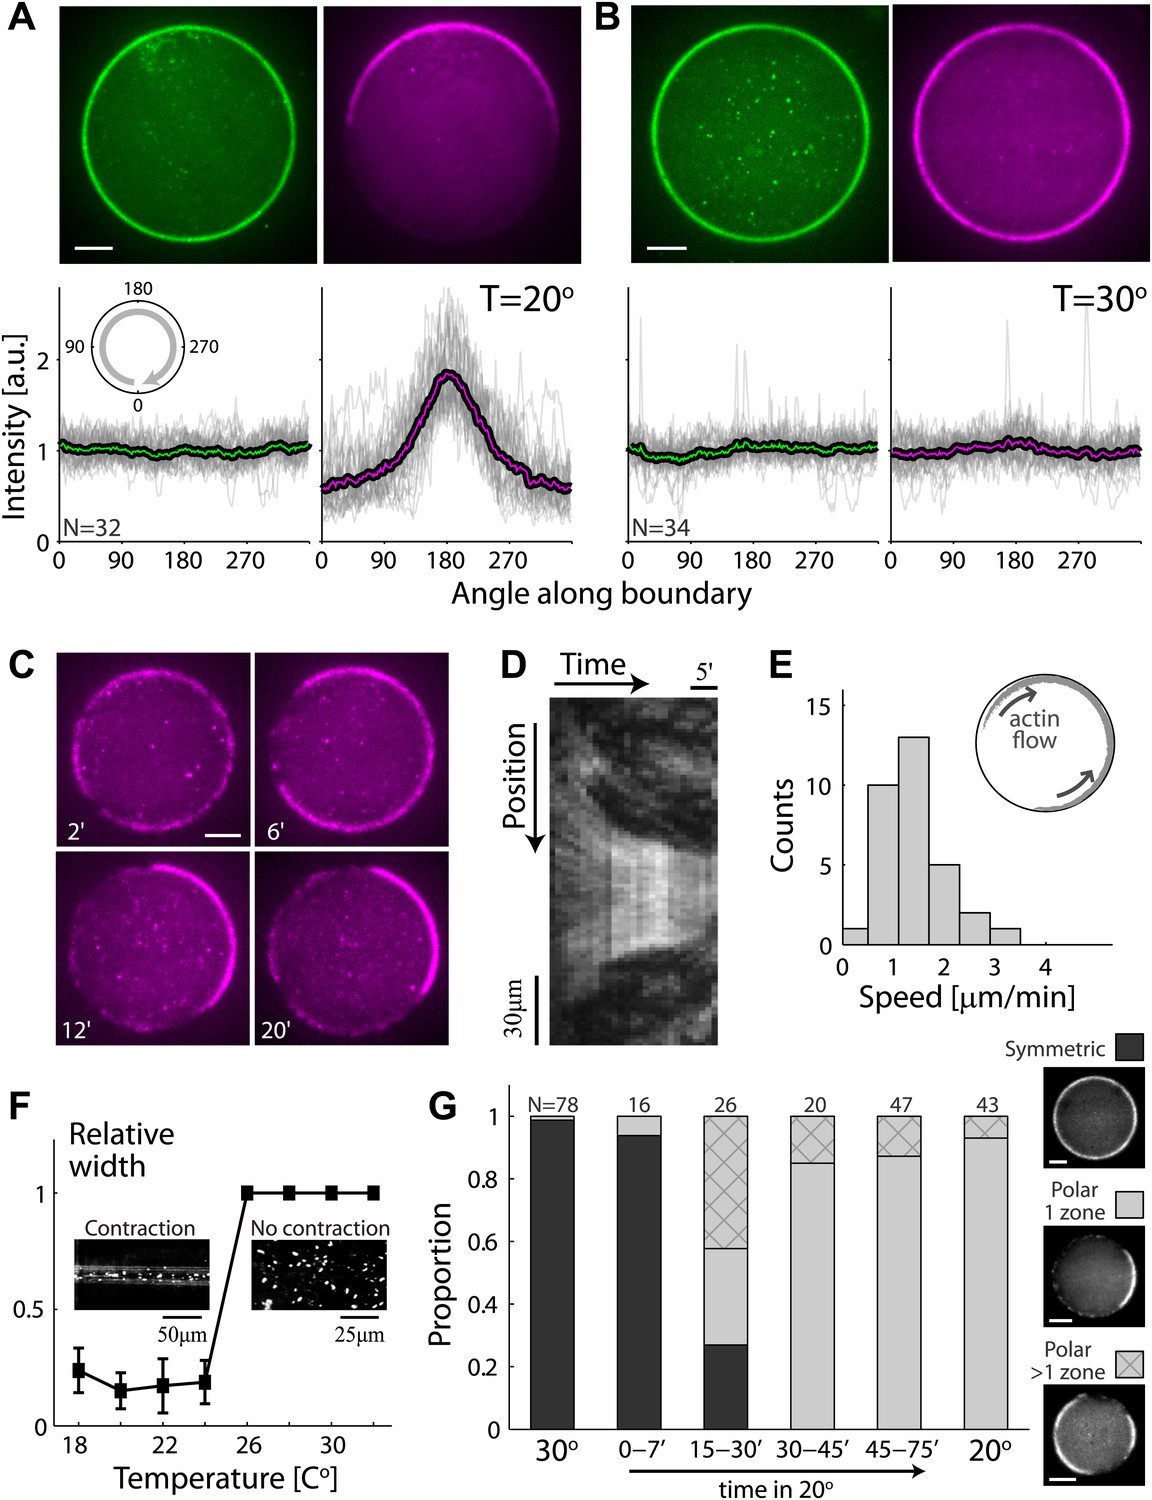
Temperature-dependent symmetry breaking in reconstituted actin cortices.
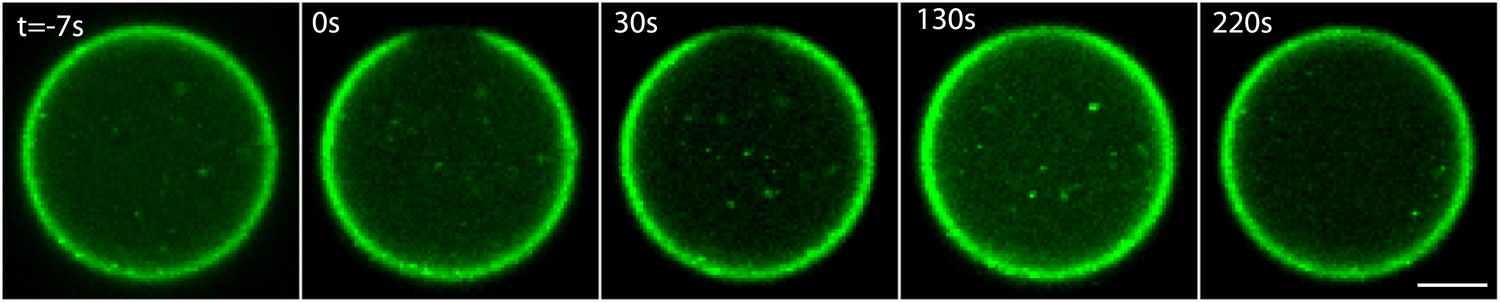
(A and B) Spinning disk confocal images of bodipy-conjugated ActA (top left) and rhodamine-labeled actin (top right) in water-in-oil emulsions incubated at 20°C (A) or at 30°C (B). A polar actin cortex with a single cap is observed at 20°C, in contrast to the uniform spherical cortex observed at 30°C. The fluorescence intensity profiles as a function of the angle along the contour are shown for different water-in-oil emulsions at 20°C (A; bottom panels) or at 30°C (B). Data for individual emulsions normalized to the mean intensity in each contour (grey lines) is shown together with the population average (thick line). The actin distributions (bottom right) are peaked at the center of the cap for all the emulsions at 20°C, in contrast to the uniform distributions at 30°C. The ActA distributions (bottom left) are essentially flat at both temperatures. The residual ActA observed outside the polar caps at 30°C suggests that ActA is in excess in our system (Figure 2—figure supplement 5). (C) Spinning disk confocal images from a time-lapse video (Video 2) showing the development of a polar actin cap in an emulsion incubated at 20°C. The time after droplet formation is indicated. Cortex assembly starts uniformly along the interface, and becomes polar within minutes. (D) A kymograph of the video in (C), showing the fluorescence intensity along the contour of the emulsion (vertical axis) as a function of time (horizontal axis). The cortical actin flow which slows down as the cap contracts is evident in the kymograph. (E) A histogram of the initial cortical flow speeds measured for a population (N = 32) of emulsions followed by time-lapse microscopy during the symmetry breaking process as in (C). Inset- a schematic illustration of the cortical actin flow during the symmetry breaking process. (F) Bulk assay for actin network contractility. The relative width of the actin containing strip in comparison to the width of the incubation chamber after 30 min is plotted as a function of temperature. At temperatures <25°C the network contracts into a thin strip (left inset), while at higher temperatures (>25°C) no bulk contractility is observed (right inset). (G) Samples were incubated for 30 min at 30°C to generate homogenous cortices, and then moved to 20°C. Cortex polarity developed over time, with symmetry breaking often initiating in more than one position (Figure 2—figure supplement 4A). The relative proportion of symmetric (dark) and polar cortices (light) with one (bare) or multiple (stripes) actin caps, at different time windows following the temperature shift are shown, in comparison to control samples incubated at 30°C or at 20°C.
Figure 2—figure supplement 1
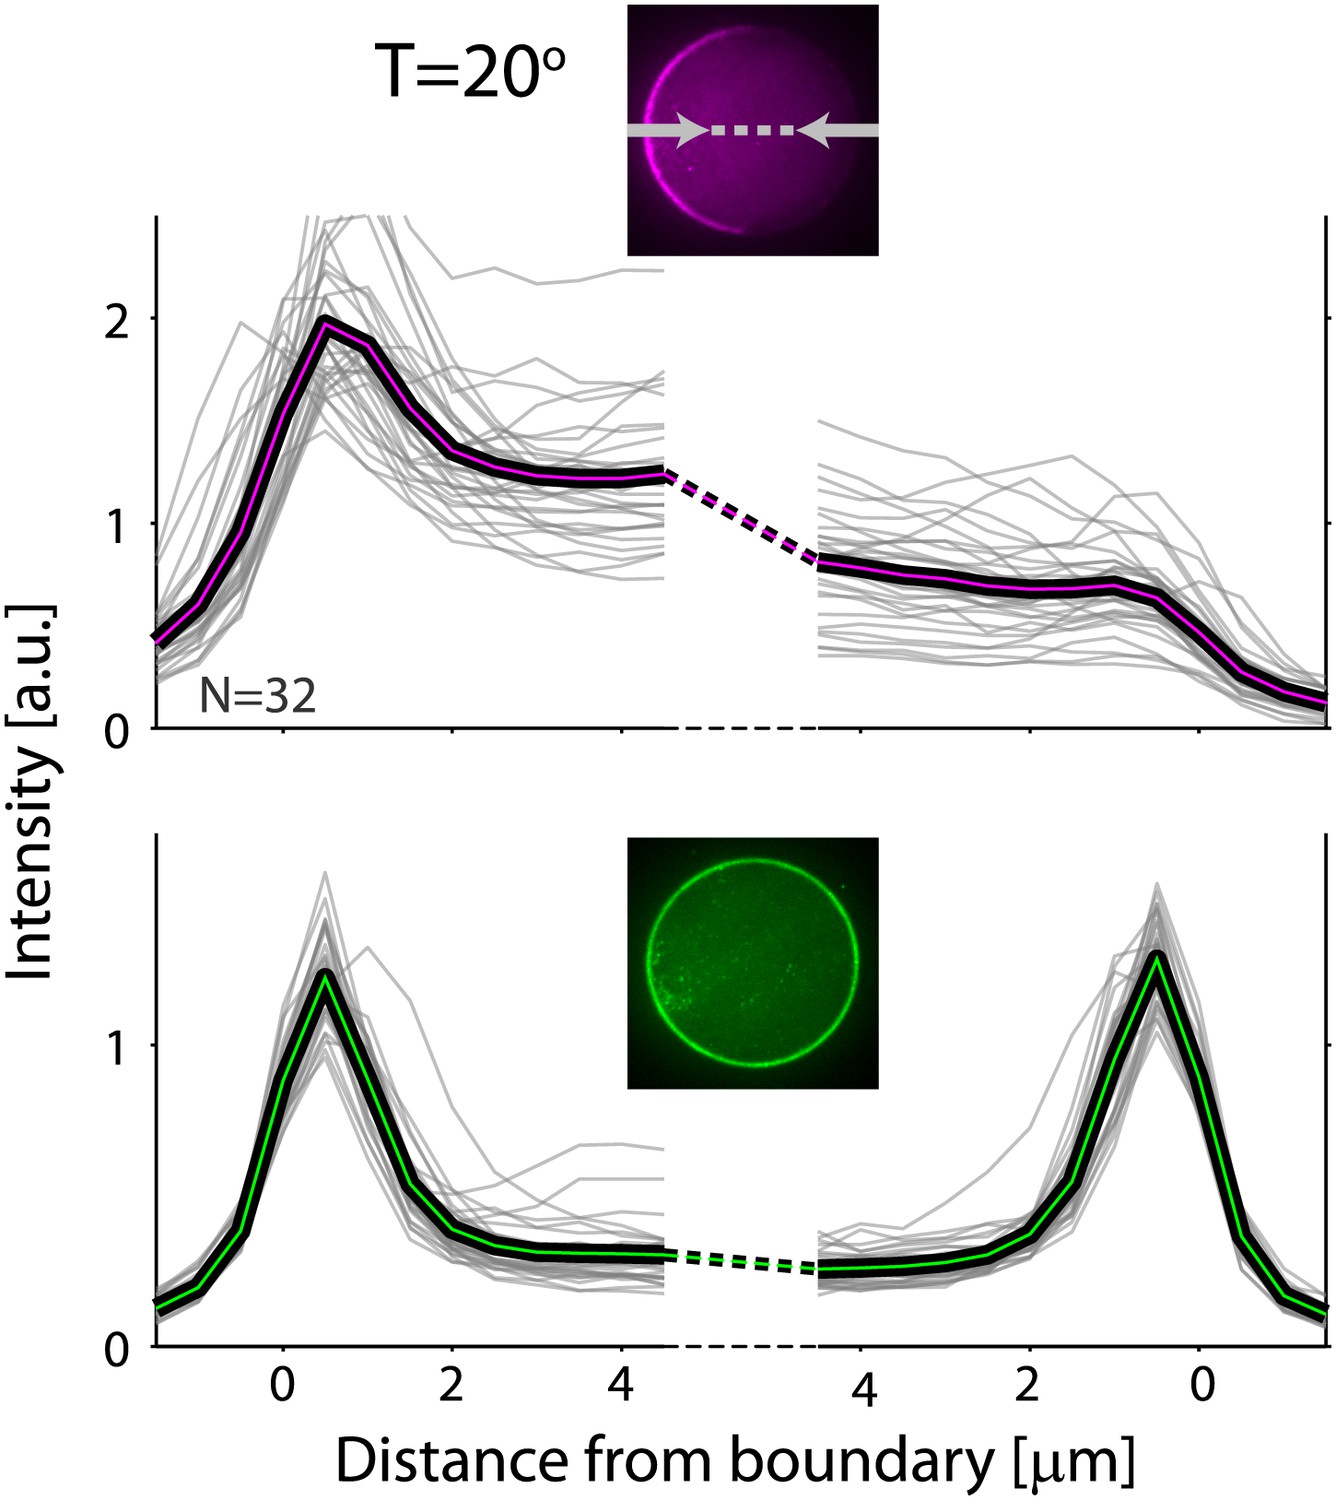
Actin and ActA distributions in water-in-oil emulsions at 20°C.
The fluorescence intensity cross-sections of rhodamine-labeled actin (top) and bodipy-conjugated ActA (bottom) extracted from spinning disk confocal images (inset) are plotted as a function of distance from the emulsion boundaries. Data for individual emulsions incubated at 20°C (grey lines) is shown together with the population average (thick lines). The cross-section intensity for each emulsion was normalized to the mean intensity along the emulsion boundary. The cortical actin distribution is peaked on one side at 20°C, in contrast to the homogenous cortices formed at 30°C.
Figure 2—figure supplement 2
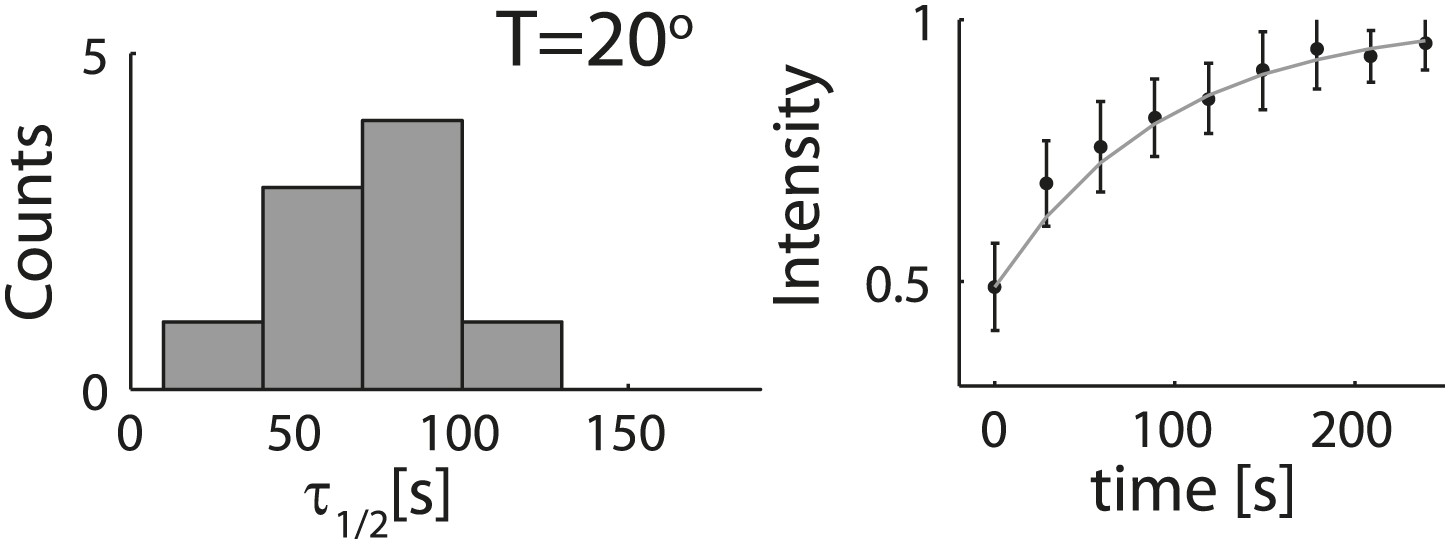
Analysis of photobleaching experiments at 20°C.
FRAP experiments were performed on reconstituted cortices at 20°C using a scanning confocal microscope (‘Materials and methods’). A region of the cortex at the bottom of an emulsion was bleached and its recovery was followed over time. Analysis of the recovery following photobleaching was done using the ZEN software by fitting to a single exponent, and using an unbleached region of the cortex as a reference. Left: histograms of the half time for recovery are shown for emulsions. The average half time at 20°C was τ½ = 73 ± 24 s (mean ± STD; N = 9). The average half times at 30°C and at 20°C were not significantly different (p>0.1). Right: graphs showing the normalized intensity as a function of time following photobleaching. The mean normalized intensity (mean ± STD) averaged over different emulsions at 20°C is shown. The solid line depicts a fit to a single exponent.
Figure 2—figure supplement 3
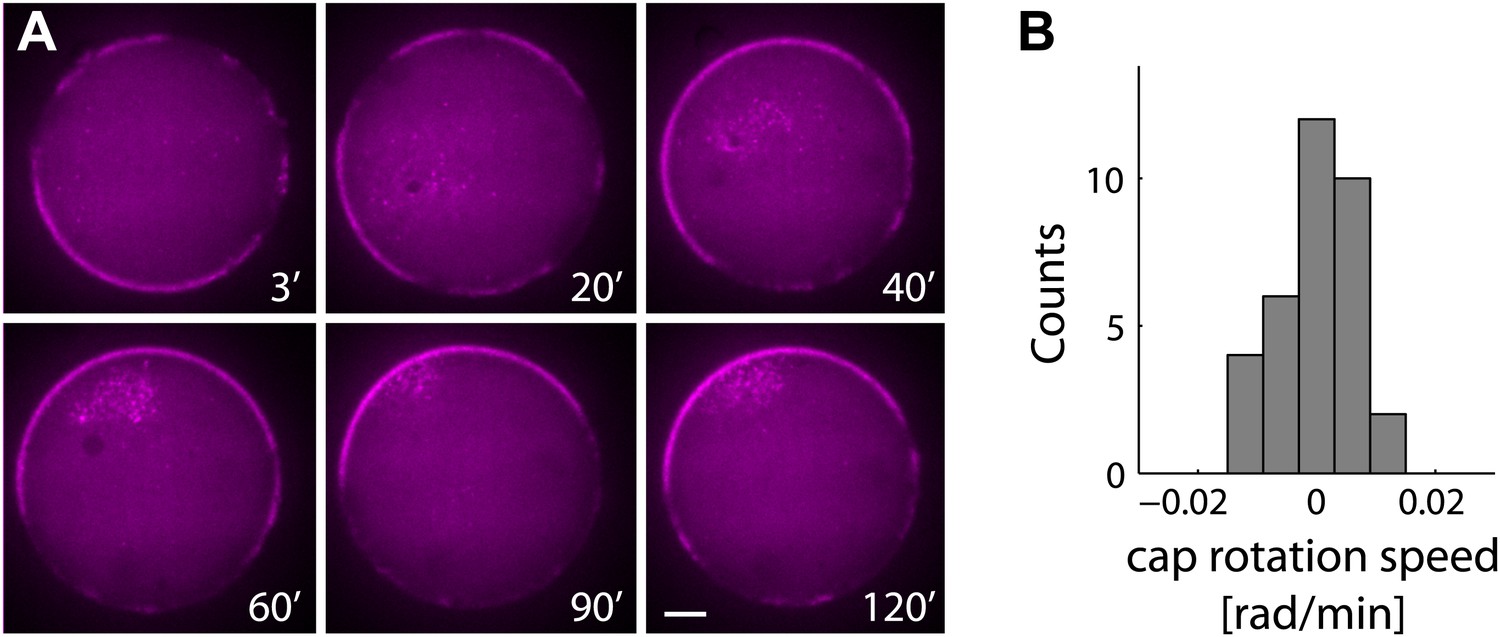
The actin cap remains stable following symmetry breaking.
(A) Spinning disk confocal images from a time lapse video following the dynamics of cap evolution over 2 hr. Once a stable cap is formed, its position remains relatively stable over time. (B) A histogram of the net cap rotation speed measured for a population (N = 30) of emulsions followed by time-lapse microscopy after the symmetry breaking process. The cap position was determined along the perimeter as the center of mass of the intensity distribution along the boundary.
Figure 2—figure supplement 4

A temperature shift from 30°C to 20°C leads to symmetry breaking.
Samples were incubated for 30 min at 30°C to generate homogenous cortices, and then moved to 20°C. (A) Spinning disk confocal images of the actin distribution in representative emulsions at different time points following the temperature shift. (B and C) The actin (B) and ActA (C) density profiles within different time windows following the shift in temperature are shown as a function of the angle along the contour. The time window after the temperature shift for each graph is indicated. Data for individual emulsions normalized to the mean intensity in each contour (grey lines) is shown together with the population average within the time window (thick lines). Cortex polarity develops over time, with symmetry breaking often initiating in more than one position (e.g., image at 22′). Both the ActA and the actin distributions become polar, with the actin distribution exhibiting a more pronounced peak.
Figure 2—figure supplement 5
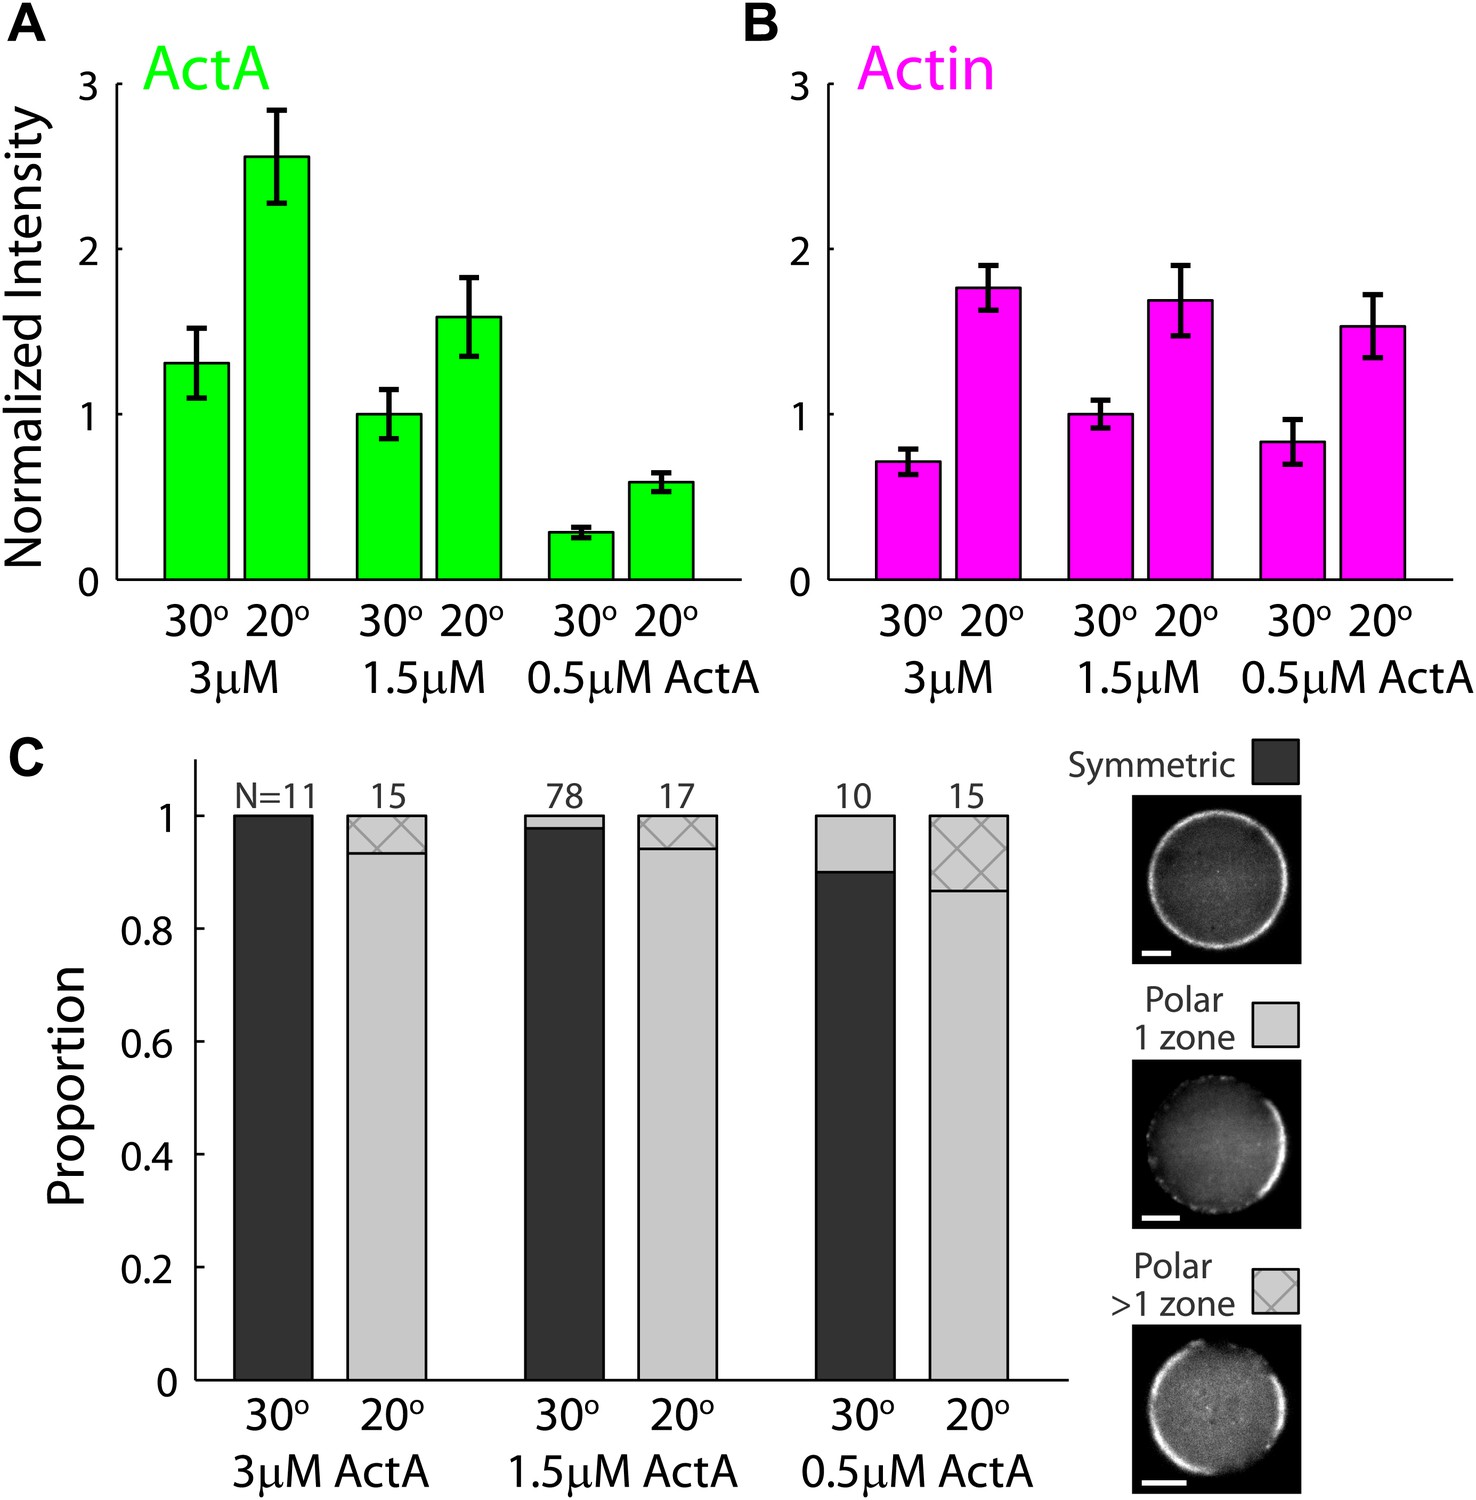
The temperature–dependent behavior of artificial cortices as a function of ActA concentration.
Artificial actin cortices were prepared with different ActA concentrations which were higher (3 µM) or lower (0.5 µM) than the typical ActA concentration used (1.5 µM). (A and B) Bar plots showing the average fluorescence (±SEM) intensity of bodipy-conjugated ActA (A) and rhodamine-labeled actin (B) in artificial cortices prepared at different ActA concentrations and incubated at 20°C or 30°C as indicated. The fluorescence intensity along the interface was extracted from spinning disk confocal images, and the mean cortex intensity was averaged over a population of emulsions for each condition. The intensity values were normalized to the average intensity with 1.5 µM ActA at 30°C. The ActA density at the interface was higher at 20°C and increased with the bulk concentration of ActA. The cortical actin density was also higher at 20°C, but was nearly independent of the ActA concentration. (C) Bar plot showing the relative proportion of symmetric (dark) and polar cortices (light) with one (bare) or multiple (stripes) actin caps for samples of emulsions made with different amounts of ActA and incubated at 20°C or 30°C. The proportion of symmetric and polar cortices does not depend on the ActA concentration within the range of concentrations examined.
Figure 2—figure supplement 6
ActA dynamics at the interface.
Scanning confocal images showing the ActA distribution in an emulsion incubated at 20°C. A small patch of the ActA at the interface was photobleached and the recovery of the fluorescence signal was followed over time. The ActA appeared to recover homogenously within the bleached region. The time from the bleaching event is indicated. Scale bar: 10 µm.
Figure 3
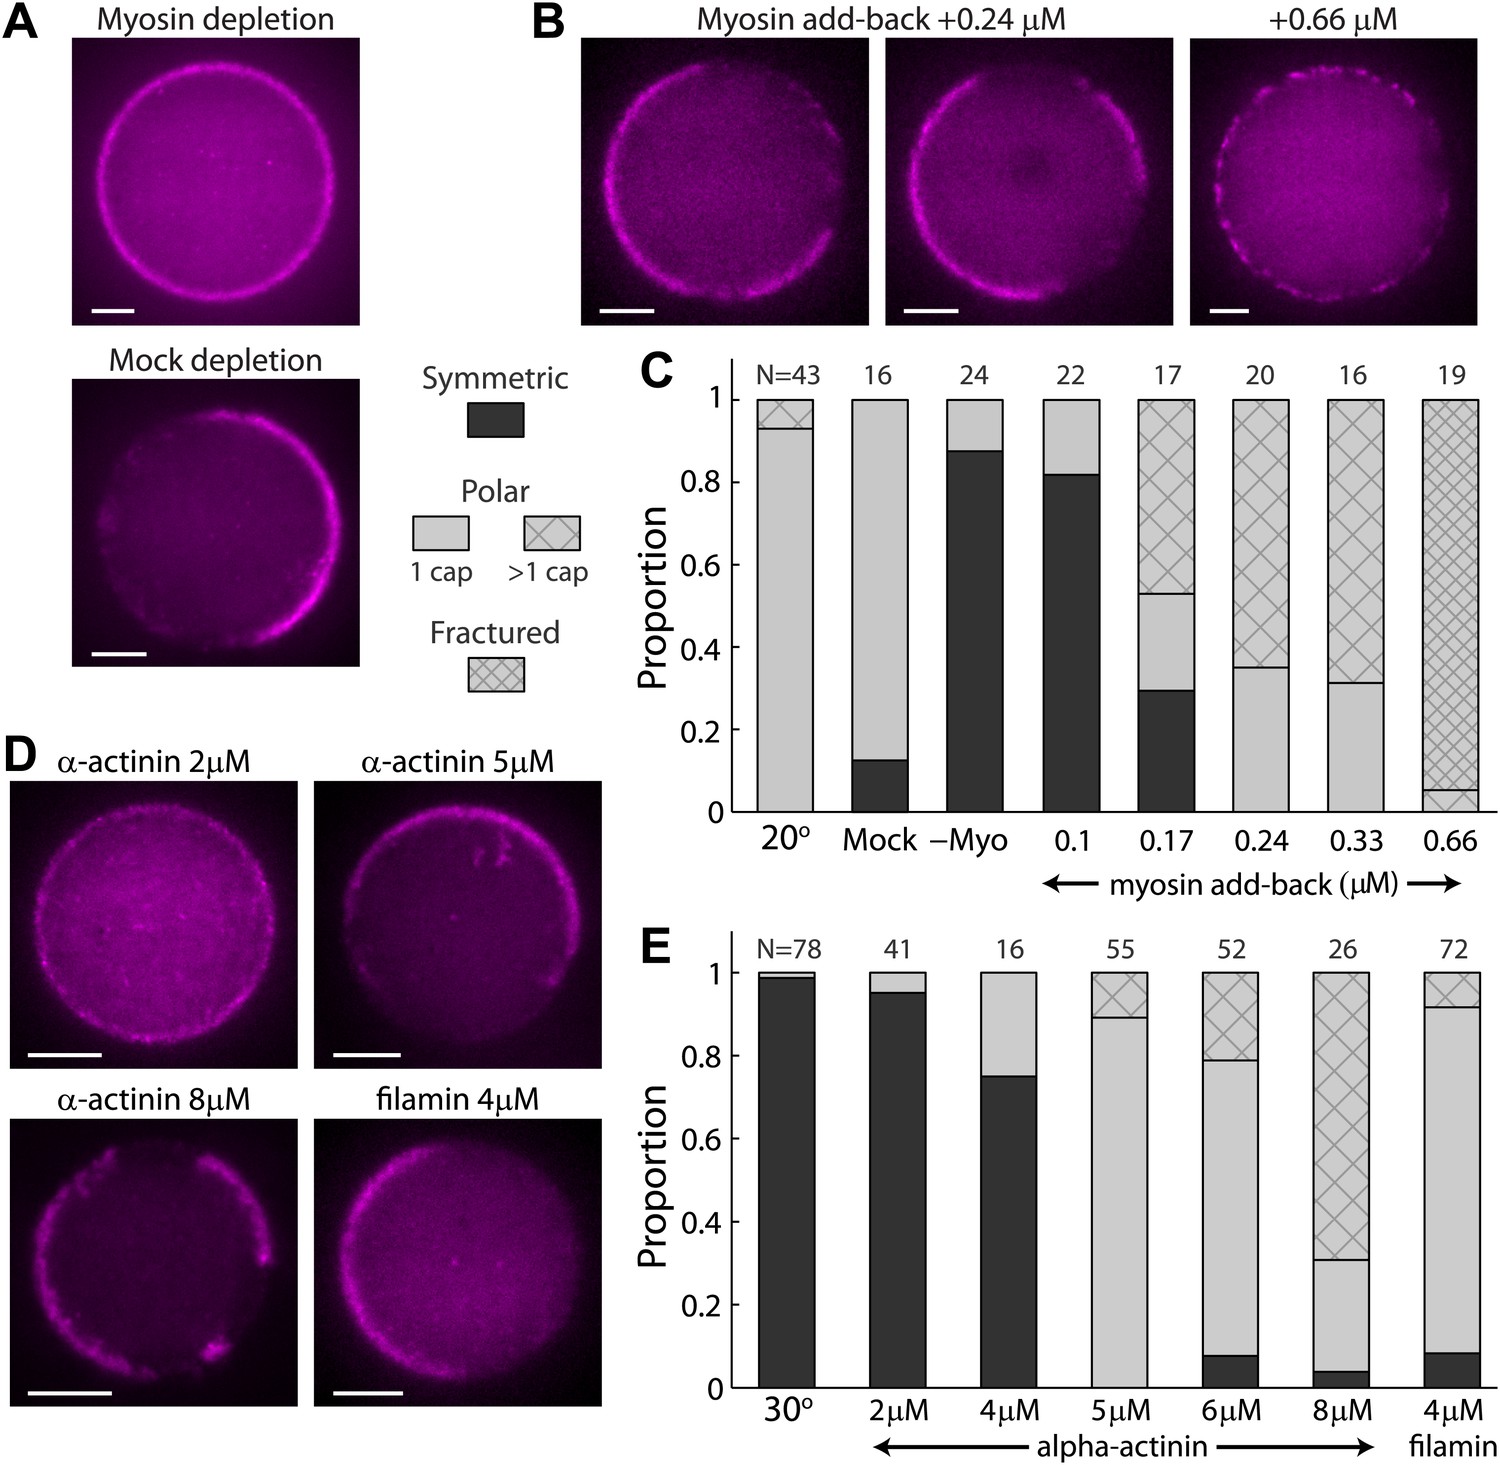
The effect of myosin and crosslinkers on symmetry breaking.
(A) Spinning disk confocal images of actin cortices in water-in-oil emulsions made with myosin–depleted (upper panel) or mock-depleted (lower panel) extracts and incubated at 20°C. Myosin depletion eliminates symmetry breaking, whereas a mock depletion does not. (B) Spinning disk confocal images of actin cortices made with myosin-depleted extracts supplemented with different amounts of purified myosin. At intermediate myosin concentrations (0.24 µM; left images) the actin cortices typically have one or few actin caps. At higher myosin concentrations (0.66 µM; right image) the actin cortices appear fractured with many discrete puncta along the interface. (C) Bar plot showing the relative proportion of symmetric (dark), polar cortices (light) with one (bare) or multiple (stripes) actin caps, or fractured cortices (dense stripes). Data is shown for a control sample of emulsions at 20°C, in comparison to samples prepared at the same temperature with myosin-depleted, mock-depleted extracts or myosin-depleted extracts supplemented with different amounts of purified myosin. (D) Spinning disk confocal images of actin cortices formed with extracts supplemented with different amounts of α-actinin or filamin crosslinkers and incubated at 30°C. (E) Bar plot showing the relative proportion of symmetric and polar cortices (as in (C)) for samples of emulsions made with different amounts of crosslinkers (2–8 µM α-actinin; 4 µM filamin) relative to a control sample at 30°C. The addition of crosslinkers induces symmetry breaking at 30°C. Note the large fractions of emulsions at higher α-actinin concentrations that exhibit multiple actin caps. Scale bars: 10 µm.
Figure 4 with 1 supplement
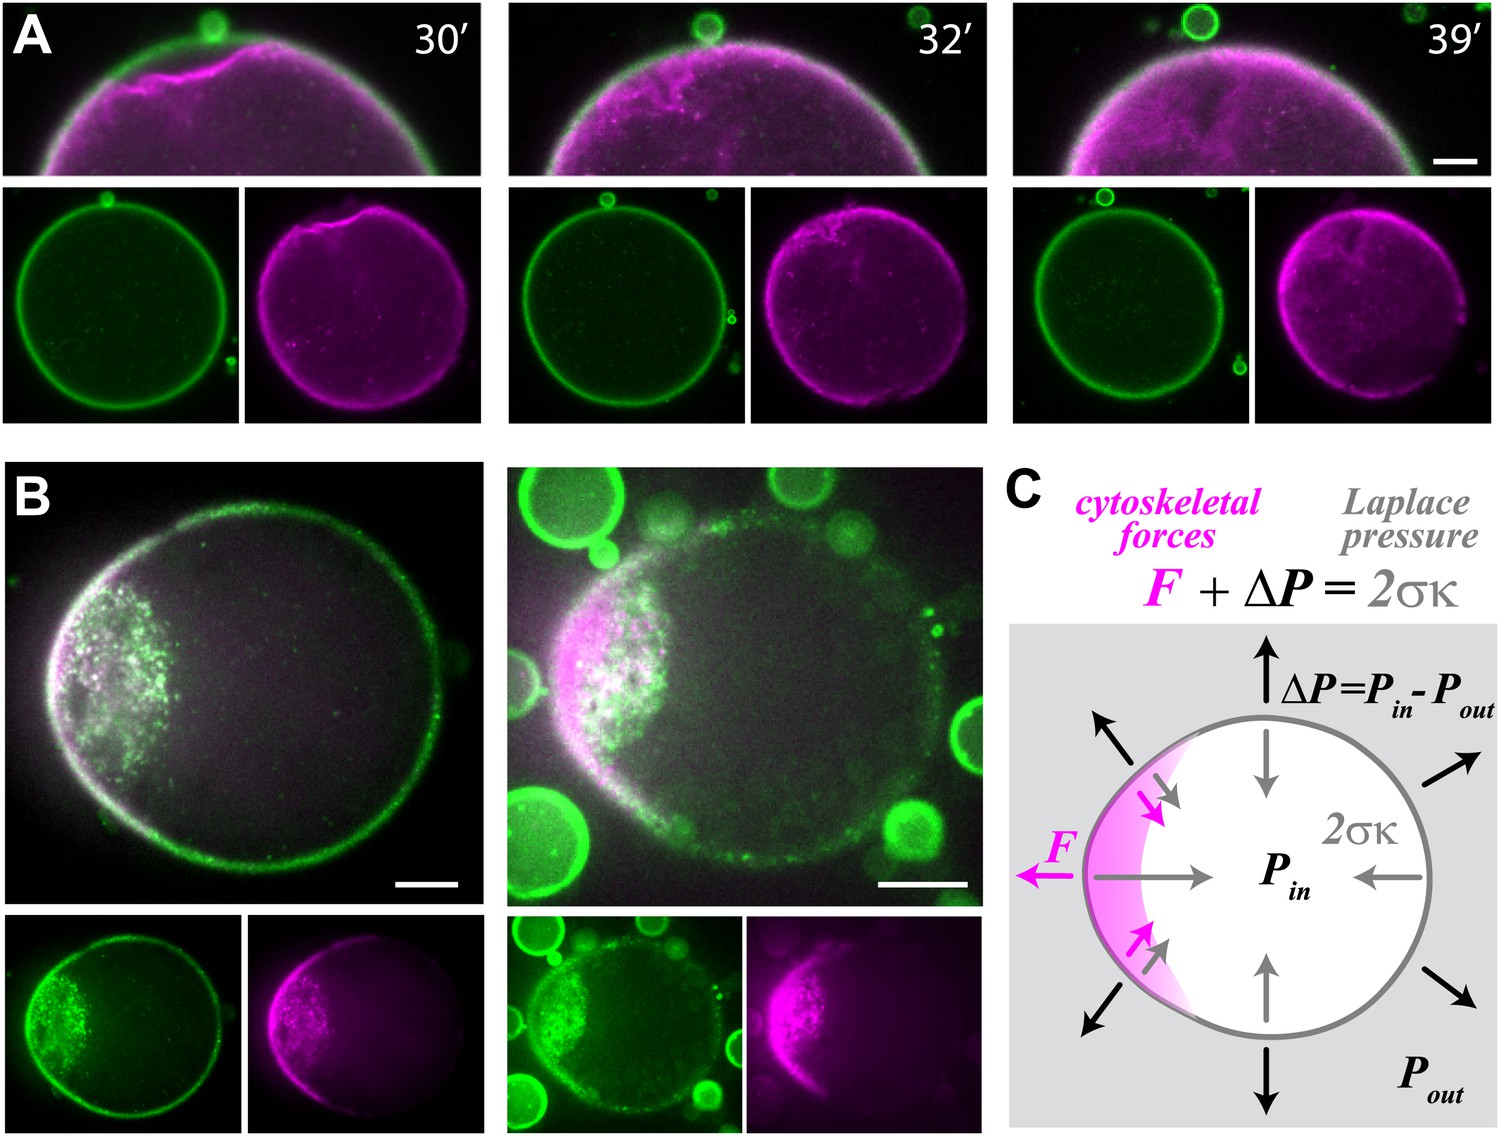
Cell-like behavior of reconstituted actin cortices.
(A) Scanning confocal images from a time-lapse video (Video 4) showing local detachment of an actin cortex from the interface followed by regrowth of a new cortex within minutes. The time after droplet formation is indicated. Images of the bodipy-conjugated ActA (green) and rhodamine-labeled actin (magenta) are depicted, together with an overlay of the detachment region (top). (B) Spinning disk confocal images of two representative water-in-oil emulsions incubated at 20°C, exhibiting polar actin cortices and deformed morphology. Images of the bodipy-conjugated ActA (green), rhodamine-labeled actin (magenta) and their overlay are shown. The asymmetric actin cortices generate polar forces which induce deformation of the droplets. Note the formation of a cytoplasmic concentration of actin and ActA near the deformed cap. The ActA distribution is polar in the example shown on the right, where the overall amount of ActA appears lower (Figure 4—figure supplement 1). (C) A schematic illustration of a deformed droplet and the forces at its interface. The cytoskeletal forces F and the pressure difference ΔP at the interface are balanced by the Laplace pressure which is proportional to the surface tension σ and the local mean curvature κ, so that . The pressure difference can be estimated from the curvature outside the cap and the known surface tension, since the cytoskeletal forces are assumed to be zero outside the cap. The protrusive force within the cap was estimated from the difference in the local curvatures in the cap region and outside the cap: . Scale bars: 10 µm.
Figure 4—figure supplement 1

Actin and ActA distributions in a deformed droplet.
The fluorescence intensity of rhodamine-labeled actin (top) and bodipy-conjugated ActA (bottom) extracted from spinning disk confocal images of the deformed emulsion shown in Figure 4B (insets) are depicted. The intensity across the droplet (left) is plotted together with the profiles along the boundary (right). The actin distribution is strongly peaked along the boundary in the cap region (top right). The ActA is also distributed asymmetrically along the boundary, yet exhibits a less pronounced peak at the cap (bottom right). Both the actin and ActA show extensive cytoplasmic localization near the cap in deformed emulsions (left).
Videos
Video 1
Cortical recovery after photobleaching.
This video shows scanning confocal images (at a single z-plane) of rhodamine-labeled actin within a water-in-oil emulsion incubated at 30°C. A small region of the cortex was photobleached using a high intensity laser pulse. The video follows the dynamics of cortex recovery over several minutes. The lower panel depicts the whole droplet. The field of view is 132 µm wide. The upper panel shows a zoomed area in the proximity of the bleached region. The time relative to the bleaching event is indicated.
Video 2
Actin cortical flow during symmetry breaking.
This video shows spinning disc confocal images (at a single z-plane) of rhodamine-labeled actin within a water-in-oil emulsion incubated at 20°C. The actin signal reflects the distribution of actin monomers and filaments. The actin cortex initiates in patches throughout the droplet’s interface. Cortical actin flows appear at the interface within minutes, leading to the formation of a polar actin cap. The field of view is 55 µm wide, and the time from droplet formation is indicated.
Video 3
Cortical recovery after photobleaching in an asymmetric actin cap.
This video shows scanning confocal images (at a single z-plane) of rhodamine-labeled actin within a water-in-oil emulsion incubated at 20°C. A small region at the tip of the actin cap was photobleached using a high intensity laser pulse. The video follows the dynamics of cortex recovery over several minutes. The lower panel depicts the whole droplet. The field of view is 132 µm wide. The upper panel shows a zoomed area in the proximity of the bleached region. The time relative to the bleaching event is indicated.
Video 4
Cytoskeletal forces in the actin cortex lead to bleb-like cortex detachment and shape deformation.
This video shows scanning confocal images (at a single z-plane) of bodipy-conjugated ActA (left), rhodamine-labeled actin (center) and an overlay (right), within a large water-in-oil emulsion incubated at 20°C. The contractile forces within the cortex led to detachment of the cortex from the interface. The cortex recovered within minutes by regrowth of a new cortex at the interface. The polar forces generated by the cortex also led to shape deformation which developed over time. The field of view is 109 µm wide, and the time from droplet formation is indicated.
Download links
A two-part list of links to download the article, or parts of the article, in various formats.
Downloads (link to download the article as PDF)
Open citations (links to open the citations from this article in various online reference manager services)
Cite this article (links to download the citations from this article in formats compatible with various reference manager tools)
Symmetry breaking in reconstituted actin cortices
eLife 3:e01433.
https://doi.org/10.7554/eLife.01433


