T cell immunodominance is dictated by the positively selecting self-peptide
- Washington University School of Medicine, United States
Figures
Figure 1
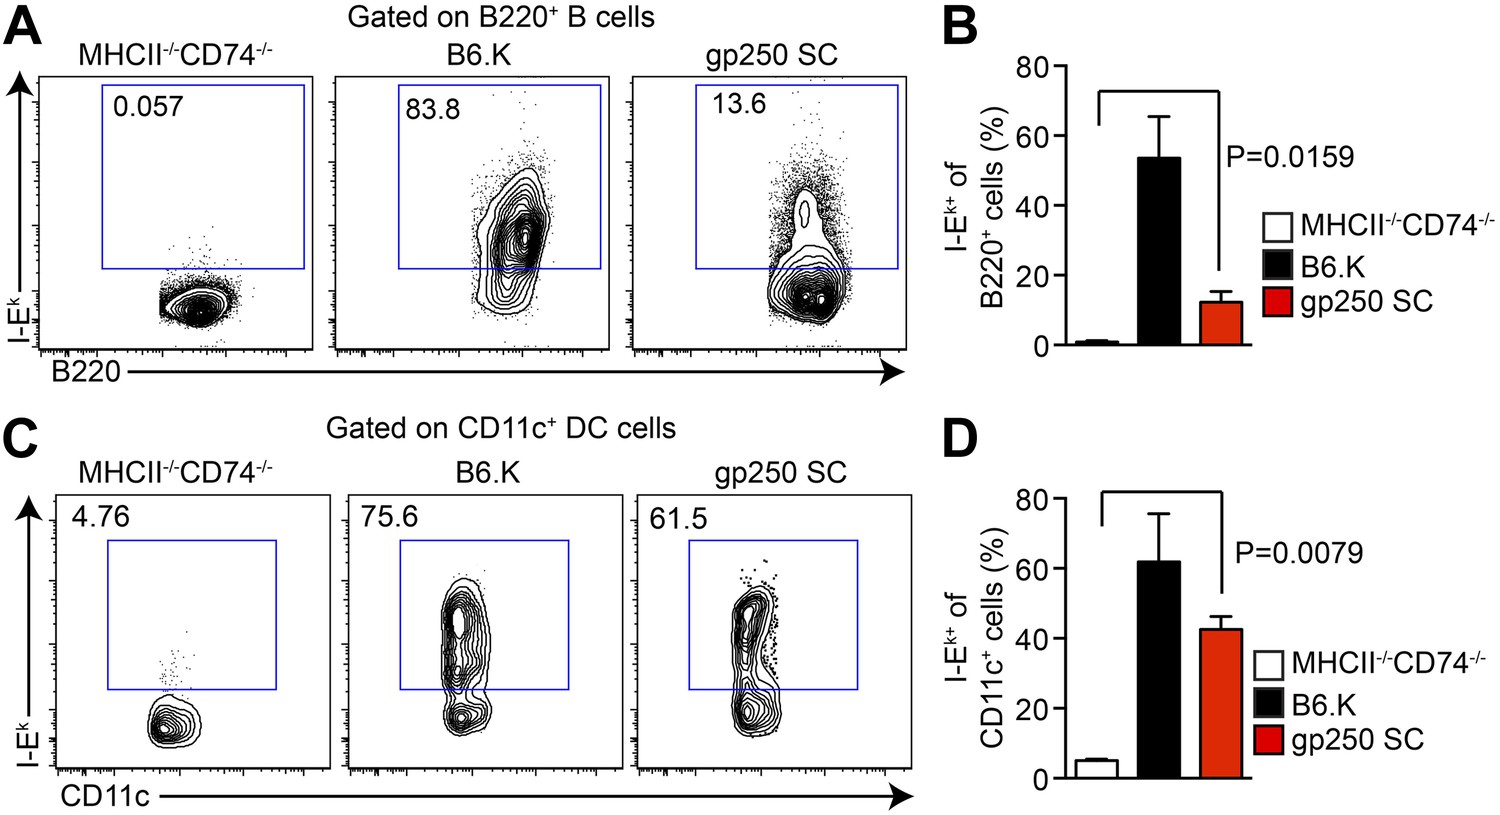
The I-Ekα and covalently-linked gp250/I-Ekβ transgenes restore surface expression of I-Ek in gp250 SC mice class II-deficient mice.
The surface expression of I-Ek on B cells (A and B) and dendritic cells (C and D) from the spleens of gp250 SC mice. The B cells and dendritic cells from MHCII−/−CD74−/− mice were used as negative controls. The plots are representative of three independent experiments (A and C) and summarized in the bar graph (B and D; mean ± SD; n = 3; two-tailed Mann–Whitney test).
Figure 2 with 1 supplement
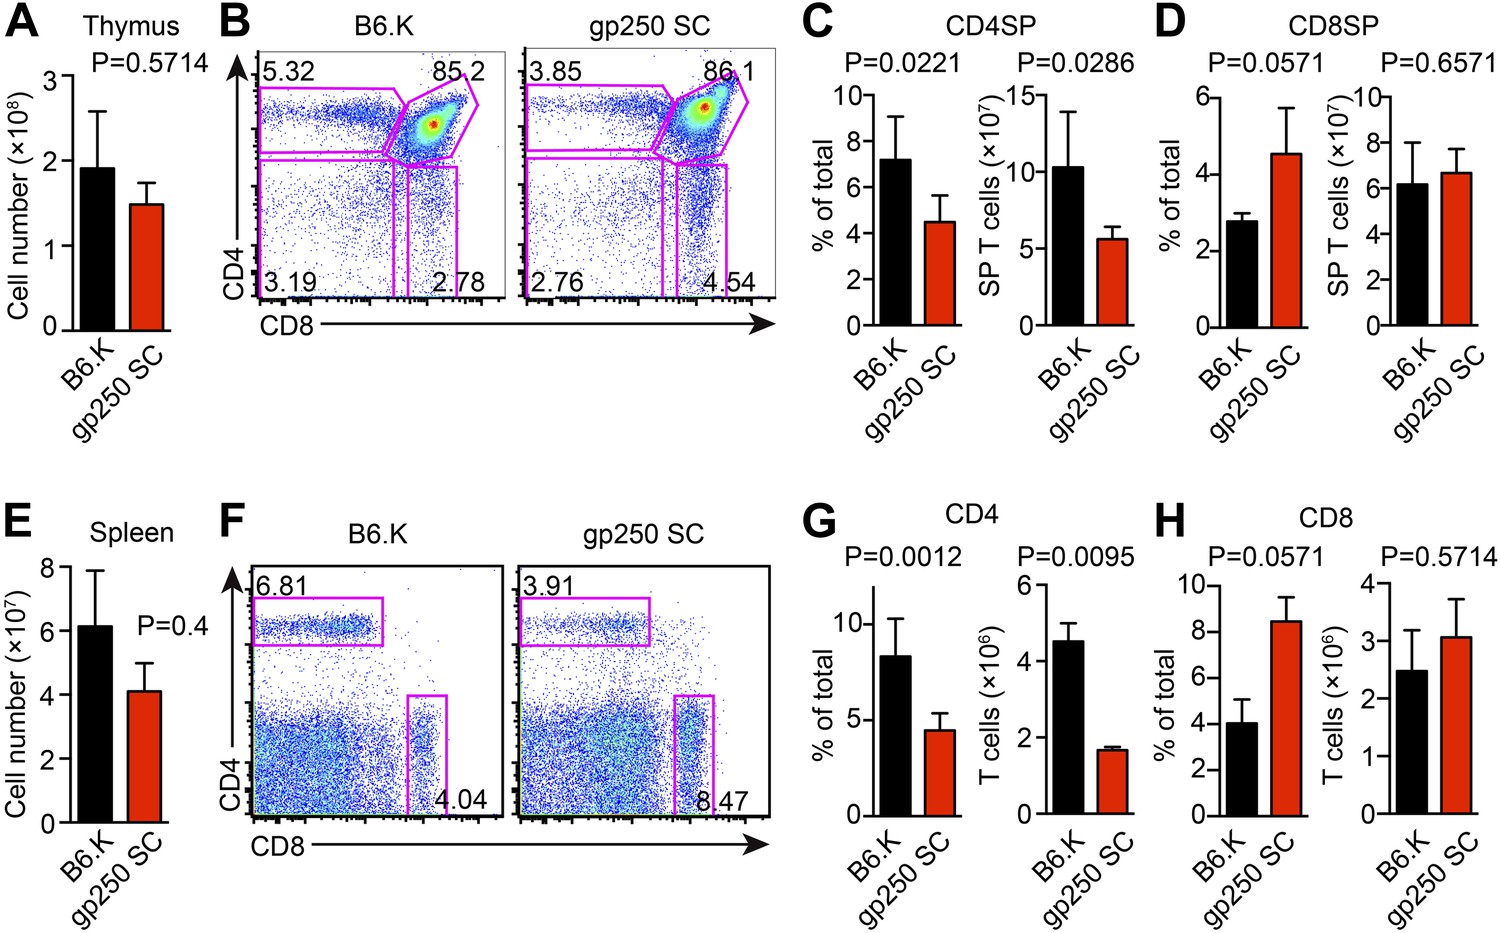
The single gp250/I-Ek ligand positively selects a significant population of CD4+ T cells in gp250 SC mice.
(A) Total number of thymocytes in B6.K or gp250 SC mice. (B) Plot of thymocytes from B6.K or gp250 SC mice. (C and D) Quantification by percentage of CD4SP (C) or CD8SP (D) thymocytes, and of total number of CD4SP (C) or CD8SP (D) in B6.K or gp250 SC mice are shown in the bar graph. (E) Total number of splenocytes in B6.K or gp250 SC mice. (F) Plot of splenocytes from B6.K or gp250 SC mice. (G and H) Quantification by percentage of CD4+ (G) or CD8+ (H) T cells and of total CD4+ (G) or CD8+ (H) T cell numbers in the spleens of B6.K or gp250 SC mice are shown in the bar graph. (A–H) The data are representative of three experiments (B6.K, n = 7; gp250 SC, n = 6; mean ± SD; two-tailed Mann-Whitney test).
Figure 2—figure supplement 1
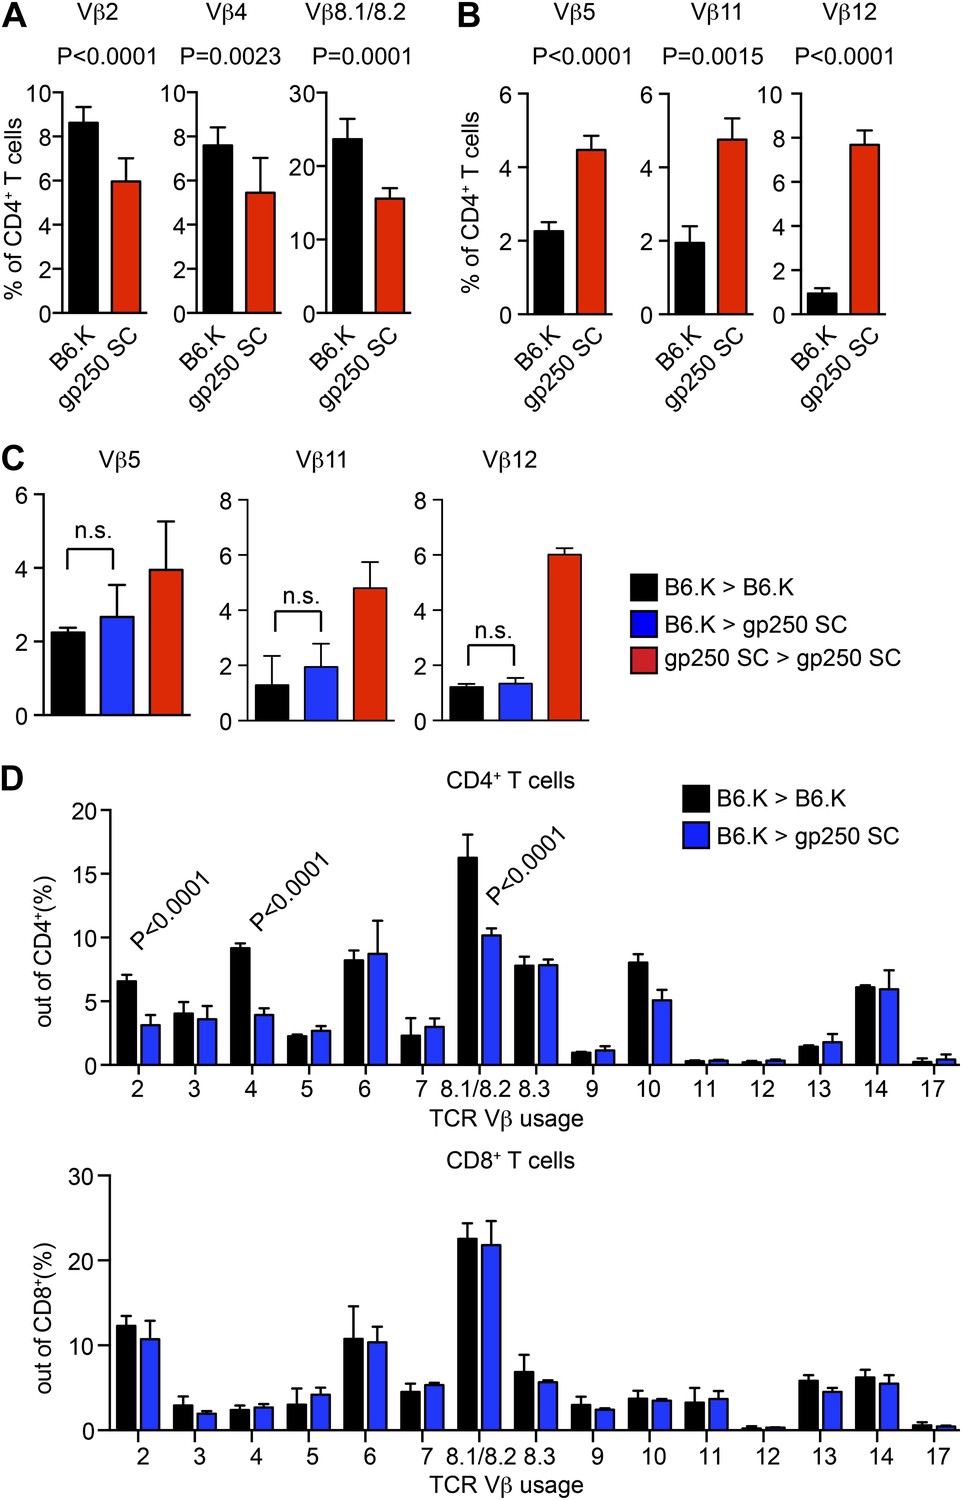
TCR Vβ usages of peripheral T cells in gp250 SC mice.
(A and B) Vβs expression of peripheral CD4+ T cells in B6.K or gp250 SC mice. The frequencies of three Vβs were decreased (A) and three were increased (B). n = 9; data are representative of three experiments. n = 4; mean ± SD; two-tailed Mann–Whitney test. (C and D) B6.K HSC cells were used to reconstitute lethally irradiated gp250 SC or B6.K mice. After a 12-week reconstitution, Vβx expression repertoire in CD4+ or CD8+ T cells were examined (D), and the frequencies of Vβs that were increased in gp250 SC mice (B) were shown in (C). n = 5; the data are representative of three experiments. n = 4; mean ± SD; two-tailed Mann–Whitney test.
Figure 3
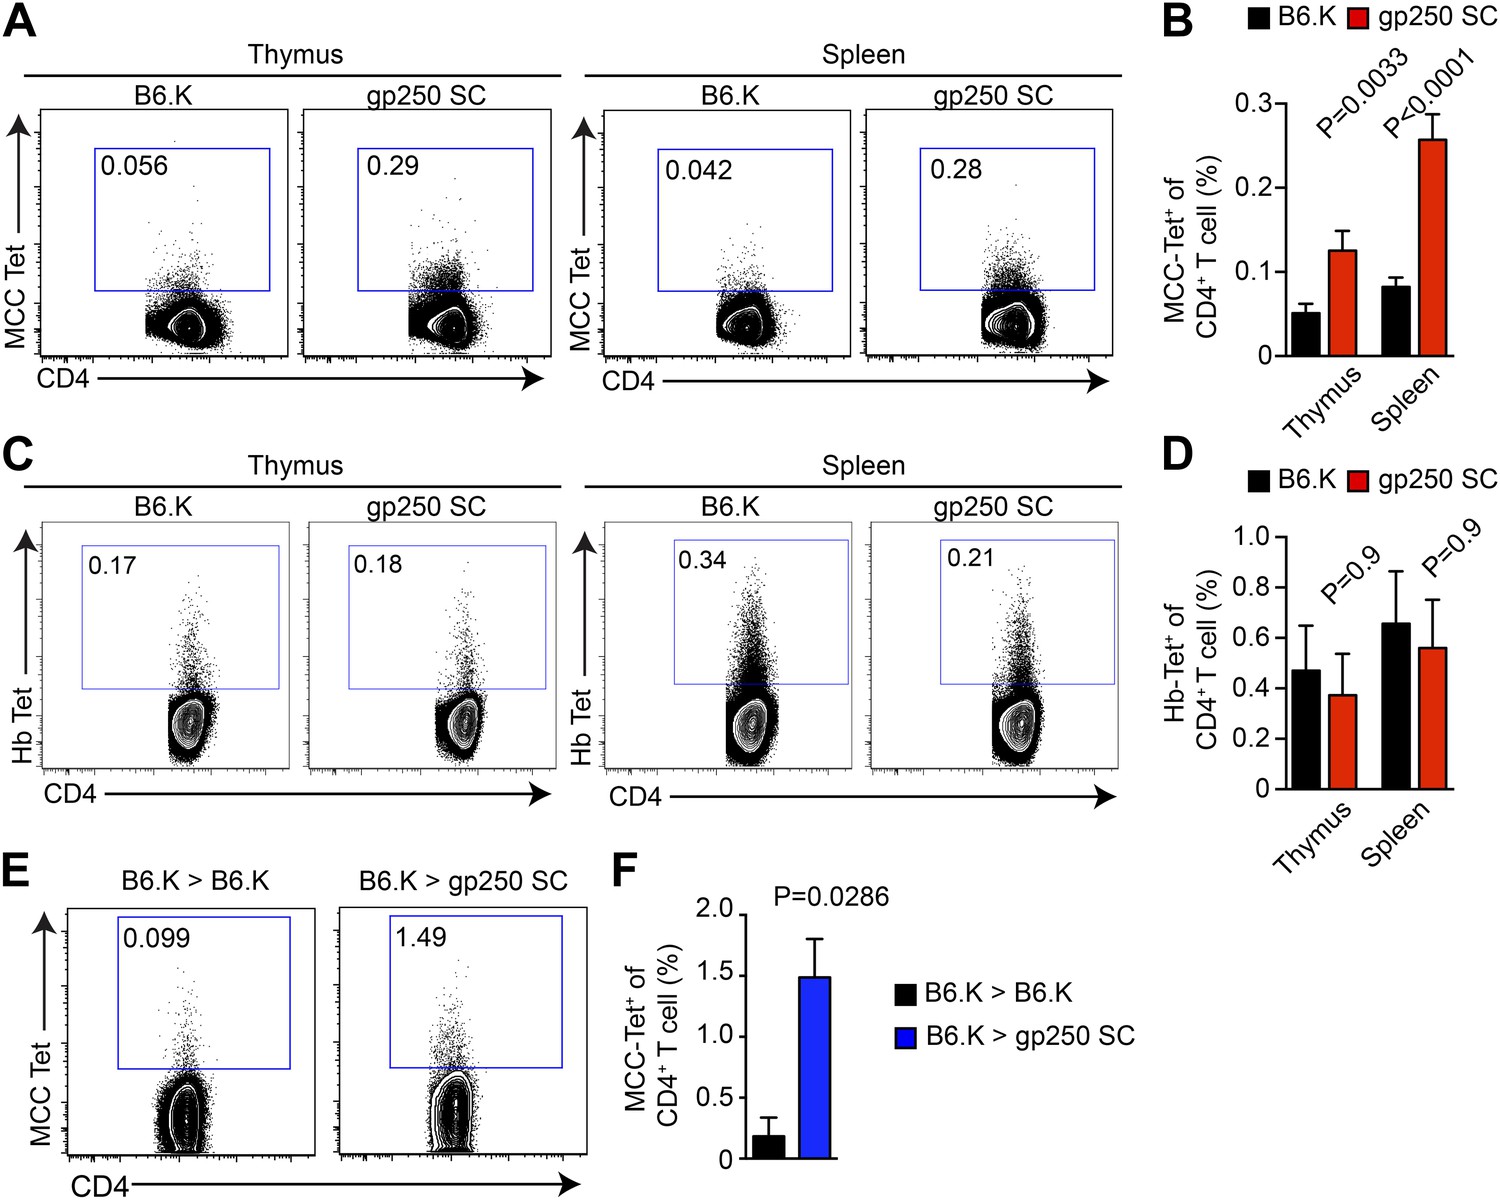
gp250-mediated positive selection greatly expands MCC-tetramer+ CD4+ T cells.
(A and B) The frequency of MCC-tetramer+ CD4SP thymocytes or peripheral CD4+ T cells in B6.K or gp250 SC mice. The plot was gated on the live CD4+CD3+CD8− population. The data are representative of at least five experiments. Bar graph shows the summary (B; thymus, n = 12; spleen, n = 17; mean ± SD; two-tailed Mann–Whitney test). (C and D) The frequency of Hb-tetramer+ CD4SP thymocytes or peripheral CD4+ T cells in B6.K or gp250 SC mice. The plot was gated on live CD4+CD3+CD8− population. The data are representative of at least three experiments. (D): n = 3; mean ± SD; two-tailed Mann–Whitney test. (E and F) The frequency of MCC-tetramer+ peripheral CD4+ T cells in B6.K or gp250 SC bone marrow chimeras reconstituted with B6.K bone marrows. (F): n = 4; mean ± SD; two-tailed Mann–Whitney test.
Figure 4

The majority of gp250-selected MCC-specific CD4+ T cells express Vα11+ TCR.
(A and B) The Vα11 expression of MCC-tetramer+ peripheral CD4+ T cells in B6.K or gp250 SC mice. (B) n = 6; mean ± SD; two-tailed Mann–Whitney test. (C and D) The CD69 upregulation of sorted MCC-tetramer− or MCC-tetramer+ CD4+ T cells from B6.K or gp250 SC splenocytes. Data are representative of three experiments. (D): n = 3, paired t tests.
Figure 5
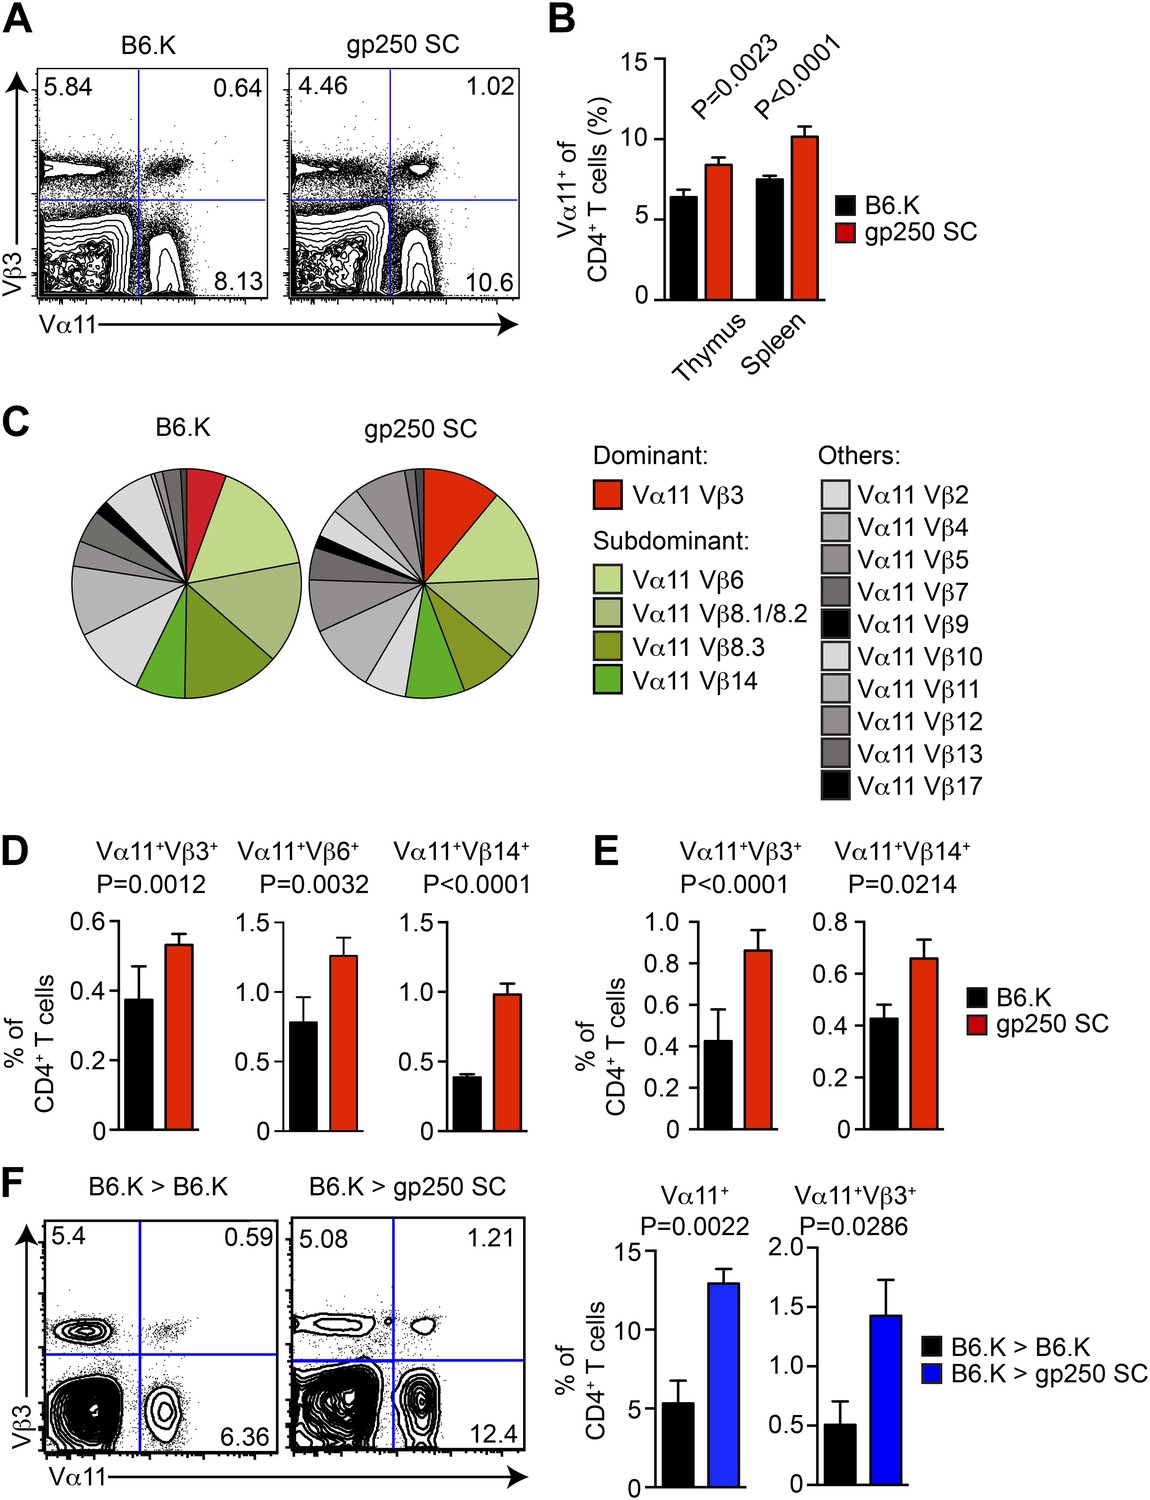
The gp250 self-peptide skews the selection of MCC-reactive preferred TCR pairs.
(A) The Vα11 and Vβ3 expression of thymic CD4SP or peripheral CD4+ T cells in B6.K or gp250 SC mice. The data are representative of three experiments. (B) The quantification by percentage of Vα11+ CD4SP thymocytes or CD4+ peripheral T cells in B6.K or gp250 SC mice. n = 7; mean ± SD; two-tailed Mann–Whitney test. (C) The distribution of Vβ usages among Vα11+ CD4SP thymocytes or CD4+ peripheral T cells in B6.K or gp250 SC mice. The pie chart was plotted with the mean of three experiments (n = 7). (D and E) The quantification of increased dominant and subdominant MCC-reactive TCR pairs of CD4SP thymocytes or CD4+ peripheral T cells in B6.K or gp250 SC mice. n = 7; mean ± SD; two-tailed Mann–Whitney test. (F) The Vα11 and Vβ3 expression of thymic CD4SP or peripheral CD4+ T cells in B6.K or gp250 SC bone marrow chimeras reconstituted with B6.K HSC cells. The data are representative of three experiments. n = 4; mean ± SD; two-tailed Mann–Whitney test.
Figure 6
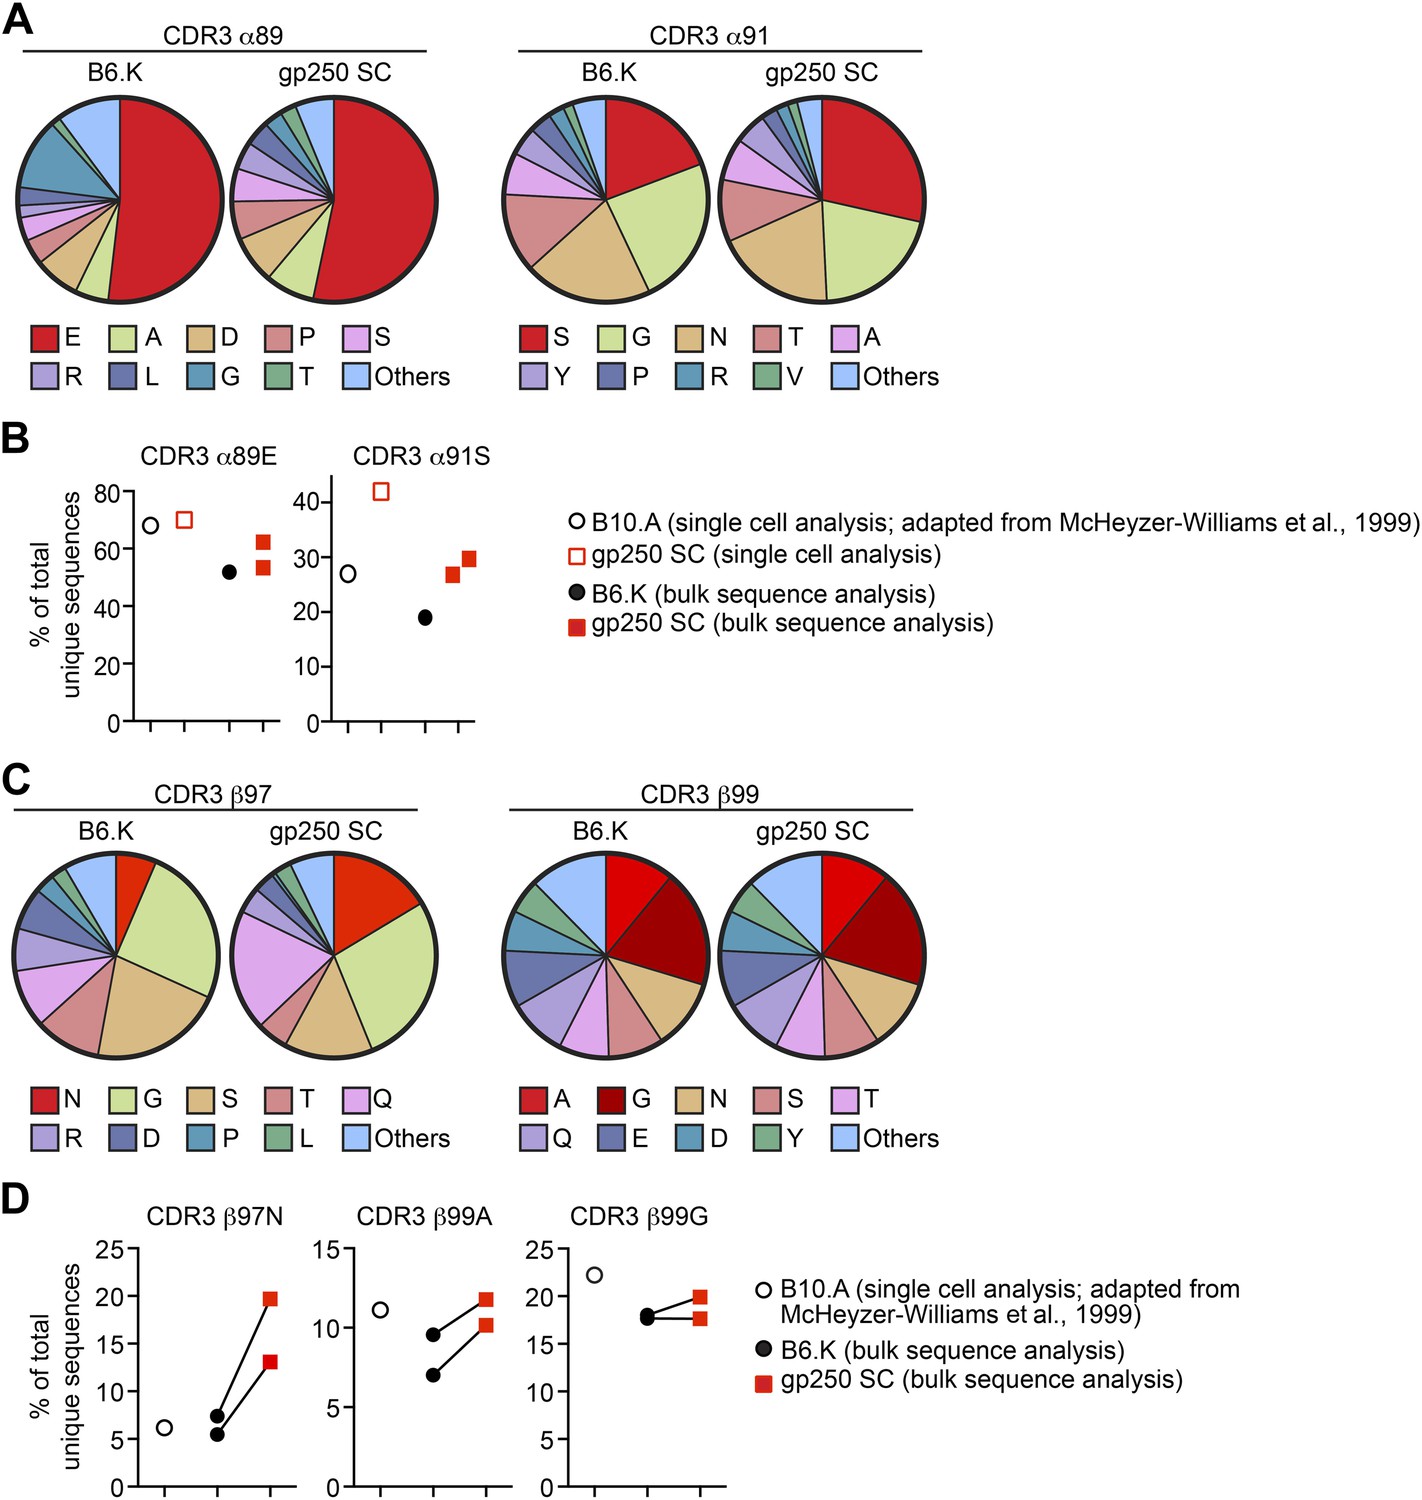
The gp250 self-peptide skews the selection of TCRs exhibiting conserved MCC-reactive features.
(A) The pie chart of amino acid usages at CDR3 α89 and α91 of bulk-sorted peripheral Vα11+Vβ3+ CD4+ T cells in B6.K or gp250 SC mice. The gp250 SC data were obtained by single cell repertoire analysis. (B) The frequency of MCC-reactive preferred CDR3α amino acids, α89N and α91E from gp250-selected peripheral Vα11+Vβ3+ CD4+ T cells in single cell analysis (left) or bulk population analysis (right). (C) The pie chart of amino acid usages at CDR3 β97 and β99 from bulk-sorted peripheral Vα11+Vβ3+ CD4+ T cells in B6.K or gp250 SC mice. The data were representative of two independent experiments. (D) The frequencies of CDR3 β97N, β99A, and β99E of Vα11+Vβ3+ CD4+ T cells in B6.K or gp250 SC mice. (B and D) The single cell B10.A data were plotted based on McHeyzer-Williams et al. (1999) published data.
Figure 7
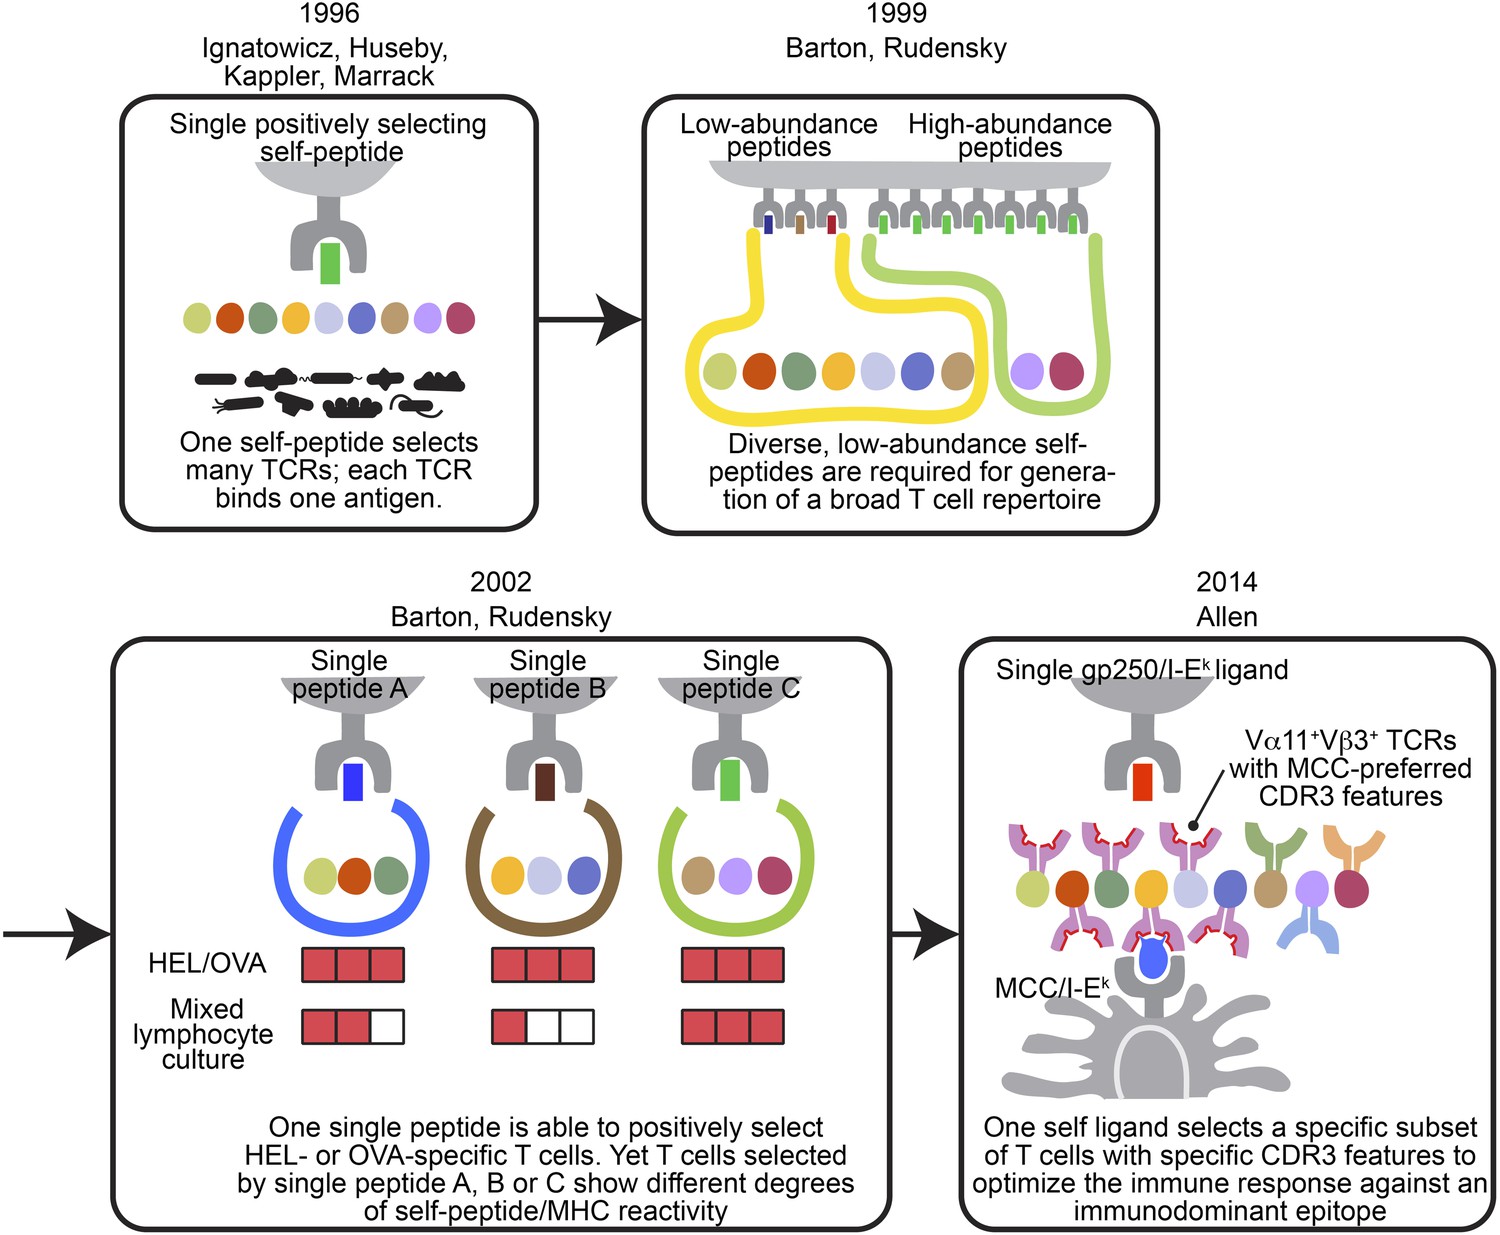
The evolving concepts of the relationship between positively selecting self-peptide and post-selection T cell repertoire.
The figures show the progress of our understanding about the relationship between thymic self-peptides and post-selection CD4+ T cell repertoire, and are arranged in chorological order. The first finding from late 90′ revealed that one positively selecting self-peptide was capable of selecting many different TCRs (Ignatowicz et al., 1996; Ignatowicz et al., 1997; Liu et al., 1997; Huseby et al., 2005). A few years later, Barton and Rudensky proposed that even though one self-peptide may select many TCRs, a diverse low abundant self-peptide repertoire is required to generate a full TCR repertoire (Barton and Rudensky, 1999). Subsequently, with the publication of a series of single chain mice, the model was further refined because even though the TCR repertoire selected by one single ligand was not reduced significantly enough to allow an visualization of a repertoire ‘hole’, the postselection T cells in each single chain mouse showed different degrees of self-peptide reactivity in mixed lymphocyte culture (Barton et al., 2002). These studies showed that a diverse collection of positively selecting self-peptides were necessary to generate a full T cell repertoire (Barton and Rudensky, 1999; Barton et al., 2002). This present study involving the gp250 self-peptide showed increased frequency of Vα11+Vβ3+ CD4+ T cells with MCC-preferred CDR3 features in gp250 SC mice. The Vα11+Vβ3+ CD4+ T cells with specific CDR3 features were the dominant responders to promote MCC primary and memory responses. Therefore, gp250’s selecting capability provided a possible explanation to elucidate Vα11+ TCR-driven MCC immunodominance: a positively selecting self-peptide may favor the selection of TCR pairs and CDR3 features that were specific for MCC responses.
Tables
Table 1
Examples of CDR3α sequences of Vα11+Vβ3+ CD4+ T cells from gp250 SC mice in the single cell repertoire analysis
| CDR3α sequences | Jα usages | Frequency | Notes |
|---|---|---|---|
| CAAEASSGSWQLIF | TCRA17 | 21% (8/38) | Also published in McHeyzer-Williams et al. (1999) |
| CAAEANSGTYQRF | TCRA11 | 7.8% (3/38) | |
| CAAEAGGGSGGKLTL | TCRA36 | 5.2% (2/38) | |
| CAAEASSGQKLVF | TCRA13 | 5.2% (2/38) | AND TCR CDR3α; also published in McHeyzer-Williams et al. (1999) |
| CAAEPPHANTGANTGKLTF | TCRA44 | 5.2% (2/38) | |
| CAANTGNYKYVF | TCRA33 | 5.2% (2/38) | |
| CAADRSNNRIFF | TCRA24 | 5.2% (2/38) | |
| CAAEPSSFSKLVF | TCRA24 | 2.6% (1/38) | |
| CAAESSNMGYKLTF | TCRA8 | 2.6% (1/38) | |
| CAARSSNTNKVVF | TCRA8 | 2.6% (1/38) |
Table 2
The single cell repertoire analysis of Vα11+Vβ3+ CD4+ T cells from gp250 SC mice
| CDR3α sequences | Jα usages | CDR3β sequences | Jβ usages |
|---|---|---|---|
| CAADRSNNRIFF | TCRA17 | CASSKQANSYNSPLYF | Jβ2.4 |
| CAAESSNMGYKLTF | TCRA24 | CASSGDGRGNTLYF | Jβ1.8 |
| CAARSSNTNKVVF | TCRA27 | CASSLWANTGQLYF | Jβ2.2 |
| CAAEANSGTYQRF | TCRA11 | CASSLLHKQYF | Jβ2.1 |
| CAAEASSGSWQLIF | TCRA17 | CASSPGTQNTLYF | Jβ2.4 |
Table 3
The CDR3 sequences of bulk-sorted Vα11+Vβ3+ CD4+ T cells from gp250 SC mice that overlap with the published data from normal mice (Hedrick et al., 1988; McHeyzer-Williams et al., 1999)
| Published CDR3α (Hedrick et al., 1988; McHeyzer-Williams et al., 1999) | Current study | Notes | |
|---|---|---|---|
| B6.K | SC | ||
| 3623 | 2906 | Unique sequences | |
| CAAEASSGQKLVFG | + | + | AND TCR |
| CAAEPSSGQKLVFG | + | + | 226 TCR |
| CAAEASGSWQLIFG | + | + | |
| CAAEASNTNKVVFG | + | + | 5c.c7 TCR |
| CAAEGSNTNKVVFG | + | ||
| CAAEASAGNKLTFG | + | + | |
| CAAASSGSWQLIFG | + | + | |
| CAAEAGSNAKLTFG | + | + | |
| CAAEASNNNAPRFG | + | ||
| CAAEAASLGKLQFG | + | + | |
| CAAEASSGSWQLIFG | + | + | |
| CAAEASNYNVLYFG | + | + | |
| CAAEASSSFSKLVFG | + | + | |
| CAAEASNMGYKLTFG | + | + | |
| CAAETGGYKVVFG | + | + | |
| CAAEANYNQGKLIFG | + | + | |
| CAAEAGSGTYQRFG | + | + | |
| CAGLSGSFNKLTFG | + | + | |
| CAAEGNTGNYKYVFG | + | ||
| CAAEEGNMGYKLTFG | + | + | |
| CAATSSGQKLVFG | + | ||
| Published CDR3β (Hedrick et al., 1988; McHeyzer-Williams et al., 1999) | Current study | Notes | |
|---|---|---|---|
| B6.K | SC | ||
| 2821 | 1583 | Unique sequences (mean) | |
| CASSLNSANSDY | + | AND, 5c.c7, 226 TCRs | |
| CASSLNNANSDY | + | + | |
| CASSLSTSQNTLYF | + | ||
| CASSLQGTNTEVFF | + | + | |
| CASRLGQNTLYF | + | ||
| CASSLGASAETLYF | + | ||
Download links
A two-part list of links to download the article, or parts of the article, in various formats.
Downloads (link to download the article as PDF)
Open citations (links to open the citations from this article in various online reference manager services)
Cite this article (links to download the citations from this article in formats compatible with various reference manager tools)
T cell immunodominance is dictated by the positively selecting self-peptide
eLife 3:e01457.
https://doi.org/10.7554/eLife.01457


