Identification of an LGP2-associated MDA5 agonist in picornavirus-infected cells
- Cancer Research UK, London Research Institute, United Kingdom
- Utrecht University, Netherlands
Figures
Figure 1 with 2 supplements
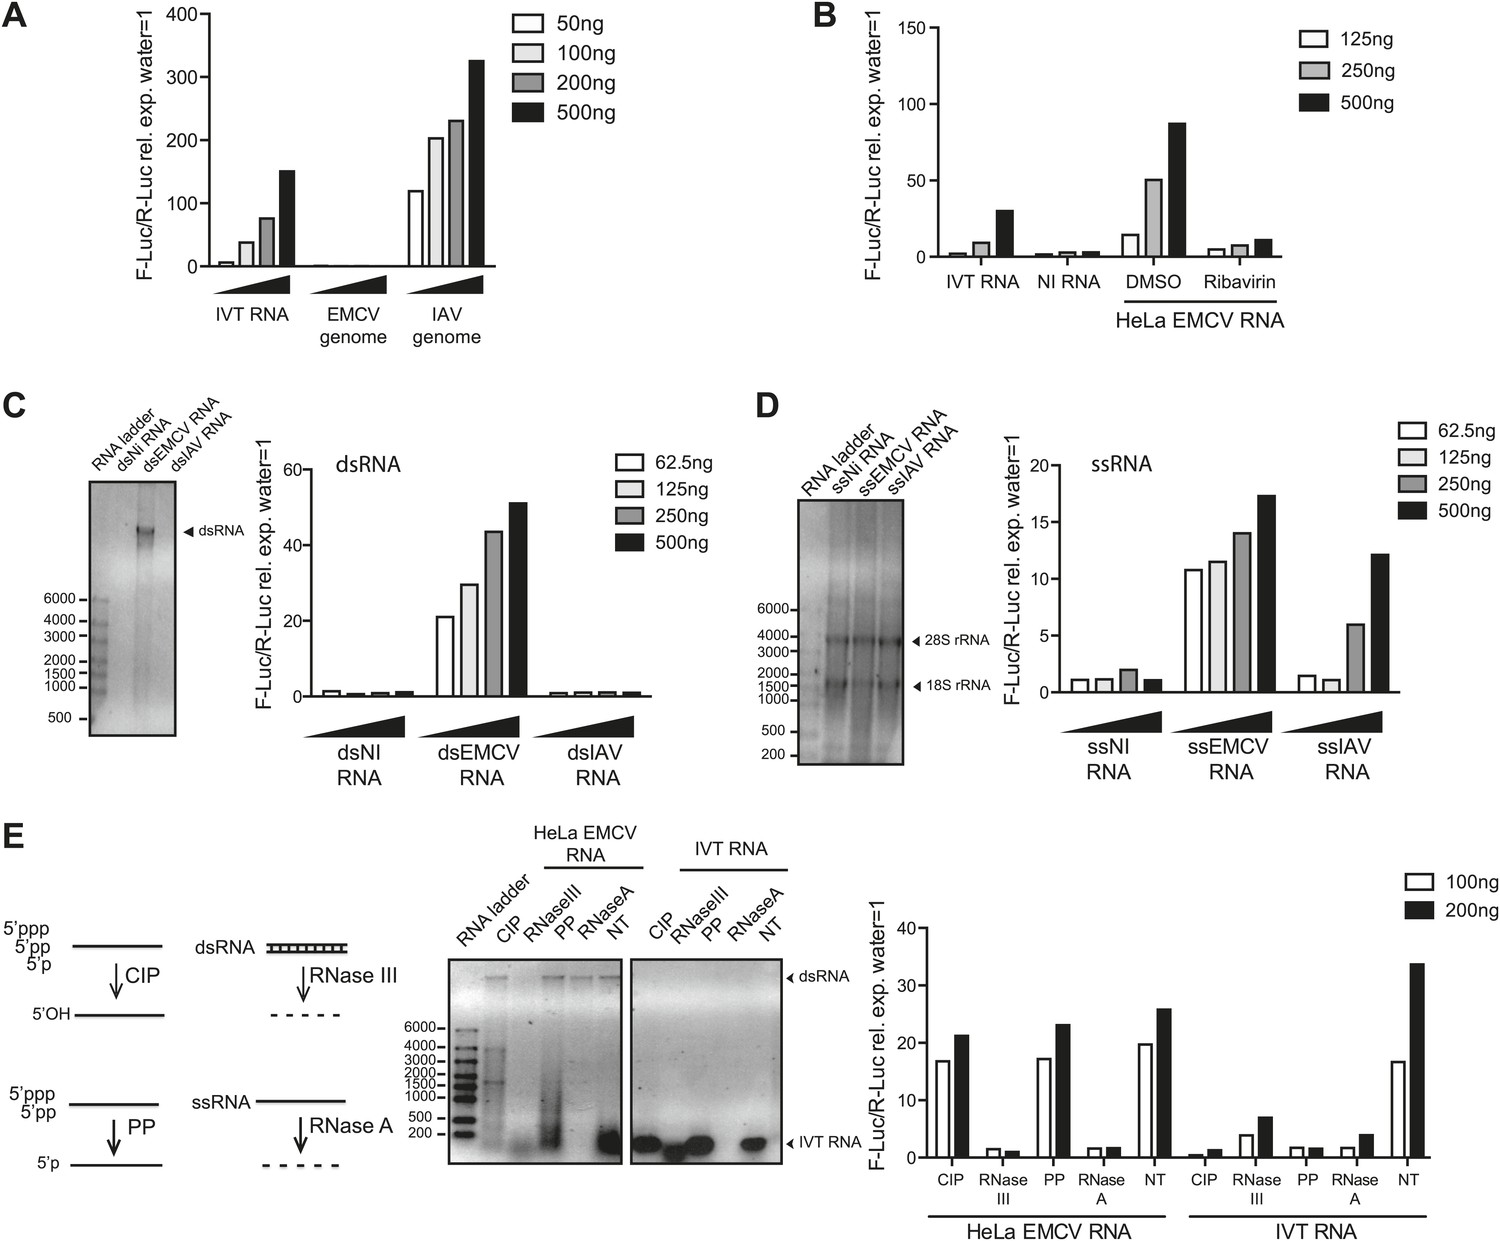
IFN-α/β induction requires EMCV replication.
(A) EMCV and IAV RNA genomes were extracted from purified viral particles and tested at the indicated doses in an IFN-β promoter luciferase reporter assay in HEK293 cells in the presence of ribavirin. IVT-RNA was included as a positive control. (B) HeLa cells were infected with EMCV (MOI 1) for 16 hr in the presence of DMSO or ribavirin. RNA was extracted (HeLa EMCV RNA) and tested at the indicated doses in the IFN-β promoter luciferase reporter assay in HEK293 cells. RNA extracted from uninfected HeLa cells (NI RNA) and IVT-RNA were included as negative and positive controls, respectively. (C and D) HeLa cells were either not infected (NI) or infected with EMCV or IAV at MOI 1 for 16 hr. RNA was extracted from cell lysates and separated into double-stranded (ds; panel C) or single-stranded (ss; panel D) fractions. The fractions were analysed on a 1% agarose gel and the indicated amounts of RNA were then tested at the indicated doses in the IFN-β promoter luciferase reporter assay in HEK293 cells. dsRNA bands are indicated on the gel picture. ssRNA runs as a smear and only the ribosomal RNA bands are identifiable, as indicated. ssRNA was used as a ladder. Although the experiment depicted was carried out in the absence of ribavirin, identical results were obtained in the presence of the drug indicating that the stimulatory capacity of ssRNA fractions is not due to subsequent replication and formation of dsRNA (data not shown). (E) Total RNA from HeLa cells infected with EMCV at MOI 1 for 16 hr (HeLa EMCV RNA) or control IVT RNA was either left untreated (NT) or digested with calf intestinal phosphatase (CIP), base-paired specific RNase (RNaseIII), 5′ RNA polyphosphatase (PP), or single-strand-specific RNAse (RNaseA). Digested RNA samples were analysed on a 1% agarose gel and the indicated amounts of RNA were tested in the IFN-β promoter luciferase reporter assay in HEK293 cells. One representative of three (A, C, D) or two (B and E) experiments is shown.
Figure 1—figure supplement 1
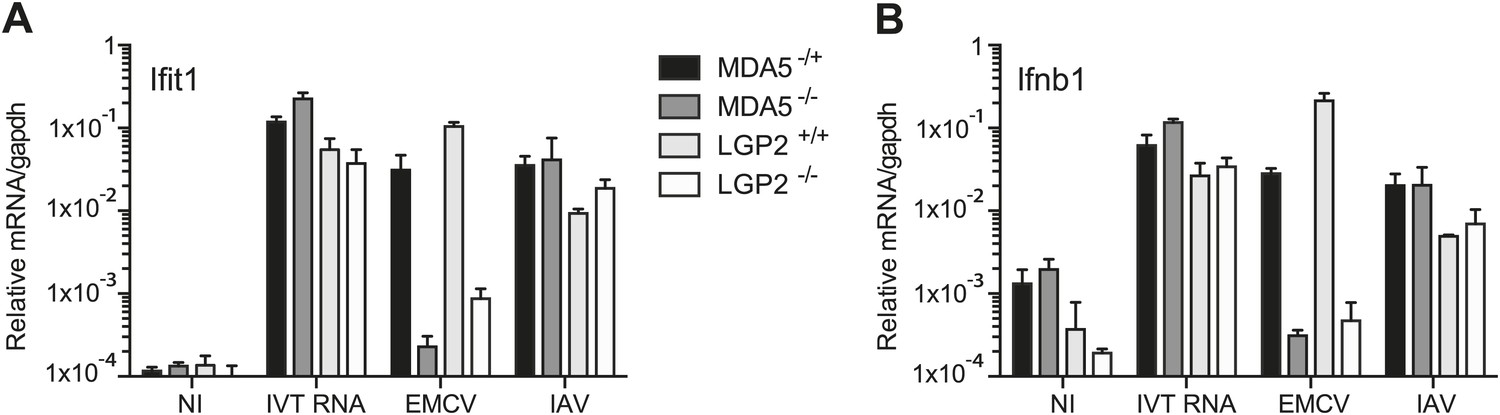
LGP2 and MDA5 are required for IFN-α/β production in response to EMCV.
(A and B) MEFs of the indicated genotypes were either not infected (NI), infected with EMCV or IAV at an MOI of 1, or transfected with 1 μg of in vitro transcribed RNA (IVT RNA). Ifit1 (A) and Ifnb1 (B) mRNA was measured 16 hr posttreatment by quantitative RT-PCR and normalised to gapdh. Error bars represent standard deviation of three biological replicates. Data are from one representative of two experiments.
Figure 1—figure supplement 2
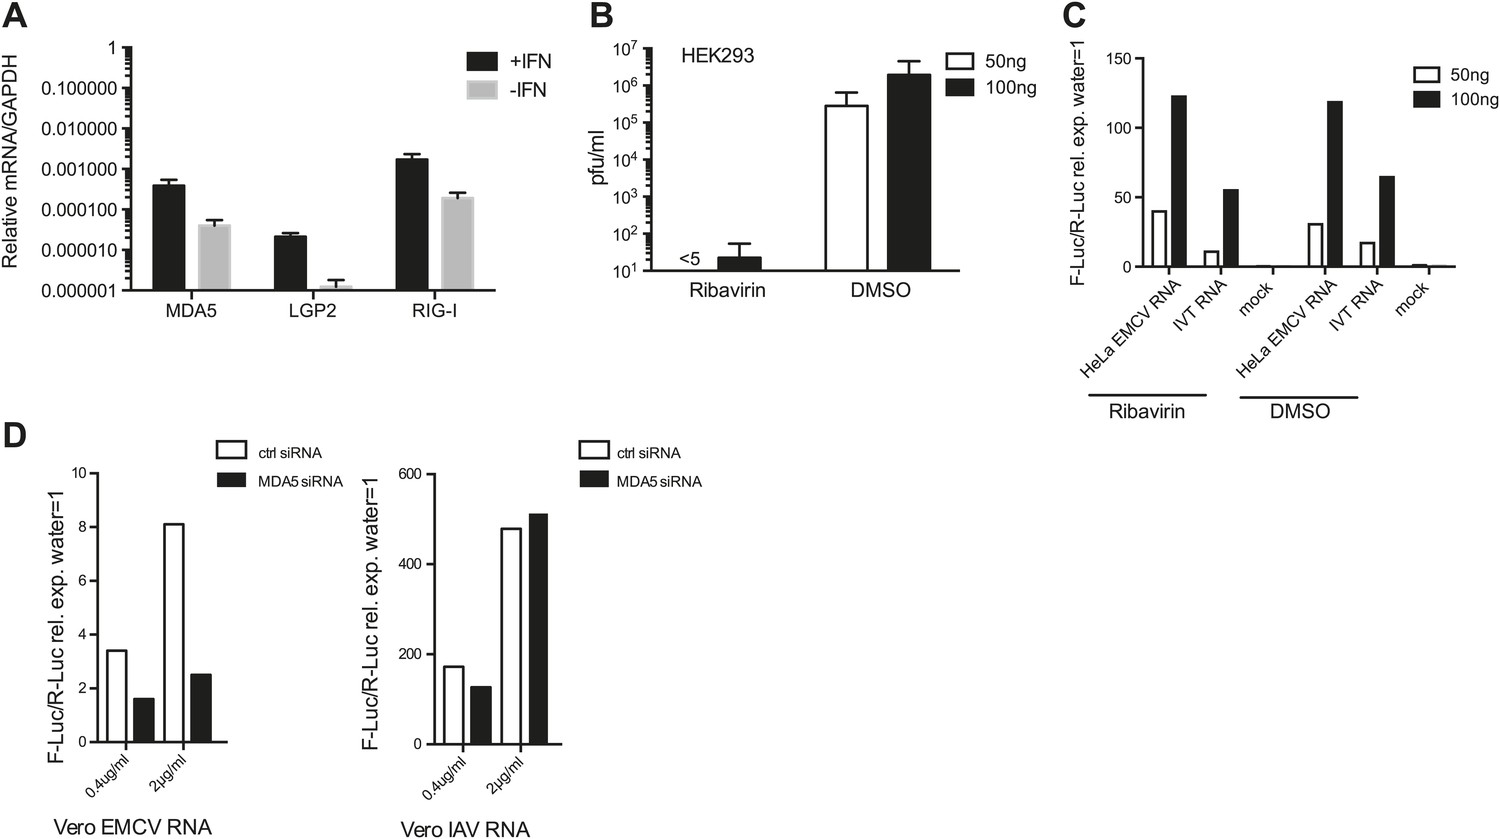
Ribavirin abrogates EMCV RNA infectivity but does not decrease IFN-β reporter activity in 293 cells.
(A) HEK 293 cells were either left untreated or treated with 100 units/ml of IFN for 16 hr. RNA was then extracted and the expression of MDA5, LGP2, and RIG-I were analysed by RT-PCR and normalised to GAPDH. Error bars represent standard deviation of three biological replicates. Data are from one representative of two experiments. (B and C) The indicated amount of RNA isolated from HeLa cells infected with EMCV at MOI 1 for 16 hr (HeLa EMCV RNA) was transfected into HEK293 cells expressing the IFN-β promoter luciferase reporter in the presence of DMSO or ribavirin. Transfection with water (mock) or IVT RNA at the indicated doses was used as negative and positive controls, respectively. After a 16-hr incubation, the accumulation of infectious virus in culture supernatants of reporter cells transfected with HeLa EMCV RNA was determined by plaque assay (pfu/ml = plaque forming units/ml) (B), while luciferase activity was measured in parallel (C). Standard deviation in (A) represents the variation of three biological replicates. (D) Indicated amounts of RNA isolated from Vero cells infected with EMCV (Vero EMCV RNA) or IAV (Vero IAV RNA) at MOI 1 for 16 hr were transfected into HEK293 cells pretreated for 48 hr with 25 nM of siRNA control (ctrl) or targeting MDA5 and expressing the IFN-β promoter luciferase reporter. Luciferase activity was measured 16 hr posttransfection.
Figure 2
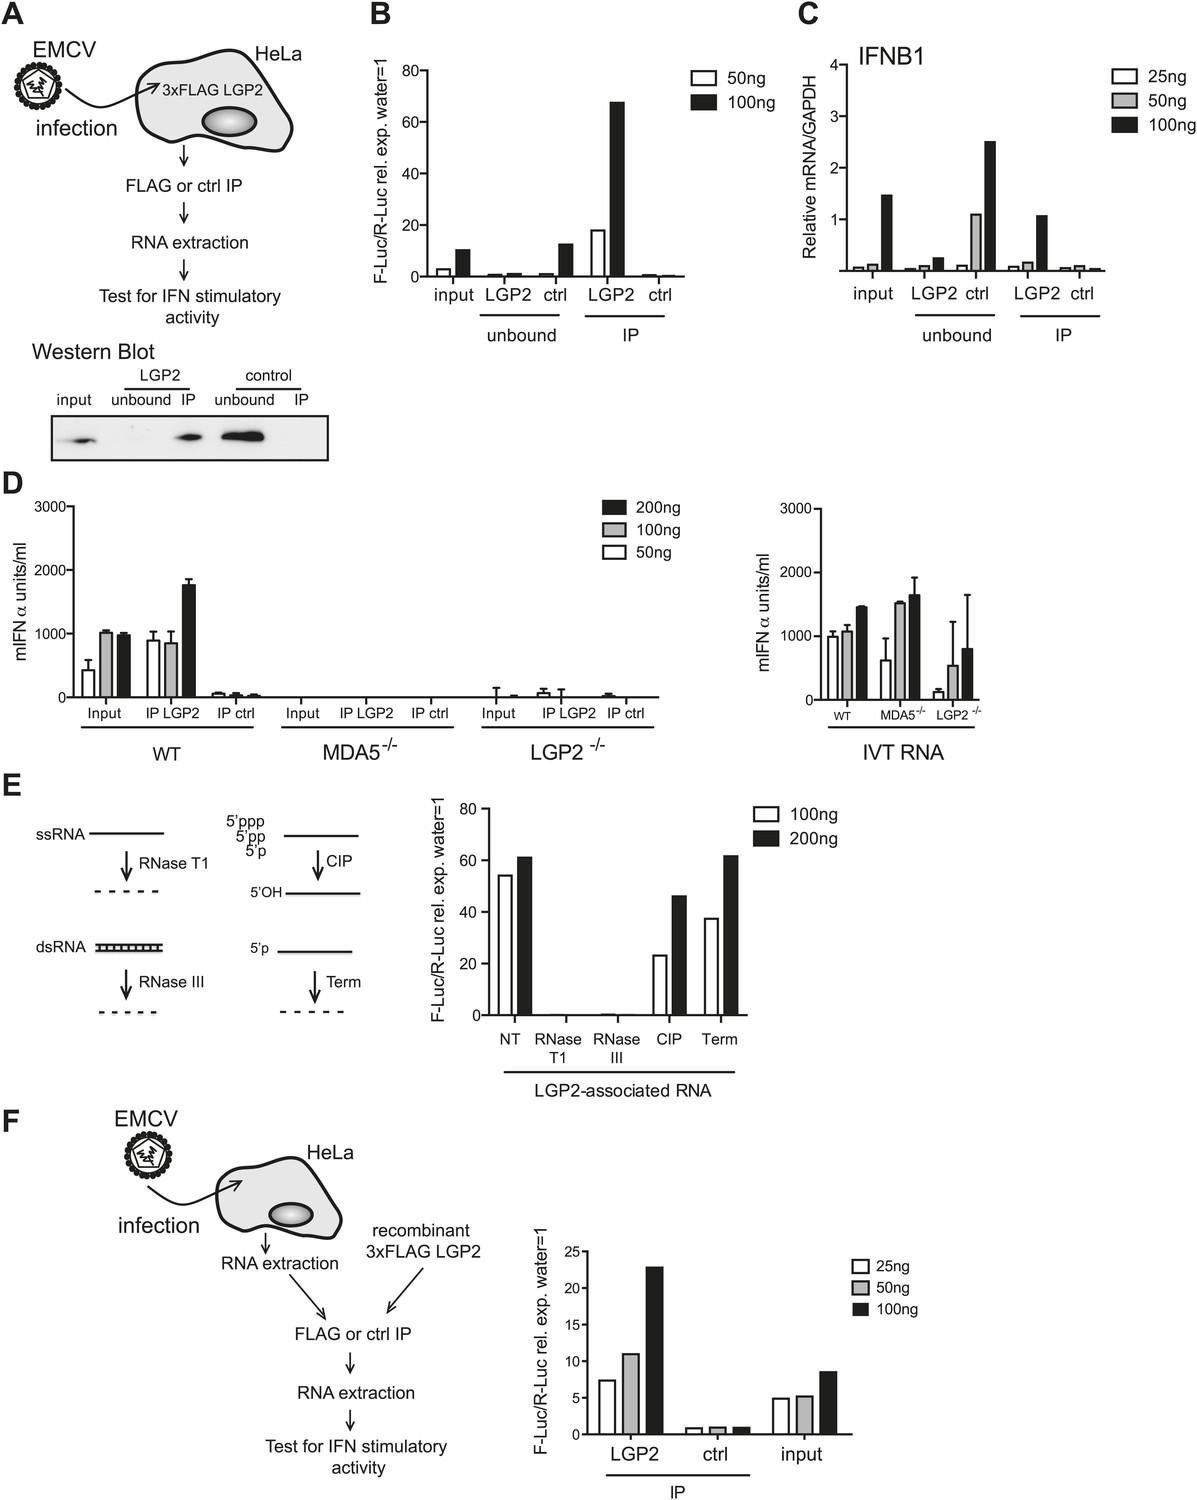
LGP2 pulldown captures MDA5 agonistic RNA from EMCV-infected cells.
(A) Schematic representation of the experimental setup for LGP2 immunoprecipitation (IP). Precipitation efficiency was routinely verified by immunoblotting with an anti-FLAG antibody; an example is shown in the lower panel. (B and C) The indicated amounts of RNA from EMCV-infected FLAG-LGP2-expressing HeLa cells (input), RNA associated with LGP2 or control (ctrl) immunoprecipitations (IP), or RNA remaining after LGP2 or control precipitations (unbound) were tested for the ability to stimulate the IFN-β promoter reporter assay in HEK293 cells (B) or induce IFNB1 mRNA (normalised to GAPDH) in HeLa cells (C). (D) The indicated amounts of RNA from samples processed as in (B) and (C) were transfected into WT, LGP2-deficient, or MDA5-deficient MEFs. Supernatants were harvested 16 hr later and mIFN-α levels measured by ELISA (left panel). IVT RNA transfections were used as positive controls (right panel). Error bars represent the standard deviation of three replicate transfections. (E) LGP2-associated RNA was not treated (NT) or digested with RNaseT1 (specific for ssRNA), RNaseIII (specific for base-paired RNA), CIP or Terminator (Term, an RNase specific for 5′monophosphate RNA) and subsequently tested for the ability to stimulate the IFN-β reporter in HEK293 cells. The activity of all enzymes was validated in control samples (not shown). (F) RNA from HeLa cells infected with EMCV (input) was incubated with recombinant FLAG-tagged LGP2 protein and anti-FLAG or control IP was performed as in (A). IP-associated RNA was isolated and tested, in parallel with input RNA, at the indicated doses in the IFN-β promoter luciferase reporter assay on HEK293 cells. Schematic representation of the experiment is shown on the left, results are presented on the right. One representative of the three (A–C) or two (D–F) experiments is shown.
Figure 3 with 2 supplements
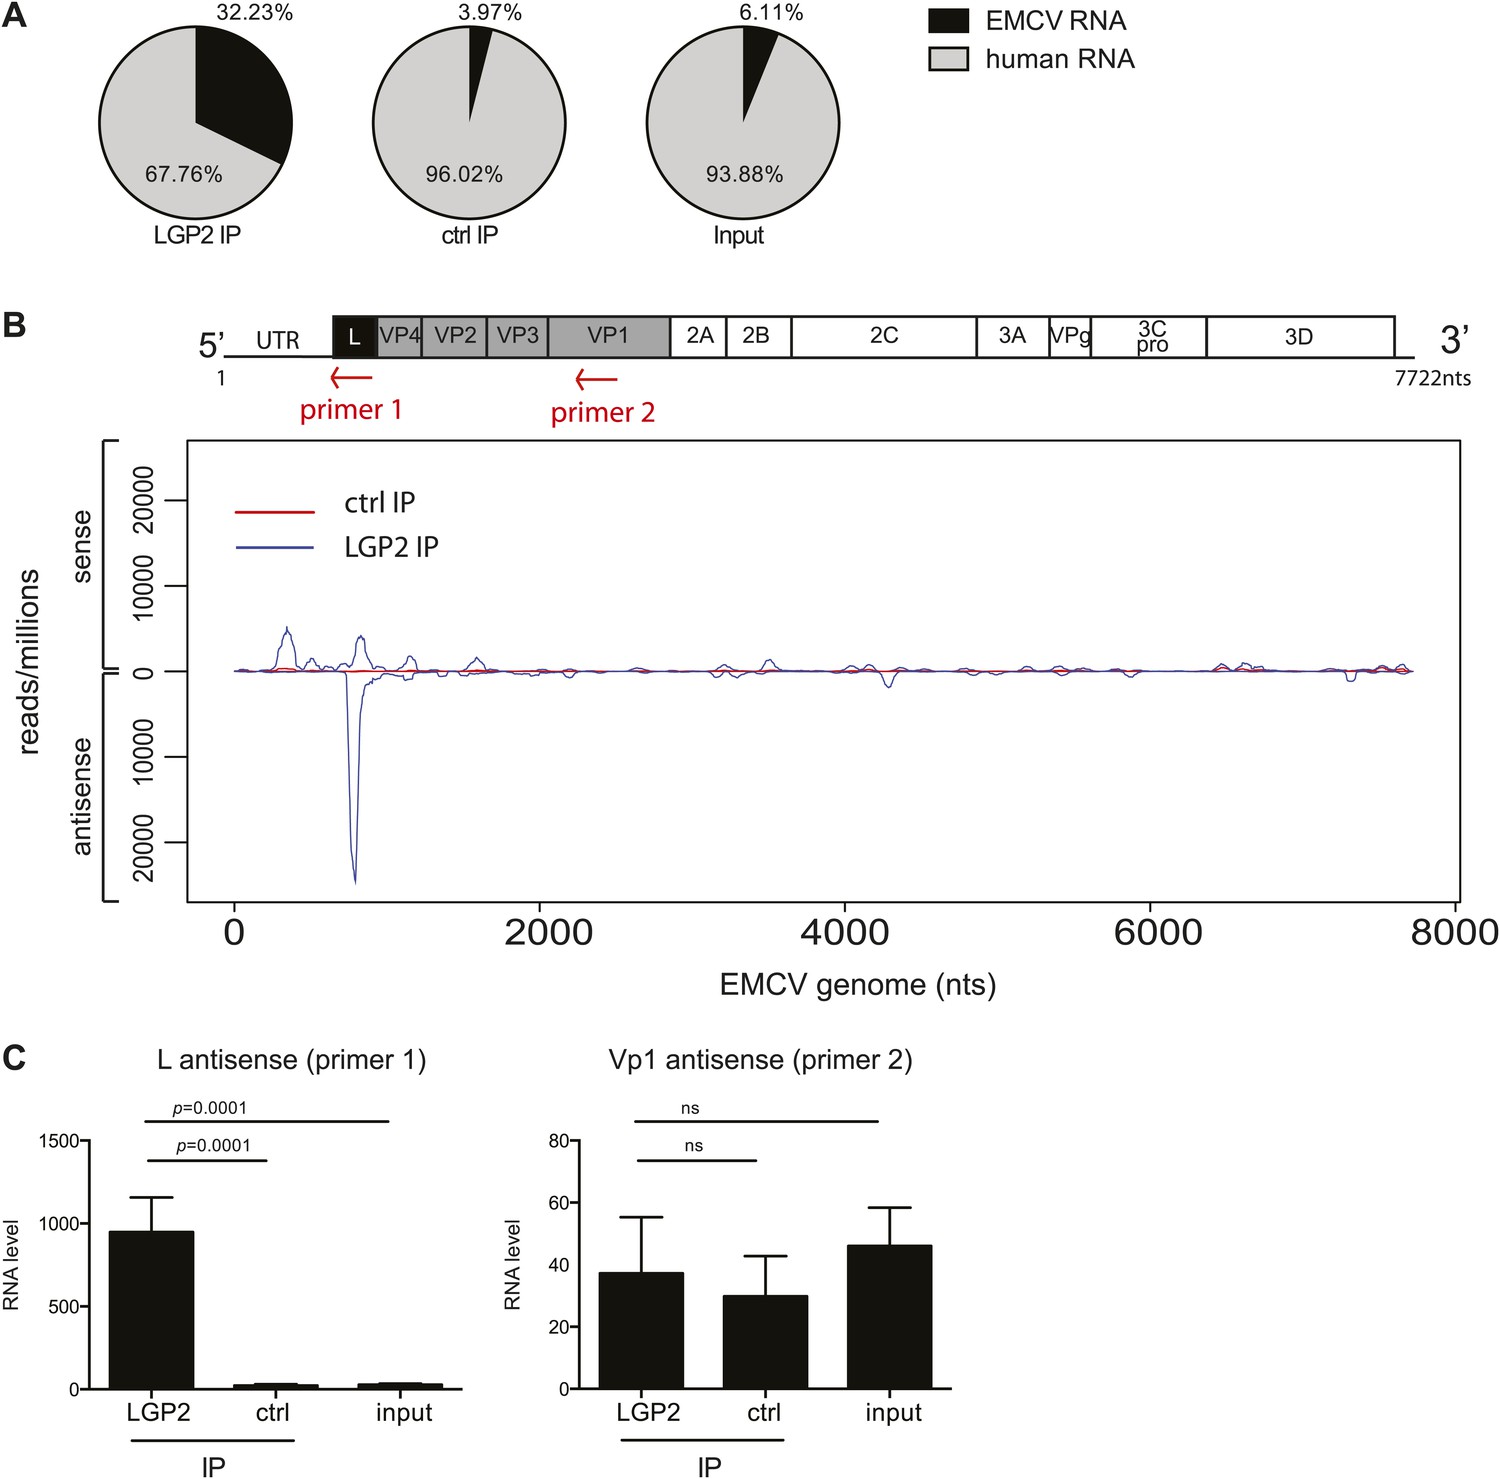
The L antisense RNA region is enriched in LGP2 pulldowns from EMCV-infected cells.
(A) RNA from LGP2 IP, control (ctrl) IP, or total RNA (input) from EMCV-infected cells (Figure 2A,B) was sequenced. Reads corresponding to human or EMCV sequences are shown as a percentage of the total number of reads that could be aligned to any sequence in bioinformatic databases. (B) All reads obtained from LGP2 IP or ctrl IP from EMCV infected cells were normalised to the number of reads per million to allow for comparison across samples. Results were mapped to the EMCV genome (depicted above; the red arrows indicate the respective position of the primer used for the reverse transcription prior to quantitative RT-PCR in [C]). The total numbers of reads are shown in Table 1. The vertical axis shows the number of normalised reads mapping to a particular position on the EMCV genome (horizontal axis). The positive and negative numbers represent reads that align to the sense or the antisense strand, respectively. Numbering along the x-axis indicates nucleotide position on the sense (+) strand. One experiment of two is shown. (C) The amount of L antisense (AS) (primer 1 in B) or VP1 AS (primer 2 in B) RNA was analysed by strand-specific RT-PCR in LGP2 IP, ctrl IP, and input samples from an independent experiment. Vertical axis represents RNA level, calculated relative to the data obtained from a standard curve of cDNA from EMCV-infected cells. Error bars represent the standard deviation of four independent samples. ns = not significant.
Figure 3—figure supplement 1
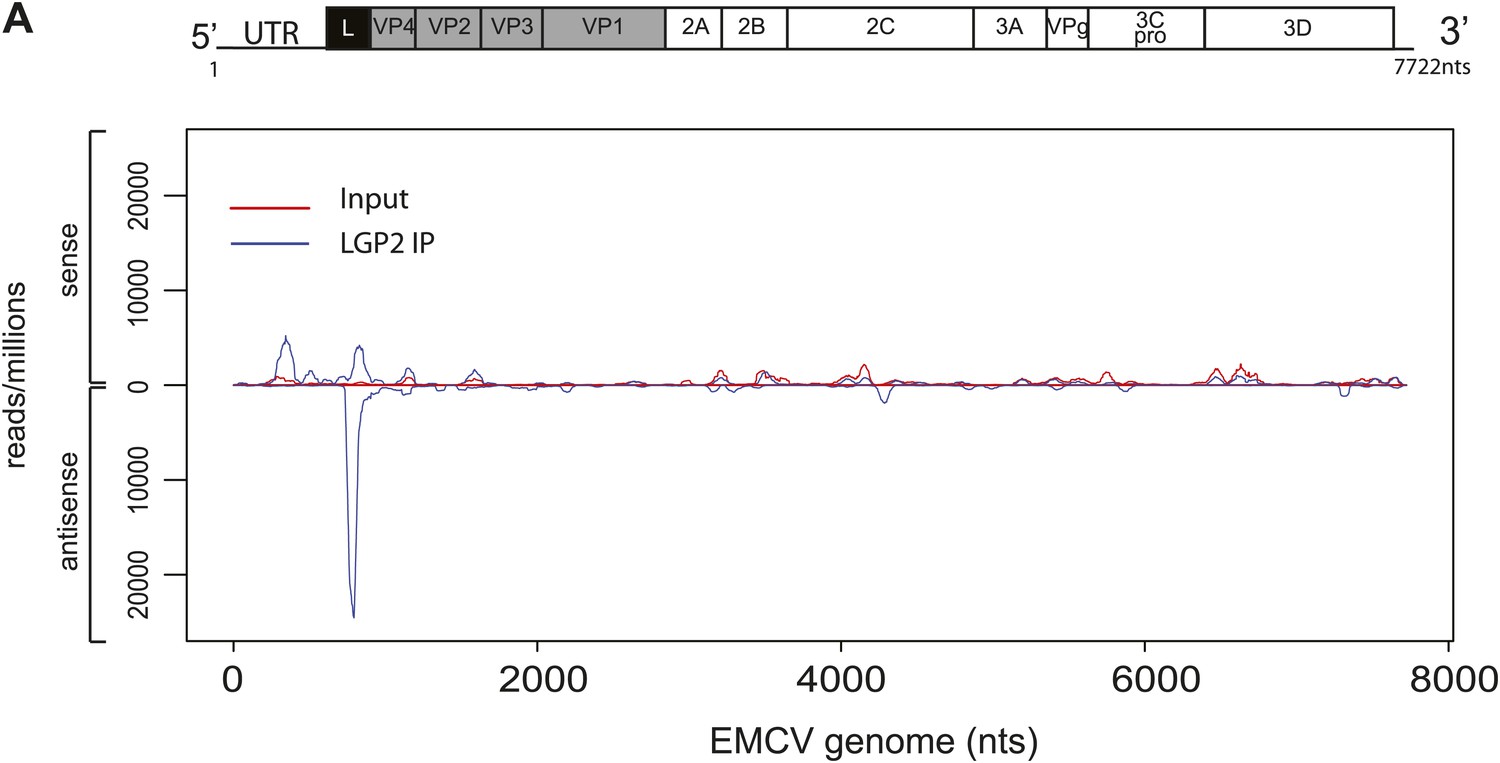
Comparison of read-distribution along the EMCV genome for LGP2-associated RNA and input material.
Strand-specific analysis of sequencing results from LGP2 IP vs input RNA from EMCV-infected cells (Figure 3). Number of reads per million obtained from Illumina sequencing were mapped to their starting position on the EMCV genome. The vertical axis shows the number of normalised reads mapping to a particular position. The positive and negative numbers represent reads that align to the sense or the antisense strand, respectively.
Figure 3—figure supplement 2
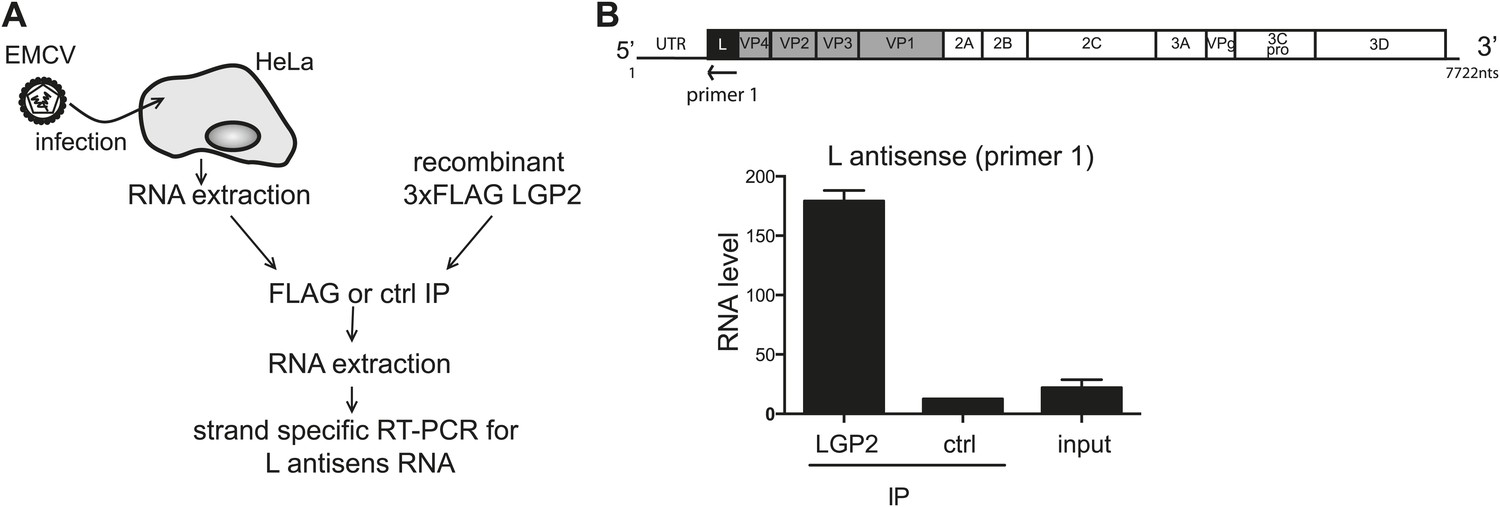
LGP2 directly binds L region antisense RNA.
(A) Schematic representation of the experimental setup. Total RNA purified from HeLa cells infected with EMCV (input) was mixed with recombinant FLAG-tagged LGP2 before immunoprecipitation with an anti-FLAG (LGP2 IP) or control (ctrl IP) antibody. (B) Input RNA and RNA from precipitated material was then extracted and subjected to strand-specific RT-PCR using primers specific for the L antisense region. Vertical axis represents RNA level, calculated by comparison with a standard dilution curve of cDNA from EMCV-infected cells. The arrow indicates the position of the antisense primer (primer 1) used for the reverse transcription of the L region on the EMCV genome. Error bars represent standard deviation of two biological replicates.
Figure 4
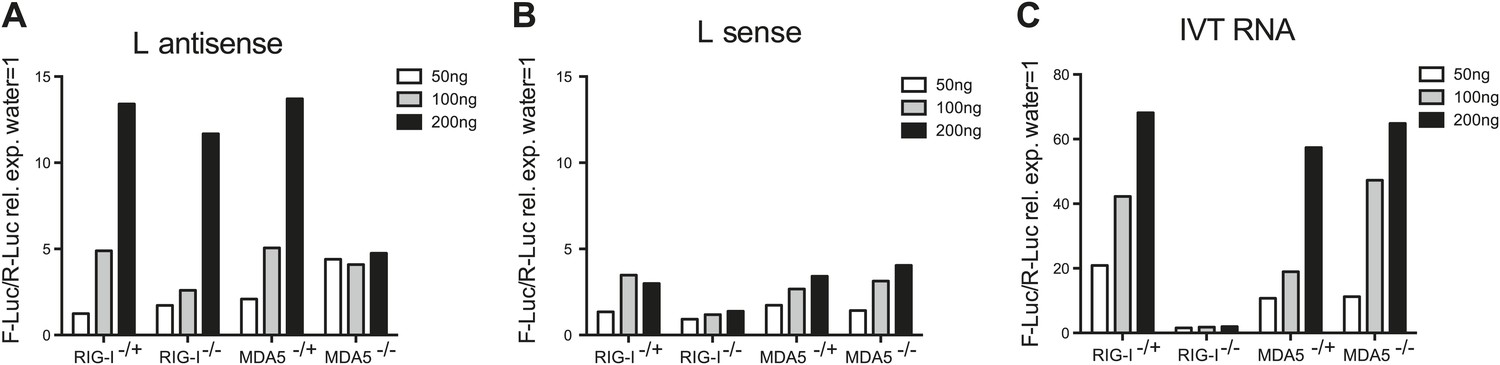
In vitro transcribed L AS RNA triggers an MDA5-dependent IFN response.
(A–C) L antisense (AS) (A), L sense (B) or IVT RNA (C) sequences were in vitro transcribed and all RNA except from the control IVT RNA (C) were CIP treated to remove any 5′ phosphates. The indicated amount of RNA were then transfected into RIG-I-, MDA5-deficient or sufficient MEFs expressing the IFN-β reporter. Reporter activity was measured 16 hr later. One of two experiments is shown.
Figure 5 with 1 supplement
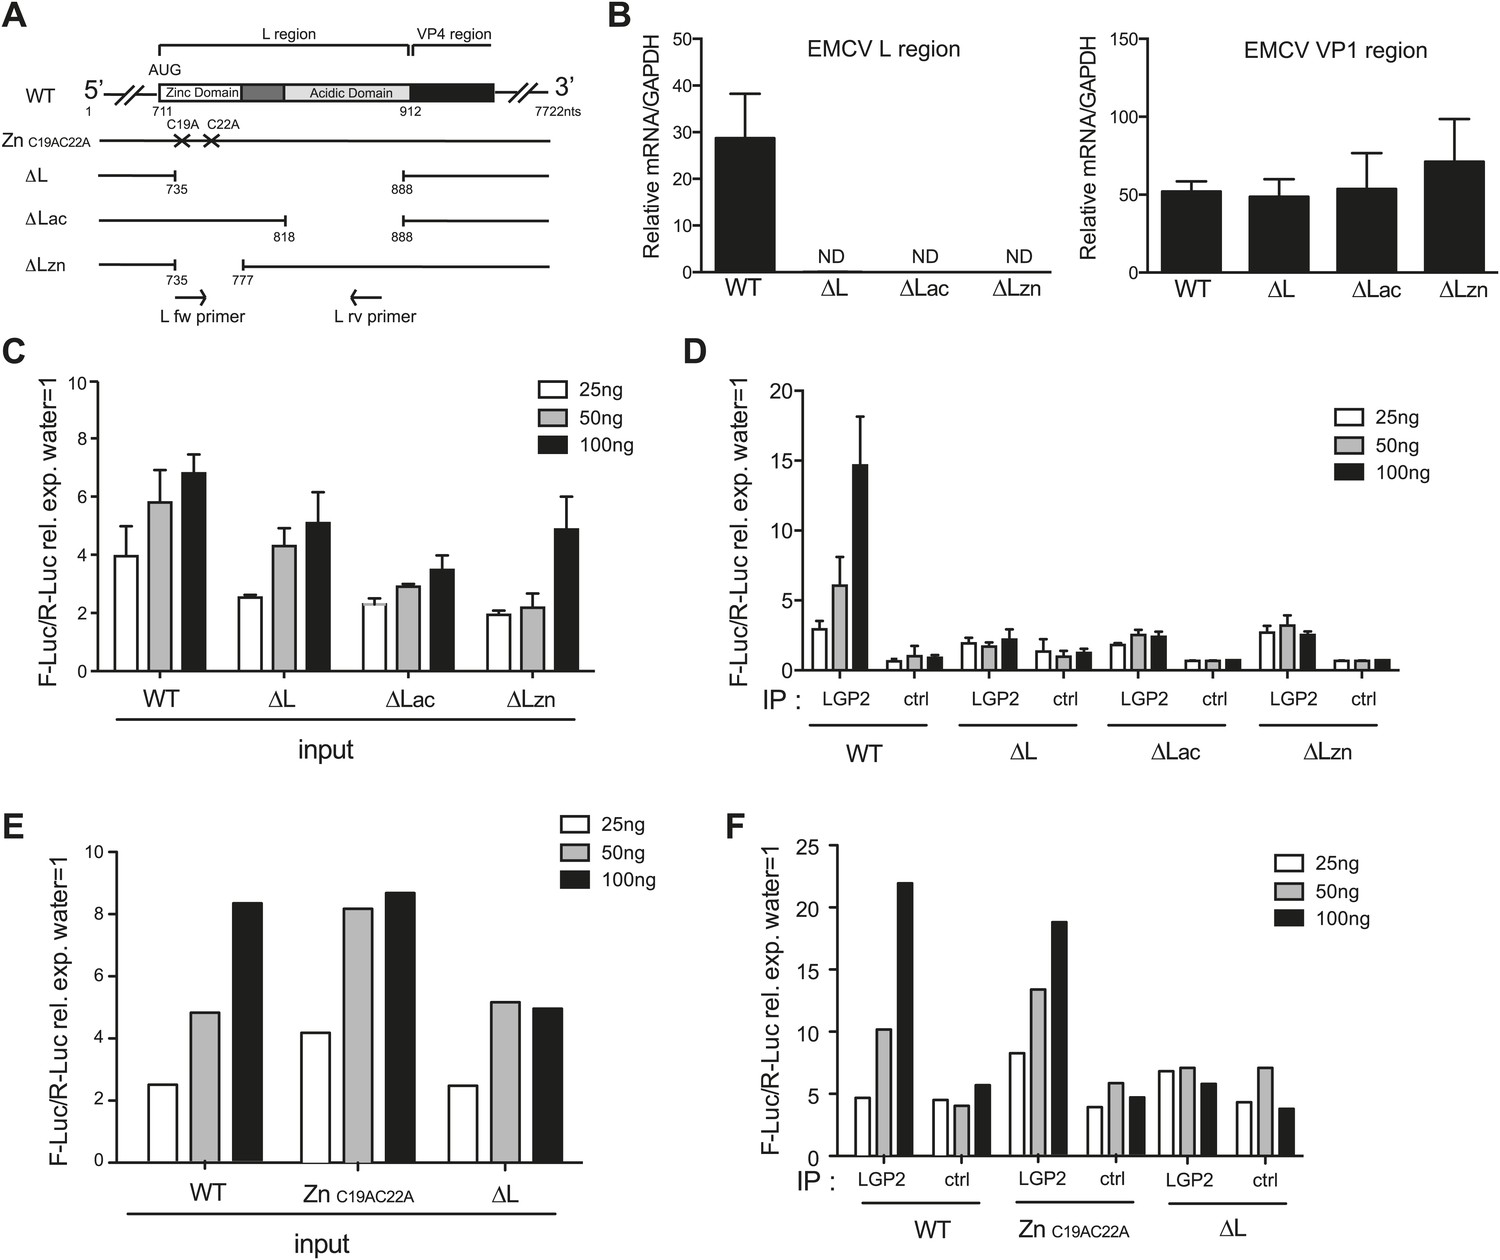
The L region of EMCV is required for the generation of LGP2-associated stimulatory RNA.
(A) Schematic representation of the L region of EMCV genome and L region mutant viruses used in this study. The crosses indicate the position of the two point mutations in EMCV ZnC19AC22A. The marked positions indicate the limits of the deletions present in EMCV ΔL, ΔLac, and ΔLzn, respectively. (B–F) FLAG-LGP2-expressing HeLa cells were infected with EMCV WT, ZnC19AC22A, ΔL, ΔLac, or ΔLzn viruses at MOI 1 for 16 hr before lysis and total RNA extraction (input; B, C, E) or lysis followed by LGP2 or control (ctrl) immunoprecipitation and RNA extraction from precipitates (IP; D and F). (B) Quantitative RT-PCR analysis of viral sequences in input samples using primers specific for the L region (left panel) or the Vp1 region (right panel) and normalised to GAPDH. ND = non-detected. The position of the primers used for amplifying the L region is depicted in (A). (C–F) The stimulatory potential of the indicated doses of input (C and E), LGP2 IP or ctrl IP RNA (D and F) was assessed by IFN-β promoter luciferase reporter assay in HEK293 cells. (B–F) One experiment of two is shown.
Figure 5—figure supplement 1
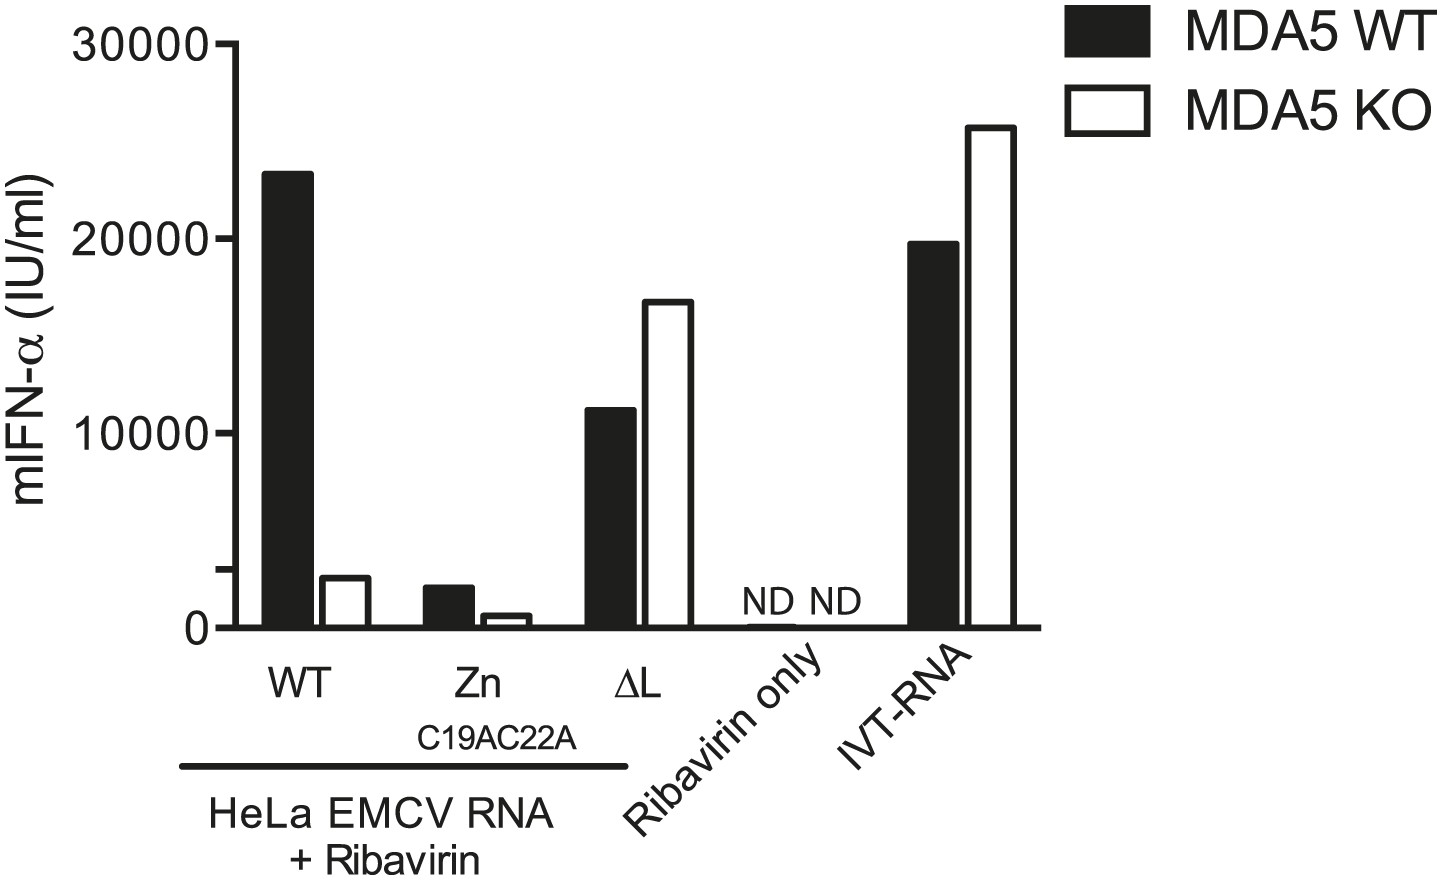
200 ng of RNA isolated from HeLa cells infected with EMCV WT, ZnC19AC22A or ΔL at MOI 1 for 16 hr (HeLa EMCV RNA) was transfected into MDA5-sufficient or MDA5-deficient bone marrow-derived DCs in presence of ribavirin.
Transfection with ribavirin only and IVT RNA was used as negative and positive controls, respectively. Supernatants were harvested 16 hr later and mIFN-α levels measured by ELISA. ND = non detected. One of two experiments is shown.
Figure 6
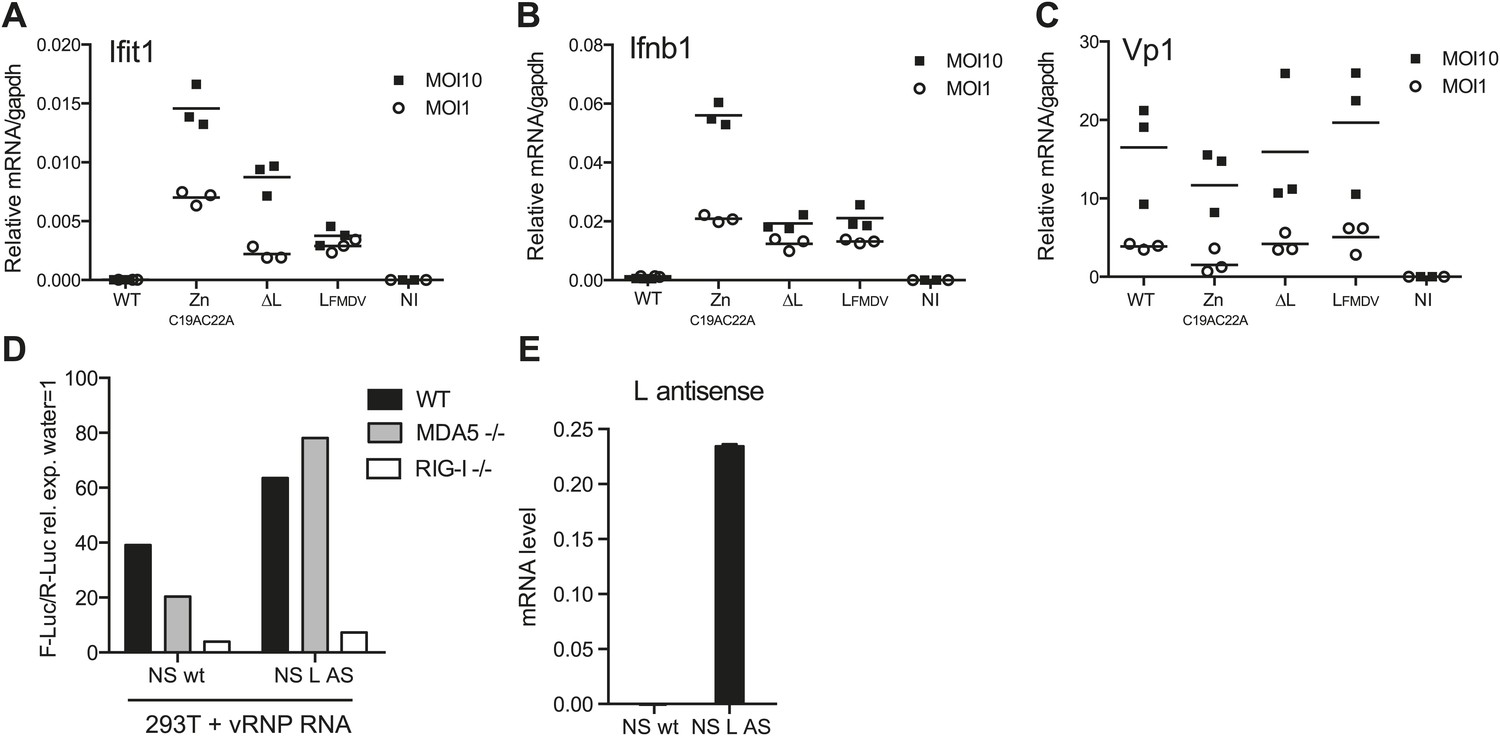
L region RNA is required for IFN-α/β production in response to EMCV.
(A–C) IFNAR1-deficient GM-CSF bone marrow-derived DCs were either not infected (NI) or infected with the indicated viruses at an MOI of 1 or 10. Levels of Ifit1 (A), Ifnb1 (B) or EMCV Vp1 (C) RNA were analysed 16 hr later by quantitative RT-PCR and normalised to gapdh. (D and E) 293T cells were transfected with the influenza vRNP reconstitution system using the influenza NS wt segment or NS segment carrying the L AS RNA sequence and incubated for 24 hr. RNA was then extracted and the IFN stimulatory activity was tested on MEF wt, MDA5 or RIG-I deficient by luciferase assay (D) and the expression of the L AS sequence was verified by strand-specific RT-qPCR with primer specific for the L antisense RNA (E). (A–E) One experiment of two is shown.
Figure 7
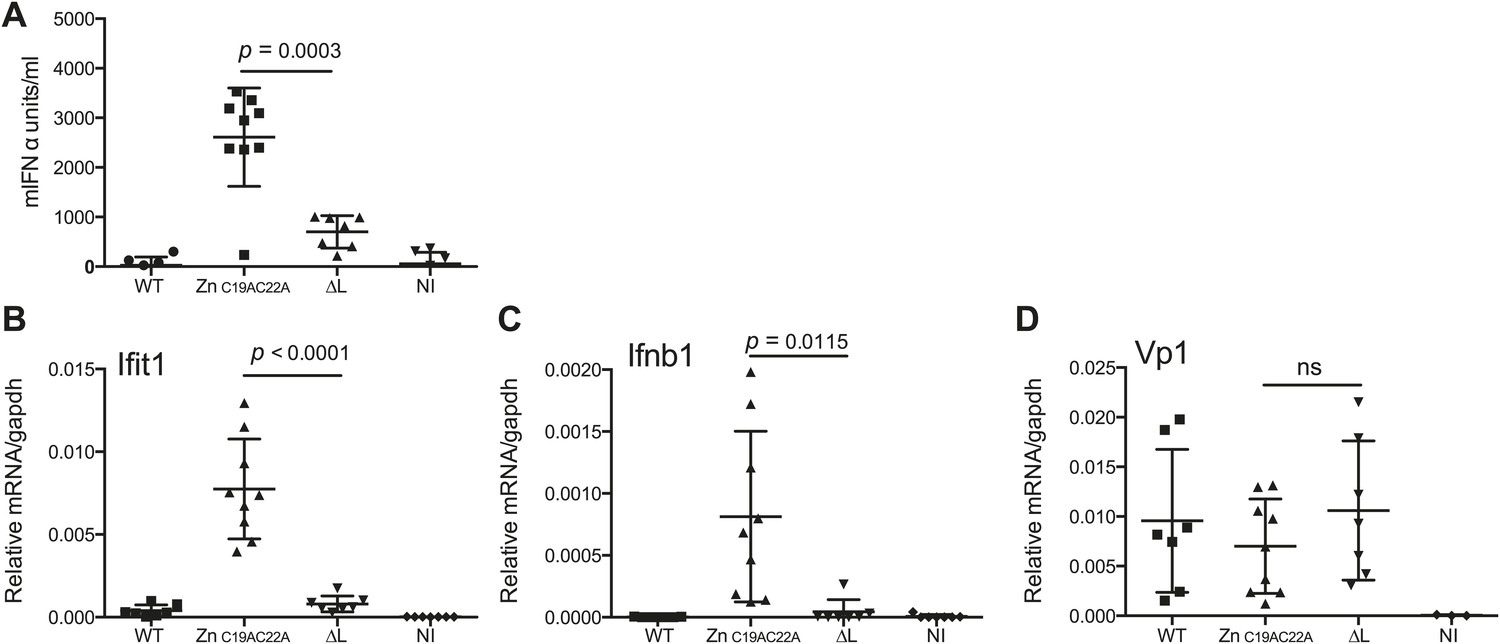
The L region is required for IFN-α/β responses to EMCV in vivo.
(A and B) IFNAR1 KO mice were injected intraperitoneally with PBS (not infected; NI) or with 10E6 pfu of the indicated viruses. (A) mIFN-α levels in the serum were measured by ELISA after 24 hr. (B–D) RNA was extracted from hearts 24 hr postinfection and analysed by quantitative RT-PCR for levels of Ifit1 (B), Ifnb1 (C), or EMCV Vp1 (D) RNA normalised to gapdh expression. Combined results of two independent experiments are shown. Each symbol represents an individual mouse. ns = not significant.
Tables
Table 1
Total number of reads aligning to the EMCV genome in LGP2 IP, ctrl IP, or input samples
| LGP2 IP | ctrl IP | input | |
|---|---|---|---|
| Number of reads* | 31,662,255 | 37,235,332 | 35,725,972 |
| EMCV | 2,747,427 | 243,472 | 1,380,128 |
| EMCV (+) | 1,305,129 | 239,625 | 1,380,058 |
| EMCV (−) | 1,442,298 | 3,847 | 70 |
-
*
Total numbers of reads, reads matching both strands (EMCV), sense strand (EMCV (+)) or antisense strand (EMCV (−)) of EMCV RNA sequences.
Table 2
Percentage of reads mapping either the sense (+) or the antisense (−) strand in the L region compared to the full length EMCV genome
| L region | Total EMCV | |||
|---|---|---|---|---|
| (+) | (−) | (+) | (−) | |
| LGP2 IP | 19.49 | 80.51 | 47.50 | 52.50 |
| ctrl IP | 78.55 | 21.45 | 98.17 | 1.83 |
| input | 100.00 | 0.00 | 100.00 | 0.00 |
Download links
A two-part list of links to download the article, or parts of the article, in various formats.
Downloads (link to download the article as PDF)
Open citations (links to open the citations from this article in various online reference manager services)
Cite this article (links to download the citations from this article in formats compatible with various reference manager tools)
Identification of an LGP2-associated MDA5 agonist in picornavirus-infected cells
eLife 3:e01535.
https://doi.org/10.7554/eLife.01535


