ErbB expressing Schwann cells control lateral line progenitor cells via non-cell-autonomous regulation of Wnt/β-catenin
- Stowers Institute for Medical Research, United States
- University of Utah School of Medicine, United States
Figures
Figure 1 with 4 supplements
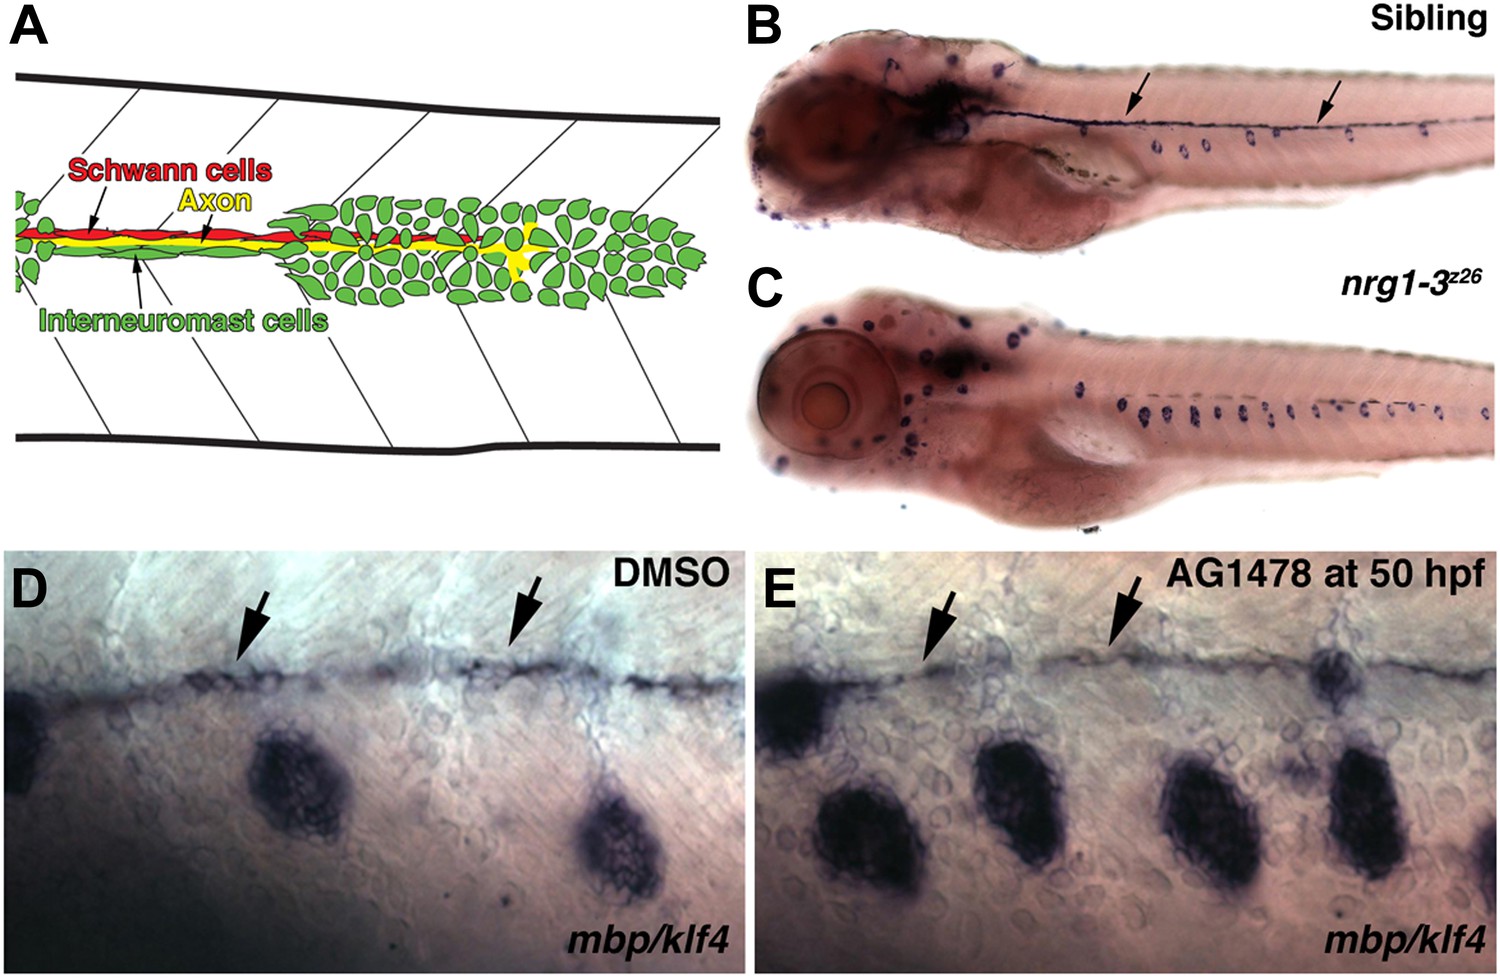
Illustration of cell types in the migrating lateral line.
(A) As the primordium migrates it deposits neuromasts and a chain of interneuromast cells (green cells). Pioneer axons (yellow line) of the posterior lateral line ganglion grow out with the primordium. Schwann cells (red cells) migrate and proliferate along axons. nrg1-3z26 mutants and pharmacological inhibition of ErbB signaling mimics the erbb phenotype. (B–E) Double in situ hybridization was performed to label Schwann cells with myelin basic protein (mbp) and neuromasts with klf4 at 5 dpf. (B) Control siblings with Schwann cells (arrows) along the lateral line nerve and normal neuromast number. nrg1-3z26 mutants mimic erbb2 and erbb3b mutants in that they lack Schwann cells along the lateral line and have increased neuromast number (C). The brown cells along the midline in both sibling and nrg1-3z26 are pigment cells. (D and E) Double in situ hybridization for mbp and klf4 in DMSO or AG1478 treated larvae from 50 hpf. Compared to DMSO treatment (D), increased neuromasts are seen in AG1478 treated larvae (E). mbp expression along the midline shows that Schwann cells (arrows) are still present at 5 dpf when AG1478 was given at 50 hpf (E), compare to DMSO treated (D).
Figure 1—figure supplement 1
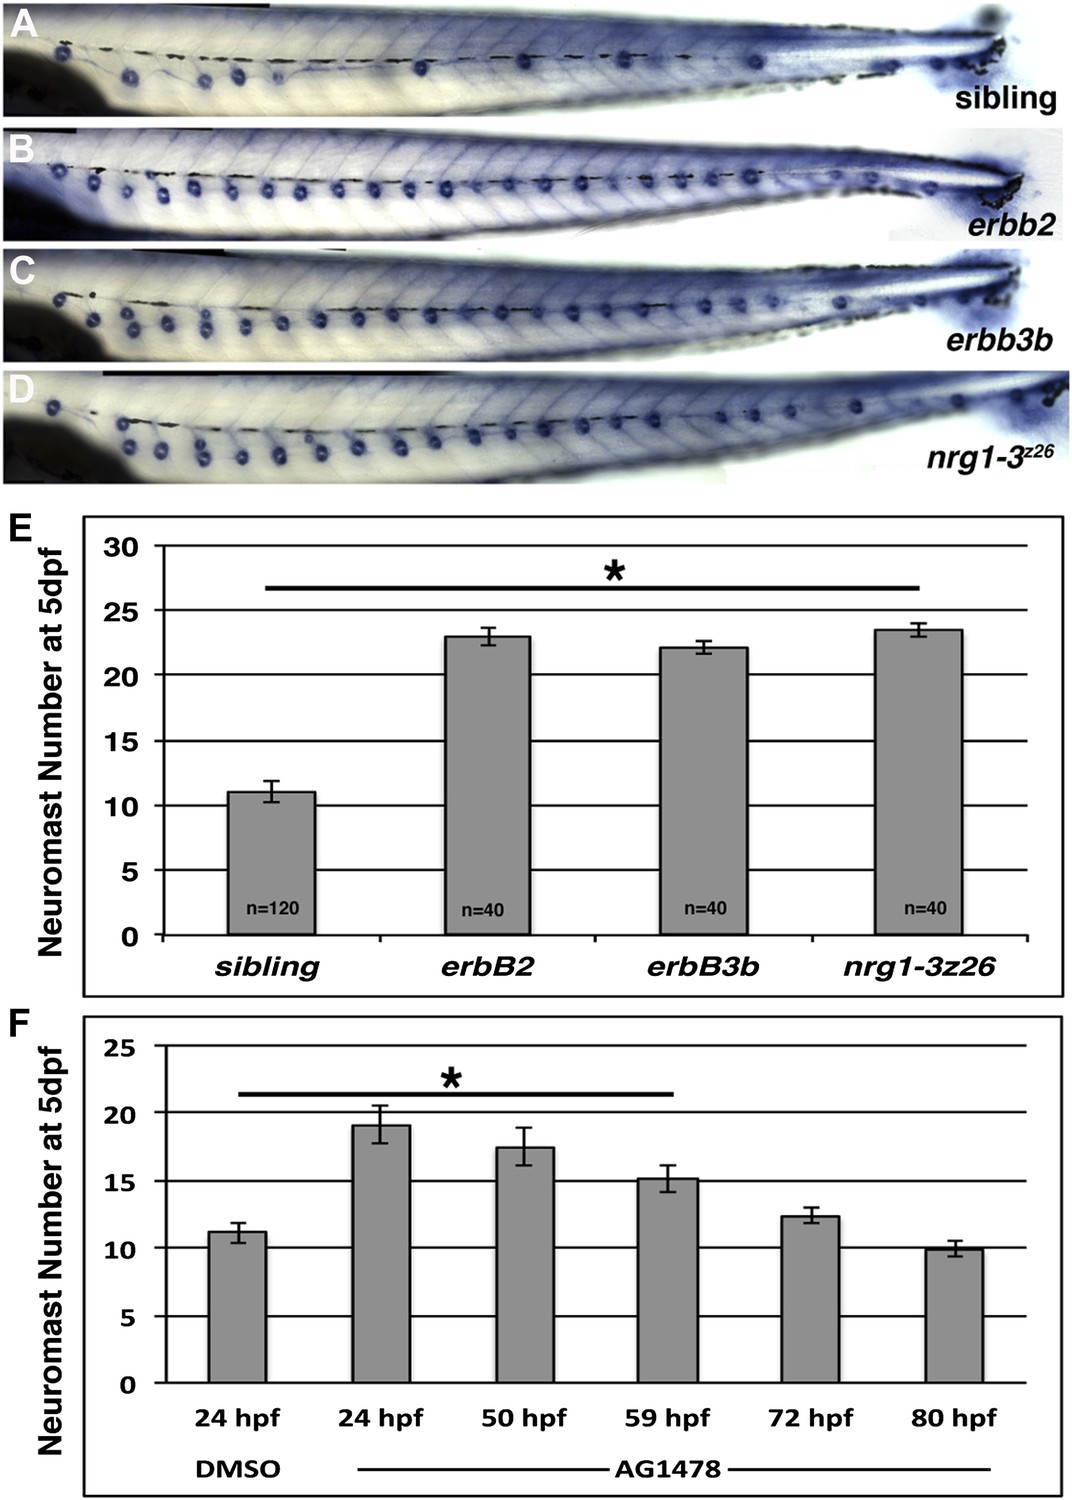
Mutations in the erbb signaling pathway show precocious neuromast formation by 5 dpf.
Alkaline phosphatase staining of control (A), erbb2 (B), erbb3b (C) and nrg1-3z26 (D) zebrafish at 5 dpf. Quantification of alkaline phosphatase stained larvae shows significant increase in neuromast number in all mutants compared to control siblings (E, Student's t-test, p≤1.0E−44). (F) AG1478 induces extra neuromasts even if given after Schwann cell migration is complete. AG1478 was added at 24, 50, 59, 72, or 80 hpf and neuromasts were counted at 5 dpf. For the negative control DMSO was added at 24 hpf only. AG1478 induces a significant increase in neuromasts if given up to 59 hpf (F, one-way ANOVA with Tukey pairwise comparison, p≤4.0 E−6).
Figure 1—figure supplement 2
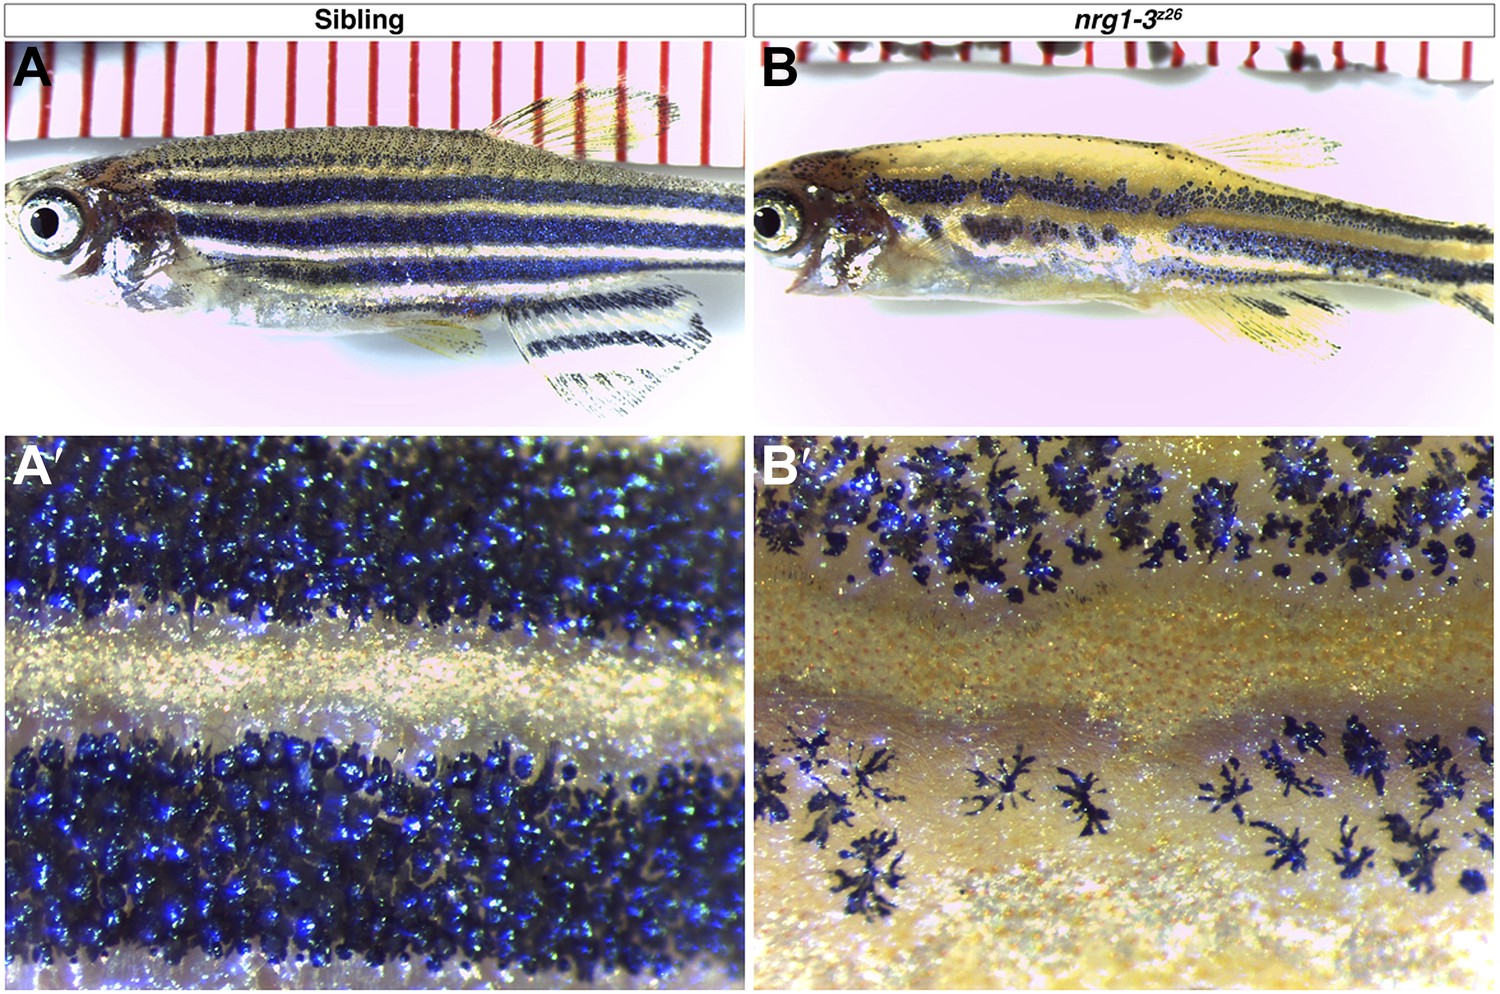
nrg1-3z26 mutants have defects in adult pigment pattern.
Control siblings at one month of age show typical stripe pattern of melanophores (A–A′). nrg1-3z26 at 1-month-old show patchy placement of melanophores in the anterior trunk with a more adult like pattern in the posterior region reminiscent of erbb3b mutants (B–B′).
Figure 1—figure supplement 3
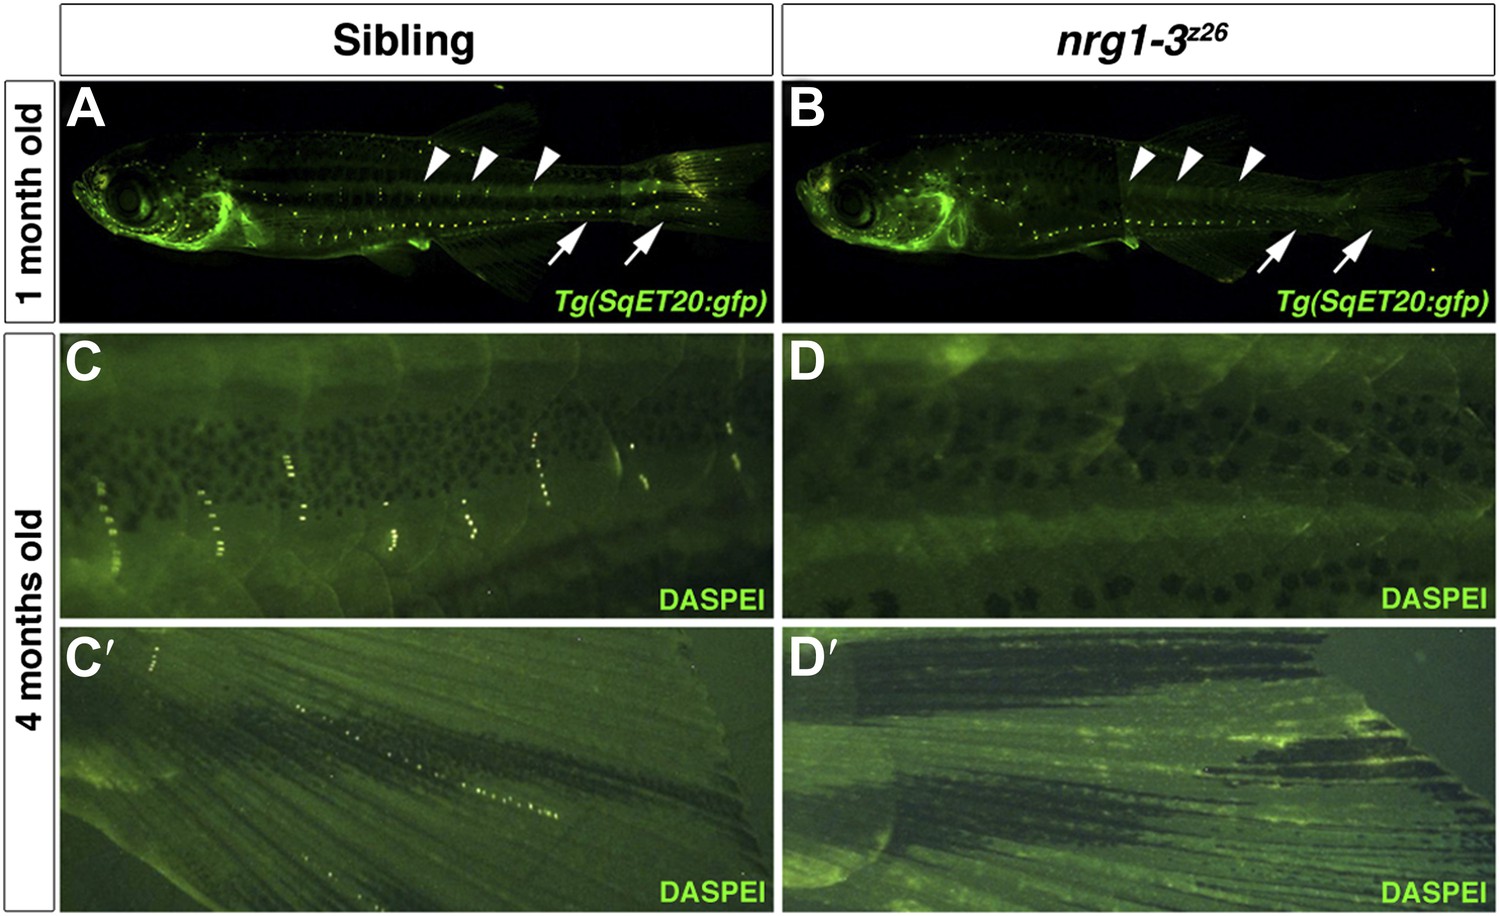
nrg1-3z26 mutants lose neuromasts as they age.
Control sibling Tg(SqET20:gfp) (A) or nrg1-3z26/Tg(SqET20:gfp) (B), were imaged at 1 month of age. Neuromasts that stay along the midline can be seen in control siblings (A, arrowhead). These neuromasts are lost from the more posterior region in nrg1-3z26 adult zebrafish (B, arrowhead). Similarly neuromasts are also lost from the more ventral lateral line (arrows), which are mostly derived from primI, in nrg1-3z26 (B). (C–D′) At 4 months of age the degeneration of neuromasts is even more severe. In controls at four months multiple stitches of neuromasts can be seen after DASPEI staining along the ventral line (C) and tail fin (C′). nrg1-3z26 have no ventral lateral line (D) or tail fin (D′) neuromasts remaining at 4 months.
Figure 1—figure supplement 4
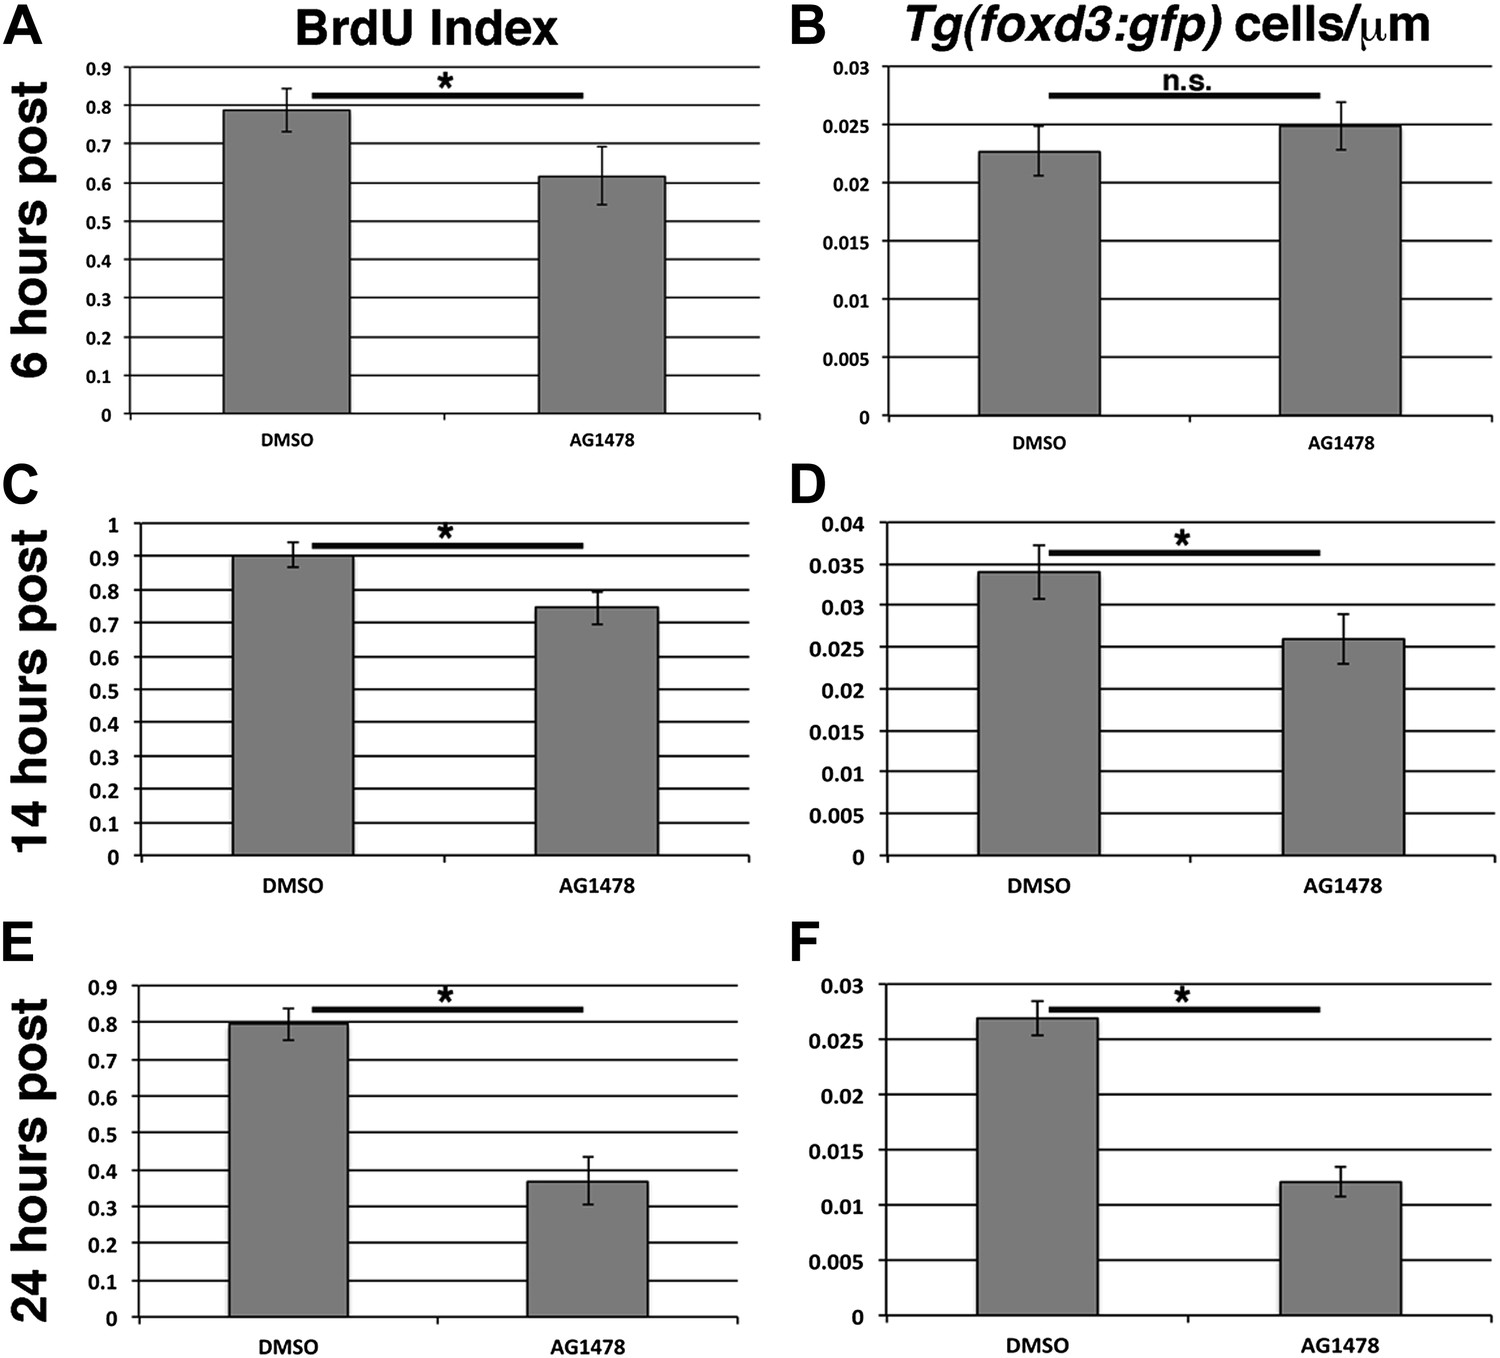
ErbB inhibition after lateral line migration is complete causes a decrease in proliferation and number of lateral line Schwann cells.
BrdU plus DMSO or AG1478 was given to Tg(foxd3:gfp) fish at 48 hpf then fixed at 6, 14, or 24 hr post treatment. BrdU index is decreased (A, Student's t-test, p=0.0006), but Schwann cell number is normal 6 hr post AG1478 treatment (B, Student's t-test, p=0.16). There is an average count of 12 or 13 Schwann cells in control or AG1478 treatments respectively. At 14 hr post AG1478 treatment both BrdU index (C, Student's t-test, p=5.8 E−6), and Schwann cell numbers are decreased (D, Student's t-test, p=0.0008). There is an average count of 20 or 14 Schwann cells in control or AG1478 treatments respectively. By 24 hr post treatment, BrdU index (E, Student's t-test, p=2.6E−19), and Schwann cell numbers (F, Student's t-test, p=2.4E−28), are even more decreased by AG1478 compared to DMSO. There is an average count of 14 or 6 Schwann cells in control or AG1478 treatments respectively.
Figure 2
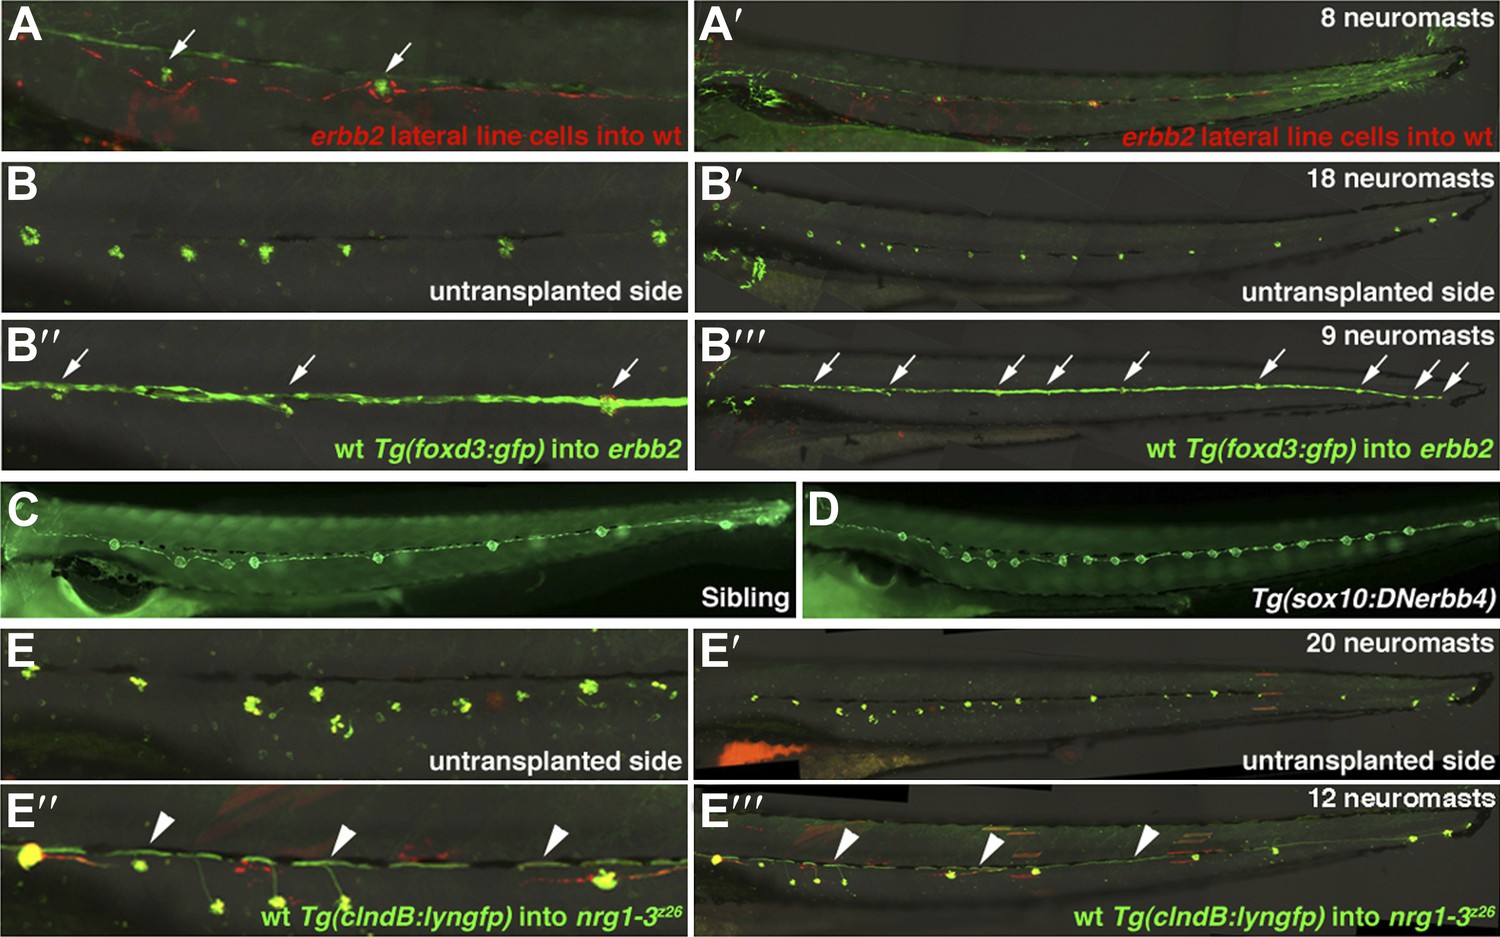
Transplantation and transgenic analysis demonstrates that ErbB2 is required within Schwann cells and Nrg1-3 within lateral line neurons to inhibit extra neuromast formation.
(A and A’) Alexa-568 dextran (red) labeled erbb2 mutant cells were transplanted into Tg(foxd3:gfp) (green) wild type fish. (A) High magnification view shows erbb2 interneuromast and mantle cells along the lateral line and around neuromasts (arrows). These erbb2 interneuromast cells fail to induce extra neuromasts by 4 dpf (A’). (B–B’’’) Alexa-568 dextran (red)/Tg(foxd3:gfp) (green) wild type cells were transplanted into erbb2 mutant host. At 4 dpf neuromast were labeled by DASPEI staining (green). (B and B’) On the untransplanted side there are no Schwann cells and eighteen neuromasts. (B’’ and B’’’) On the transplanted side you can see complete migration of wild type Schwann cells in an otherwise erbb2 mutant fish and rescue of neuromast number (arrows). (C and D) Dominant negative ErbB receptor expression in neural crest derived cells mimics erbb mutant phenotype. (C) Control Tg(SqET20:gfp) siblings at 4 dpf. (D) Tg(SqET20:gfp)/Tg(sox10:DNerbb4) showing extra neuromasts. (E–E’’’) Alexa-568 dextran (red)/Tg(clndB:lyngfp)(green) wild type cells were transplanted into nrg1-3z26 mutant host. (E–E’) At 4 dpf the untransplanted side has nineteen neuromasts. (E’’ and E’’’) On the transplanted side there are GFP labeled axons (arrowhead) along the entire length of the lateral line with rescue of neuromast number. All axons cannot be seen because some are obscured underneath pigment cells.
Figure 3
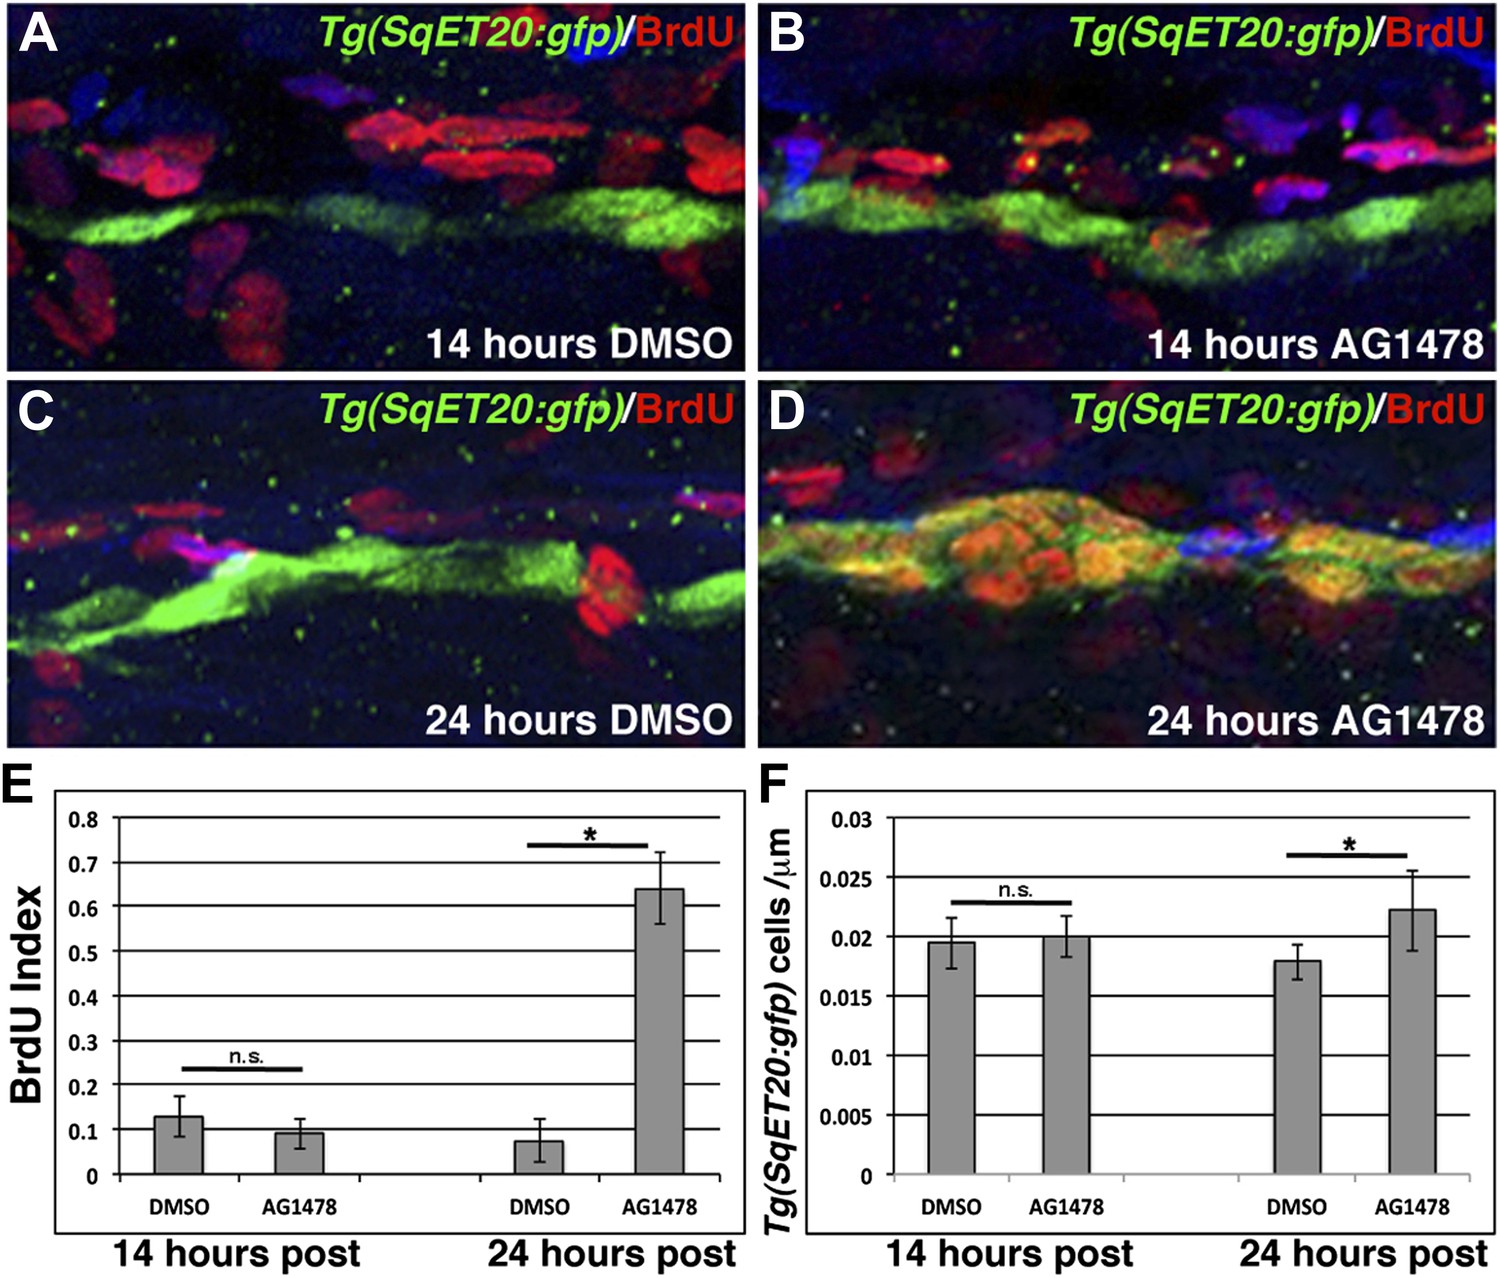
ErbB inhibition, after Schwann cell lateral line migration is completed, induces proliferation of interneuromast cells.
BrdU plus DMSO or AG1478 was given to Tg(SqET20:gfp) fish at 48 hpf then fixed at 14 or 24 hr post treatment. Immunohistochemistry for BrdU (red) and GFP (green) reveals no difference in BrdU incorporation within interneuromast cells between DMSO (A) or AG1478 (B) 14 hr post treatment. At 24 hr post treatment DMSO (C) treated fish show little BrdU incorporation while AG1478 (D) treated fish show increased BrdU incorporation and interneuromast cell number. Quantification of both BrdU index (E, Student’s t-test, p=0.18 for 14 hr and p=4.5E−18 for 24 hr time point) and interneuromast cell number (F, Student’s t-test, p=0.69 for 14 hr and p=0.003 for 24 hr time point) shows a significant increase with AG1478 only after 24 hr.
Figure 4 with 3 supplements
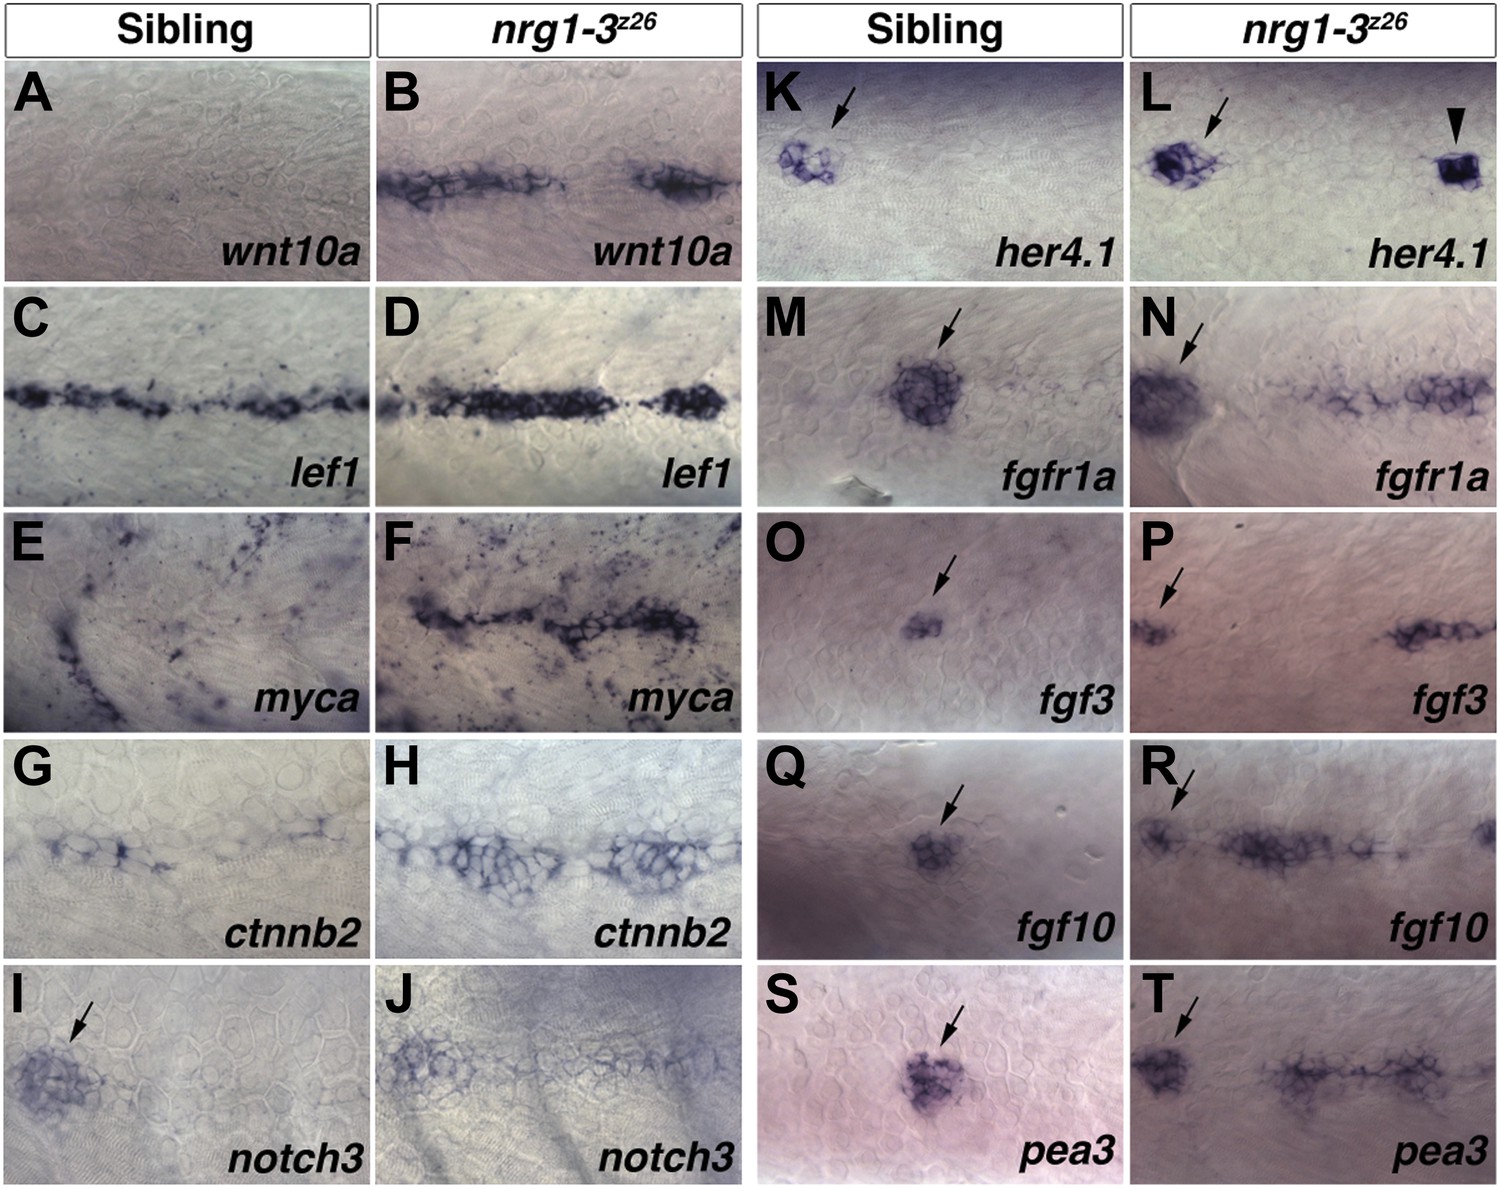
Increase in Wnt/β-catenin, Notch and Fgf signaling pathway gene expression in nrg1-3z26 mutant interneuromast cells.
Control siblings and nrg1-3z26 mutants were processed for in situ hybridization at 48 hpf. A Wnt ligand, wnt10a, is not expressed in control interneuromast cells (A) but is increased in nrg1-3z26 (B). The Wnt/β-catenin target gene lef1 is expressed in interneuromast cells in control siblings (C) but is greatly increased in nrg1-3z26 (D). An additional Wnt/β-catenin target myca shows no expression in interneuromast cells (E) but strong expression in clumps of interneuromast cells in nrg1-3z26 (F). ctnnb2 shows weak expression in control interneuromast cells (G) which is upregulated in nrg1-3z26 (H). (I) In controls, notch3 is expressed in primary neuromasts (arrow) but not interneuromast cells. (J) notch3 is upregulated in mutant interneuromast cells. (K) In controls, the Notch target her4.1 is expressed in primary neuromasts (arrow) but not interneuromast cells. (L) In mutants, her4.1 is expressed in primary neuromasts (arrow) but is also increased in discrete clusters of cells (arrowhead). In controls the Fgf pathway genes including the receptor fgfr1a (M), the two ligands fgf3 (O) and fgf10 (Q) and the Fgf target gene pea3 (S) are all expressed in primary neuromasts (arrow) but not in interneuromast cells. All Fgf pathway genes, fgfr1a (N), fgf3 (P) fgf10 (R) and pea3 (T), retain expression in primary neuromasts (arrow) but are upregulated in interneuromast cells of nrg1-3z26.
Figure 4—figure supplement 1
wnt10a is expressed in proliferating interneuromast cells while her4.1 is expressed in differentiating and mature neuromasts.
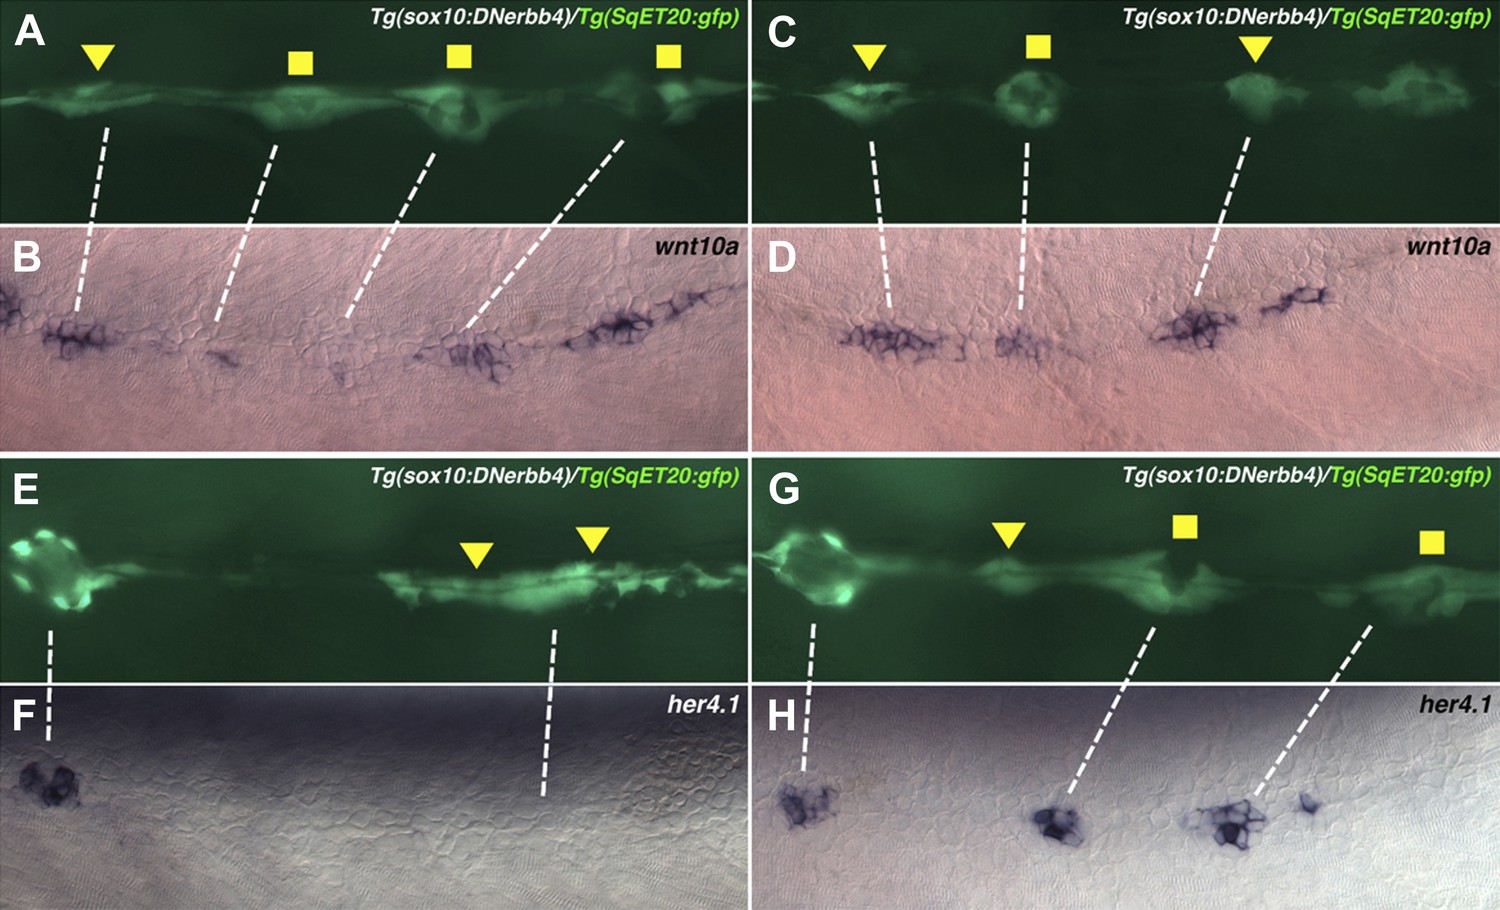
Lateral line cells from Tg(sox10:DNerbb4)/Tg(SqET20:gfp) were imaged at 48 hpf. Larvae were then fixed at processed for wnt10a or her4.1 in situ hybridization and photographed at the same level. (A–D) Proliferating interneuromast cells (arrowhead) express higher wnt10a than more mature intercalary neuromasts (square). (E–H) her4.1 is expressed in more mature intercalary neuromasts (squares), but is absent from more immature proliferating interneuromast cells (arrowhead).
Figure 4—figure supplement 2
wnt10a, fgf3 and fgf10 expression depends on Wnt/β-catenin signaling.
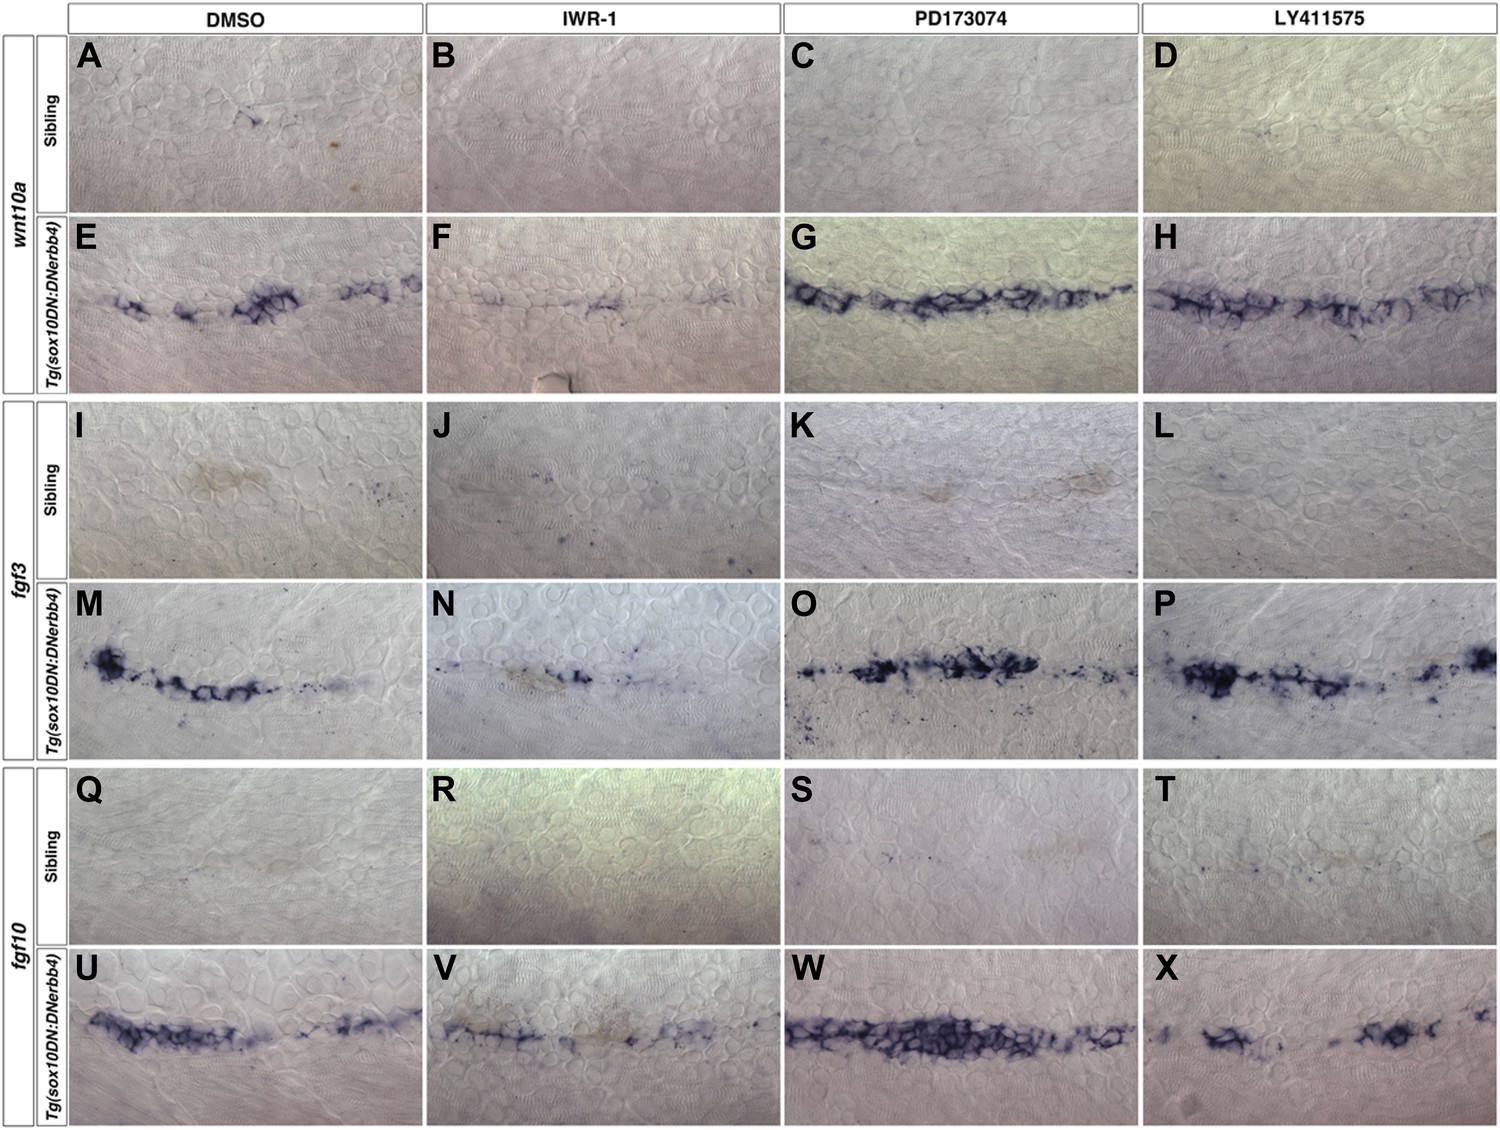
Control or Tg(sox10:DNerbb4) siblings were treated with DMSO, IWR-1, PD173074 or LY411575 at 32 hpf then fixed at 48 hpf for in situ hybridizations. In control siblings, inhibitor treatment has no effect on wnt10a (A–D), fgf3 (I–L) or fgf10 (Q–T) expression in interneuromast cells. wnt10a is strongly induced in Tg(sox10:DNerbb4) DMSO (E), PD173074 (G) or LY411575 (H) treated embryos but is greatly inhibited in IWR-1 treated embryos (F). Likewise, IWR-1 inhibits fgf3 (N) and fgf10 (V) expression in Tg(sox10:DNerbb4). Neither PD173074 or LY411575 effect fgf3 (O–P) or fgf10 expression (W–X) in Tg(sox10:DNerbb4).
Figure 4—figure supplement 3
wnt10a, fgf3 and fgf10 expression are induced within interneuromast cells after Wnt/β-catenin activation.
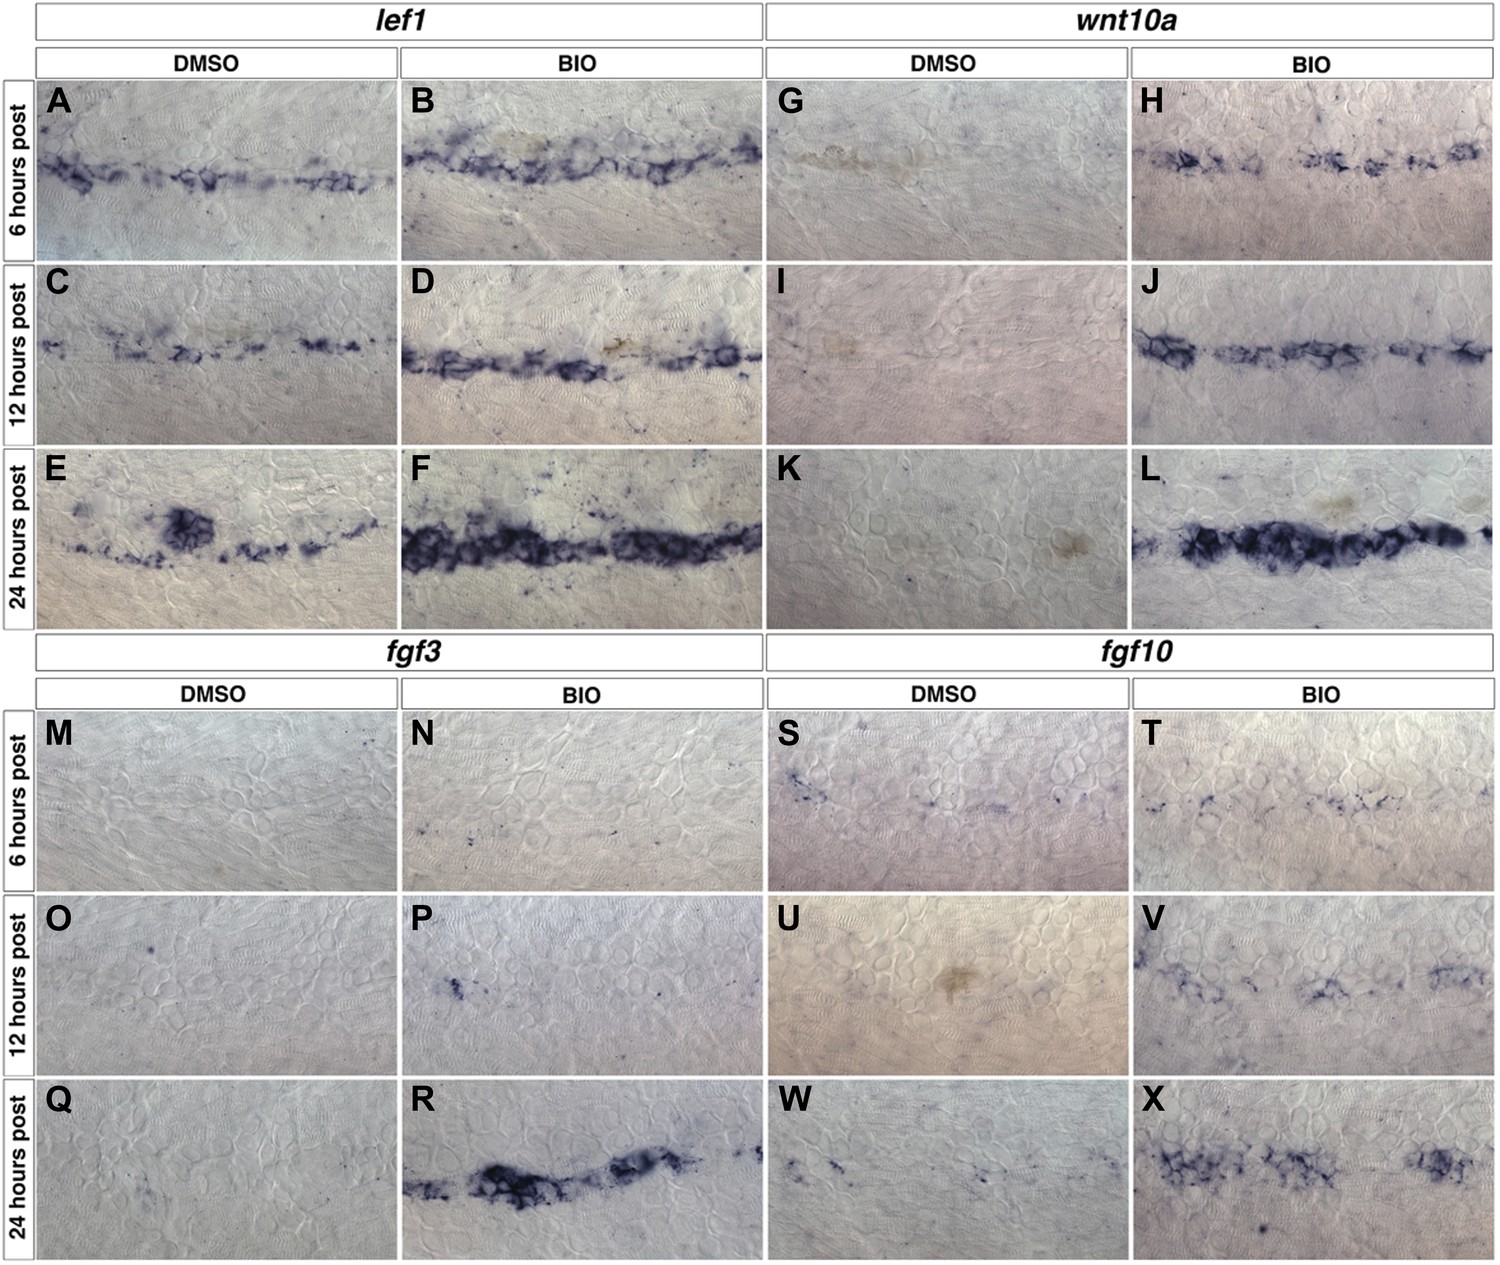
Wild type zebrafish were treated with DMSO or BIO at 48 hpf then fixed at 6, 12 or 24 hr post treatment for in situ hybridizations. The known Wnt/β-catenin target gene lef1 is expressed in DMSO treated interneuromast cells (A, C, E) and is greatly increased by BIO treatment (B, D, F). wnt10a is not expressed in control interneuromast cells from 6 to 24 hr post treatment (G, I, K). wnt10a is induced by BIO within 6 hr post (H) and this increase is maintained from 12 to 24 hr post (J, L). fgf3 (M, O, Q) and fgf10 (S, U, W) are not expressed within DMSO treated interneuromast cells. fgf3 is induced by 24 hr post BIO treatment (N, P, R), while fgf10 is induced within 12 hr of treatment (T, V, X).
Figure 5 with 1 supplement
Wnt/β-catenin and Fgf signaling target genes are expressed in interneuromast cells during wild type intercalary neuromast formation.
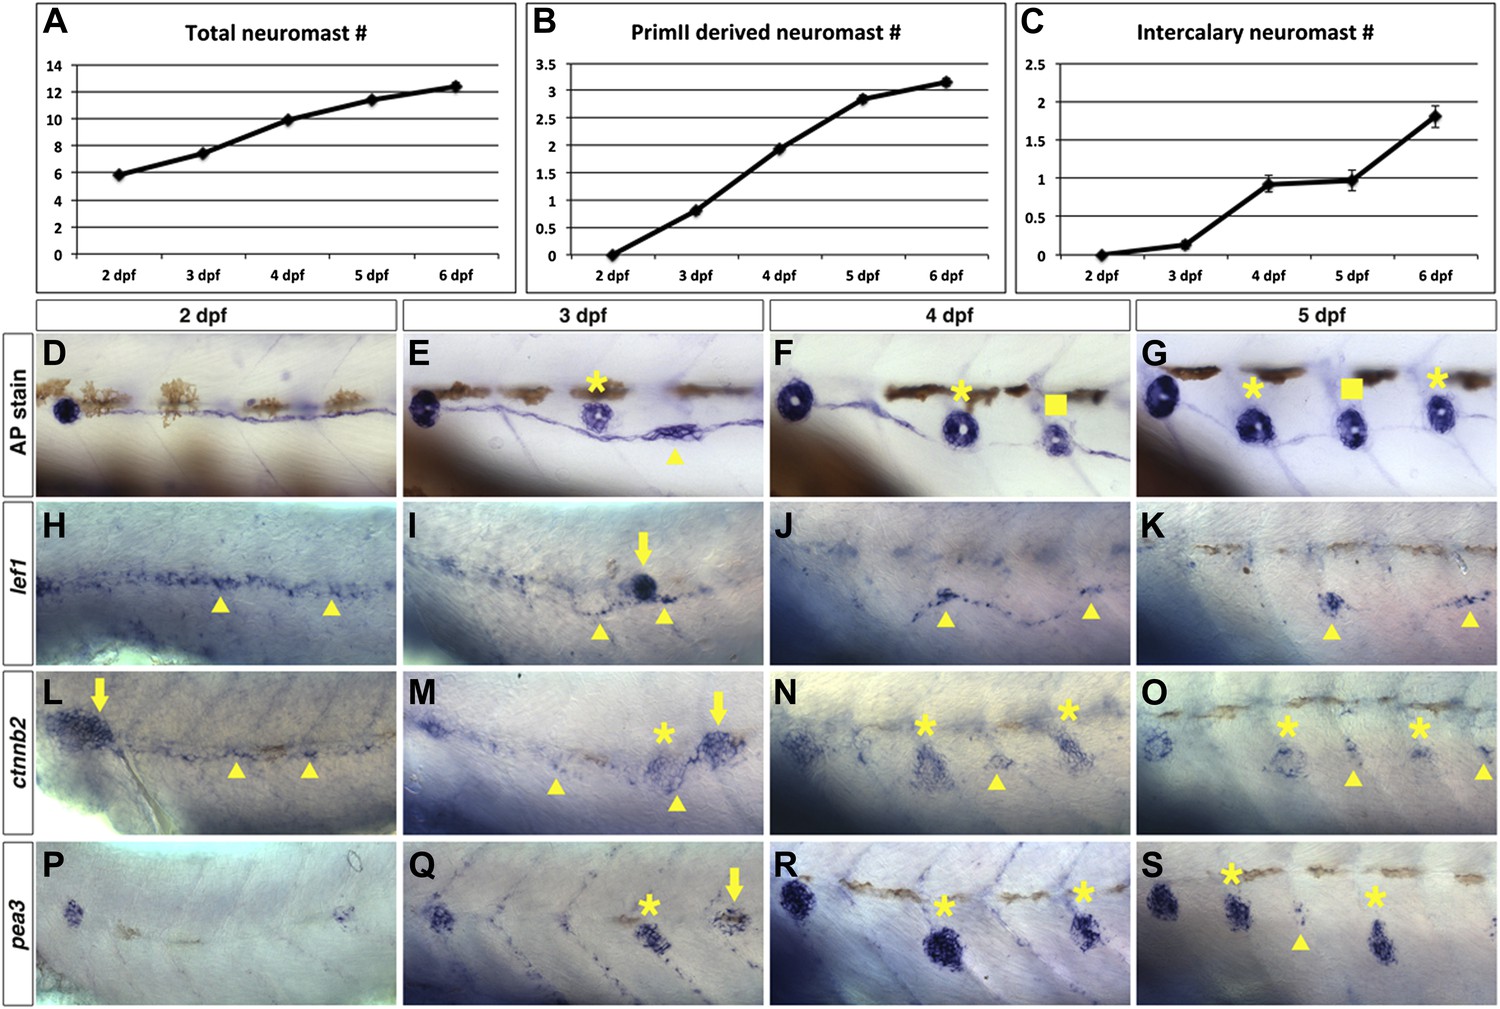
To see when intercalary neuromasts first arise we alkaline phosphatase stained wild type zebrafish at 2, 3, 4, 5 and 6 dpf. Quantification of total neuromast number shows a steady increase from 2 to 6 dpf (A). Most of the increase comes from primII deposited neuromasts (B). There is one intercalary neuromast by 4 dpf and two by 6 dpf (C). (D–G) Alkaline phosphatase staining from 2–5 dpf. The images were taken so that the first primI deposited neuromast is always at the left (without a label). Asterisk labels primII-derived neuromasts, the arrowhead labels interneuromast cells and squares label intercalary neuromasts. (H–K) lef1 in situ hybridization from 2–5 dpf. lef1 is expressed in interneuromast cells at 2 dpf (H, arrowhead) and is maintained in clumps of interneuromast cells from 3–5 dpf (I–K, arrowheads) that will likely give rise to intercalary neuromasts. The strong cluster of lef1 expression at 3 dpf is the leading edge of primII (I, arrow). lef1 is not expressed in mature neuromasts. (L–O) beta-catenin2 (ctnnb2) expression from 2–5 dpf. Similar to lef1, ctnnb2 is expressed in interneuromast cells at 2 dpf (L, arrowhead) and is maintained in clumps of interneuromast cells from 3–5 dpf (M–O, arrowhead). Unlike lef1, ctnnb2 is expressed in primary neuromasts (M–O, asterisk). (P–S) pea3 expression from 2–5 dpf. (P) At 2 dpf pea3 shows strong expression in primary neuromasts but not in interneuromast cells. (Q–R) At 3 and 4 dpf pea3 shows expression in primII (arrow) and primII derived neuromasts (asterisk) but still no interneuromast cell expression. At 5 dpf pea3 can be seen in a few cells near somite boundaries (S, arrowhead).
Figure 5—figure supplement 1
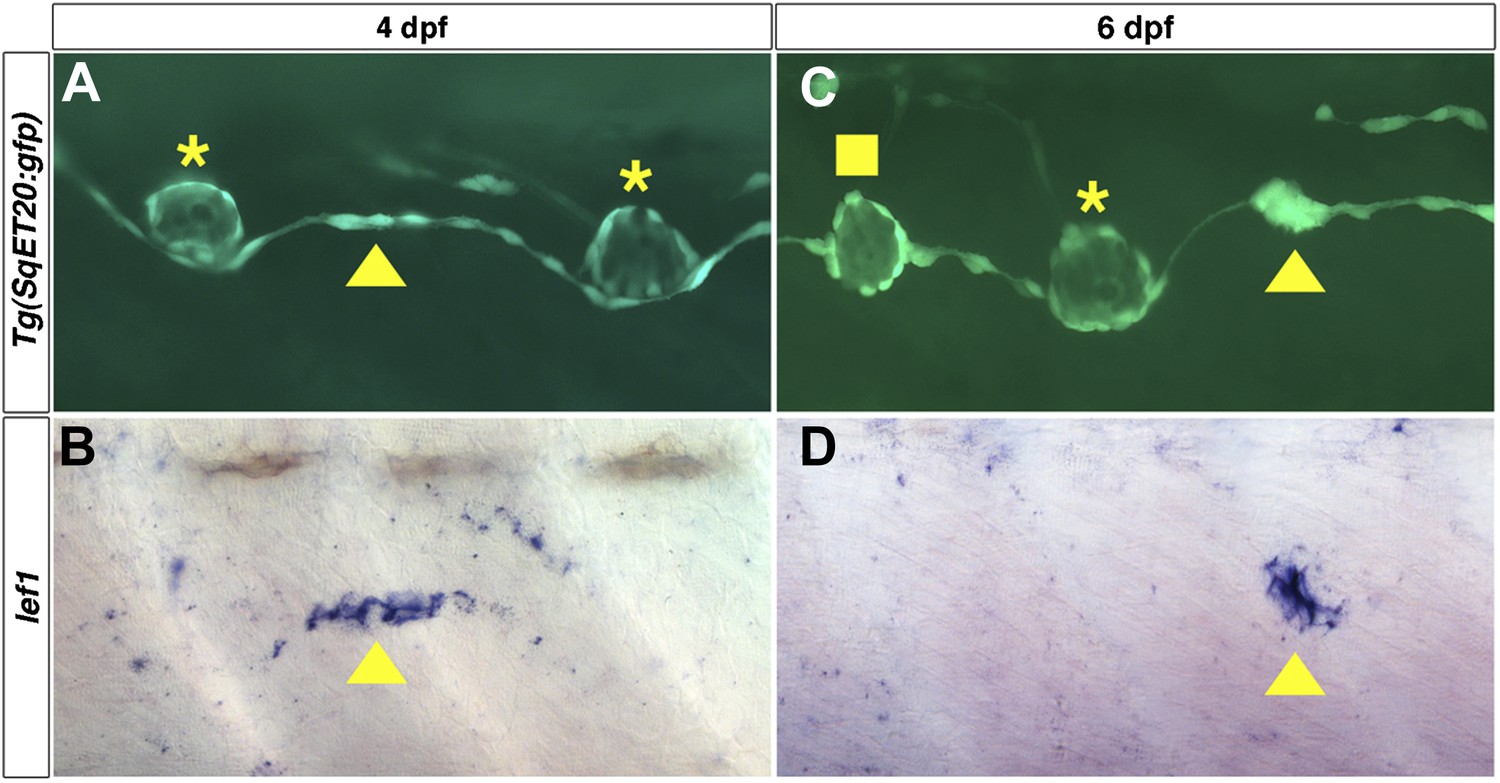
lef1 is expressed in clusters of interneuromast cells before they become intercalary neuromasts.
Lateral line cells expressing Tg(SqET20:gfp) were imaged at 4 or 6 dpf. Larvae were then fixed at processed for lef1 in situ hybridization and photographed at the same level. (A) At 4 dpf a small group of Tg(SqET20:gfp) positive interneuromast cells (arrowhead) can be seen between two primII deposited primary neuromasts (asterisk). This small cluster of interneuromast cells is positive for lef1 (B, arrowhead). (C) At 6 dpf a larger cluster of interneuromast cells is seen forming. Again this cluster of cells is lef1 positive (D, arrowhead). Interestingly, at 6 dpf one intercalary neuromast has formed (C, square), but it is not positive for lef1 (D). Suggesting lef1 is quickly decreased as neuromasts mature.
Figure 6
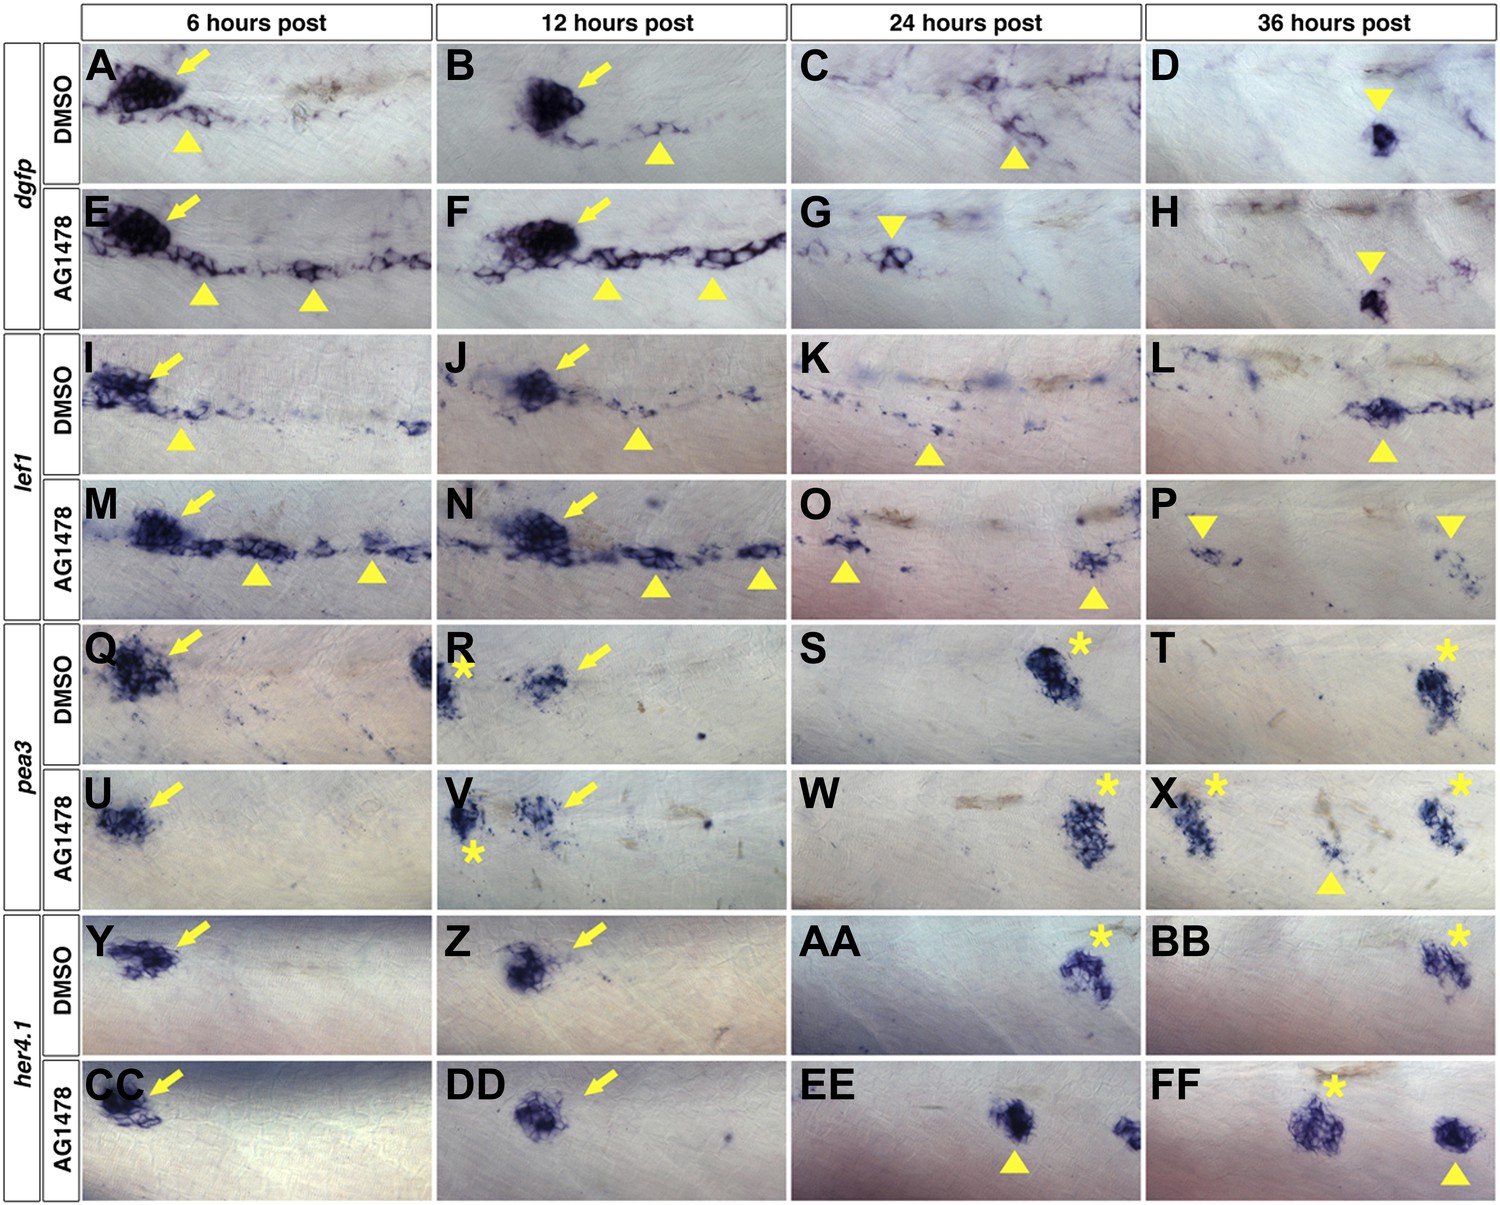
Wnt/β-catenin expression precedes Fgf and Notch expression after ErbB inhibition.
To determine which signaling pathways are induced first we treated wild type zebrafish starting at 48 hpf with DMSO or AG1478 then fixed at 6, 12, 24 and 36 hr post treatment. All images were taken between the first two primary neuromasts. In DMSO treated Wnt reporter Tg(Tcf/Lef-miniP:dGFP) strong expression is seen in primII (arrow) at 6 and 12 hr post treatment but also in some interneuromast cells (A–B, arrowhead). By 12 and 36 hr there are only clumps of interneuromast cells expressing the reporter (C–D, arrowhead). 6 hr post AG1478 treatment there is a large increase in Wnt reporter expression specifically within interneuromast cells (E, arrowhead). This AG1478 induced increased expression is maintained after 12 hr (F) but has started to go down by 24 hr (G) and is only seen in a few interneuromast cells by 36 hr (H). (I–P) lef1 mirrors Wnt reporter expression. In DMSO, lef1 is expressed in primII (arrow) and few interneuromast cells at 6 (I) and 12 hr (J). At 24 hr post DMSO lef1 is maintained in a few interneuromast cells (K). At 36 hr post DMSO, lef1 is seen in clumps of cells likely corresponding to normally developing intercalary neuromasts (L, arrowhead). AG1478 induces lef1 within interneuromast cells at 6 (M) and 12 hr (N). By 24 (O) and 36 hr (P) post AG1478 treatment lef1 is decreased in interneuromast cells compared to the 6 and 12 hr time points, and is maintained in a few clumps of interneuromast cells (arrowhead). (Q–X) pea3 shows a later induction than Wnt target genes. In controls pea3 is only seen in primII (arrow) or primII deposited neuromasts (asterisk) at all time points tested (Q–T). (U–X) After AG1478 treatment, pea3 is maintained in deposited neuromasts (asterisk) and begins to be expressed in interneuromast cells only at 36 hr post treatment (X, arrowhead). (Y–FF) her4.1 expression is seen before pea3 expression. (Y–BB) In controls, her4.1 is seen in primII (arrow) and deposited neuromasts (asterisk). In AG1478 treated larvae her4.1 is seen in large clusters of cells starting at 24 hr post treatment and can still be seen at 36 hr (EE–FF, arrowhead).
Figure 7 with 1 supplement
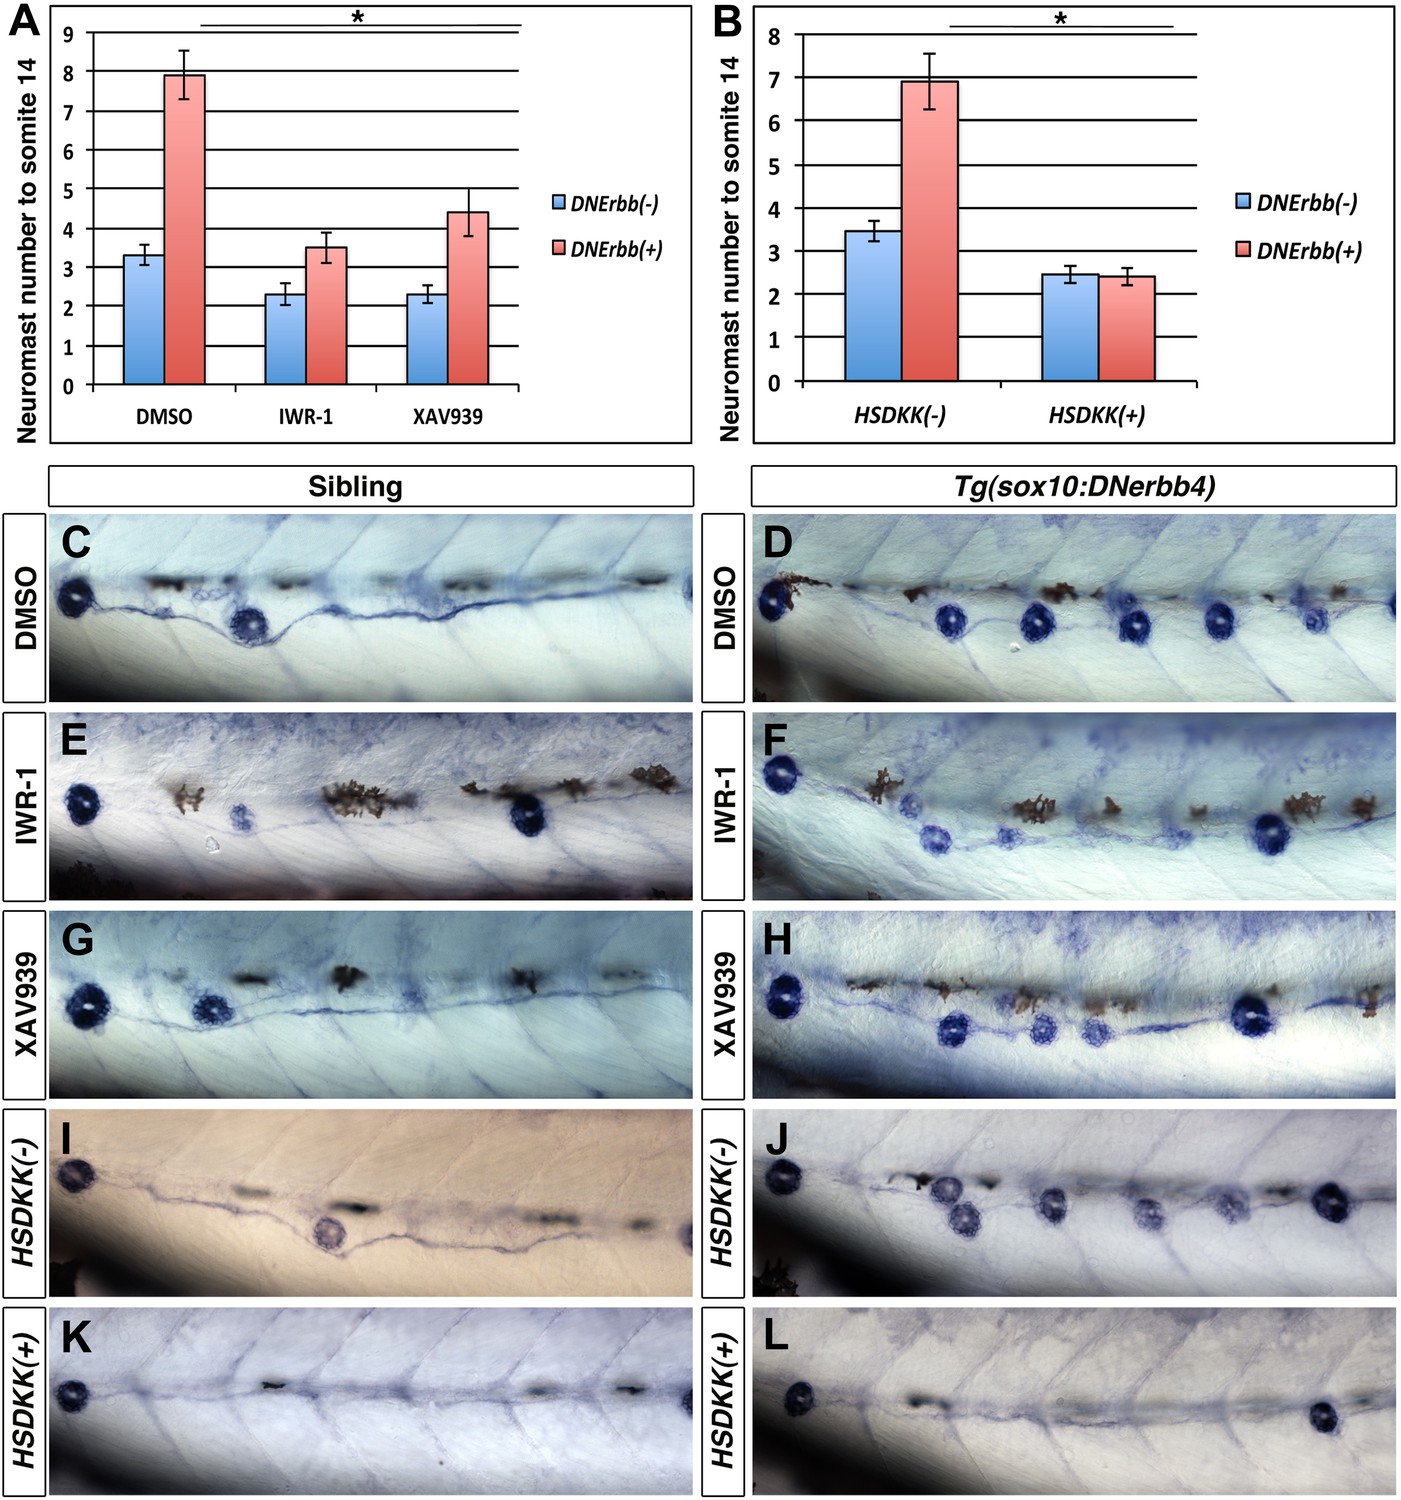
Wnt/β-catenin signaling is required for extra neuromast formation in the absence of ErbB signaling.
To block Wnt/β-catenin signaling wild type or Tg(sox10:DNerbb4) fish were treated with two different inhibitors IWR-1 or XAV939 for 24 hr starting at 32 hpf. Neuromast number up to somite 14 was counted at 3 dpf (A). Compared to DMSO, both IWR-1 and XAV939 significantly inhibited neuromast formation in Tg(sox10:DNerbb4) (A, red bars, One-way ANOVA with Tukey pairwise comparison, p≤0.05). Representative images of alkaline phosphatase stained control siblings treated with DMSO (C), IWR-1 (E) or XAV939 (G) or Tg(sox10:DNerbb4) treated with DMSO (D), IWR-1 (F) or XAV939 (H). (B) Neuromast counts at 3 dpf of control, Tg(sox10:DNerbb4), Tg(hsp70l:dkk1b) or Tg(sox10:DNerbb4)/Tg(hsp70l:dkk1b) after heat shock at 32 hpf. Tg(sox10:DNerbb4)/Tg(hsp70l:dkk1b) double transgenics show a complete loss of extra neuromast formation seen in Tg(sox10:DNerbb4) (B, Student’s t-test, p=2.4E−16). Representative images of alkaline phosphatase stained sibling (I), Tg(sox10:DNerbb4) (J), Tg(hsp70l:dkk1b) (K) or Tg(sox10:DNerbb4)/Tg(hsp70l:dkk1b) (L) at 3 dpf. The first deposited neuromast is to the left for all alkaline phosphatase images.
Figure 7—figure supplement 1
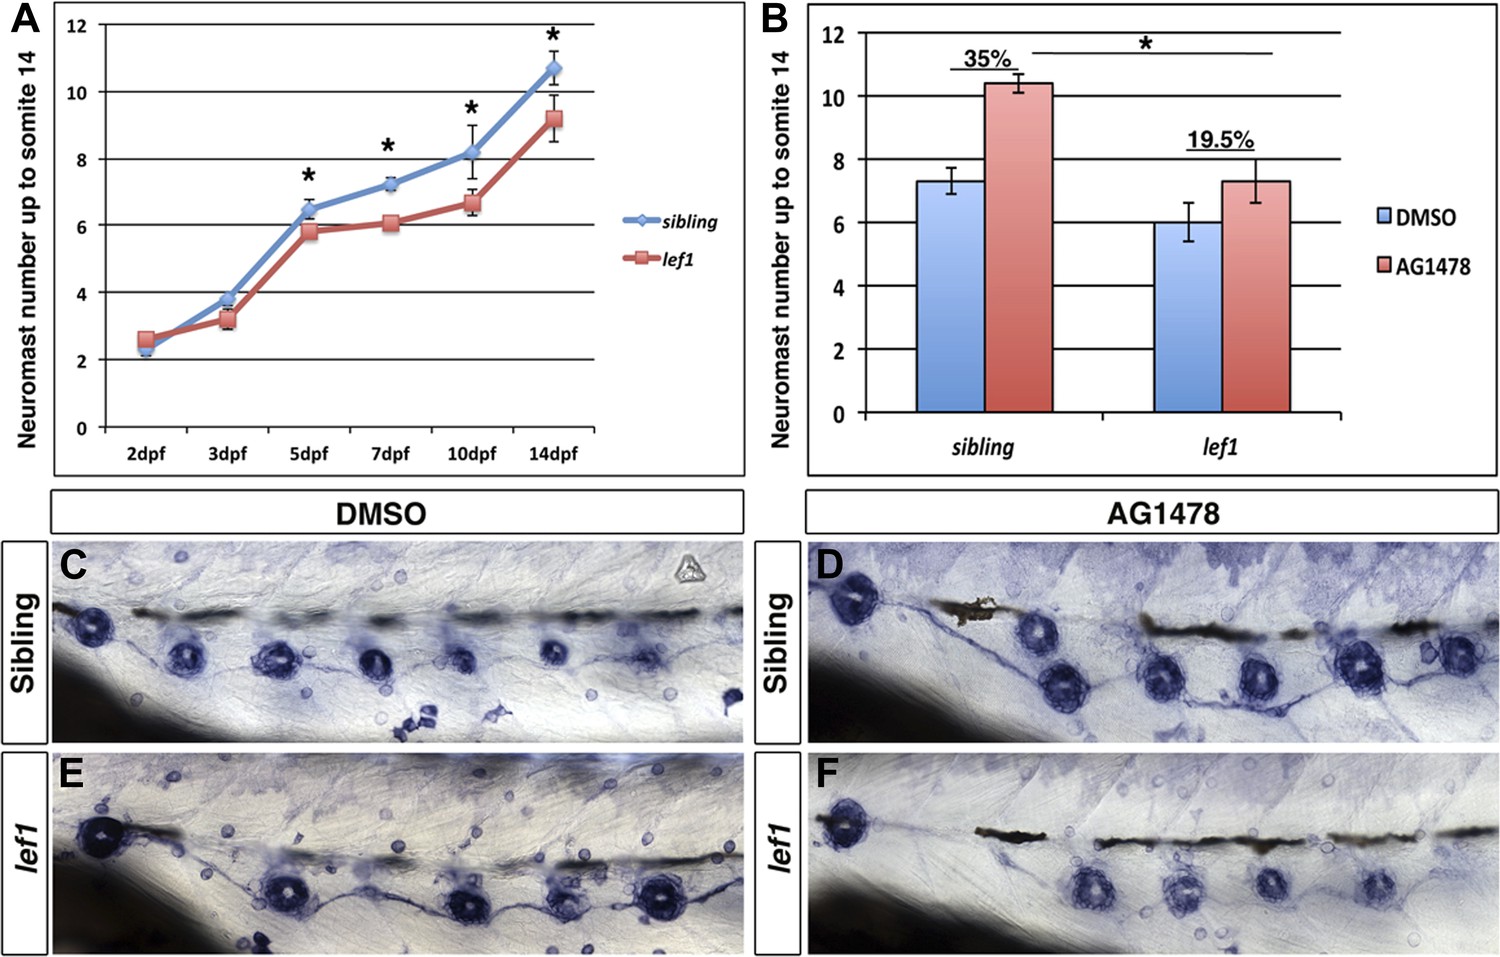
lef1 mutants have decreased intercalary neuromast formation in the absence of ErbB signaling.
Control siblings or lef1 mutants were fixed at 2, 3, 5, 7, 10 and 14 dpf and processed for alkaline phosphatase staining. Because lef1 mutants have a decrease in neuromast deposition, we counted neuromasts just up to somite 14. At 2 and 3 dpf lef1 mutants have the same number of neuromasts as controls (A). From 5 dpf onward there is a significant decrease in neuromast formation in lef1 (A, Student's t-test, p≤0.001). Challenging lef1 mutants with AG1478 at 48 hpf shows only a 19.5% increase in neuromast formation compared to DMSO treatment by 5 dpf, vs 35% increase seen in AG1478 treated control siblings (B, Student's t-test, p=1.7 E−8). Representative images of alkaline phosphatase stained DMSO treated sibling (C) or lef1 mutant (E) or AG1478 treated sibling (D) or lef1 (F).
Figure 8
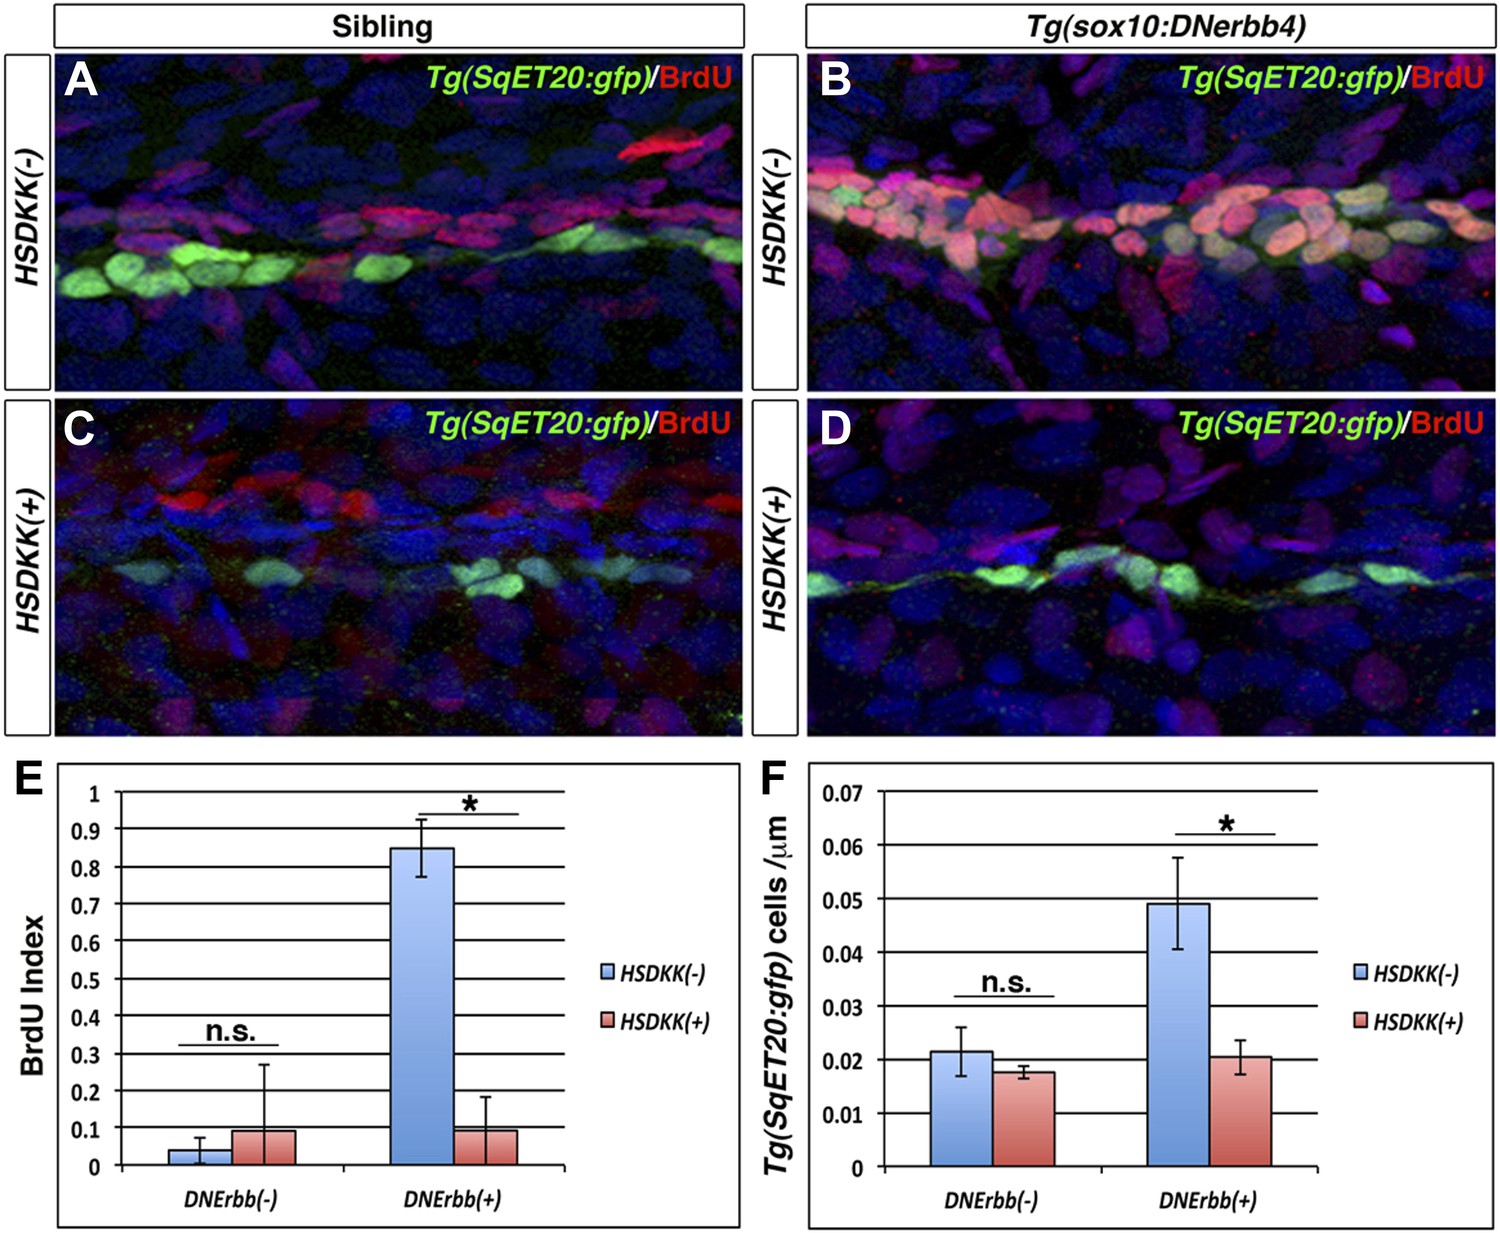
Wnt/β-catenin signaling is required for proliferation of interneuromast cells in the absence of ErbB signaling.
Control sibling, Tg(sox10:DNerbb4), Tg(hsp70l:dkk1b) or Tg(sox10:DNerbb4)/Tg(hsp70l:dkk1b), all with Tg(SqET20:gfp) in the background, were heat shocked at 32 hpf then placed in BrdU solution. Fish were fixed at 48 hpf and processed for BrdU and GFP immunohistochemistry (A–D). Compared to control siblings (A), Tg(sox10:DNerbb4) (B) show a strong increase in BrdU incorporation into Tg(SqET20:gfp) positive interneuromast cells. BrdU incorporation in Tg(sox10:DNerbb4) is blocked by over expression of Dkk1b (D). (E) Quantification of BrdU index shows no difference between control and Tg(hsp70l:dkk1b) (Student’s t-test, p=0.6) but a large decrease between Tg(sox10:DNerbb4) and Tg(sox10:DNerbb4)/Tg(hsp70l:dkk1b) (Student’s t-test, p=3.4 E−8). (F) Quantification of Tg(SqET20:gfp) cell number again shows no difference between control and Tg(hsp70l:dkk1b) (Student’s t-test, p=0.14) but a large decrease between Tg(sox10:DNerbb4) and Tg(sox10:DNerbb4)/Tg(hsp70l:dkk1b) (Student’s t-test, p=1 E−4).
Figure 9 with 1 supplement
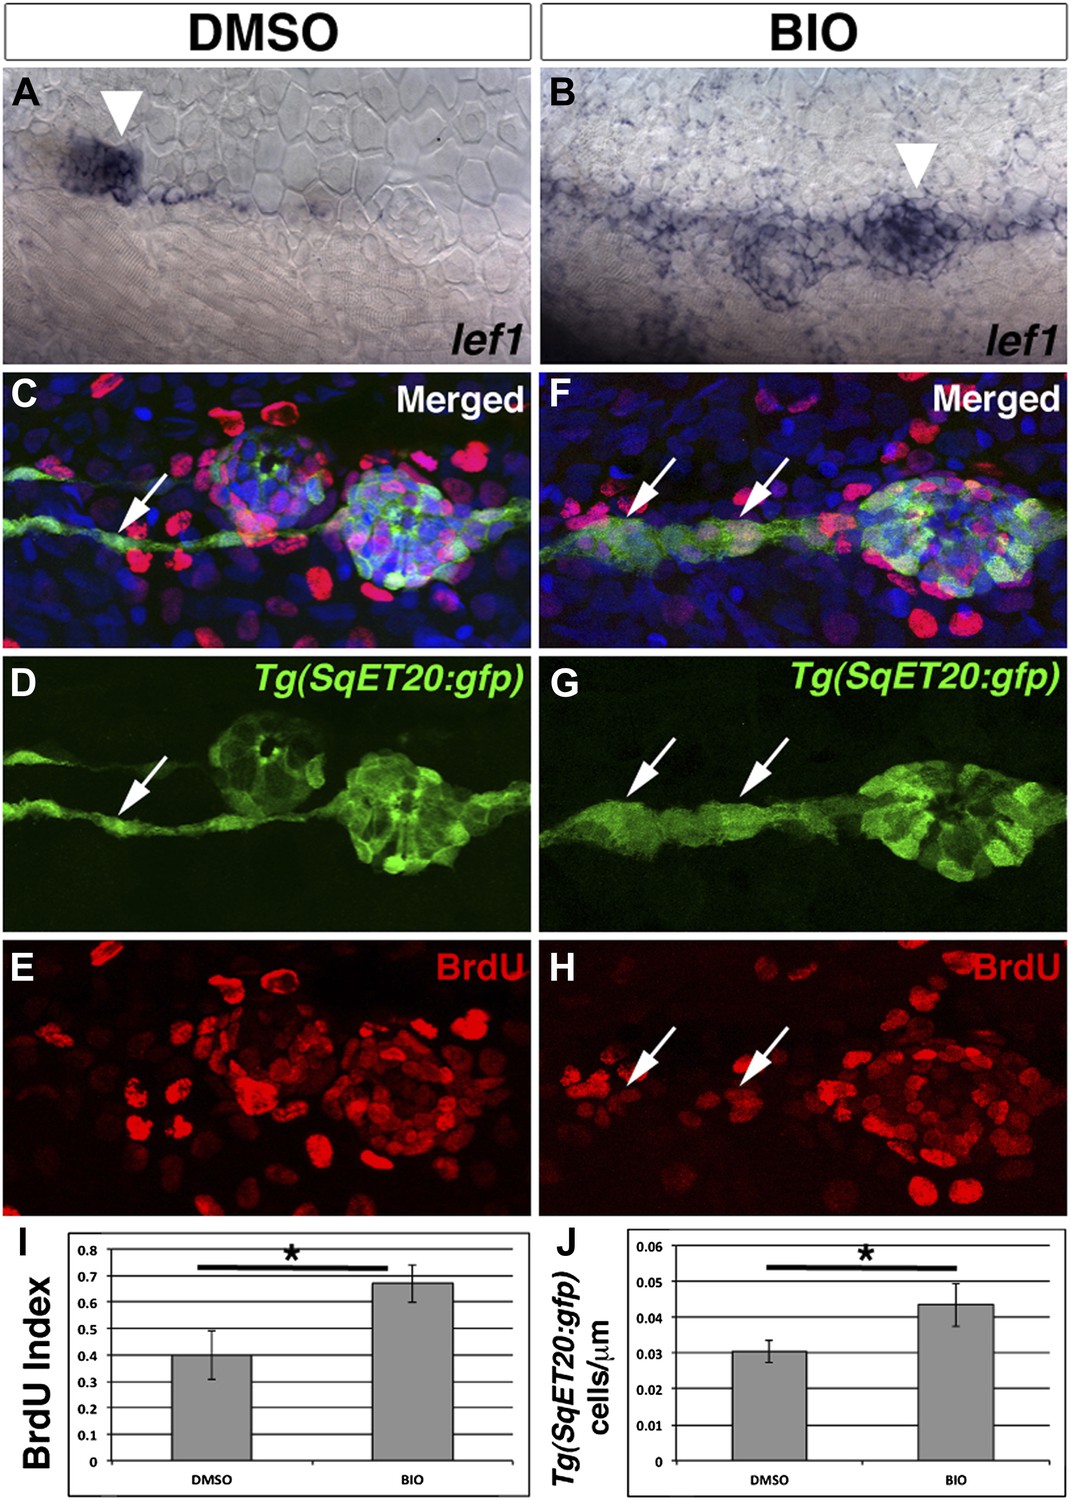
Pharmacological activation of Wnt/β-catenin signaling is sufficient to induce interneuromast cell proliferation.
To verify BIO induces Wnt/β-catenin signaling we treated 48 hpf zebrafish with DMSO or BIO for 6 hr and then fixed and stained for lef1 expression. Compared to DMSO treated fish, BIO induces expression of the Wnt/β-catenin target lef1 in neuromasts and interneuromast cells (A–B). The large cluster of cells that are labeled in both (A) and (B) is primII (arrowhead). To measure proliferation Tg(SqET20:gfp) fish were treated with BrdU plus DMSO or BIO at 48 hpf and fixed at 72 hpf. (C–E) DMSO treated interneuromast cells (arrow) show single chain morphology with rare BrdU incorporation. BrdU incorporation is strong in primary neuromasts. (F–H) BIO treated fish show increased interneuromast cells with BrdU incorporation (arrows). Quantification of BrdU index (I, Student’s t-test, p=0.0003) and Tg(SqET20:gfp) positive cell number (J, Student’s t-test, p=2.75 E−5) shows a significant increase in both after BIO treatment.
Figure 9—figure supplement 1
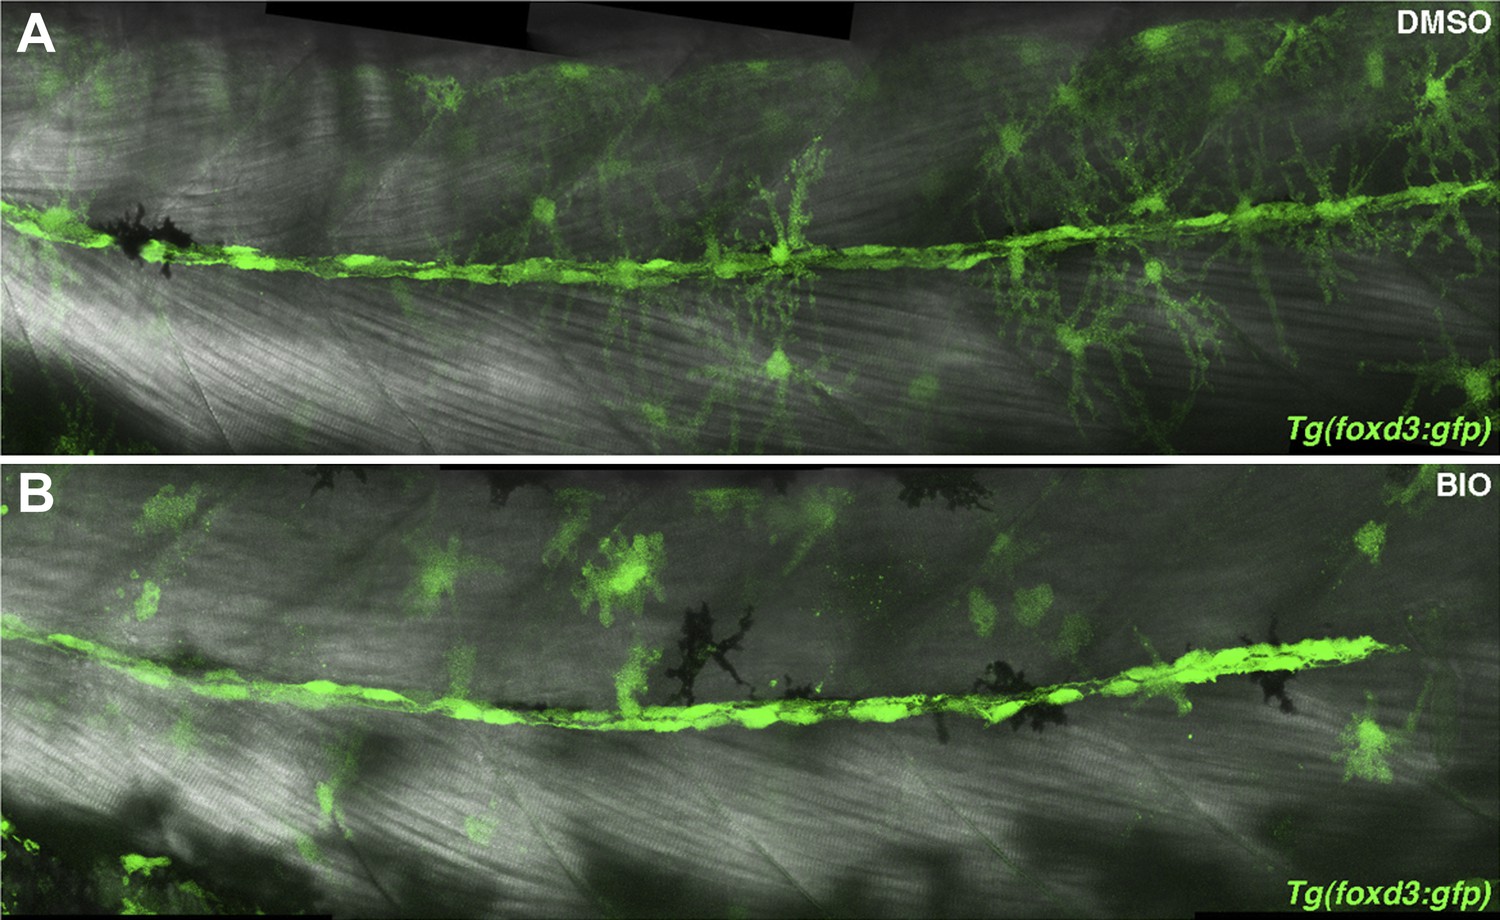
Schwann cells are still present after BIO treatment.
Tg(foxd3:gfp) larvae were treated with DMSO or BIO at 32 hpf then imaged at 48 hpf. (A) DMSO treated larvae show a line of Tg(foxd3:gfp) positive Schwann cells along the midline. (B) BIO treated larvae also show Schwann cells along the midline. Schwann cell migration is not complete due to stalling of the primordium.
Figure 10 with 1 supplement
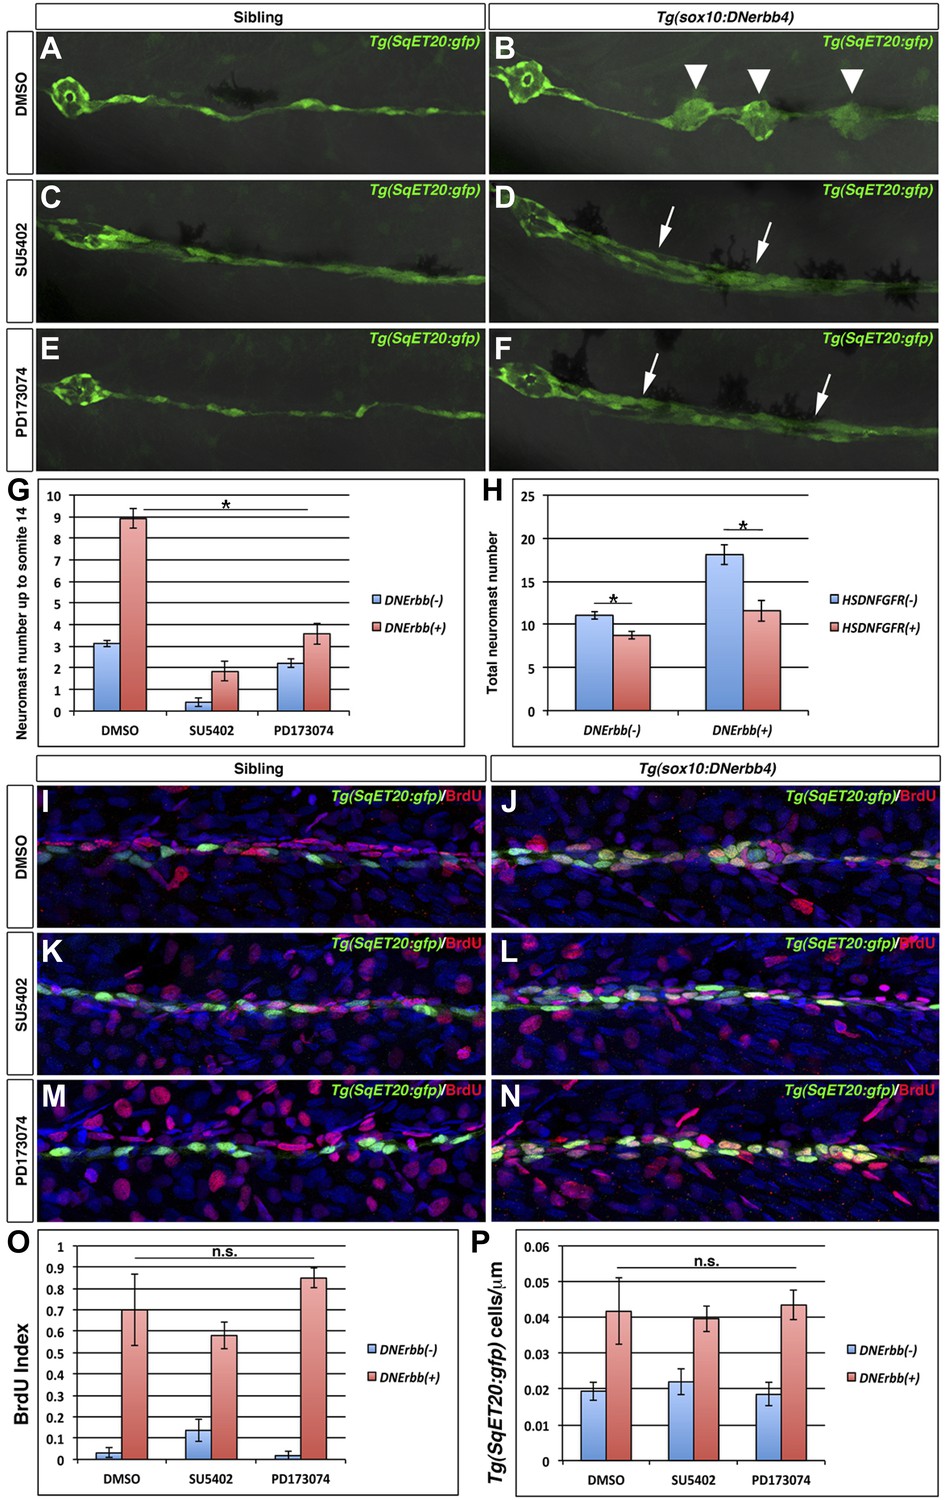
Fgf signaling is required for neuromast formation but not interneuromast proliferation in the absence of ErbB signaling.
Control Tg(SqET20:gfp) or Tg(sox10:DNerbb4)/Tg(SqET20:gfp) larvae were treated for 24 hr starting at 32 hpf with DMSO, SU5402 or PD173074 then allowed to develop until 3 dpf and imaged (A–F). The first primary neuromast is to the left in all images. Control siblings (A) show no intercalary neuromasts, while Tg(sox10:DNerbb4) have several (B, arrowhead). Tg(sox10:DNerbb4) treated with SU5402 (D) or PD173074 (F) show clumps of interneuromast cells (arrows) compared to sibling SU5402 (C) or PD173074 (E) treated but no intercalary neuromasts. (G) Quantification of neuromast number up to somite 14 shows a decrease when control siblings are treated with SU5402 or PD173074 (blue bars, One-way ANOVA with Tukey pairwise comparison, p≤0.05). (G) Extra neuromast formation is inhibited when Tg(sox10:DNerbb4) fish are treated with SU5402 or PD173074 (red bars, one-way ANOVA with Tukey pairwise comparison, p≤0.05). (H) Tg(sox10:DNerbb4) were crossed to Tg(hsp70l:dnfgfr1-EGFP) and larvae were heat shocked at 32 hpf then allowed to grow to 3 dpf. DNFgfr1 reduces neuromasts slightly in control siblings (blue bars, Student’s t-test, p=7.1 E−9) and completely blocks extra neuromast formation in Tg(sox10:DNerbb4) (red bars, Student’s t-test, p=1.5 E−7). To measure proliferation, control Tg(SqET20:gfp) or Tg(sox10:DNerbb4)/Tg(SqET20:gfp) larvae were treated with BrdU plus DMSO, SU5402 or PD173074 at 32 hpf then fixed at 48 hpf. Fish were then processed for BrdU and GFP immunohistochemistry (I–N). All Tg(sox10:DNerbb4)/Tg(SqET20:gfp) treated fish (J, L and N) show higher BrdU incorporation when compared to control Tg(SqET20:gfp) siblings (I, K and M). (O) Quantification of BrdU index shows no significant difference between DMSO, SU5402 or PD173074 treated Tg(sox10:DNerbb4) larvae (red bars, one-way ANOVA with Tukey pairwise comparison, p≥0.1). (P) Quantification of Tg(SqET20:gfp) cell number shows no difference in Tg(sox10:DNerbb4) larvae treated with DMSO, SU5402 or PD173074 (red bars, one-way ANOVA with Tukey pairwise comparison, p≥0.9).
Figure 10—figure supplement 1
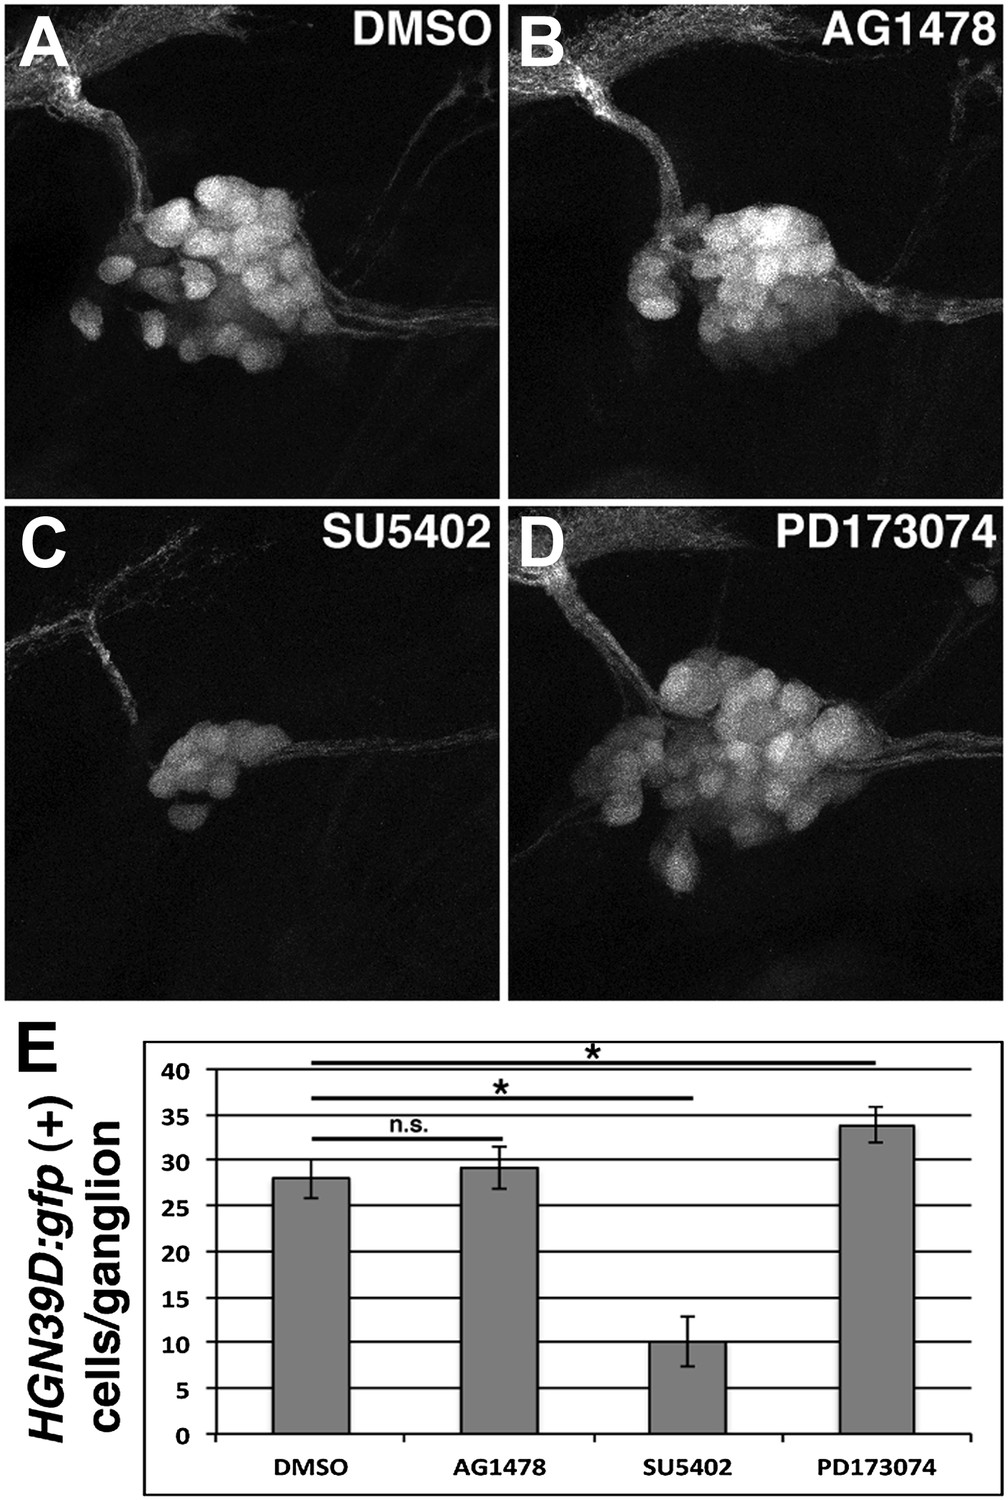
Posterior lateral line ganglion neurons are affected differently by SU5042 or PD173074 treatment.
Tg(HGN39D:gfp) transgenics were treated with indicated drugs at 48 hpf, allowed to develop for 24 hr then imaged. DMSO (A) and AG1478 (B) have similar ganglion size. SU5402 reduces ganglion size (C), while PD173074 increases ganglion size (D). (E) Quantification of GFP positive cells per ganglion. There is no significant difference between DMSO and AG1478 (one-way ANOVA with Tukey pairwise comparison, p=0.9). SU5402 induces a reduction in cell number (one-way ANOVA with Tukey pairwise comparison, p≤0.05). PD173074 induces a mild increase in cell number (one-way ANOVA with Tukey pairwise comparison, p≤0.05).
Figure 11
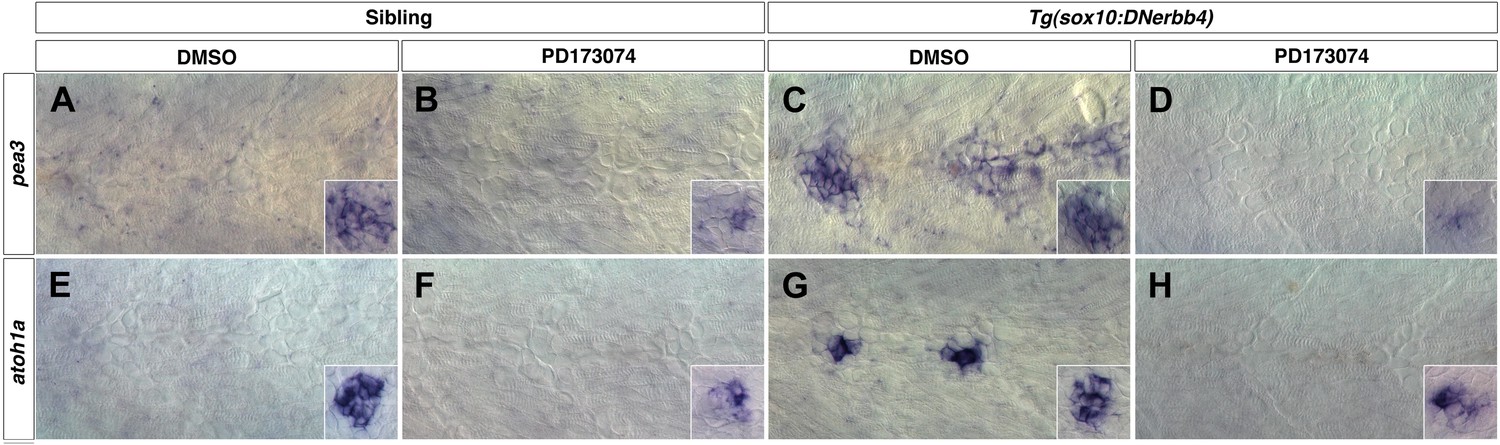
Fgf signaling is required for neuromast differentiation.
Control or Tg(sox10:DNerbb4) siblings were treated with DMSO or PD173074 at 32 hpf then fixed at 48 hpf. To verify that Fgf signaling was blocked, we performed in situ hybridazation for the Fgf target pea3 (A–D). (A) In controls treated with DMSO, pea3 is not expressed in interneuromast cells but is expressed in neuromasts (inset). (B) Control siblings treated with PD173074 show downregulation of pea3 in neuromasts (inset). (C) As shown for nrg1-3z26, Tg(sox10:DNerbb4) have an upregulation of pea3 within interneuromast cells. (D) This upregulation of pea3 is blocked by PD173074, illustrating that Fgfr signaling is inhibited. (E) In controls, atoh1a is only expressed in neuromasts (inset). (F) PD173074 decreases atoh1a in primary neuromasts (inset). (G) atoh1a is upregulated in differentiating interneuromast cells in Tg(sox10:DNerbb4). (H) This upregulation of atoh1a in interneuromast cells is completely blocked by PD173074, while some expression is still retained in primary neuromasts (inset).
Figure 12
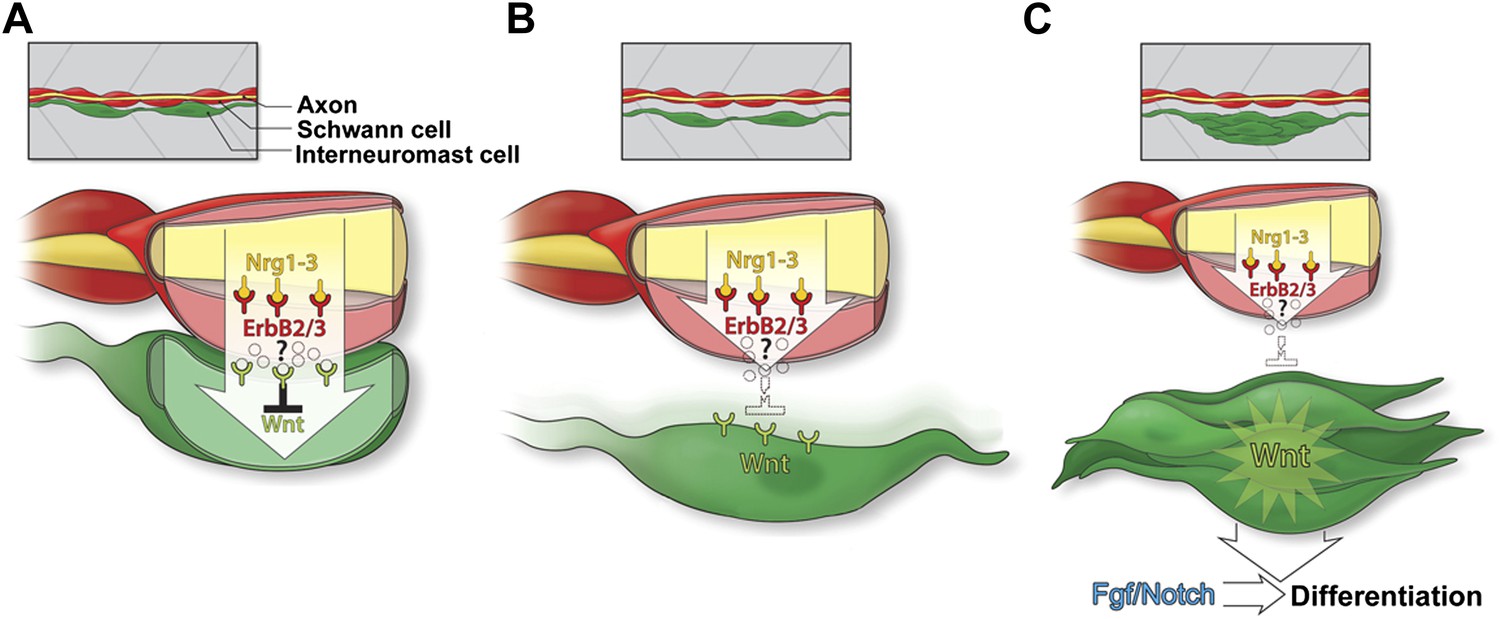
Model of Schwann cell inhibition of intercalary neuromast formation.
(A) Schwann cells (red) co-migrate with lateral line axons (yellow) and interneuromast cells (green). Nrg1-3 present on the axon induces Schwann cell migration and proliferation through activation of ErbB2/3B. As interneuromast cells are deposited they remain in close proximity to Schwann cells. This interaction induces inhibition of Wnt/β-catenin signaling by an unknown mechanism. (B) As interneuromast cells migrate ventrally away from Schwann cells, this Wnt/β-catenin inhibition is released. (C) Release of inhibition leads to increased Wnt/β-catenin signaling and proliferation followed by Fgf signaling and differentiation.
Figure 13
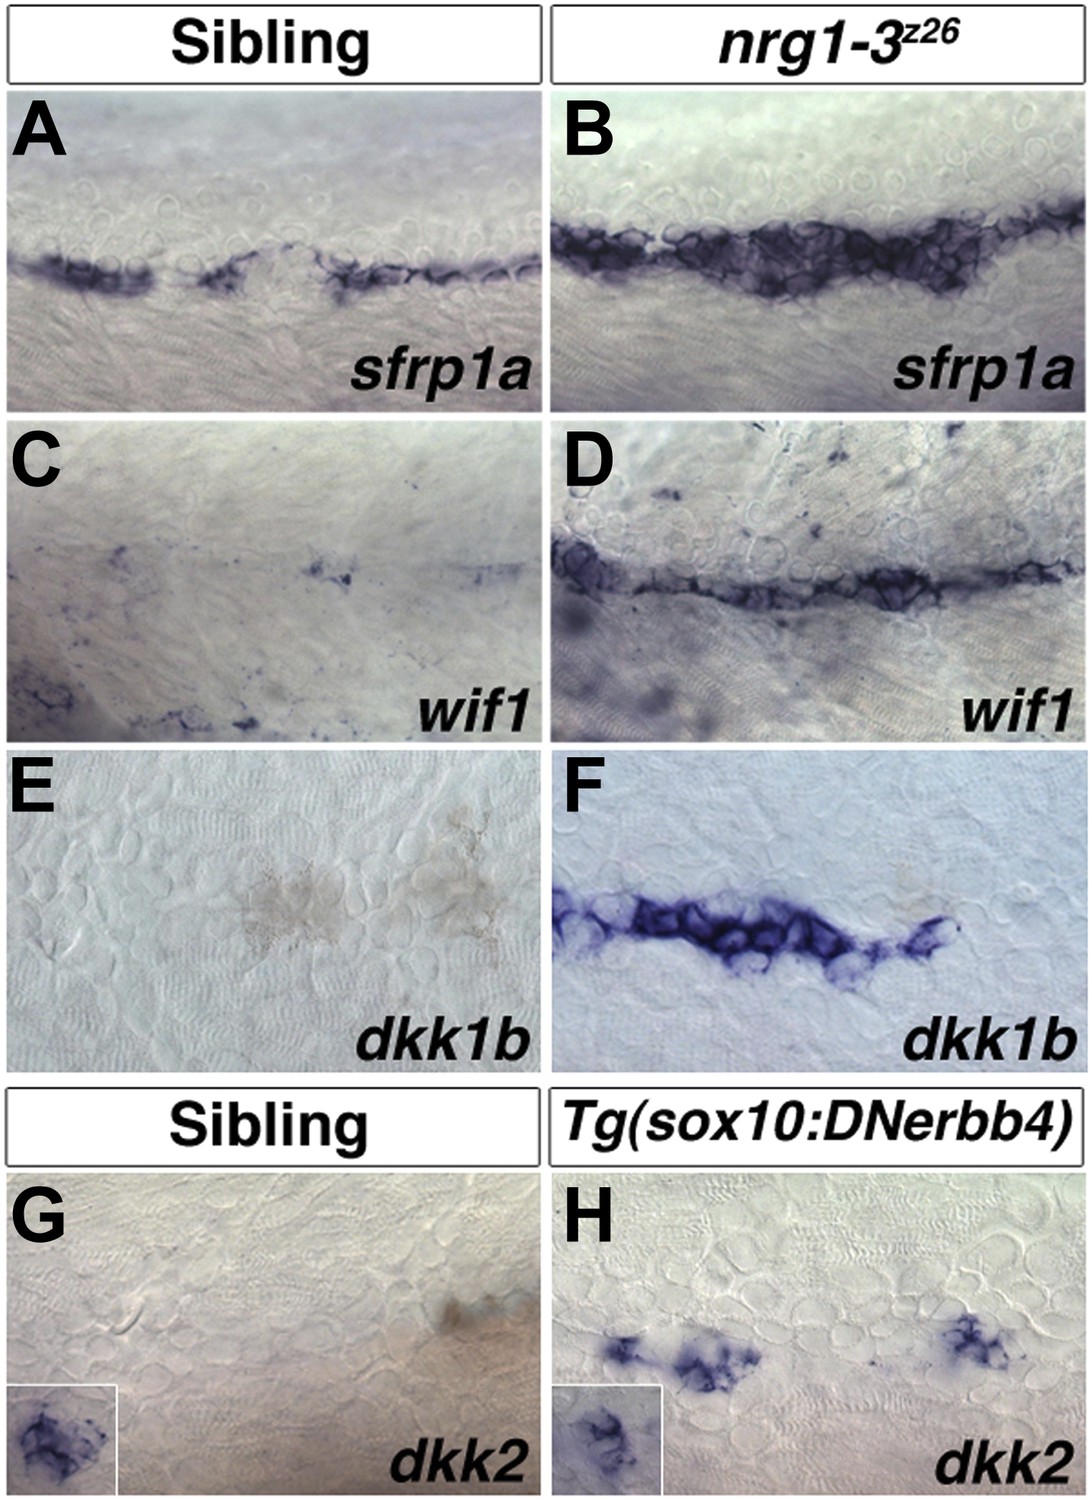
Expression of several Wnt/β-catenin inhibitors are increased in nrg1-3z26.
Control sibling and nrg1-3z26 mutants were fixed at 48 hpf and processed for in situ hybridization. Control larvae show sfrp1a expression in interneuromast and mantle cells (A). Expression of sfrp1a is increased in nrg1-3z26 (B). Control larvae show no expression of wif1 (C) or dkk1b (F) in interneuromast or Schwann cells. Both wif1 (D) and dkk1b (E) are induced in interneuromast cells of nrg1-3z26. (G) Control larvae show expression of dkk2 in primary neuromasts (inset) but not in interneuromast or Schwann cells. (H) In Tg(sox10:DNerbb4) dkk2 is expressed in neuromasts (inset), and is upregulated in interneuromast cells.
Videos
Video 1
Time-lapse recording of Tg(sox10:DNerbb4)/Tg(SqET20:gfp)/Tg(clndB:H2B-mcherry) during intercalary neuromast formation.
The time-lapse runs from 32 to 72 hpf. One frame was taken every 7 min. Four intercalary neuromasts form during this time.
Video 2
Time-lapse recording of control Tg(SqET20:gfp)/(Tg(clndB:H2A-mcherry) from approximately 48–72 hpf.
One frame was taken every 7 min. No interneuromast cell proliferation is seen during this time.
Download links
A two-part list of links to download the article, or parts of the article, in various formats.
Downloads (link to download the article as PDF)
Open citations (links to open the citations from this article in various online reference manager services)
Cite this article (links to download the citations from this article in formats compatible with various reference manager tools)
ErbB expressing Schwann cells control lateral line progenitor cells via non-cell-autonomous regulation of Wnt/β-catenin
eLife 3:e01832.
https://doi.org/10.7554/eLife.01832


