A sphingolipid-dependent diffusion barrier confines ER stress to the yeast mother cell
- ETH Zürich, Switzerland
- Albert Einstein College of Medicine of Yeshiva University, United States
Figures
Figure 1
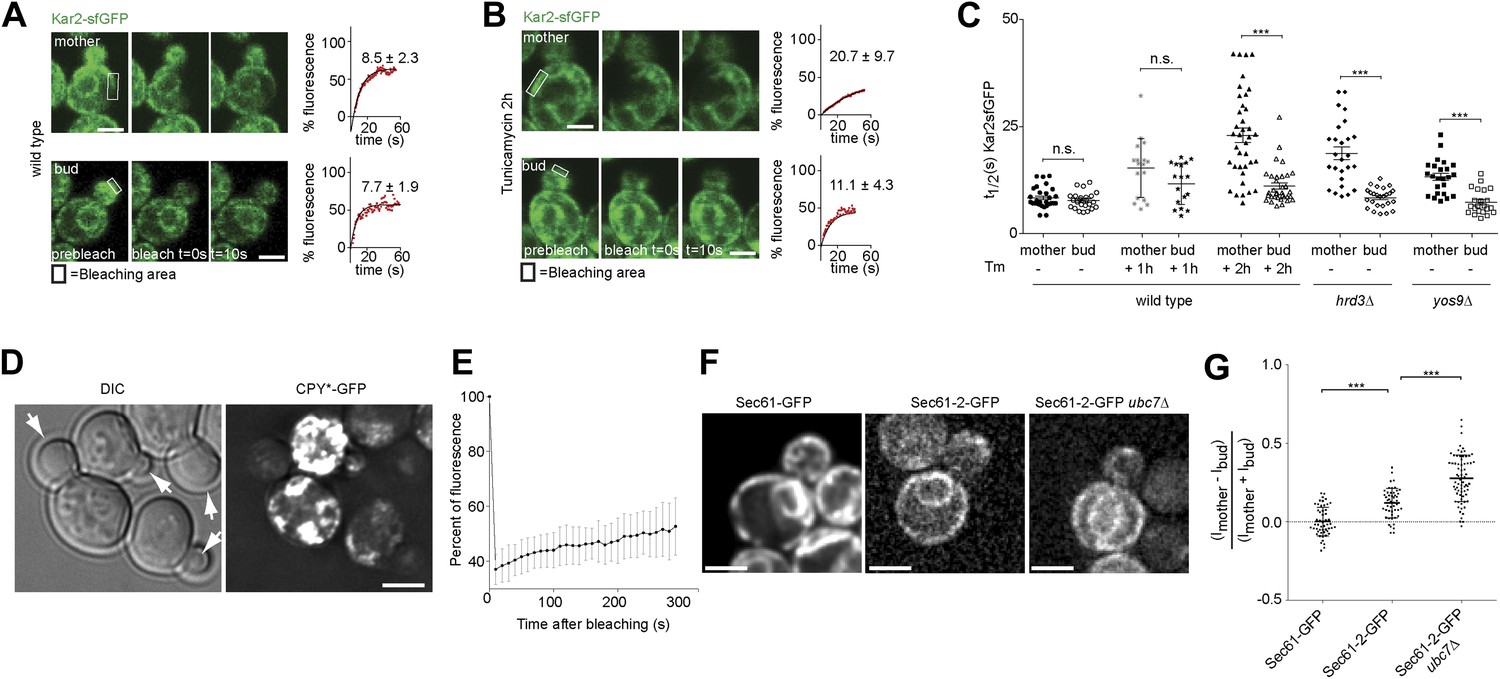
Misfolded proteins are retained in the mother cell during budding yeast division.
(A) FRAP analysis of Kar2-sfGFP in wild type mothers (n = 29 cells) and buds (n = 24 cells) under normal growth condition and (B) in the presence of 0.5 µg/ml of Tm. Representative cells are shown. Rectangles indicate the bleached areas. Image show cell before bleaching (pre-bleach), immediately after bleaching (0 s) and 10 s after the initial bleach (10 s). T1/2 represents the time it took to recover 50% of fluorescence of the reached plateau. Graphs of fluorescence recovery of the corresponding cells are shown. (C) Graph indicates the distribution of t1/2 for individual cells of each mutant tested in the presence (+) or absence (−) of 0.5 µg/ml Tm) n >25 cells. n.s. = not significantly different ***p<0.001 (t test). (D) Z-stack projections of CPY*-GFP and corresponding DIC images in wild type cells are shown. More images are shown in Figure 6. (E) Quantification of the FRAP of CPY*-GFP. (F) Single focal plane of Sec61-GFP and Sec61-2-GFP in wild type or ubc7Δ mutant cells. Note that the gray values have been scaled such as to be able to see both proteins. Otherwise, Sec61-2-GFP values are 5–8-fold lower than wild type Sec61-GFP. (G) Distribution of asymmetry indices of Sec61-GFP and Sec61-2-GFP in wild type or ubc7Δ mutant cells ***p<0.0001 (t test). Average ± SD are indicated (A, B, C, E, G). Scale bars = 2 µm.
Figure 2
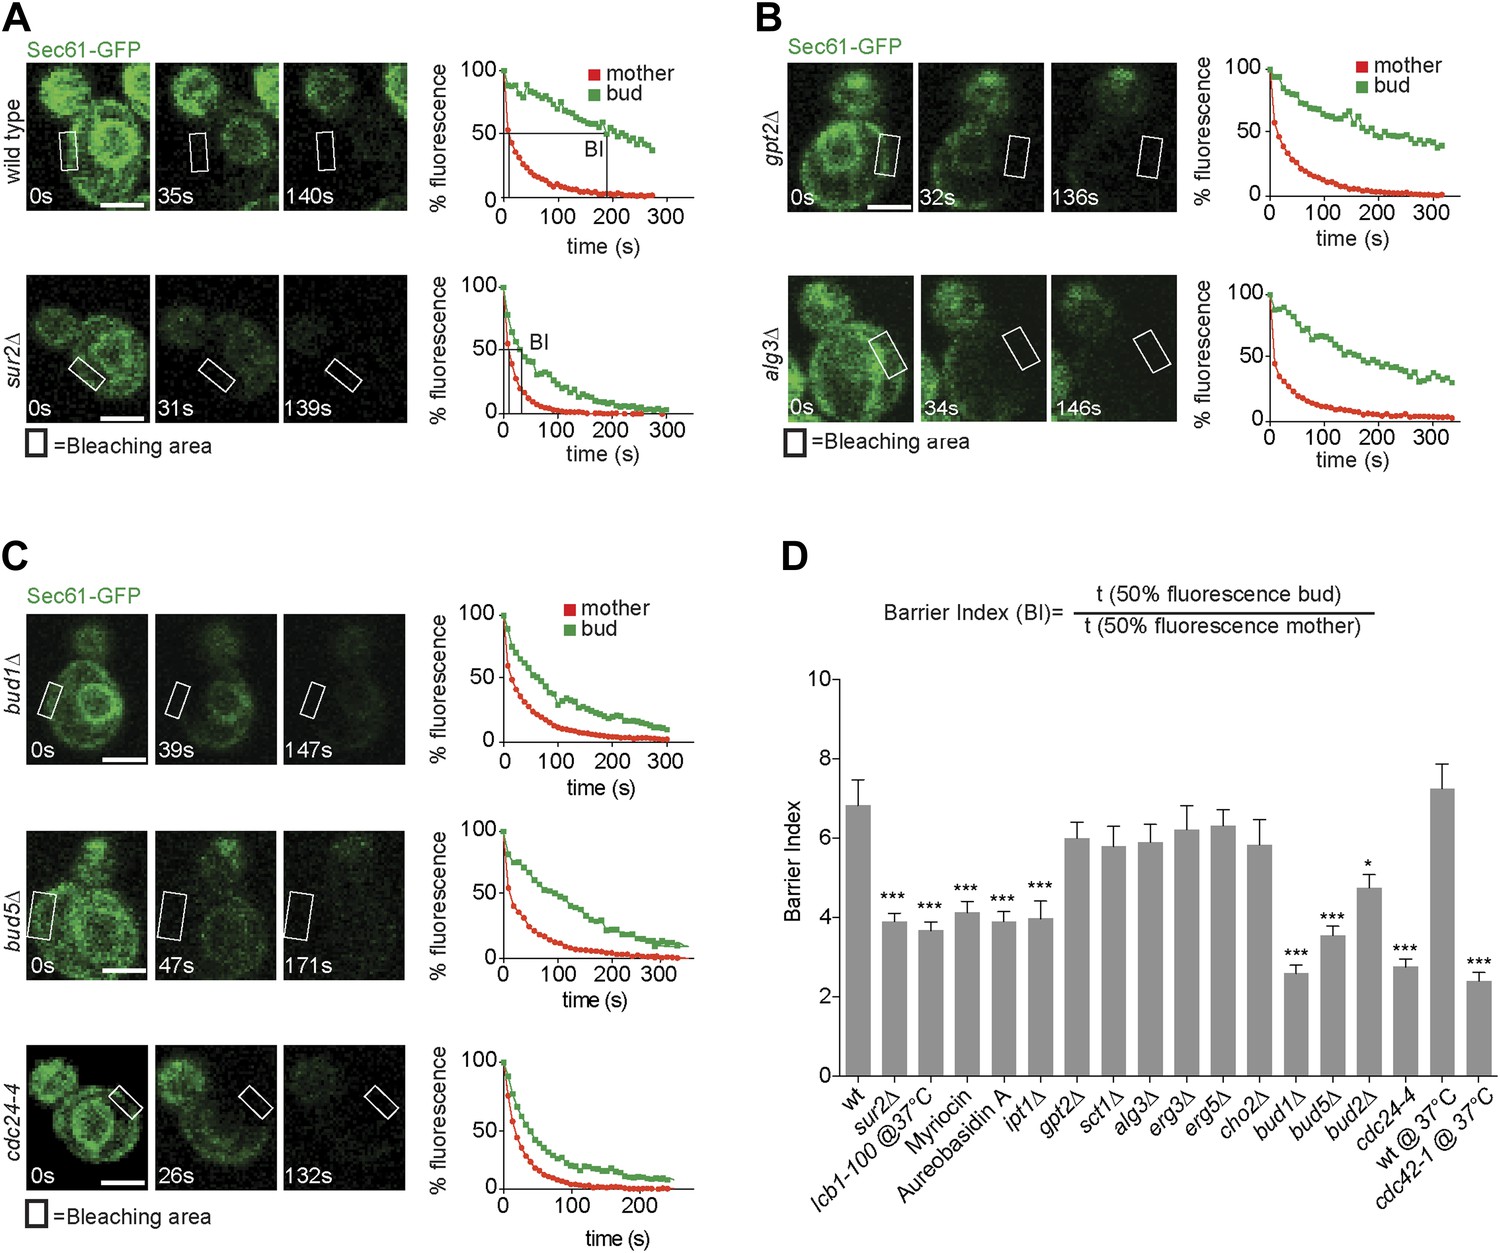
Sec61-GFP compartmentalization depends on sphingolipids and Bud1 module.
(A–C) FLIP of Sec61-GFP in wild type and indicated mutant cells. Fluorescence level decay over time in the mother (red) and daughter part (green) are shown. BI = barrier Index, corresponding to the time of 50% fluorescence loss in the bud divided by the time of 50% fluorescence loss in the mother cell. (D) Graph indicates BI + SD of tested strains. n > 20 cells. ***p<0.001, *p<0.05 (t test). Scale bars = 2 µm.
Figure 3
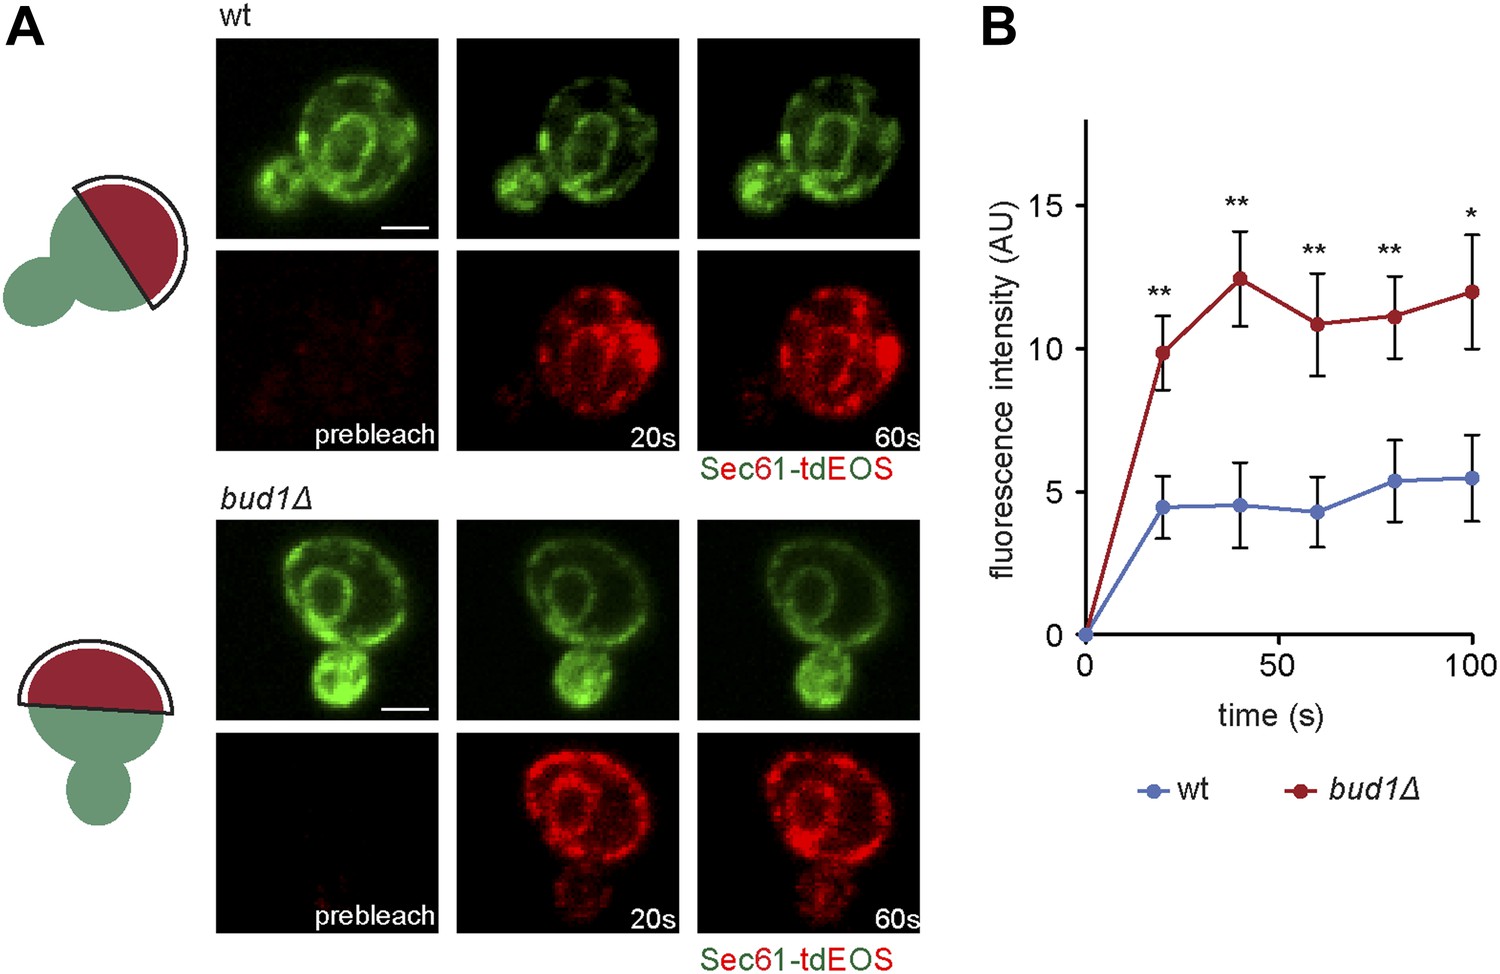
Sec61-EOS is compartmentalized in a Bud1-dependent manner.
Photoconversion of Sec61-tdEOS in wild type and bud1Δ mutant mother cells. (A) Images show the red and green fluorescent micrograph before conversion and after 20 s and 60 s. Scheme indicates the converted area. (B) Graph of normalized red fluorescence intensity measured in the bud compartment. n > 15 cells, error bars depict the standard error of the mean (SEM). **p<0.01, *p<0.05 (t test). Scale bars = 2 μm.
Figure 4
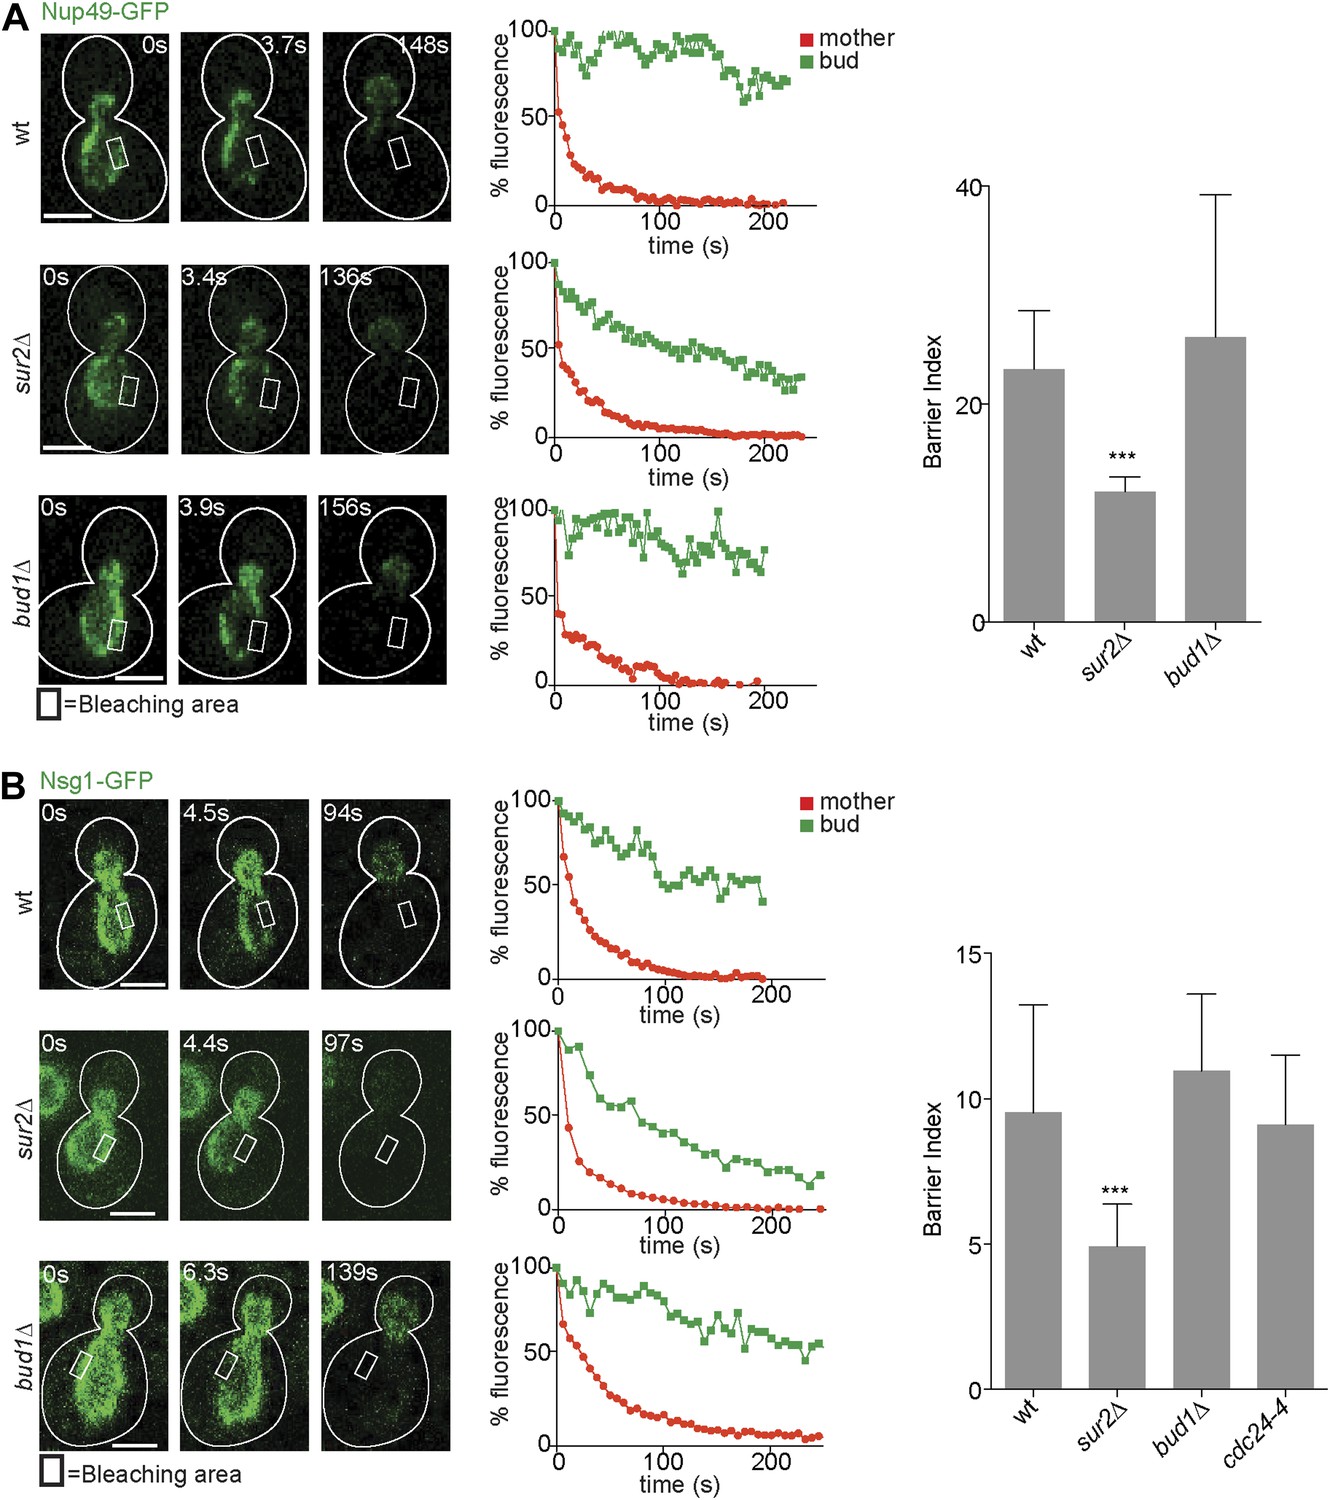
Compartmentalization of Nup49-GFP and Nsg1-GFP depends on the sphingolipids, but not on BUD1.
(A and B) FLIP experiments and BI values for the indicated markers of the nuclear envelope during early anaphase, in the cells of indicated genotype. Fluorescence level decay over time in the mother (red) and daughter part (green) are shown. White lines indicate cell outlines. Representative experiments are shown. n > 20 cells. ***p<0.001 (t test). Scale bars = 2 µm.
Figure 5
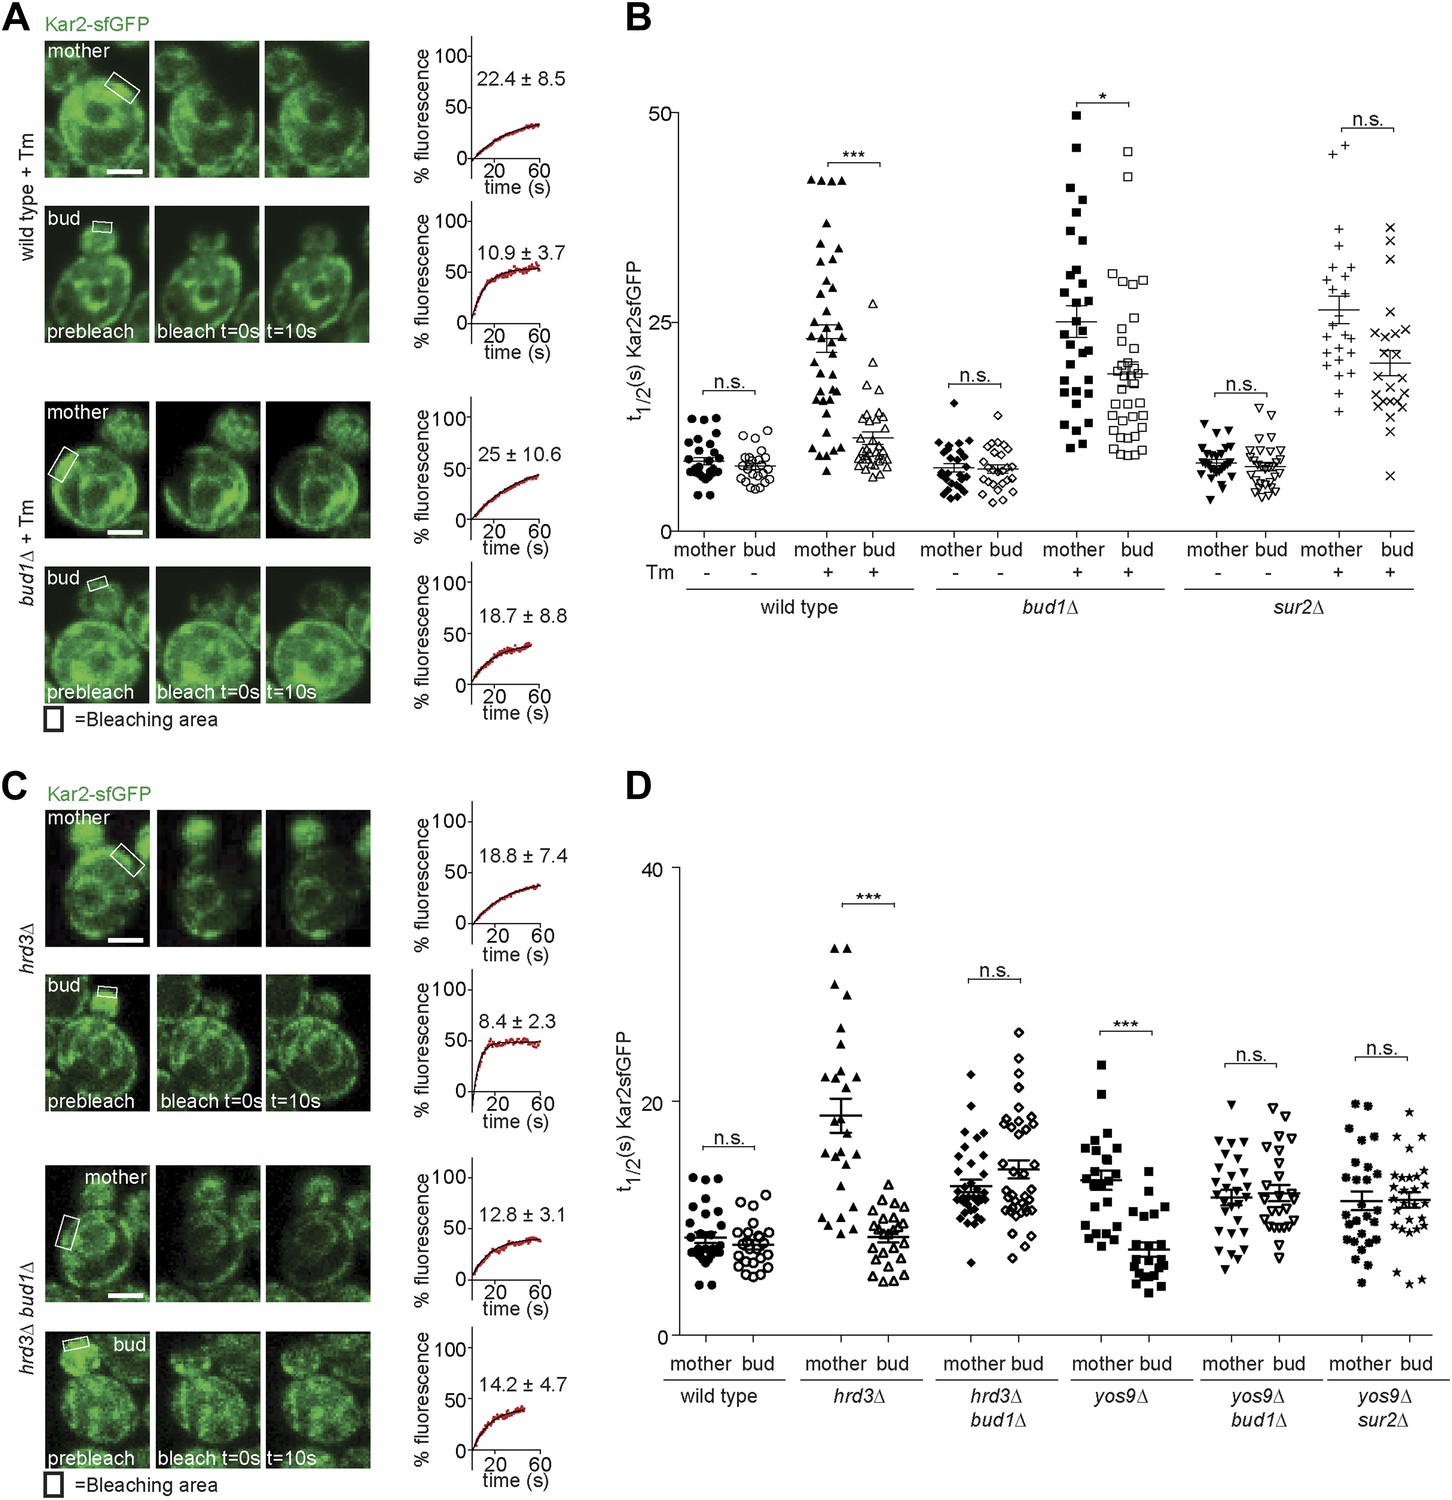
Retention of Kar2 clients in the mother cell depends on the ER diffusion barrier.
(A and C) FRAP of Kar2-sfGFP in the mother or bud of mutants of indicated genotype in the presence or absence of 0.5 µg/ml tunicamycin. (B and D) Graphs indicate the distribution of individual t1/2 values measured in mutant cells of indicated genotype. Representative cells are shown. n > 20 cells. Averages ± SD are indicated. n.s. = not significantly different, ***p<0.0001, *p<0.05 (t test). Scale bars = 2 µm.
Figure 6
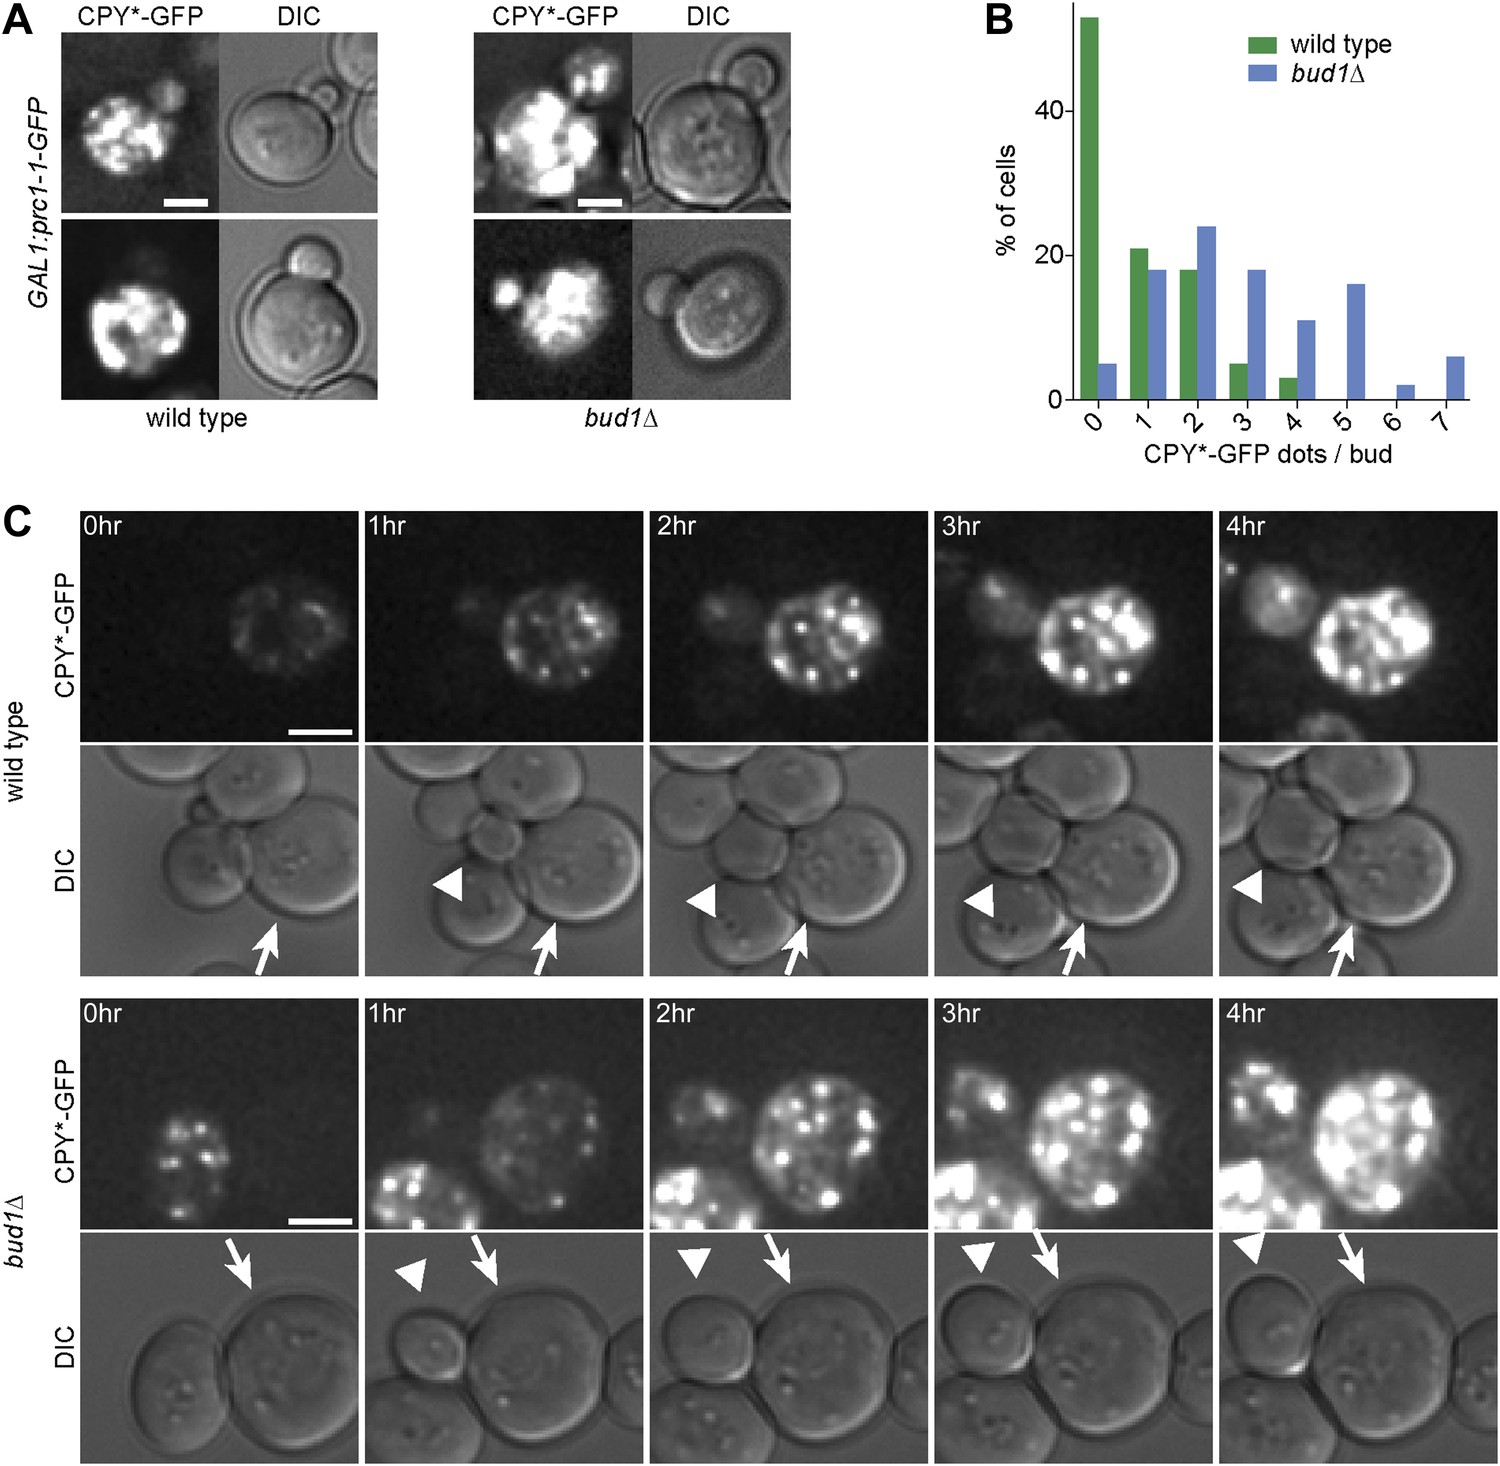
The cER diffusion barrier retains misfolded CPY*-GFP in the mother cell.
(A) Z-stack projections of CPY*-GFP and corresponding DIC images in wild type and bud1Δ mutant cells. (B) Graph shows the frequency of buds with indicated number of CPY*-GFP dots in wild type and bud1Δ mutant cells. (C) DIC and CPY*-GFP fluorescence images of time lapse microscopy of wild type (up) and bud1Δ mutant cells (bottom). The arrow indicates the mother cell and the arrowhead the growing bud. Scale bars = 2 µm.
Figure 7
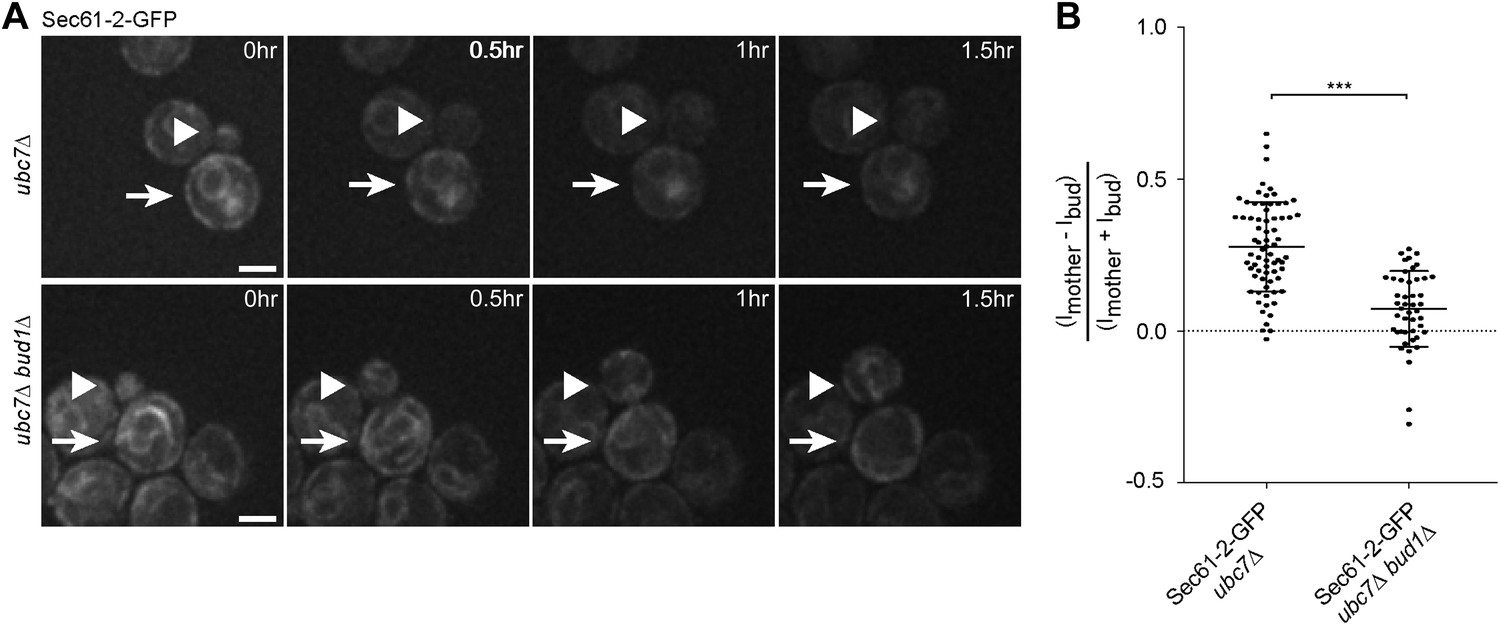
Misfolded Sec61-2-GFP asymmetry depends on the cER diffusion barrier.
(A) Images of Sec61-2-GFP of a budding ubc7Δ (up) and a budding ubc7Δ bud1Δ (bottom) mutant cell. The arrow indicates the mother cell and the arrowhead the growing bud. Scale bar = 2 µm. (B) Distribution of asymmetry indices measured at the last frame prior to anaphase in individual cells of indicated genotype (note that the quantification of Sec61-2-GFP ubc7Δ is the same as in Figure 1G). ***p<0.0001 (t test).
Figure 8
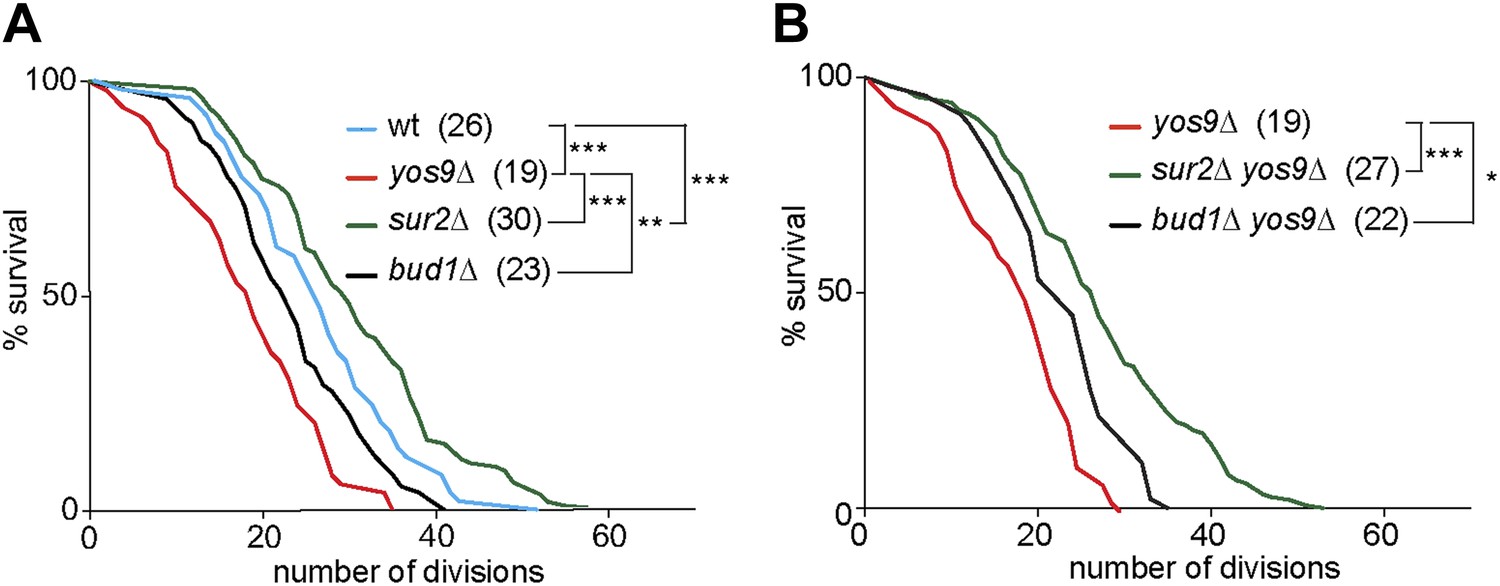
Yos9 deletion shortens the life span of cells.
(A and B) Pedigree analysis of wild type and mutant strains. Graph indicates the number of surviving cells after the indicated number of divisions. The median survival age for the tested strains is indicated n > 50 mother cells. p***<0.001, **p<0.01, *p<0.05 (Gehan-Breslow-Wilcoxon test).
Figure 9

Bud1, Bud6 and Sur2 act in the same pathway for barrier formation.
Graph shows the BI measured by FLIP analysis of Sec61-GFP exchange between mother and bud in cells of indicated genotype, as in Figure 2. BI + SD of tested strains are shown. n > 20 cells. ***p<0.001, (t test).
Figure 10
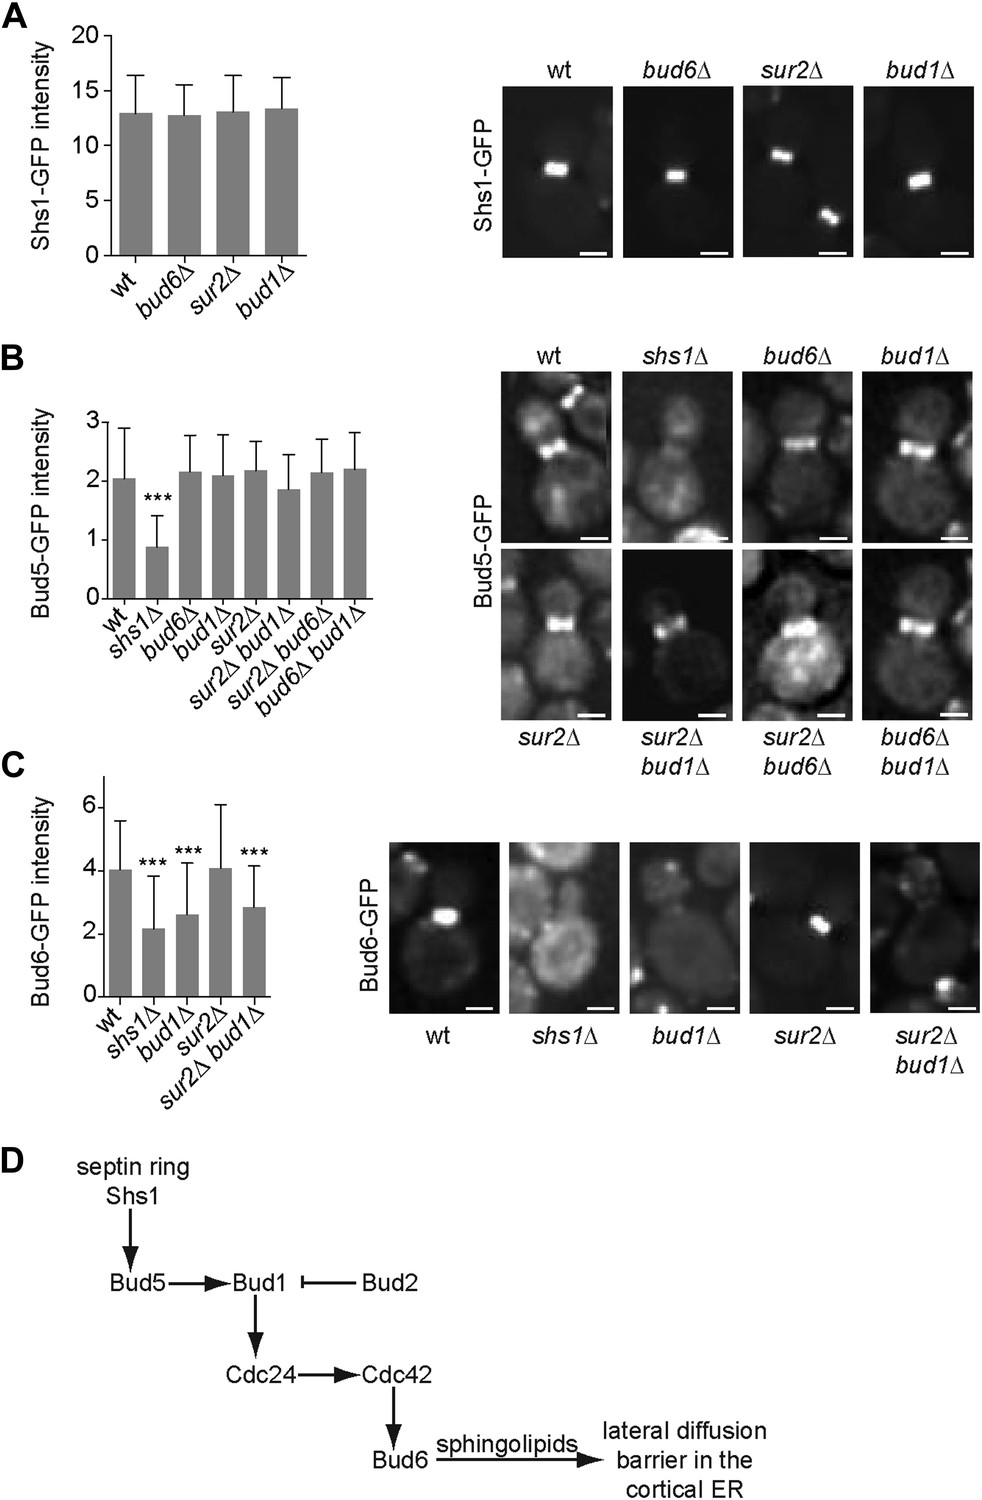
Epistasis analysis of the factors required for the assembly of the diffusion barrier in the cortical ER.
(A–C) Fluorescence intensity of Shs1-GFP (A), Bud5-GFP (B) and Bud6-GFP (C) was measured at the bud neck by taking z-stacks of the cells after deconvolution with Softworx software. n > 100 cells. Representative images (right) and average fluorescence intensities are shown ± SD (arbitrary units, left). n > 20 cells. ***p<0.001, (t test). Scale bars = 2 µm. (D) Schematic drawing of the pathway required for the establishment of the diffusion barrier.
Figure 11
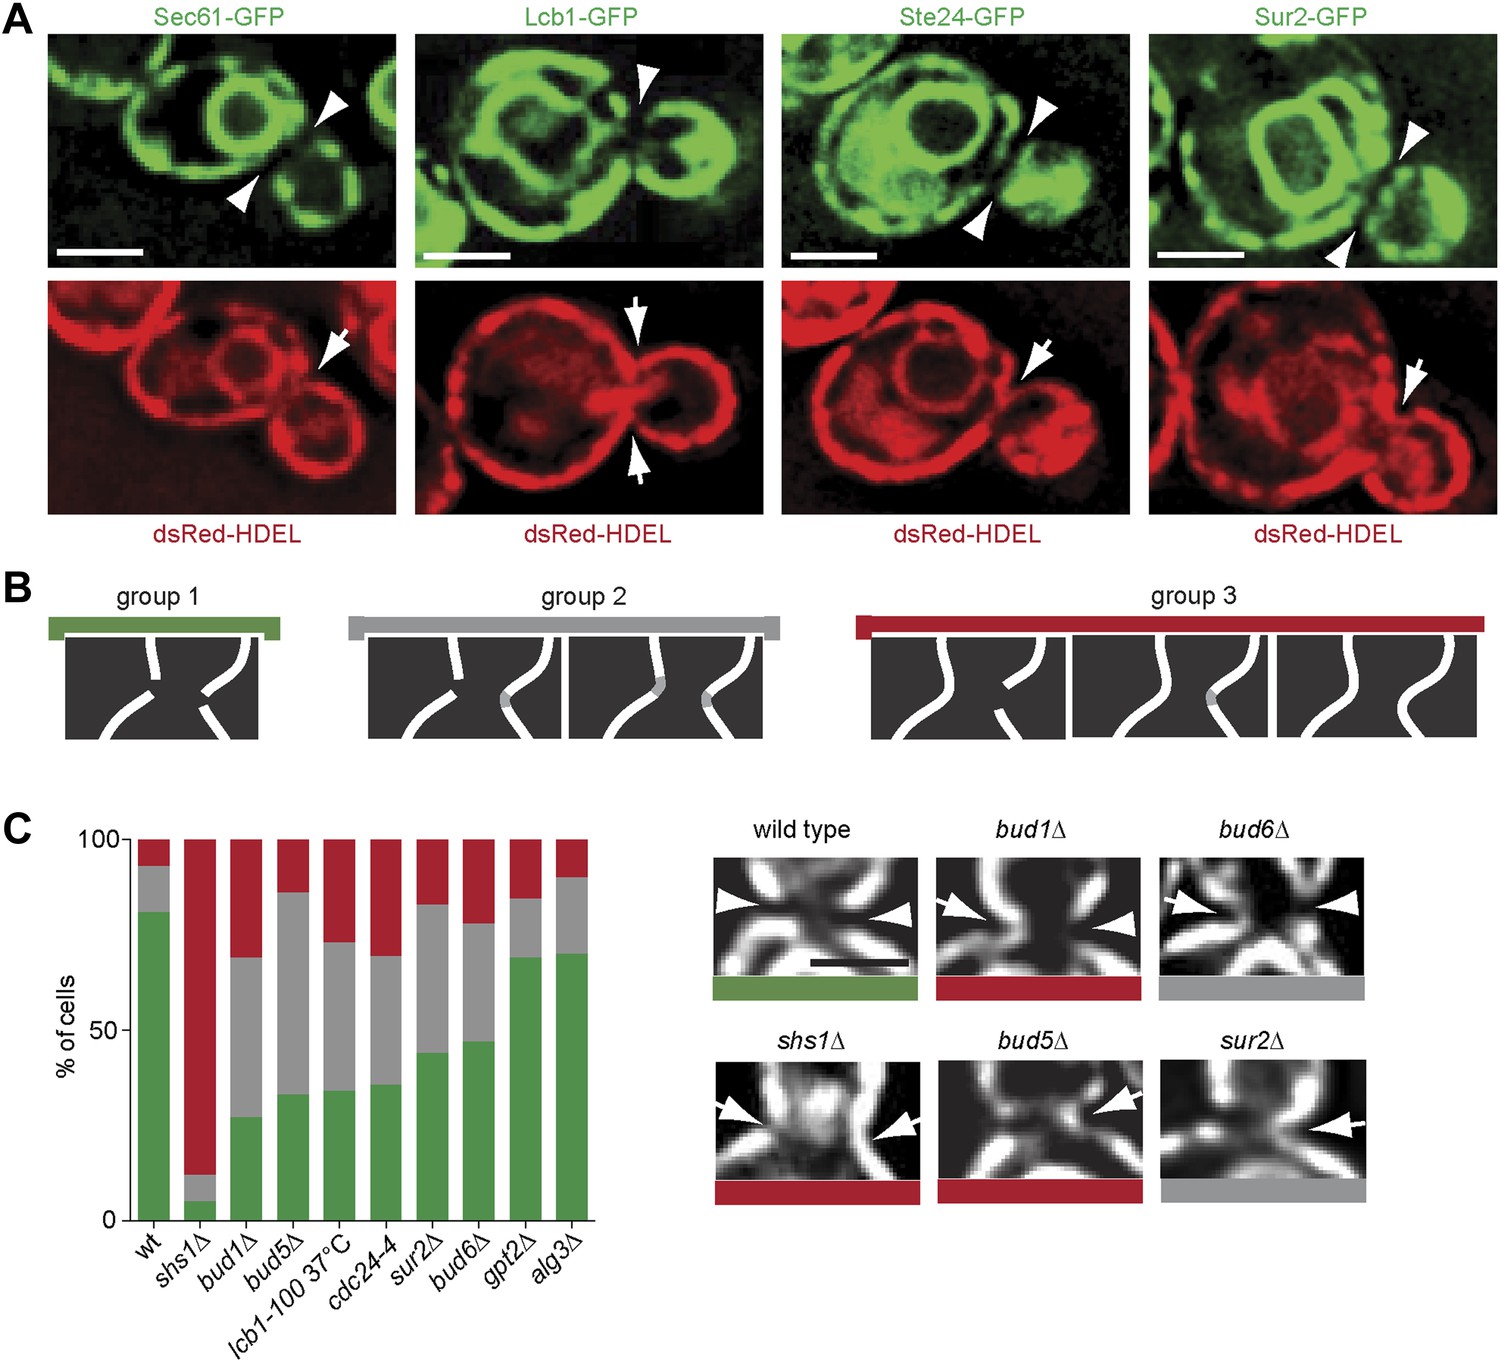
Exclusion of ER-transmembrane proteins at the cER bud neck.
(A) localization of the indicated ER membrane resident proteins (green) and the ER luminal marker dsRed-HDEL (red) at the bud neck of the same cells. (B) Classification of Sec61-GFP exclusion from the bud neck in three groups: total exclusion (green), partial exclusion (grey) and no exclusion (red). (C) Evaluation of Sec61-GFP exclusion from the bud neck in wild type and mutant cells of indicated genotype, using the classification above. Arrowheads indicate exclusion, arrows indicate no exclusion. Representative cells are shown. n > 100 cells. Scale bars = 2 µm.
Figure 12

The composition of the cER and Nuclear membrane at the bud neck differs from elsewhere.
(A) A representative metaphase cell stained with the dye DiOC6 and images at different z-positions through its bud neck are shown. (B) Evaluation of DiOC6 exclusion at the bud neck in wild type and mutant cells according to the classification used for Sec61-GFP in Figure 11B. (C–D) Characterization of the exclusion of Nup49-GFP (C) and DiOC6 (D) from the bud neck in early anaphase nuclei of cells of indicated phenotype using the same classification principle as in Figure 11B. Representative cells illustrated. n > 100 cells. Scale bars = 2 µm.
Figure 13
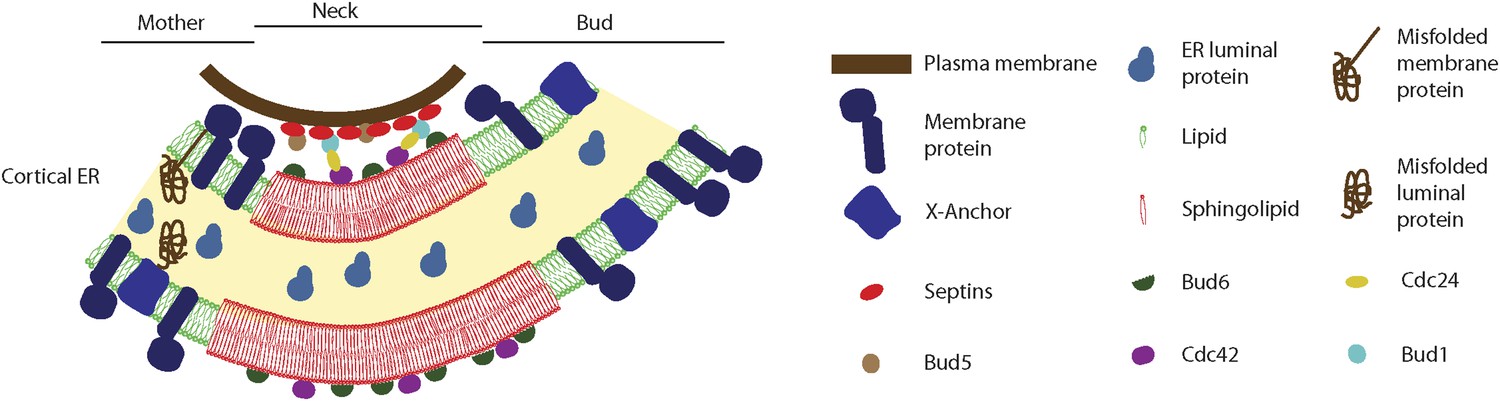
Model for the cortical ER diffusion barrier.
Septins (red ovals) assemble at the plasma membrane and organize the Bud1-Cdc42 module (brown, blue, yellow and violet ovals), which targets Bud6 (green). Bud6 might help organizing sphingolipids (red) at the bud neck in a liquid-ordered domain, thereby forming a lateral diffusion barrier. Note that trans-membrane proteins (dark blue) are excluded from this region but not from the rest or the ER (green lipids), due to their short transmembrane domain. ER luminal proteins (light blue) are found in the whole ER lumen. Misfolded proteins are retained in the mother part of the ER because they are themselves trans-membrane proteins or because they are attached to an unknown anchor (X, blue).
Download links
A two-part list of links to download the article, or parts of the article, in various formats.
Downloads (link to download the article as PDF)
Open citations (links to open the citations from this article in various online reference manager services)
Cite this article (links to download the citations from this article in formats compatible with various reference manager tools)
A sphingolipid-dependent diffusion barrier confines ER stress to the yeast mother cell
eLife 3:e01883.
https://doi.org/10.7554/eLife.01883


