Repair of naturally occurring mismatches can induce mutations in flanking DNA
- National Institute of Diabetes and Digestive and Kidney Diseases, National Institutes of Health, United States
Figures
Figure 1 with 2 supplements

Procedure to determine mutagenic effect of DNA repair.
(A) Episome FM1: purple double line with square, supF promoter region (Pr); red rectangle, supF gene; gray rectangle, reporter region; green box, mismatch region 1 (MM1); yellow rectangle, bar code; dark blue rectangle, pBR327 origin (ori, FM1 replication in E. coli); black square and contiguous heavy black arrow, SV40 origin-promoter and T-antigen coding sequence respectively (FM1 replication in human cells). We refer to this episome as FM1 because the supF gene is upstream of the MM1. Not shown, the ApR gene, which renders E. coli resistant to ampicillin. (B) Steps to generate lesion-containing vectors and procedure for determining the mutagenic effect of DNA repair in mammalian cells: Mismatch region with nicking sites (vertical arrows) is digested with a single strand restriction enzyme on the top (or bottom) strand, and the nicked strand is removed by hybridization to a 5′ biotin (blue diamond) labeled complementary DNA (red). The hybrid is then tethered to a streptavidin (green polygon)-coated magnetic bead (gray oval). The purified gapped episome is reconstituted by ligation to its perfect complement or an oligonucleotide that contains one or more mismatches to generate vectors with a top (or bottom) strand lesion or its corresponding 0 MM control. These vectors are transferred to mammalians cells, harvested after 48 hr and subjected to blue/white screening. The procedure is described in detail in the ‘Materials and methods’.
Figure 1—figure supplement 1
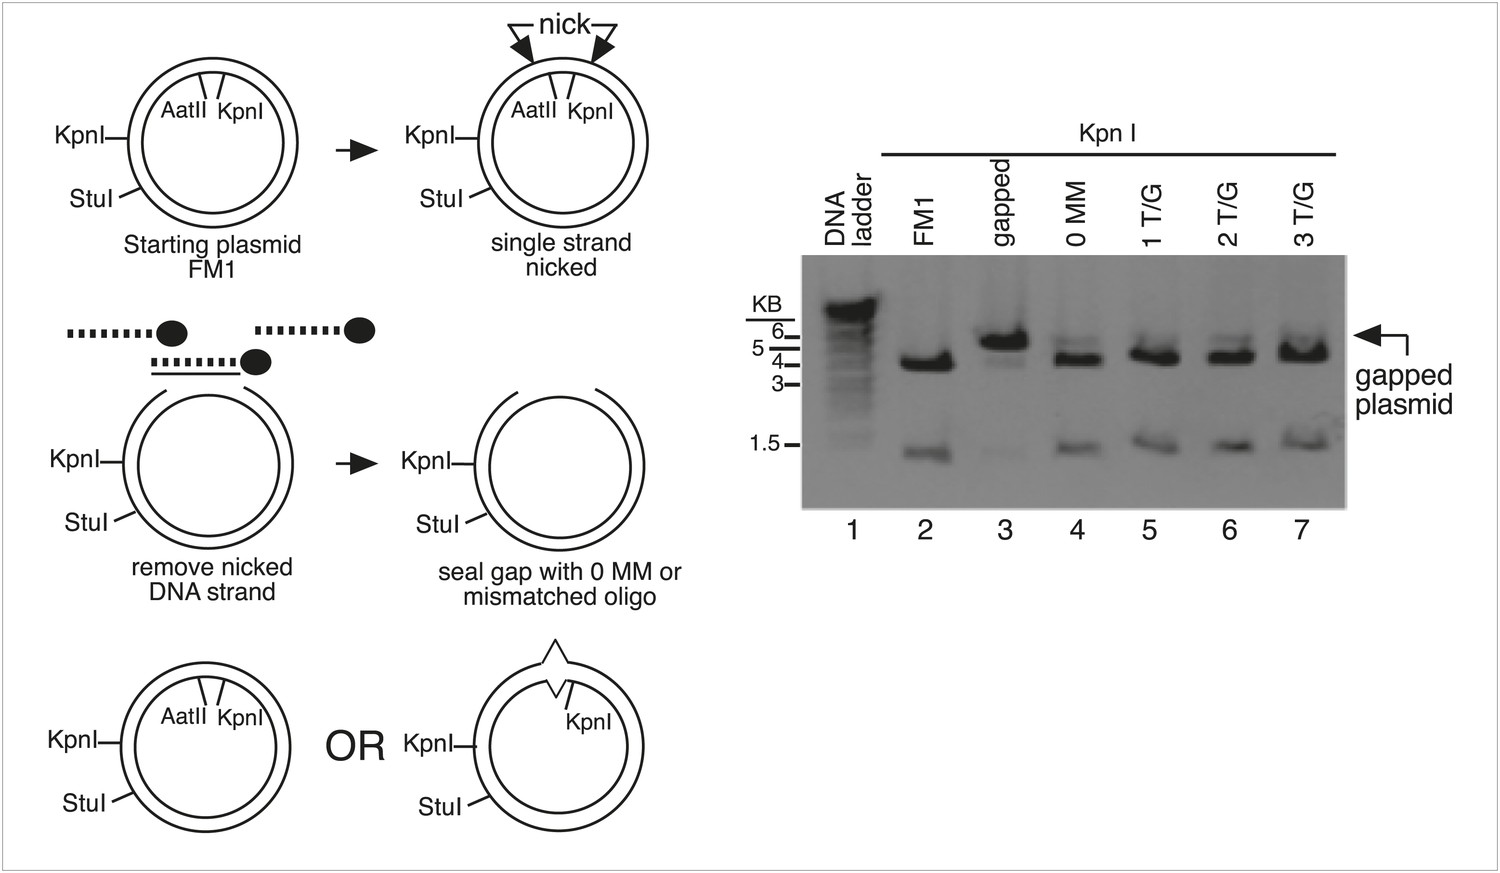
Monitor the gapping and reconstitution of episomes by KpnI digestion.
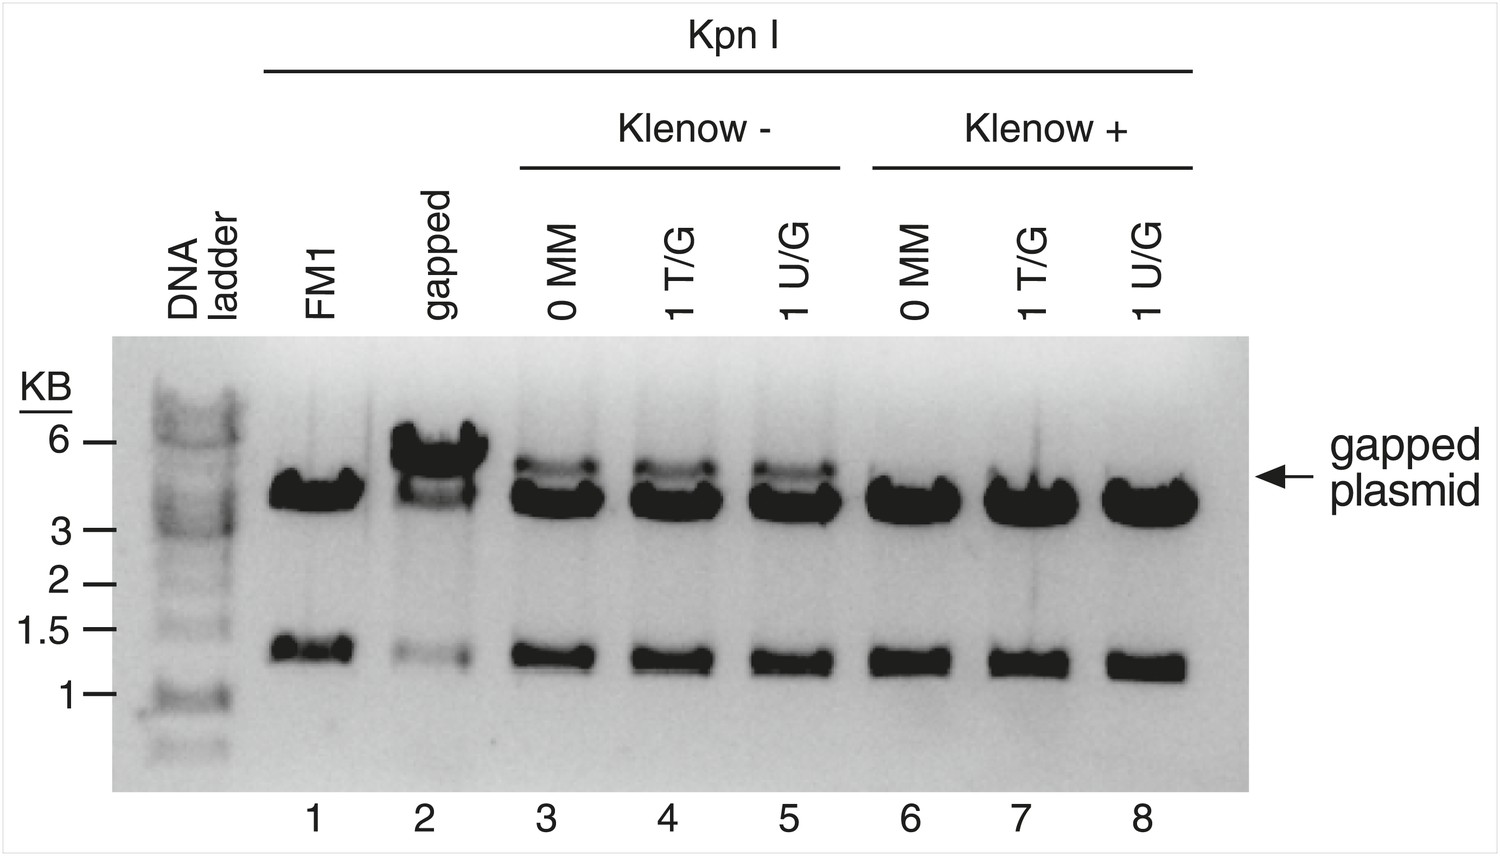
Summary of the steps in the construction of the lesion-containing episomes shown in Figure 1B. Gel electrophoresis shows the loss and restitution of the KpnI site between the Nt/b.BbC1 nicking restriction enzyme sites during the gapping and reconstitution of the episomes with various oligonucleotides (lanes 2–7). The reconstituted plasmids (lanes 4–7) yield essentially the same restriction pattern as the starting vector (lane 2), whereas the gapped plasmid (lane 3) yields only traces of the 3.8 kb and 1.3 kb KpnI fragments seen with FM1.
Figure 1—figure supplement 2
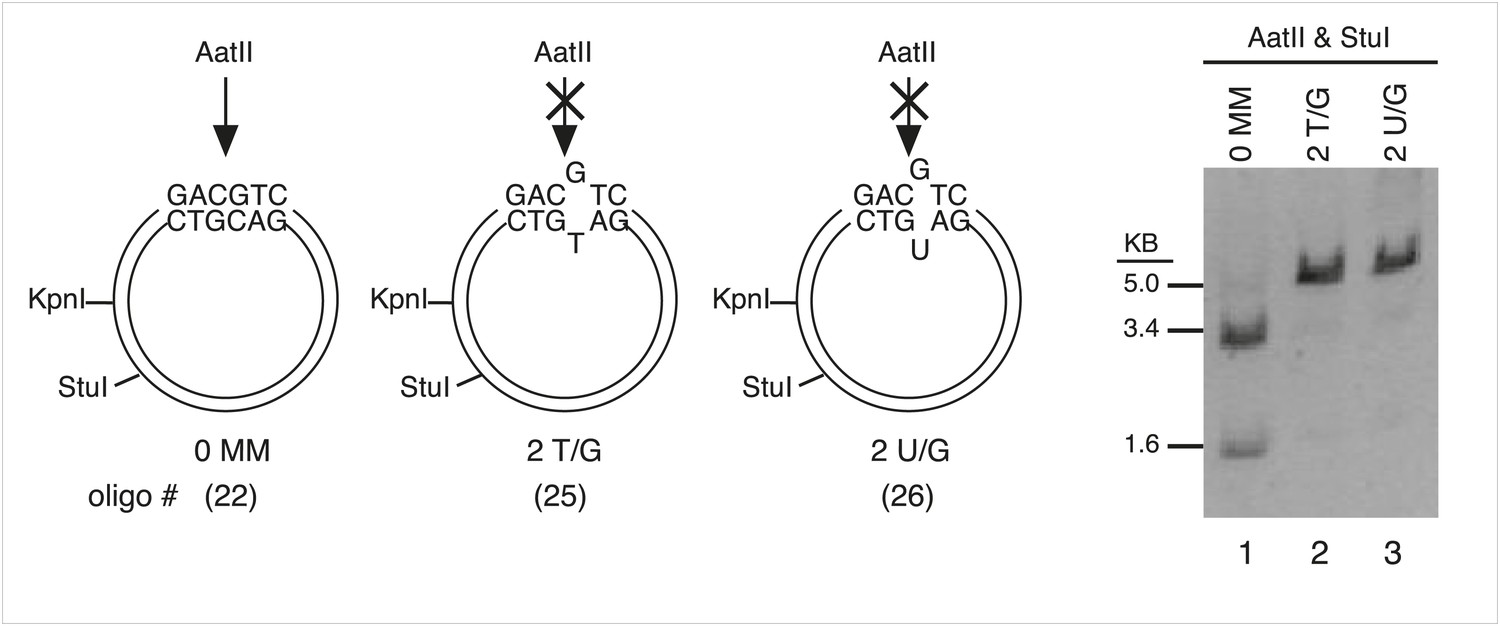
Monitor the presence of mismatch generating oligonucleotides by AatII digestion.
The mismatches in some oligonucleotides eliminated an AatII restriction site in the mismatch region. In these cases, we could monitor the reconstitution of the episome by its resistance to AatII digestion. Lanes 1–3, AatII and StuI double digestion of FM1 reconstituted with a 0 MM oligonucleotide or with ones that contained either 2 T/G or 2 U/G mismatches. The 0 MM control yields 3.4 kb and 1.6 kb AatII and StuI fragments (lane 1), but the mismatch containing plasmids yield only a 5.0 kb StuI fragment (lane 2, 3).
Figure 2 with 4 supplements
Mutagenic effect of DNA repair.
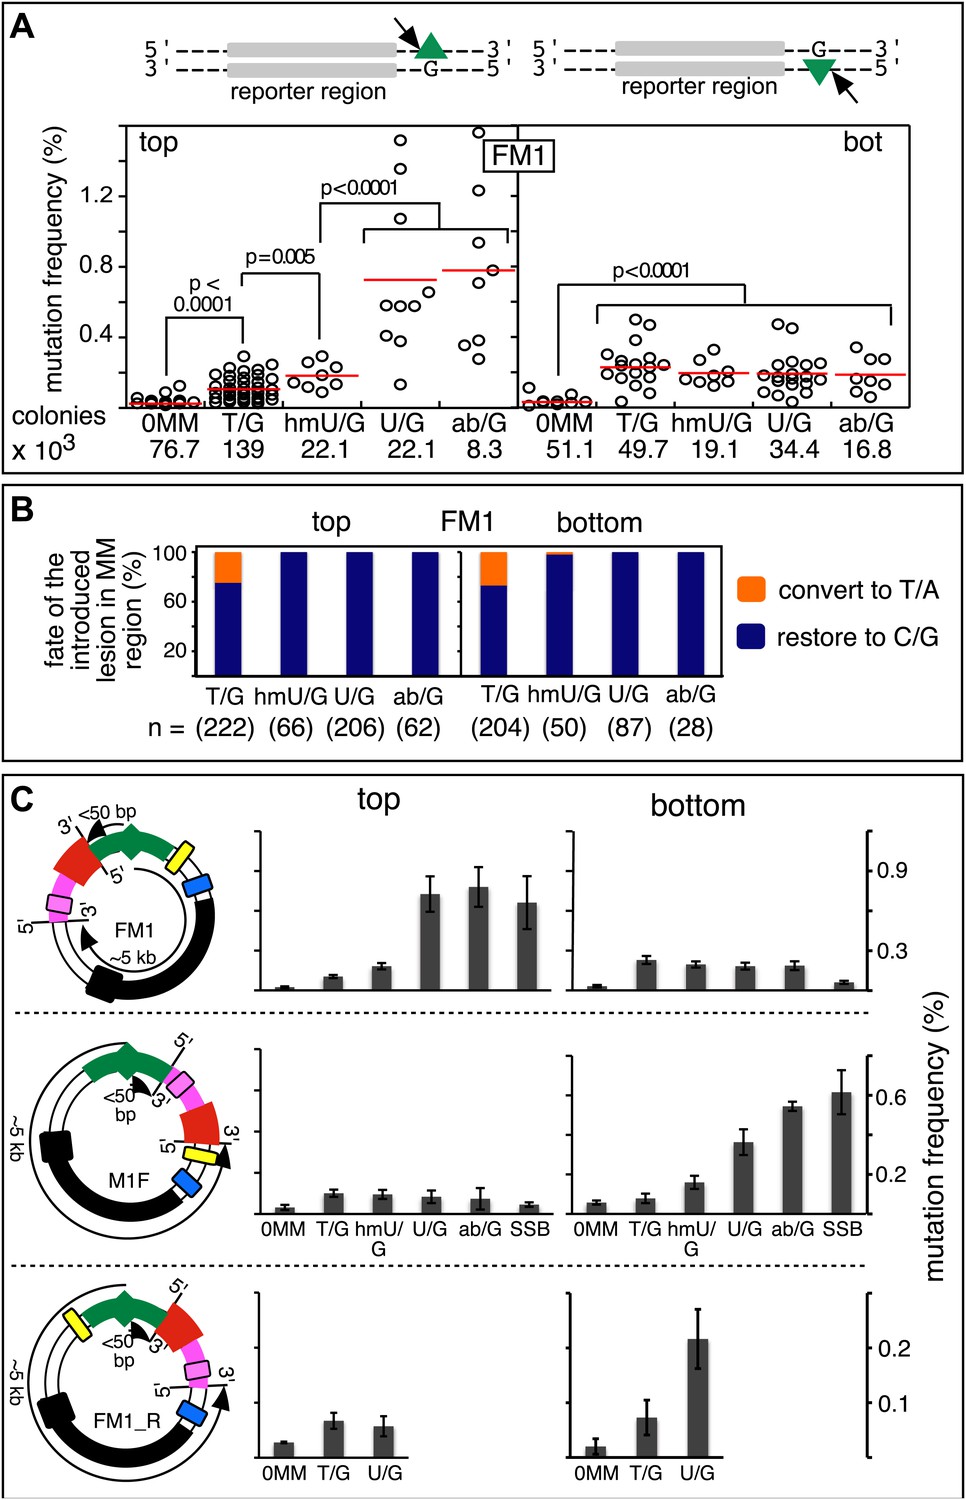
(A) Dot plots of the repair-induced mutation frequency (number of white colonies with undeleted episomes/total—see ‘Materials and methods’ and text) as a function of the indicated lesion. Each dot represents a separate trial of a given type of lesion that was present in 1, 2, or in the case of T/G, 3 copies in various positions (and thus sequence contexts) in the mismatch region. See Figure 2—figure supplement 2; Supplementary file 1. The red horizontal lines indicate the mean, and p values were calculated by the Fisher exact test on pairwise 2 × 2 contingency tables of the total number of non-mutant colonies (blue) and total number of white colonies that contained undeleted episomes. We applied a Bonferroni correction for multiple comparisons by multiplying the p values by the number of comparisons for the top or bottom strand lesions. The diagrams above the dot plots depict the reporter cassette. The green triangle indicates the location of the introduced lesion, and the arrow indicates the 5′ single-stranded break that would be generated by BER. (B) The fate of the introduced mismatches in the MM region present in the mutated plasmids (pooled according to the type and strand location of the lesions). The percentages of lesions restored to C/G (blue) or converted to T/A (orange) are shown along with the numbers of introduced lesions. (C) Configurations of episomes FM1, M1F and FM1_R, and bar graphs of the mutation frequency as a function of the indicated lesion introduced on the top or bottom strand (pooled according to the type and strand location of the lesions). Means (±SEM) are shown from at least two independent experiments. The bar graphs shown for FM1 are the same data as the dot plots in panel A. The distances between the lesions and the cis 3′ end of the reporter are given—the diagrams of the episomes are not to scale.
Figure 2—figure supplement 1

Minimal manipulation of reconstituted episomes minimizes the generation of deletions.
Frequency of the supF-deleted colonies from the two-step (ligation of the bar code region followed by Bstz17I digestion) or a one-step (ligation only) procedure for reconstituting the episomes. See ‘Materials and methods’ for more details.
Figure 2—figure supplement 2
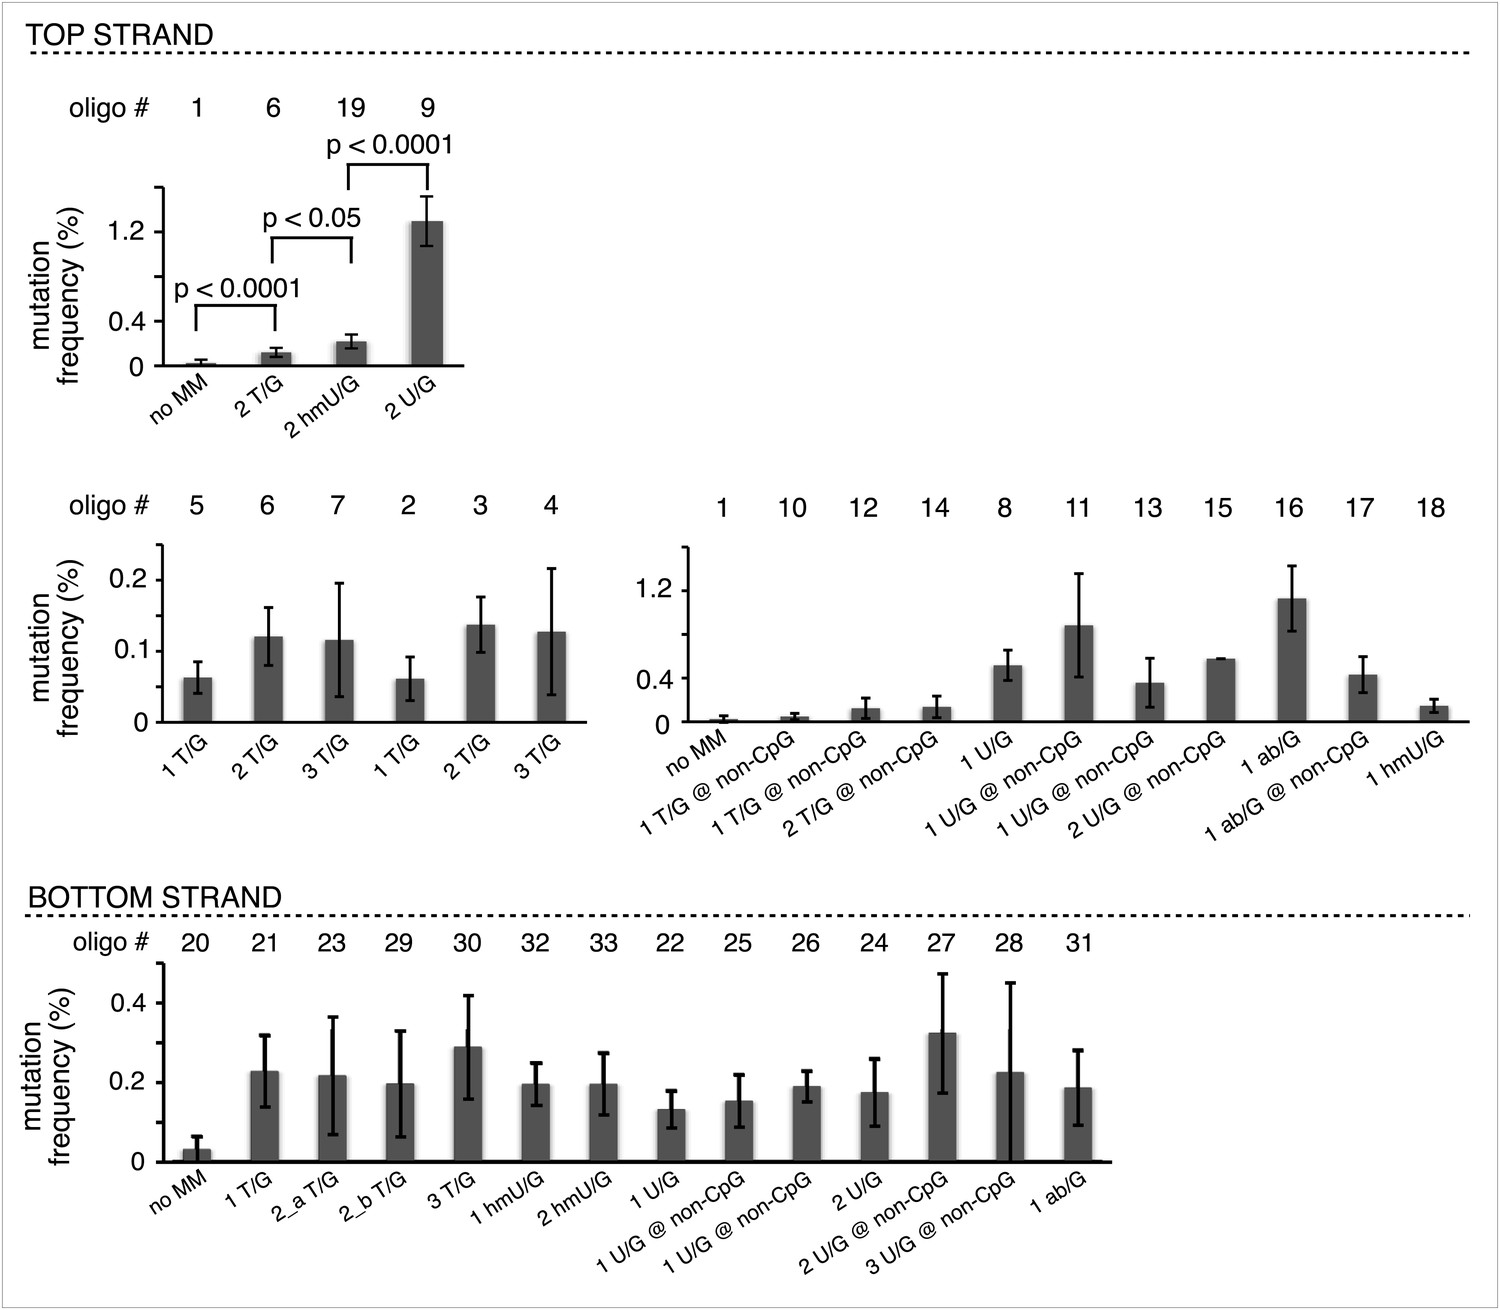
The magnitude of repair-induced mutagenesis differs with the type of lesion but the number or nucleotide context of a given lesion does not materially alter its mutagenic effect.
The mutation frequency (number of white colonies with undeleted plasmids/total) as a function of the indicated lesions on the top or bottom strand of pFM1. Means (±SD) from at least two independent experiments are shown. Note the difference in the scales between the various bar graphs. The number of oligonucleotide (oligo #) used to reconstitute the shuttle vector is given across the top each bar graph and the sequences of the reconstituting oligonucleotides are listed in Supplementary file 1. The nucleotide context and number of each type of legion in oligonucleotides 6, 19 and 9 are identical. p-values were calculated using the Fisher exact test.
Figure 2—figure supplement 3
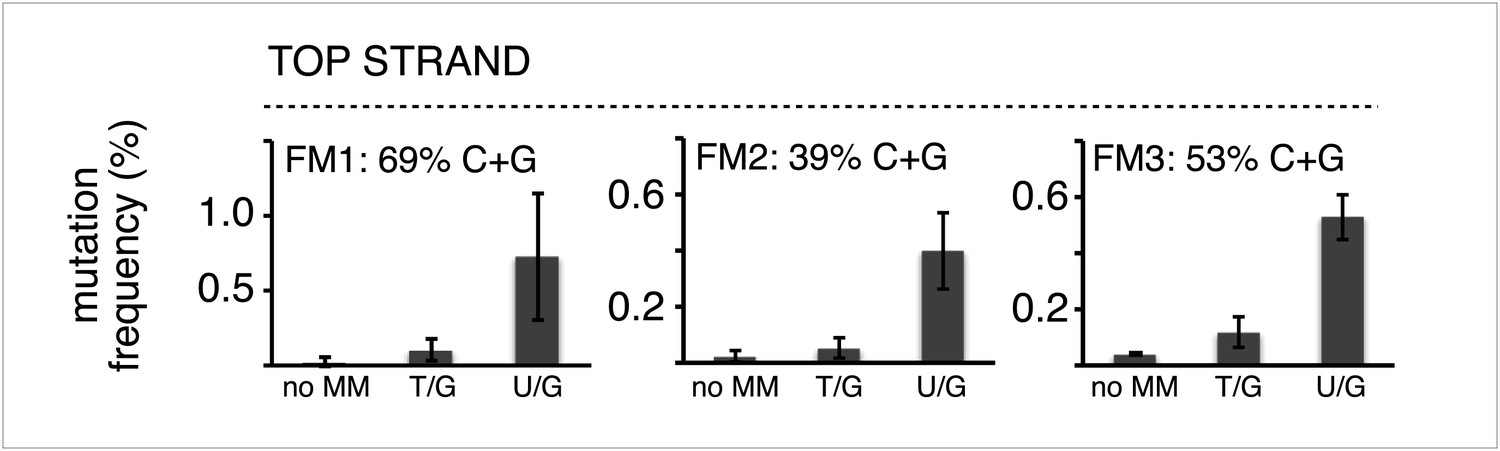
The mutagenic effect is not affected by the C+G content of the mismatch region.
Mutation frequency as a function of the indicated lesions on the top strand of vectors FM1, FM2 and FM3 with MM regions of different C+G content. Means (±SD) from at least two independent experiments are shown. The data were pooled with respect to lesion type.
Figure 2—figure supplement 4
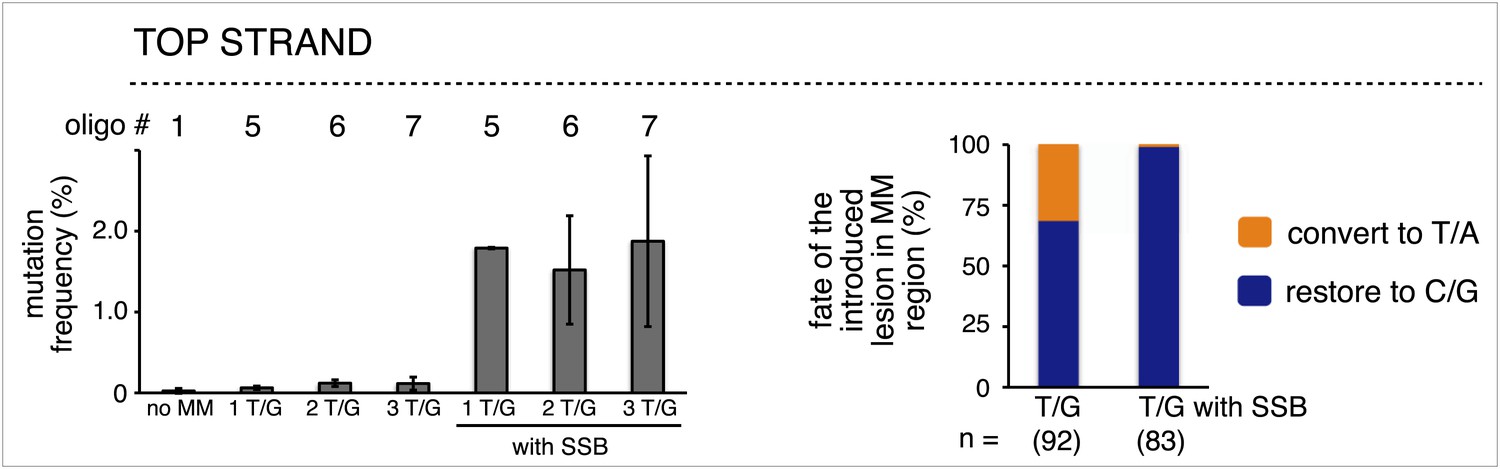
The mutagenic effect of single strand break repair supersedes that of T/G repair.
Left panel, mutation frequency as a function of the indicated T/G or T/G with a SSB. The top strand of the FM1 episome was reconstituted with either phosphorylated or non-phosphorylated oligonucleotides that would produce one or more T/G mismatches without or with a SSB. Means (±SD) from at least two independent experiments are shown and the number of the oligonucleotide (oligo #) used to reconstitute the shuttle vector is given across the top each bar graph. The right panel summarizes the repair outcome for each condition (i.e., 1, 2 and 3 T/Gs without or with an SSB) in the MM region of the mutated episomes. The numbers of introduced lesions and their percent restoration to C/G or conversion to T/A are shown.
Figure 3 with 8 supplements

Mutational spectrum induced by DNA repair of top strand lesions of FM1.
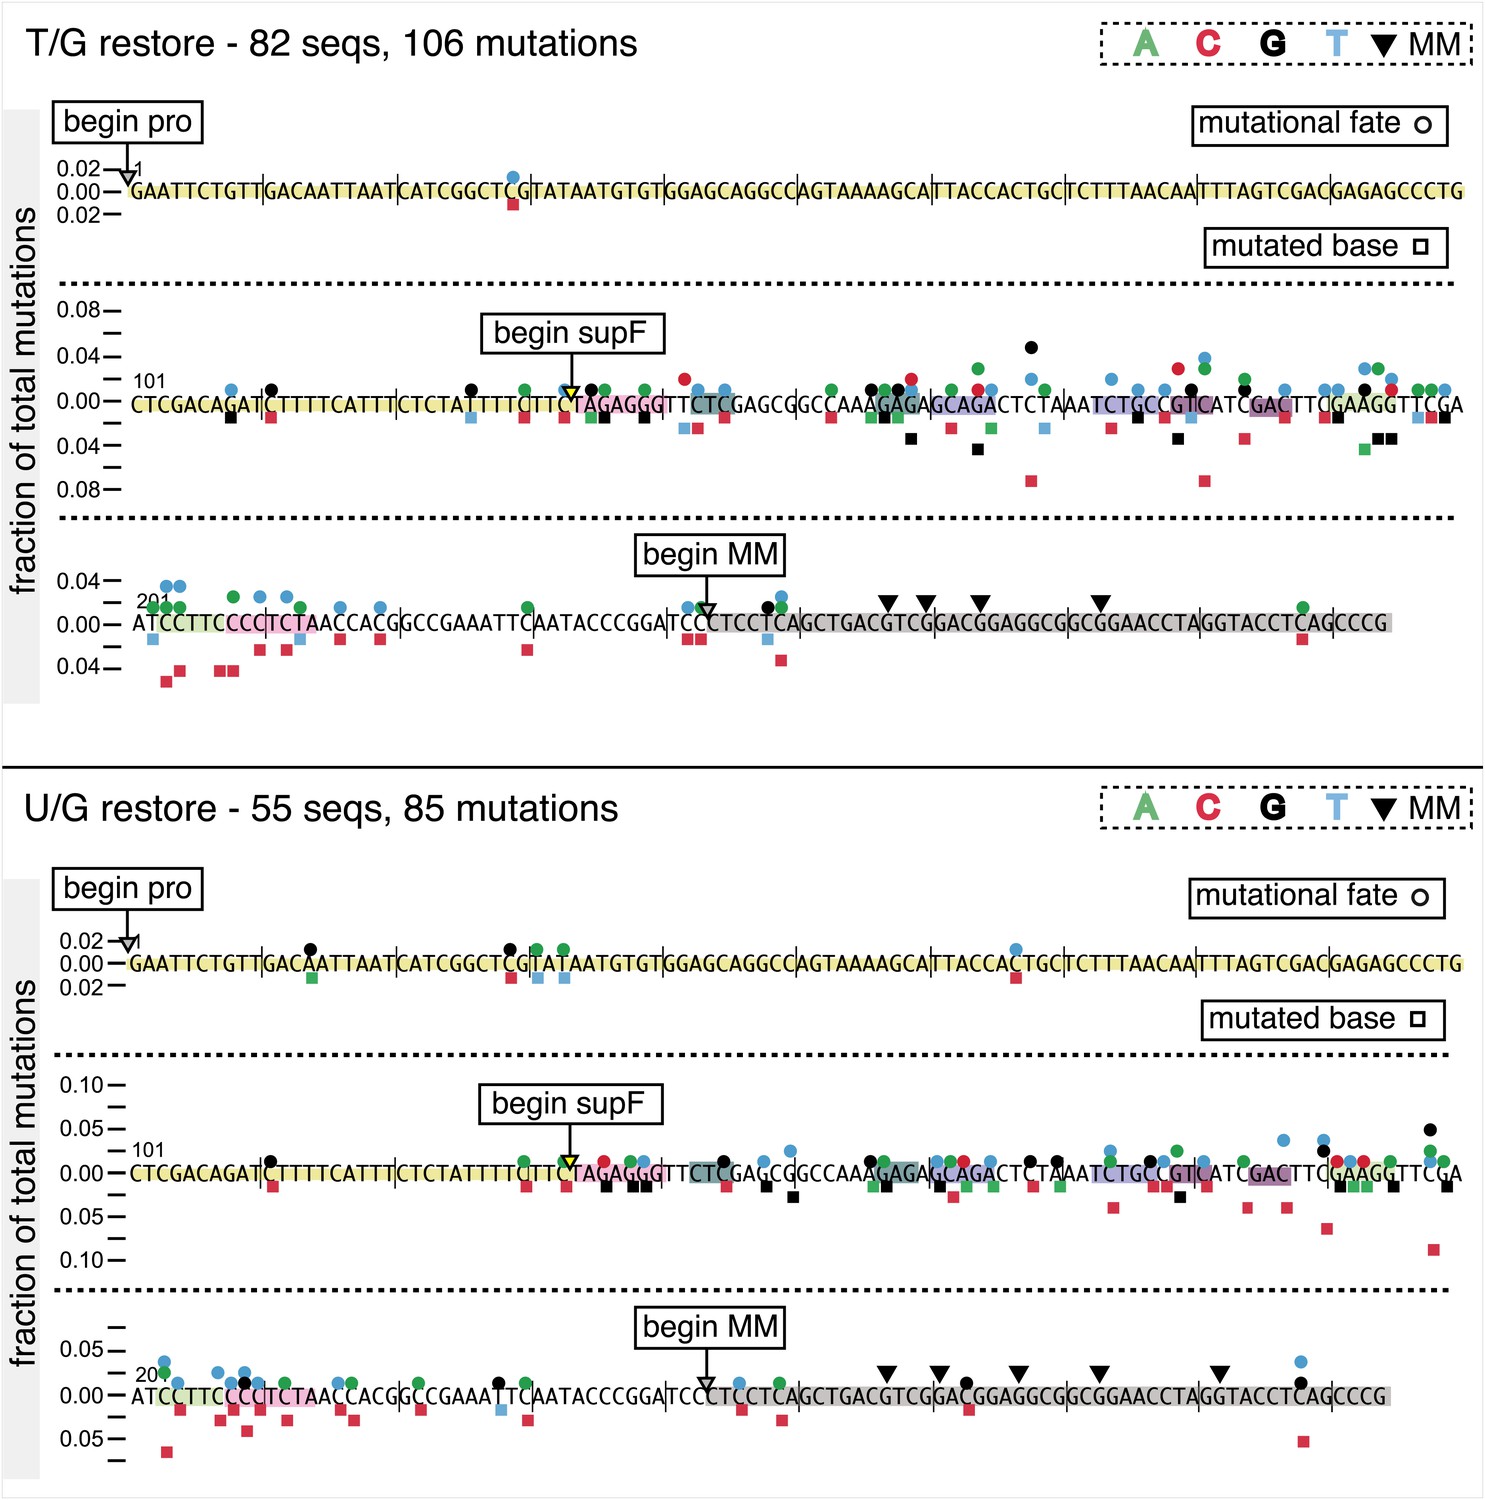
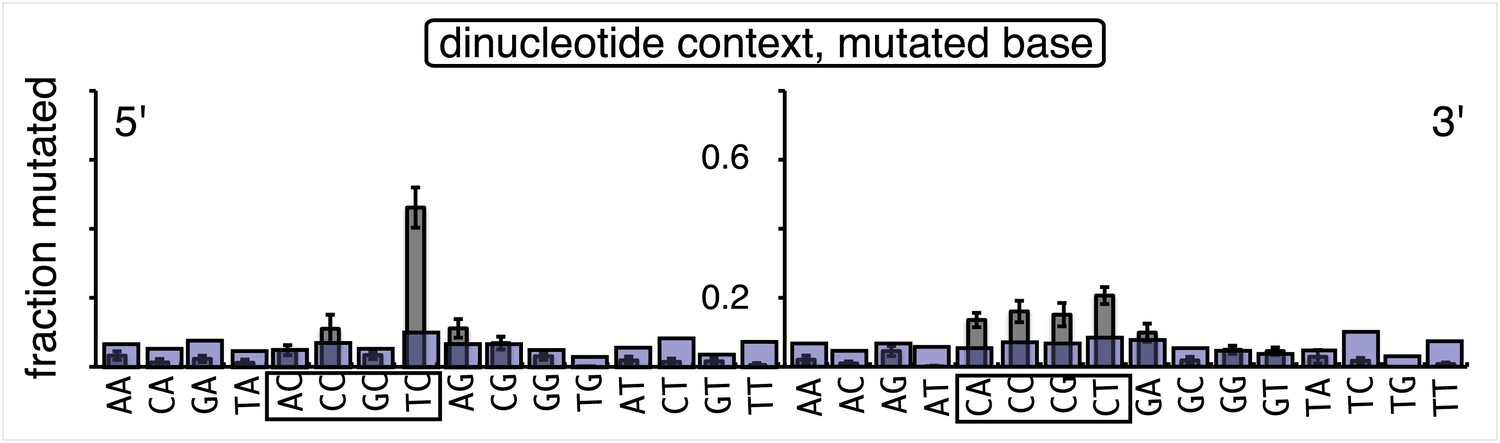
Dot plots of the fraction of total mutations contributed by each base (squares) and to which base it was mutated (mutational fate, circles) induced by the restoration of T/G (panel A) or U/G (panel B) to C/G on the top strand of FM1 (pooled according to the type of the lesions). In cases where the base has mutated to transitions and transversions at the same frequency the circles overlap. The beginnings of the promoter (pro), supF and MM regions are indicated. The promoter bases are highlighted in yellow and the MM bases in gray. The supF bases that are highlighted with the same colors indicate the complementary stem-encoding regions. The inverted black triangles indicate the locations of the mismatches in the pooled data set (see text). The numbers of sequences and mutations are shown at the top of each panel. As the repair of multiple lesions on a given episome could generate a singly mutated plasmid, the number of mutated sequences could be less the number of introduced lesions (Figure 2B). (C) Fraction of bases (in terms of top strand sequence) that were mutated in response to the repair (i.e., either restored to C/G or, with respect to T/G, converted to T/A) of the indicated lesions on the top strand of FM1 (pooled according to the type of lesion). (D) Dinucleotide context of the mutated base with respect to its 5′ or 3′ base. Fractions of the mutated base induced by the restoration of top strand lesions as a function of its dinucleotide context are shown (pooled from all the lesions restored to C/G). The faint purple bars show the fractions of all 16 dinucleotides in the reporter region. Means (±SEM) are from eighteen alignments (343 sequences, 478 mutations).
Figure 3—figure supplement 1
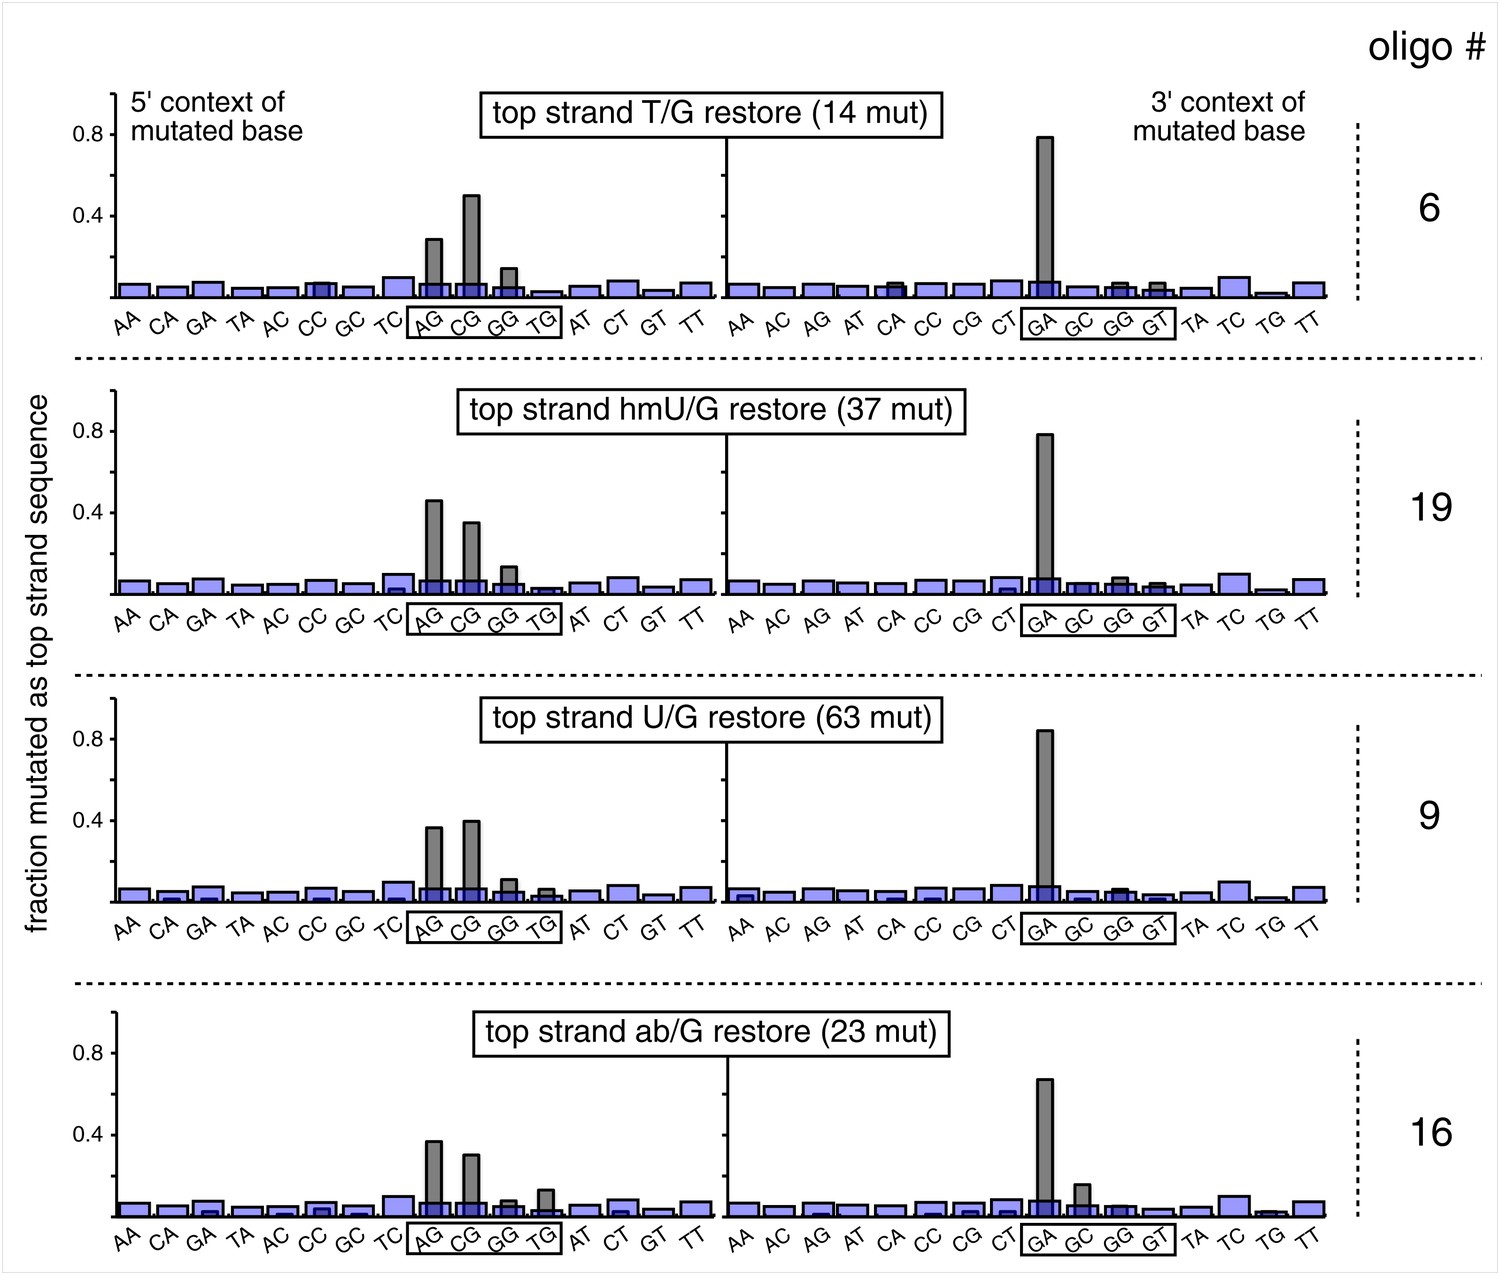
Dinucleotide context of mutations induced by the restoration of the indicated lesion generated by reconstituting the FM1 episome on the top strand with the indicated oligonucleotides.
The 5′ and 3′ dinucleotide context of the mutated base induced by restoration of the indicated lesions introduced by the oligonucleotides shown in the uppermost bar graph of Figure 2—figure supplement 2 (each generate 2 lesions at the same sites in the MM region) and oligonucleotide #16, which introduces a single ab/G mismatch. The number of the oligonucleotide (oligo #) used to reconstitute the shuttle vector is given on the right side. The faint purple bars show the fractions of all sixteen dinucleotides in the reporter region.
Figure 3—figure supplement 2
Dot plots of mutations induced by the restoration of bottom strand T/G or U/G on FM1.
Dot plots of the fraction of the pooled total mutations contributed by each base (squares) and to which base it was mutated (mutational fate, circles) induced by the restoration of lesions to C/G that had been introduced on the bottom strand of FM1–T/G (top panel) or U/G (bottom panel). In cases where the base has mutated to transitions and transversions at the same frequency the circles overlap. The beginnings of the promoter (pro), supF and MM regions are indicated. The promoter bases are highlighted in yellow and the MM bases in gray. The supF bases that are highlighted with the same colors indicate the complementary stem-encoding regions. The inverted black triangles indicate the locations of the mismatches in the pooled data set. The numbers of sequences and mutations are shown at the top of each panel.
Figure 3—figure supplement 3

Mutational spectra induced by the repair of lesions on the bottom strand of FM1.
Fraction of bases (in terms of top strand sequence) that were mutated in response to the repair of the indicated lesions on the bottom strand on FM1. The data were pooled with respect to lesion type.
Figure 3—figure supplement 4
Dinucleotide context of mutations induced by the restoration of bottom strand lesions on FM1.
Fractions of the mutated base induced by the restoration of bottom strand lesions as a function of its dinucleotide context are shown (pooled from all the lesions that were restored to C/G). The faint purple bars show the fractions of all 16 dinucleotides in the reporter region. Means (±SEM) are shown from 13 alignments (197 sequences, 293 mutations).
Figure 3—figure supplement 5
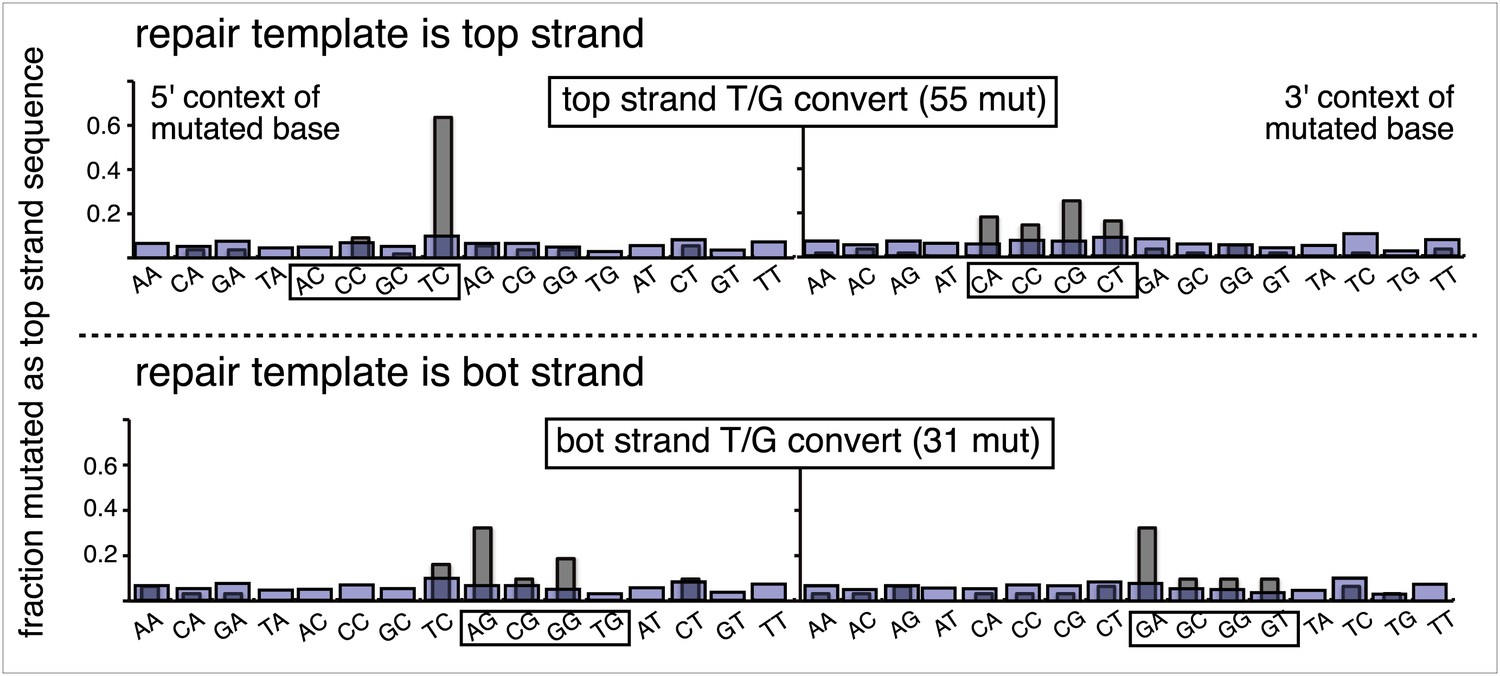
Dinucleotide context of mutations induced by the conversion of top or bottom strand T/G to T/A.
Top and bottom panels show respectively the dinucleotide context of the mutations recovered from the conversion of T/G to T/A on the top strand or bottom strand of FM1. The faint purple bars show the fractions of all 16 dinucleotides in the reporter region. The data are pooled from all the T/Gs on the top or bottom strand that are converted to T/A.
Figure 3—figure supplement 6
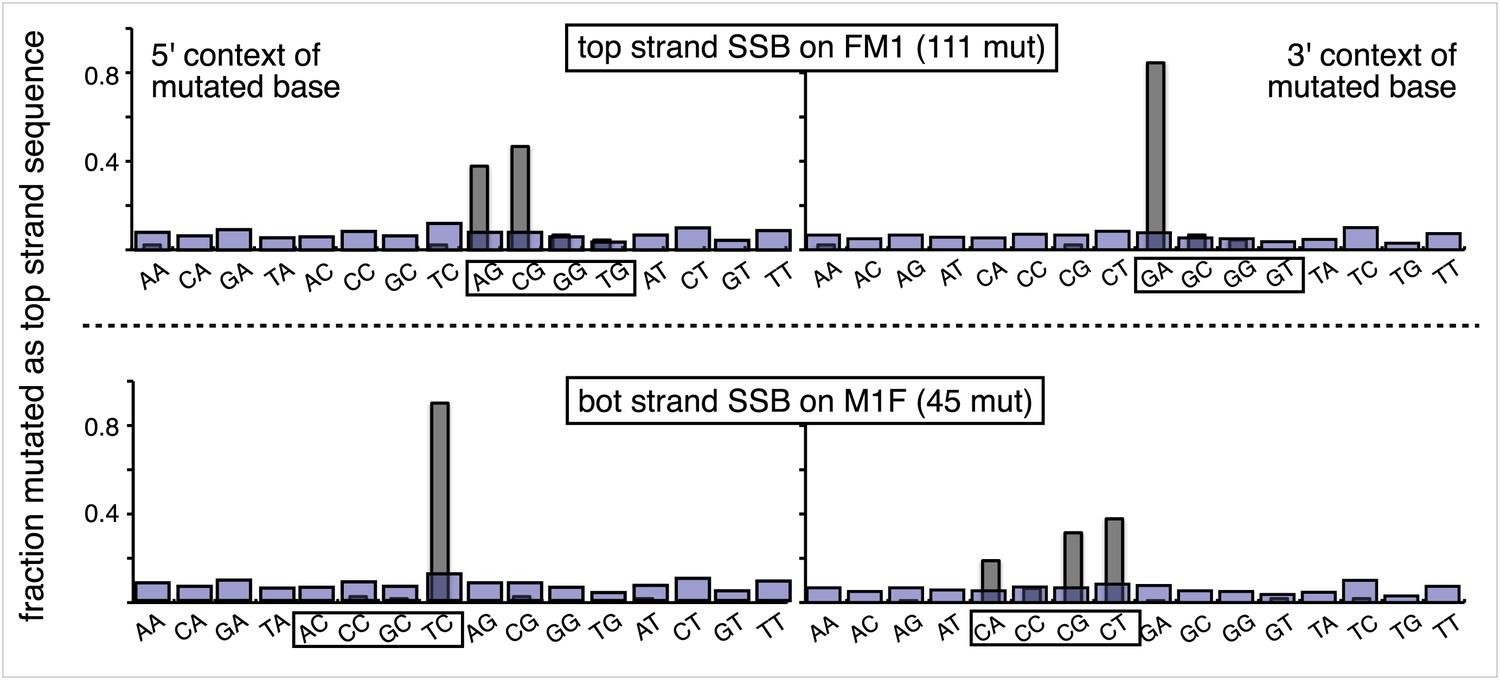
Most mutations induced by SSB repair involve the C of repair template TpCs.
Top and bottom panels show respectively the dinucleotide context of the mutated base induced by the repair of a SSB on the top strand of FM1 or the bottom strand of M1F. For top strand lesions, mutations involve the G of GpA, the complement of the C of TpC (see Figure 4 main text).
Figure 3—figure supplement 7

The 0 MM mutational signature is consistent with the mutational spectra of repairing a mixture of top and bottom strand SSBs.
The dinucleotide context of the mutations recovered from the 0 MM controls reconstituted on the top strand displays features of the dinucleotide contexts induced by both top and bottom strand SSBs (compare with top and bottom panels of Figure 3—figure supplement 6).
Figure 3—figure supplement 8

Trinucleotide context of mutated G induced by the restoration of top strand lesions on FM1.
The trinucleotide context of the G mutations induced by restoration of top strand lesions to C/G in Figure 3D (pooled from all the lesions that are restored to C/G). Means (±SEM) are from 18 alignments (437 mutations). The faint purple bars show the fractions of the 16 trinucleotide contexts of G in the reporter region.
Figure 4
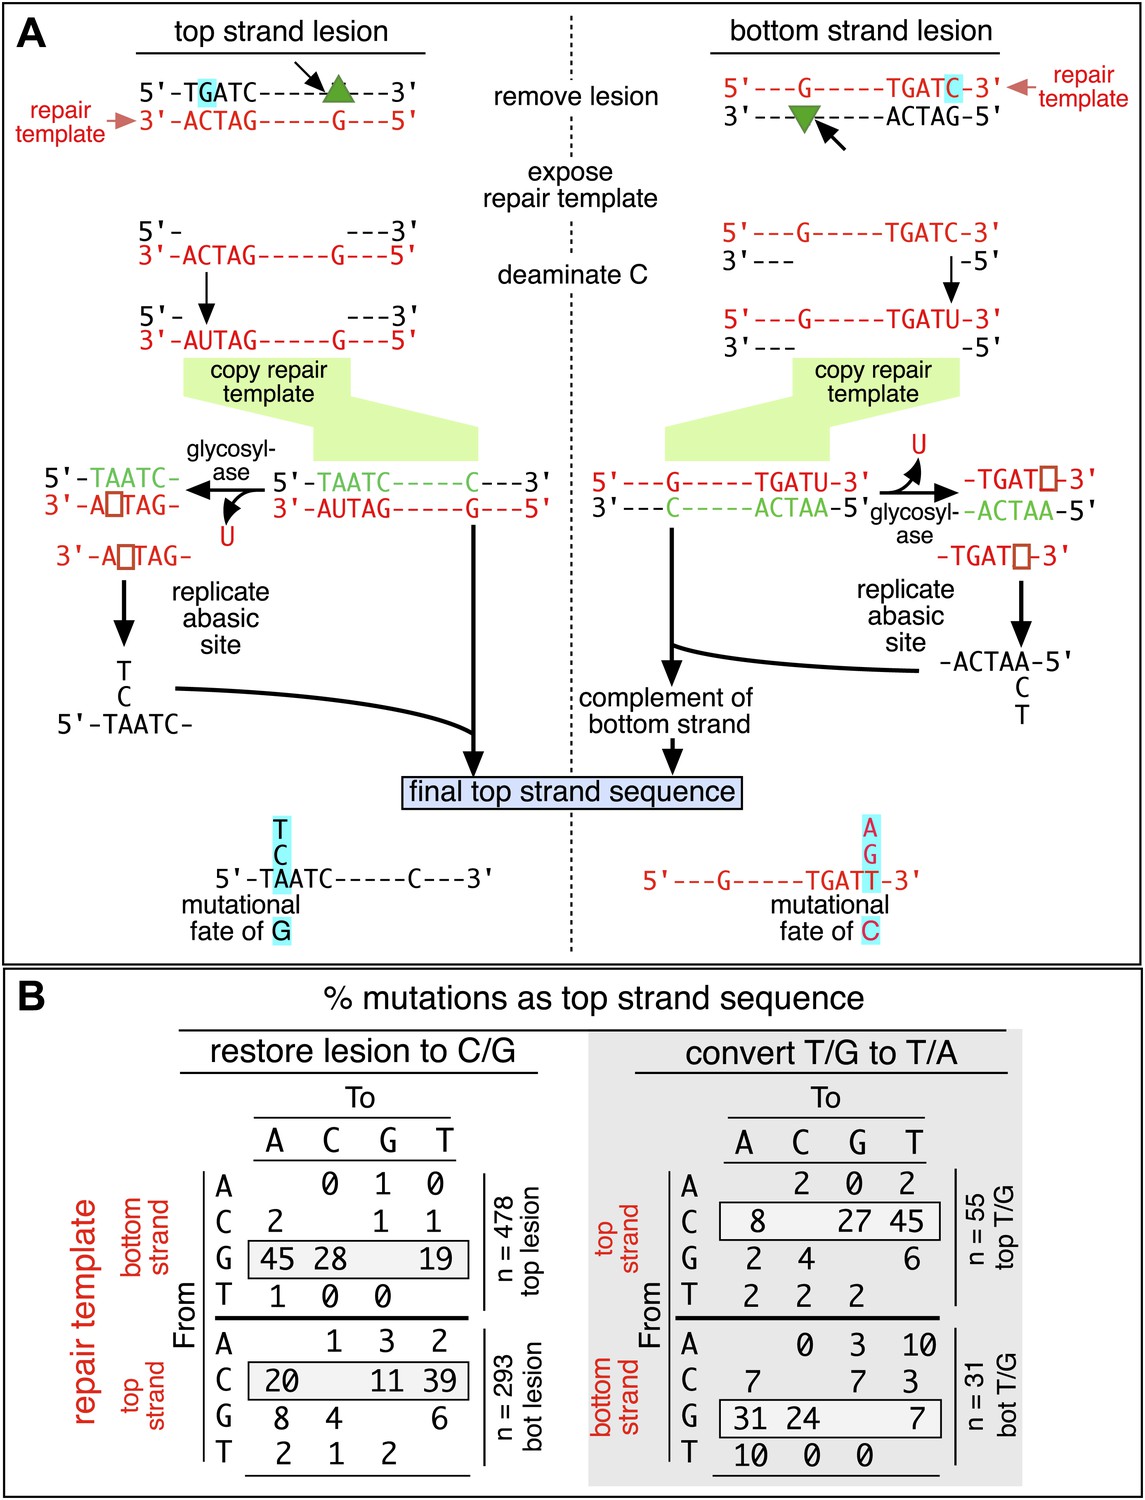
Mutagenic process and mutational outcome.
(A) Graphical representation showing the expected repair template strands (red) for the mutagenic repair of top strand (left panel) or bottom strand (right panel) lesions that were restored to C/G. BER would generate a nick 5′ to the lesions (black arrow). Subsequent exposure of the respective bottom or top strand as a single-stranded repair template would render TpC susceptible to deamination by APOBEC to TpU. The U could be subject to several different processes that would eventually register as a G mutation on top strand GpA (left panel) or as a C mutation on top strand TpC (right panel). See text for more details. (B) Identity and fate of the mutated bases (as percentages of the total mutations) in terms of top strand sequence induced by repair that either restored lesions to C/G (left quadrants) or converted T/G to T/A (right quadrants, gray box) for top strand (upper two quadrants) and bottom strand (lower two quadrants) lesions on FM1. The numbers of mutations (n) are given for each category. The data are pooled according to the fate and the strand location of the lesions.
Figure 5

Mutational spectra and dinucleotide context of clustered and unclustered mutations.
(A) Fraction of the bases (in terms of top strand sequence) that were mutated in response to the repair of the indicated lesions on the top (top two panels) or bottom (bottom two panels) strand of FM1 for the clustered (more than one mutations per sequence) or unclustered (one mutation per sequence). The numbers of the mutated sequences and the mutations are shown below each bar graph. p-values were calculated using the Fisher exact test. (B) Dinucleotide context of the clustered and unclustered mutations with respect to its 5′ or 3′ base. The faint purple bars show the fractions of all sixteen dinucleotides in the reporter region. The number and percentage of clustered and unclustered mutations are shown. p-values were calculated using the Fisher exact test. The data are pooled according to the type and strand location of the lesion.
Figure 6 with 1 supplement
APOBEC deaminases mediate repair-induced mutagenesis.
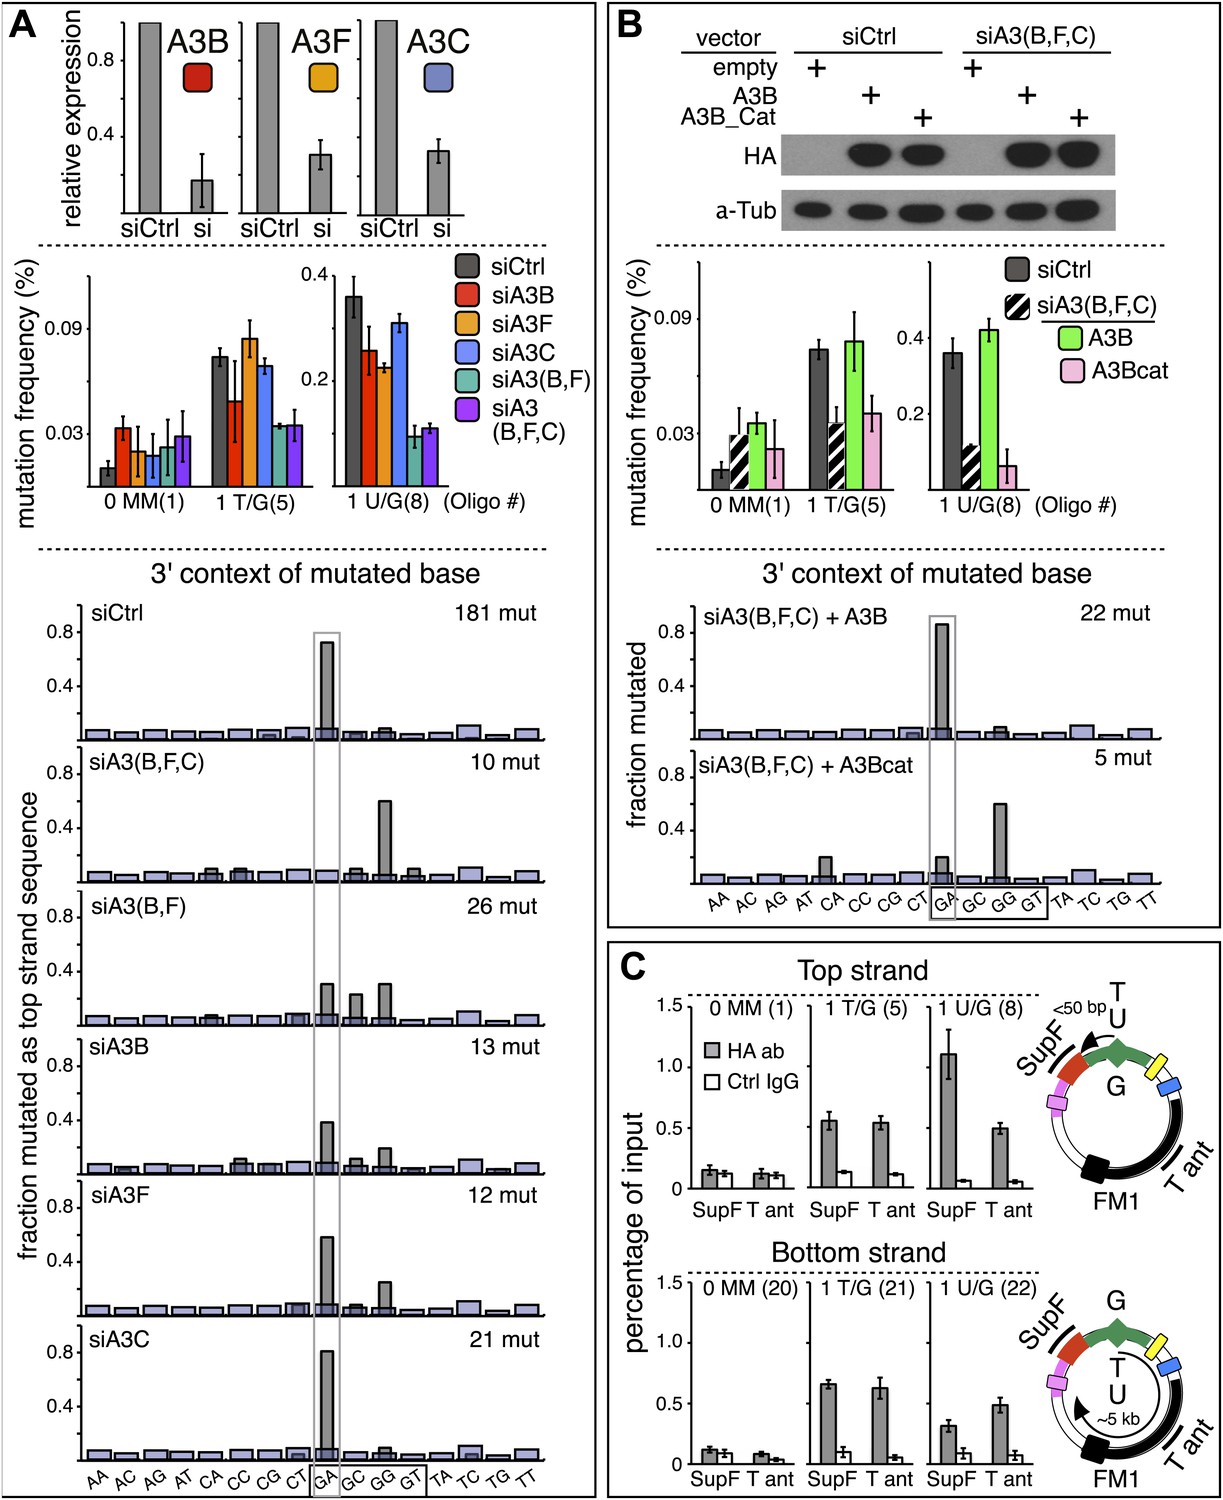
(A) Effect of APOBEC knockdowns. Top panel, the effect of siRNA knockdown on expression of the TpC preferring, A3B, A3F and A3C deaminases as measured by qRT-PCR. Middle panel, the mutation frequency plotted as a function of the indicated lesion on the top strand of FM1 for the cells transfected with siCtrl (control siRNA), siA3B, siA3F, siA3C, siA3B and siA3F, or all three. Means (±SEM) are shown from at least two independent experiments. The number of oligonucleotide (Oligo #) used to reconstitute the shuttle vector is given below each bar graph and the sequences of these lesion-containing oligonucleotides are listed in Supplementary file 1. Bottom panel: the dinucleotide spectra are derived from pooled data of the mutated bases induced by restoration of T/G and U/G on the top strand of FM1 in the presence of control siRNA (siCtrl) or the indicated APOBEC siRNAs. The faint purple bars show the fractions of all sixteen dinucleotides in the reporter region. (B) Rescue of APOBEC deaminase knockdown. Top panel, western blots with anti-HA antibody show the synthesis of the siRNA resistant A3B (carboxy-terminal tagged with the HA antigen) or its catalytically inactive version (A3B_Cat) in the presence of control siRNA (siCtrl) or siRNAs against A3B and A3F and A3C–siA3(B,F,C). α-Tub (α-Tubulin, loading control). The middle panel shows the effects of these conditions on the mutation frequency induced by repair of the indicated lesions—the cross hatched bar graphs show the corresponding results (i.e., siA3(B,F,C) – dark purple bars) from panel A. Means (±SEM) are shown from at least two independent experiments. Bottom panel, the 3′ dinucleotide context of the mutated base induced by restoration of the lesions (pooled from the T/G and U/G mismatches) in the presence of siRNA resistant A3B and A3B_Cat deaminases. (C) ChIP-qPCR assays to detect the binding of A3B-3HA to the FM1 episome using anti-HA antibody (gray bar) or a control antibody, anti-FLAG IgG (open bar). Diagrams on the right indicate the regions of FM1 that are cognate to the qPCR primers, and the distances between the lesion and the cis 3′ end of the reporter. Bar graphs show enrichment of the DNA fragments pulled down by the antibodies for 0 MM-, T/G- or U/G-containing episomes. Means (±SEM) are shown from two independent experiments.
Figure 6—figure supplement 1

Trinucleotide context of the mutated C of TpC induced by DNA repair after APOBEC knockdown read out as top strand G mutations.
The C mutations (read out as top strand G mutations) induced by restoration to C/G of top strand lesions of FM1 (pooled from the T/G and U/G mismatches). The faint purple bars show the relative fractions of trinucleotide contexts in the reporter region.
Figure 7
The APOBEC content and mutagenic effect of DNA repair in various cells.
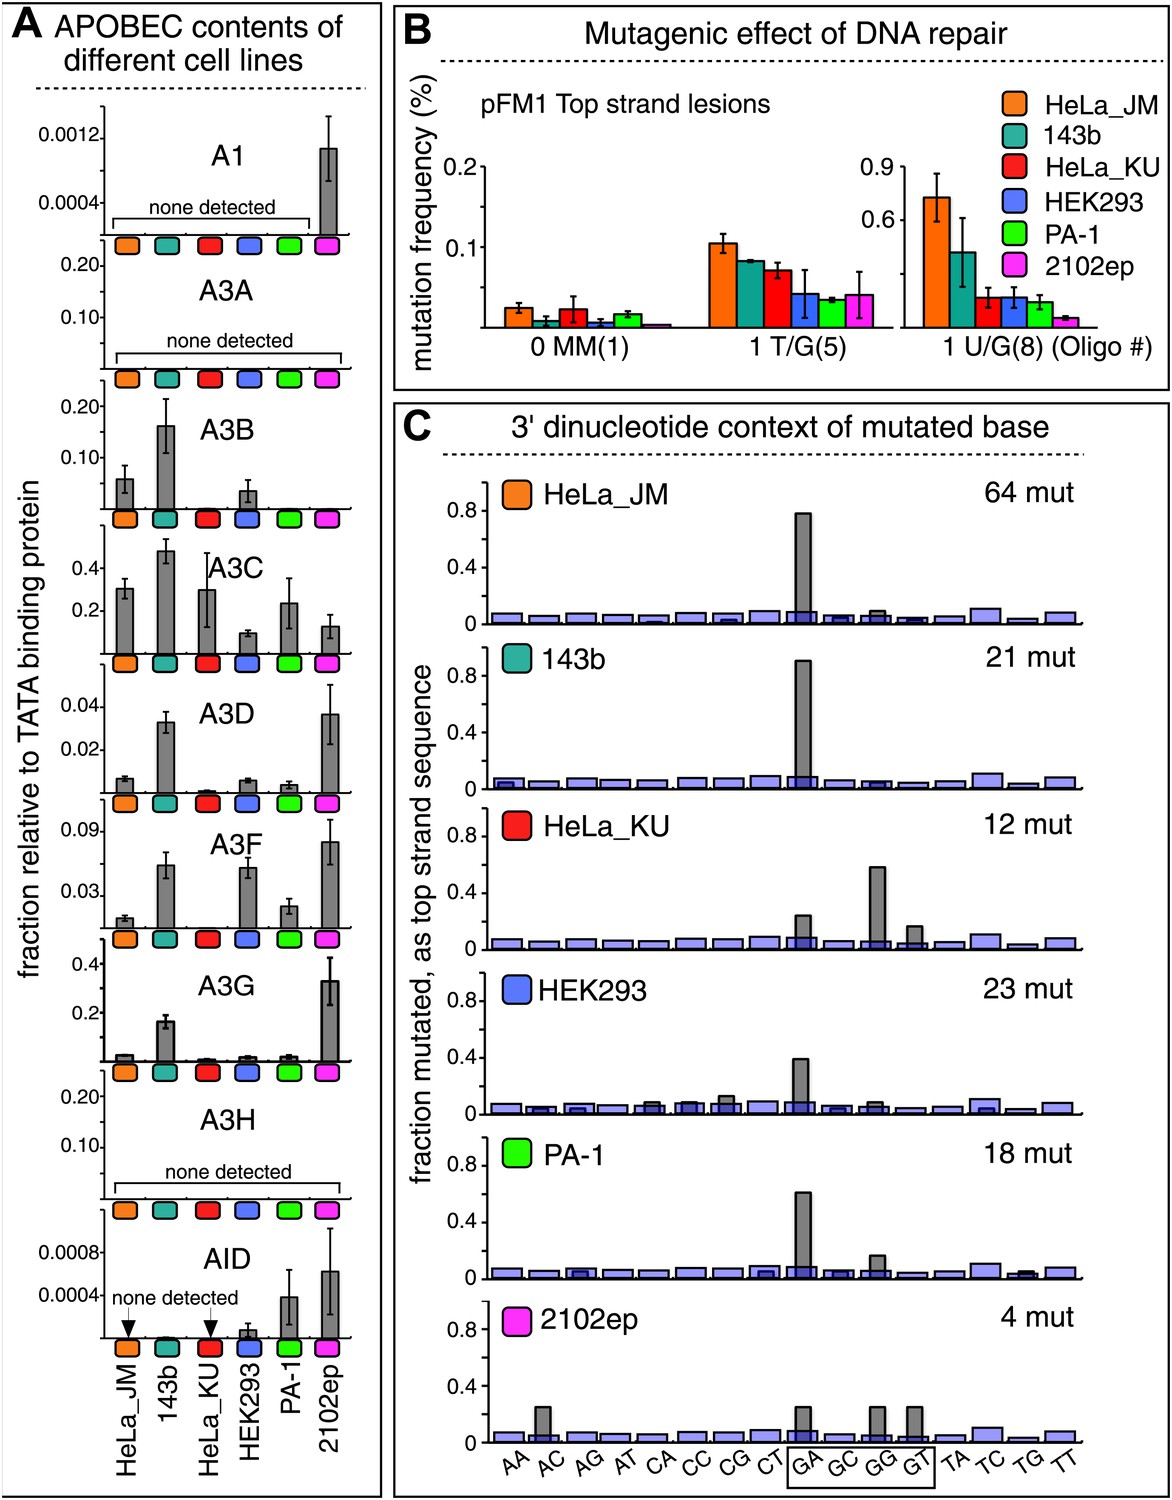
(A) APOBEC contents of different cell lines. APOBEC mRNA expression relative to the constitutively expressed TATA binding protein (TBP) in different cells determined by qRT-PCR. Means (±SEM) are shown from three independent experiments. (B) The mutagenic effect of DNA repair. The mutation frequencies as a function of the indicated lesion on the top strand of pFM1 in different cells are shown. Means (±SEM) are shown from at least two independent experiments and the number of oligonucleotide (Oligo #) used to reconstitute the shuttle vector is given below each bar graph. (C) The 3′ dinucleotide context of the mutated base induced by restoration of the lesions (pooled from the T/G and U/G mismatches) in different cells. The faint purple bars show the fractions of all 16 dinucleotides in the reporter region.
Figure 8 with 2 supplements
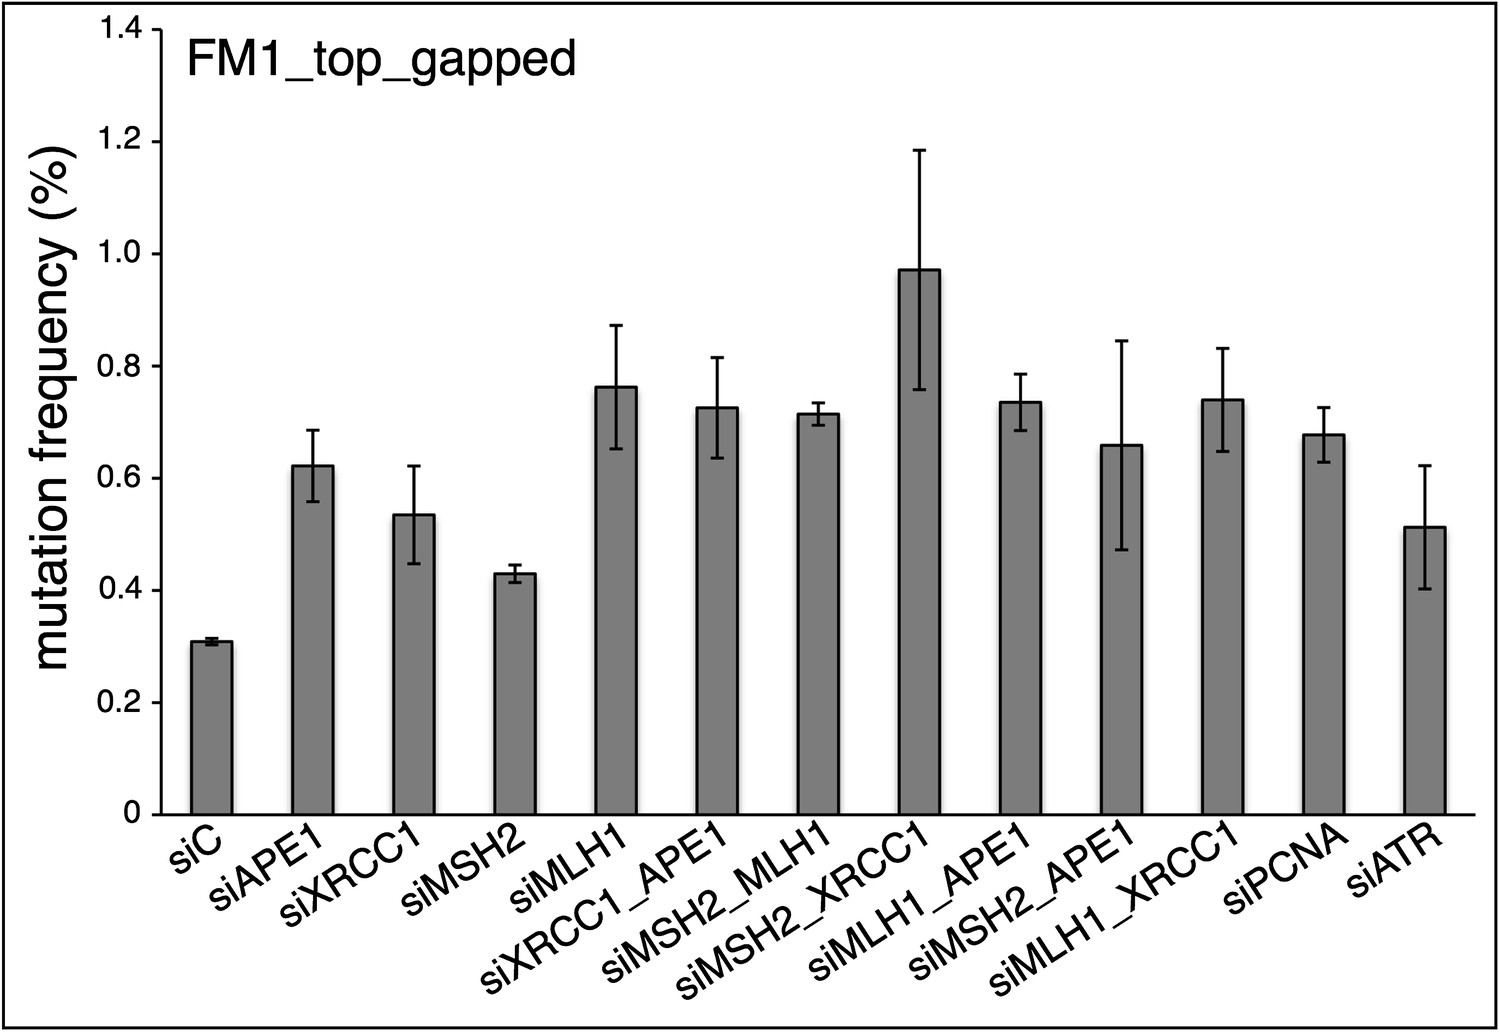
siRNA knockdowns of DNA repair pathways reduce mutagenesis.
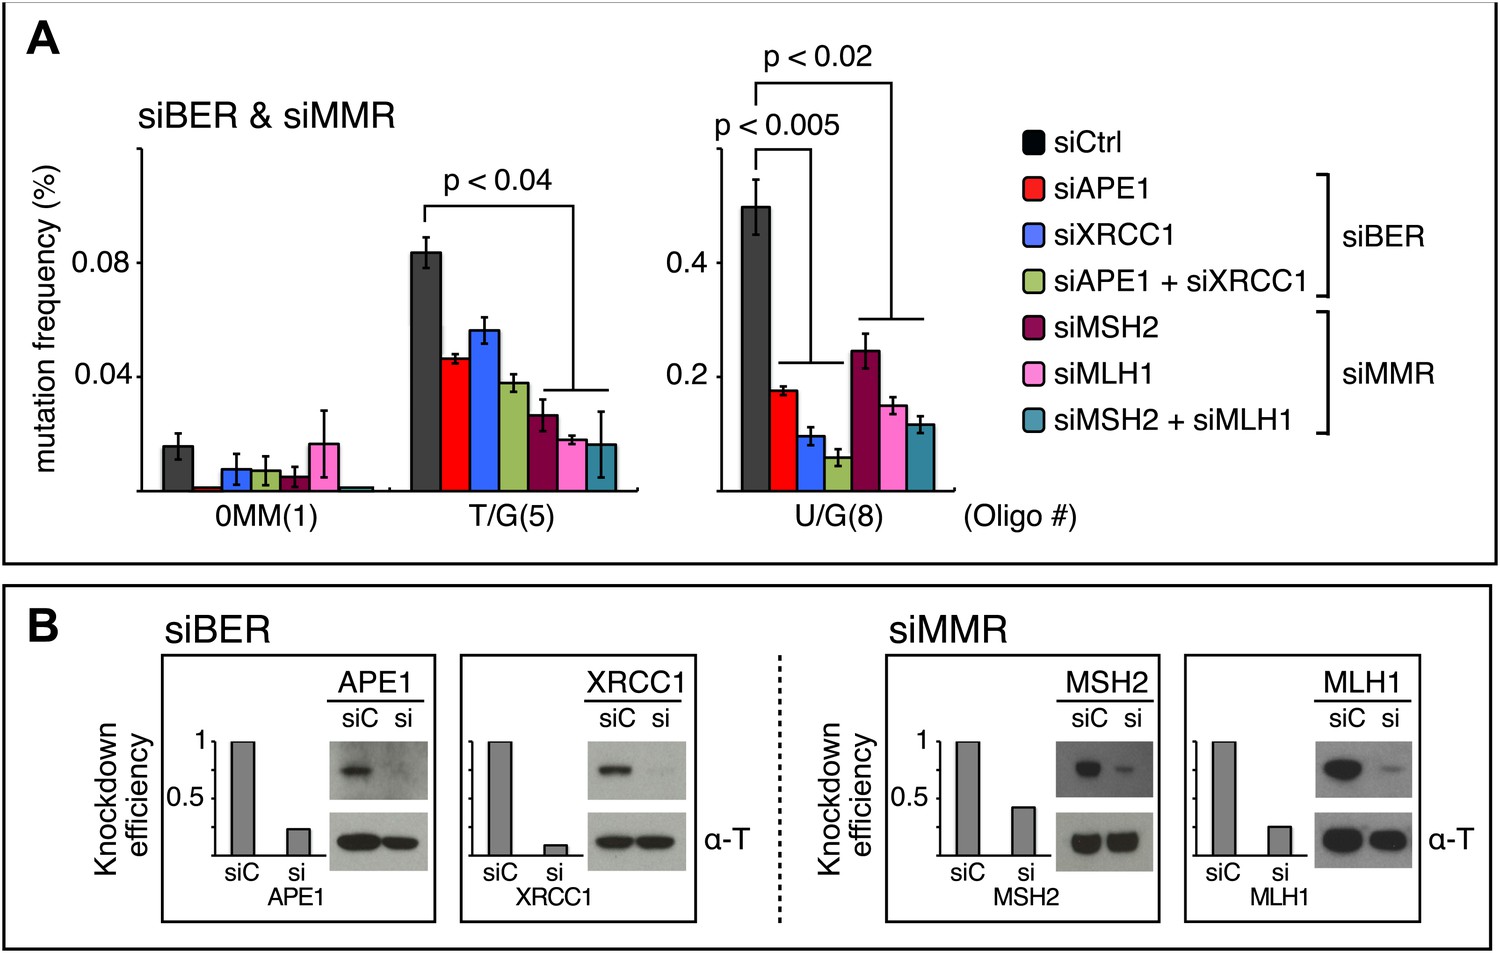
(A) Effect of the knockdowns of BER or MMR proteins. The mutation frequency is plotted as a function of the indicated lesion on the top strand of FM1 for control siRNA (siCtrl) and the indicated siRNA transfections. Means (±SEM) are shown from at least two independent experiments and the number of oligonucleotide (Oligo #) used to reconstitute the shuttle vector is given below each bar graph. p-values were calculated using the Fisher exact test. These experiments were carried out with Klenow treated reconstituted episomes (see text and ‘Materials and methods’). (B) Efficiency of DNA repair protein knockdowns. Western blots for the whole-cell lysates of HeLa cells transfected with siRNAs against various components of the BER and MMR pathways were performed with the antibodies against these proteins and α-T (α-Tubulin, loading control). The western blot results were quantified with Quantity One software (Bio-Rad, Hercules, CA) and normalized to the amount of α-Tubulin to calculate the efficiency of the siRNA knockdowns.
Figure 8—figure supplement 1
Klenow treatment reduces the gapped contaminants to undetectable levels.
The reconstituted episomes were incubated under Klenow reaction conditions without (lanes 3–5) or with (lanes 6–8) the 3′-5′ exo− Klenow polymerase (see ‘Materials and methods’), purified, and then restricted with KpnI. Klenow treatment reduces the level of gapped plasmids to undetectable levels.
Figure 8—figure supplement 2
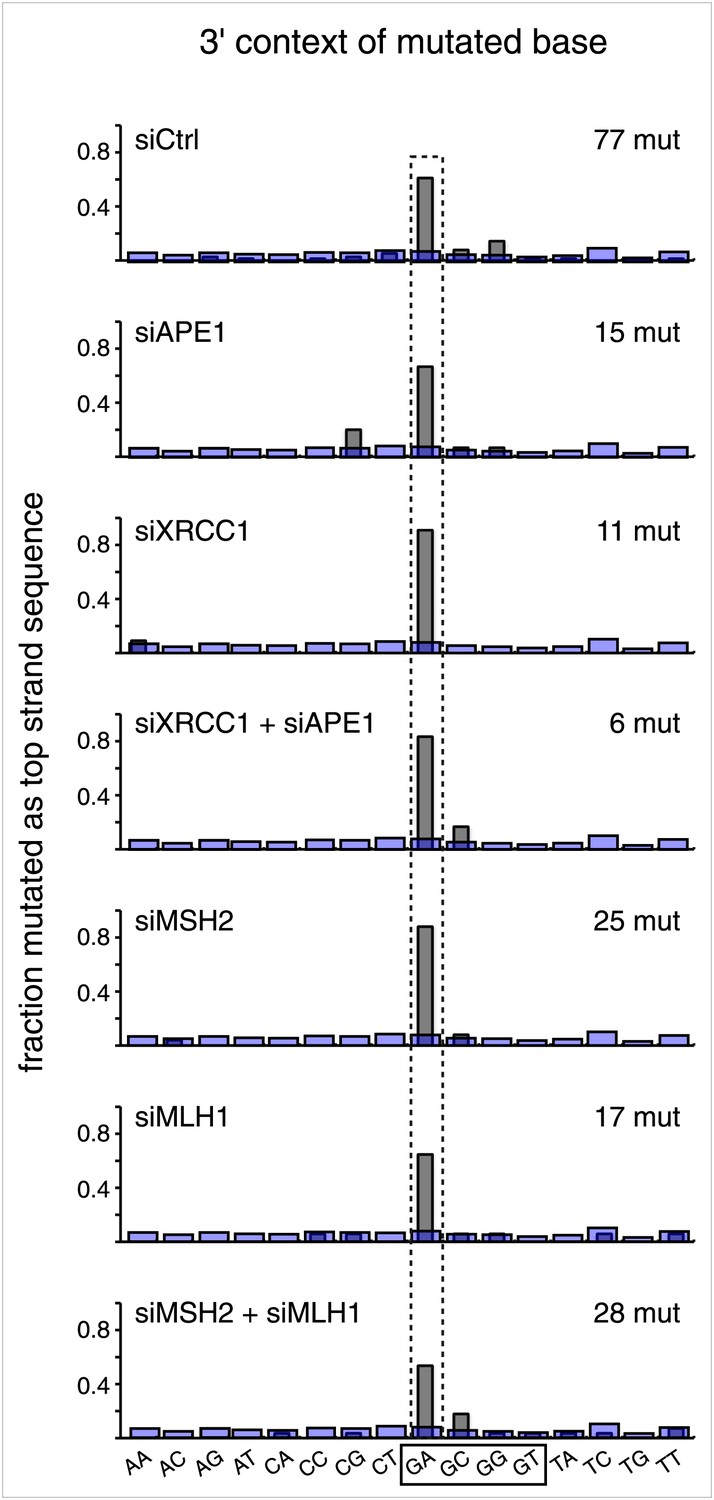
Knockdown of DNA repair proteins does not affect the mutational signature.
The 3′ dinucleotide context of the mutated bases read out on the top strand that were induced by restoration of the lesions (pooled from the T/G and U/G mismatches) to C/G for the indicated knockdowns.
Figure 9 with 1 supplement
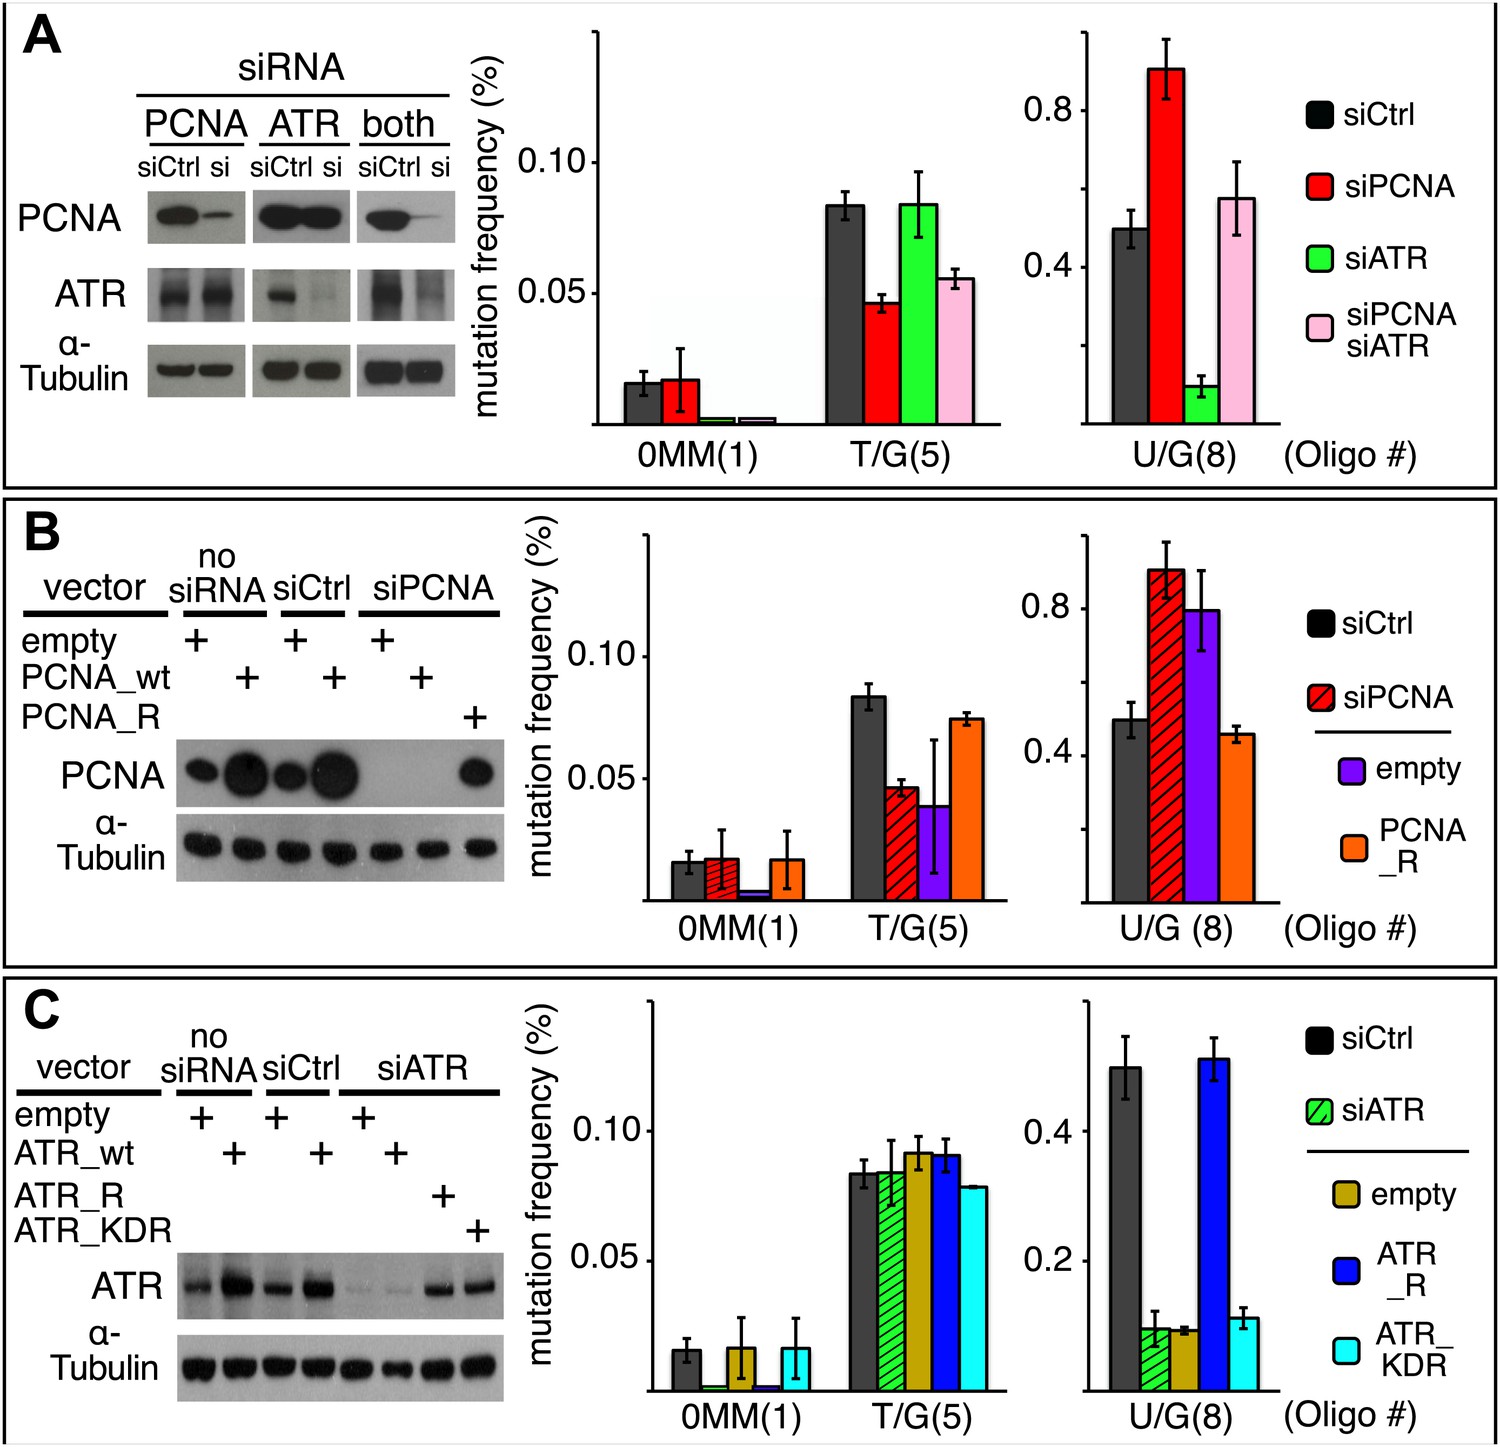
Effect of PCNA and ATR on repair-induced mutagenesis.
(A) Effect of PCNA and ATR knockdowns. The left panel shows the efficiency of PCNA, ATR (or both) knockdowns. The right panel shows the effect of these knockdowns on mutation frequency induced by the repair of each lesion. (B) Rescue of the PCNA knockdown. The left panel shows the expression of endogenous PCNA (empty vector), or exogenously expressed wild type PCNA (PCNA_wt), or siRNA-resistant PCNA (PCNA_R) in the absence of siRNA, or in the presence of control siRNA (siCtrl), or siRNA against PCNA (siPCNA). The right panel shows the effects of these conditions on the mutation frequency induced by the repair of the indicated lesions—the cross hatched bar graphs show the corresponding results from panel A. (C) Rescue of the ATR knockdown. The left panel shows the expression of endogenous ATR (empty vector), or exogenously expressed wild type ATR (ATR_wt), or siRNA-resistant ATR (ATR_R), or siRNA-resistant-kinase defective ATR (ATR_KDR) in the absence of siRNA, or in the presence of control siRNA (siCtrl) or siRNA against ATR (siATR). The right panel shows the effects of these conditions on the mutation frequency induced by the repair of each lesion and the cross hatched bar graphs show the corresponding results from panel A. For all panels means (±SEM) are shown from at least two independent experiments and the number of oligonucleotide (Oligo #) used to reconstitute the shuttle vector is given below each bar graph. These experiments were carried out with Klenow treated reconstituted episomes (see text and ‘Materials and methods’).
Figure 9—figure supplement 1

Knockdown of PCNA or ATR does not affect the mutational signature.
The 3′ dinucleotide context of the mutated bases read out on the top strand induced by restoration of the lesions (pooled from the T/G and U/G mismatches) to C/G for the indicated knockdowns. The faint purple bars show the fractions of the 16 dinucleotides in the reporter region.
Figure 10
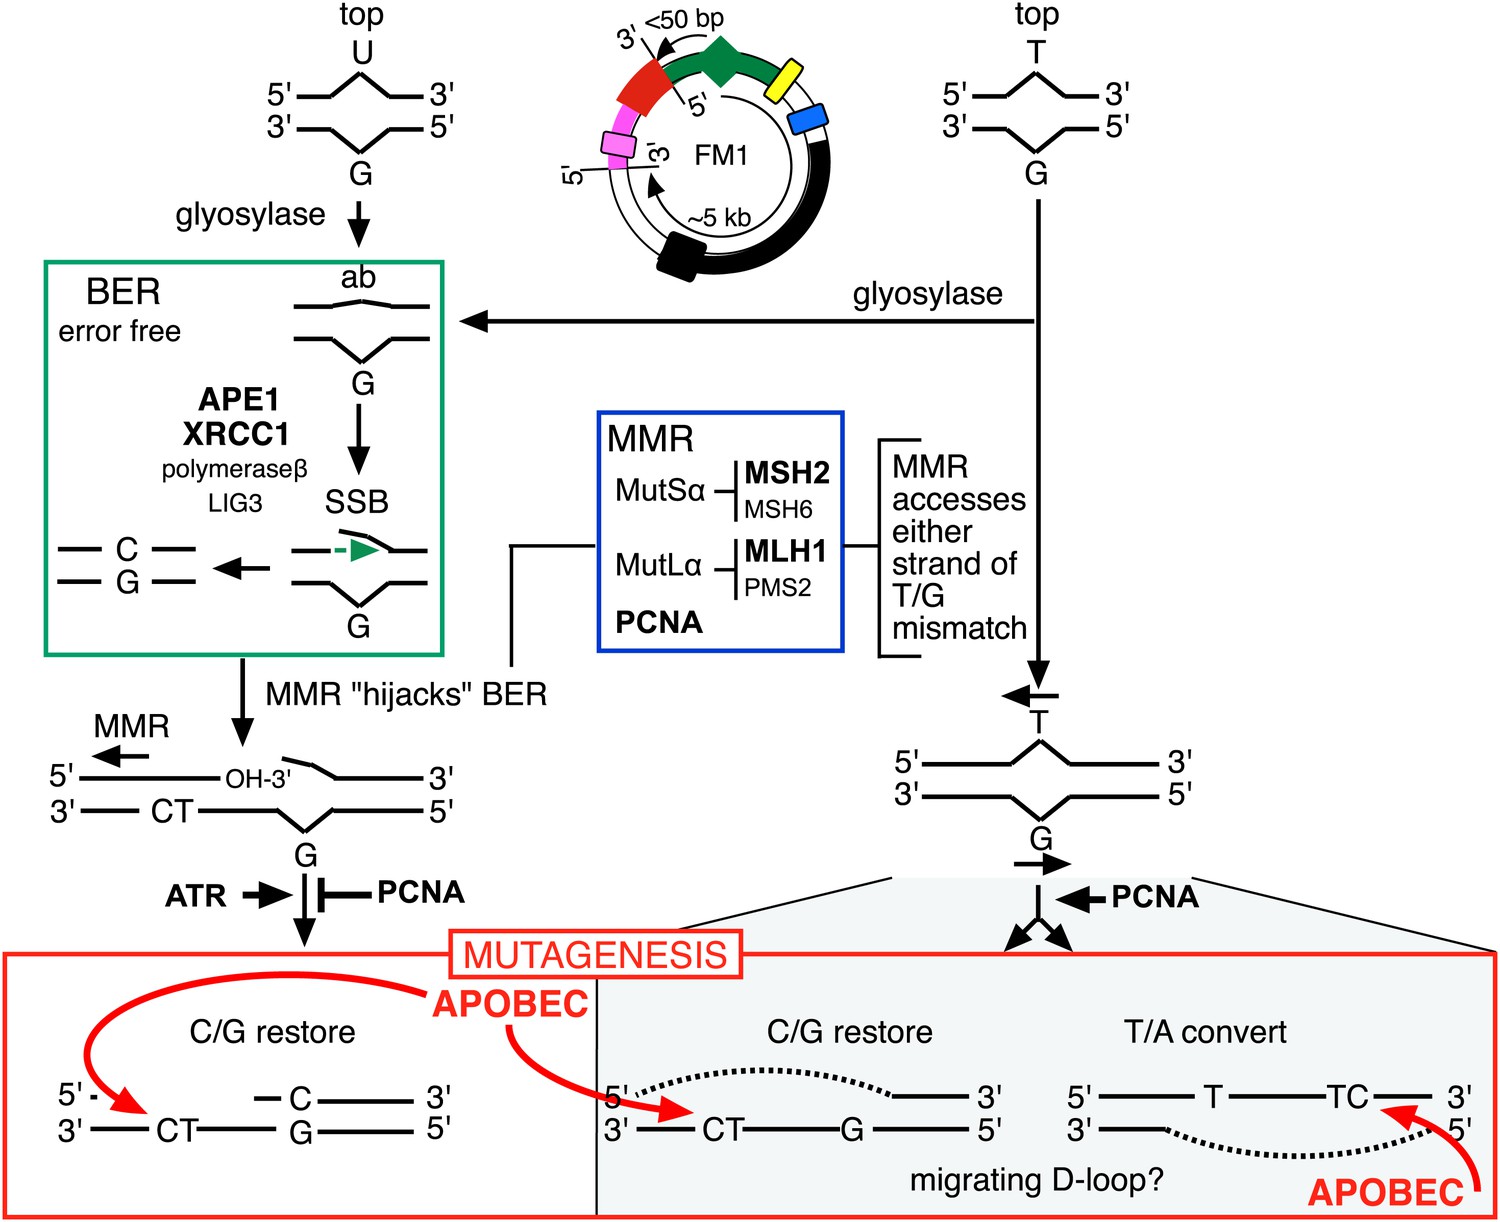
Model for APOBEC-mediated mutagenesis induced by U/G or T/G repair.
Glycosylases generate the substrate for the subsequent steps of the BER pathway (green box). Cleavage of the DNA 5′ of the ensuing abasic site (ab) by APE1, and modification of the 3′ ends would generate a single strand break (SSB) that could be extended in the 5′ to 3′ direction (green arrow) in a reaction involving XRCC1, polymerase-β and LIG3. The blue box encloses components of the MMR pathway. In non-canonical MMR (MutSα and MutLα/PCNA) can hijack U/G-BER intermediates and recruit EXO1 that could generate a gapped DNA 5′ of the lesion (see text). The ensuing single strand, which could serve as the template for DNA repair, can be appropriated by APOBEC deaminases (red box) that could deaminate TpC to TpU and processing the U as described in the text and illustrated Figure 4A. As U/G is almost always restored to C/G, the G-strand is the repair template. The right side of the figure shows direct access of a T/G mismatch by MMR (see text). In this case, either the G-strand or T-strand can serve as the repair template for T/G repair, and the T/G-induced mutagenic effect can propagate undiminished for the 5-kb length of the episome. Therefore, we depict the T/G repair intermediate as a migrating D-loop. We show ATR and PCNA acting just before the APOBEC deaminase because the only evidence that we have for the site(s) of action of these factors is somewhere upstream of the APOBEC step (see ‘Discussion’ for more details). The repair factors that we knocked down are in uppercase, bold typeface.
Author response image 1
Additional files
-
Supplementary file 1
Oligonucleotides used to reconstitute the shuttle vectors.
- https://doi.org/10.7554/eLife.02001.031
-
Supplementary file 2
Mutations.
- https://doi.org/10.7554/eLife.02001.032
Download links
A two-part list of links to download the article, or parts of the article, in various formats.
Downloads (link to download the article as PDF)
Open citations (links to open the citations from this article in various online reference manager services)
Cite this article (links to download the citations from this article in formats compatible with various reference manager tools)
Repair of naturally occurring mismatches can induce mutations in flanking DNA
eLife 3:e02001.
https://doi.org/10.7554/eLife.02001


