GE23077 binds to the RNA polymerase ‘i’ and ‘i+1’ sites and prevents the binding of initiating nucleotides
- Rutgers University, United States
- Helmholtz Centre for Infection Research, Germany
- Naicons Srl, Italy
Figures
Figure 1 with 2 supplements

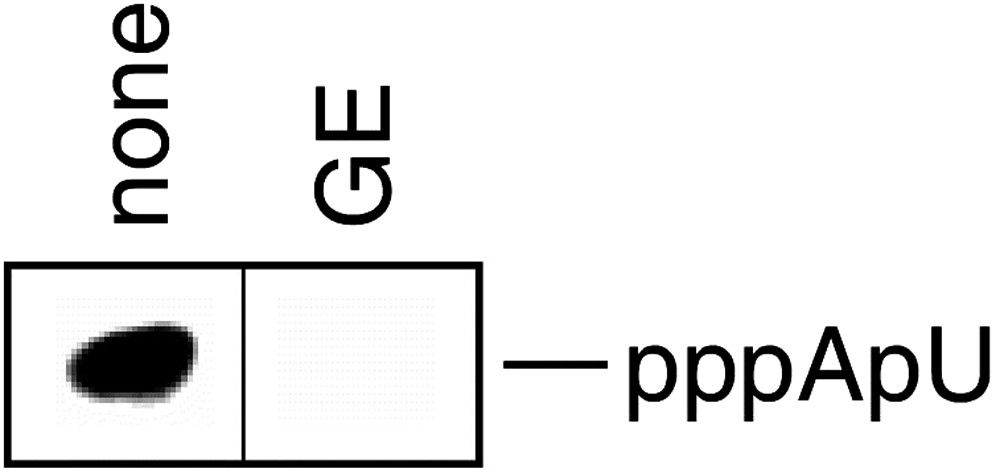
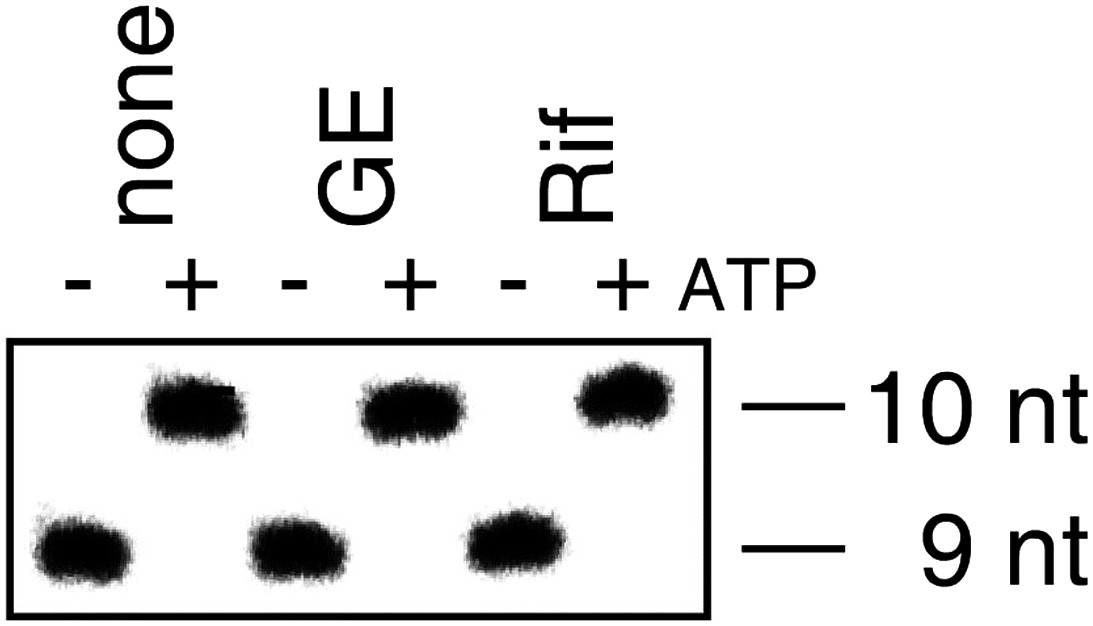
Mechanism of transcription inhibition by GE: inhibition of first nucleotide addition in transcription initiation.
(A) Structure of GE. dmaDap, Nβ-(Z-2,3-dimethylacryloyl)-α,β-diaminopropionic acid; dhGln, β,γ-dihydroxy-glutamine; Ama, aminomalonic acid; aThr, allothreonine; iSer, isoserine. Wavy bonds, previously undefined stereochemistry. (B) GE does not inhibit formation of a transcription initiation complex. (C) GE inhibits nucleotide addition in transcription initiation (primer-dependent transcription initiation). (D) GE does not inhibit nucleotide addition in transcription elongation (elongation from halted TEC containing 29 nt RNA product). See Figure 1—figure supplements 1, 2.
Figure 1—figure supplement 1
GE inhibits nucleotide addition in transcription initiation (de novo transcription initiation).
https://doi.org/10.7554/eLife.02450.004
Figure 1—figure supplement 2
GE does not inhibit nucleotide addition in transcription elongation (reconstituted transcription elongation complexes).
https://doi.org/10.7554/eLife.02450.005
Figure 2 with 2 supplements
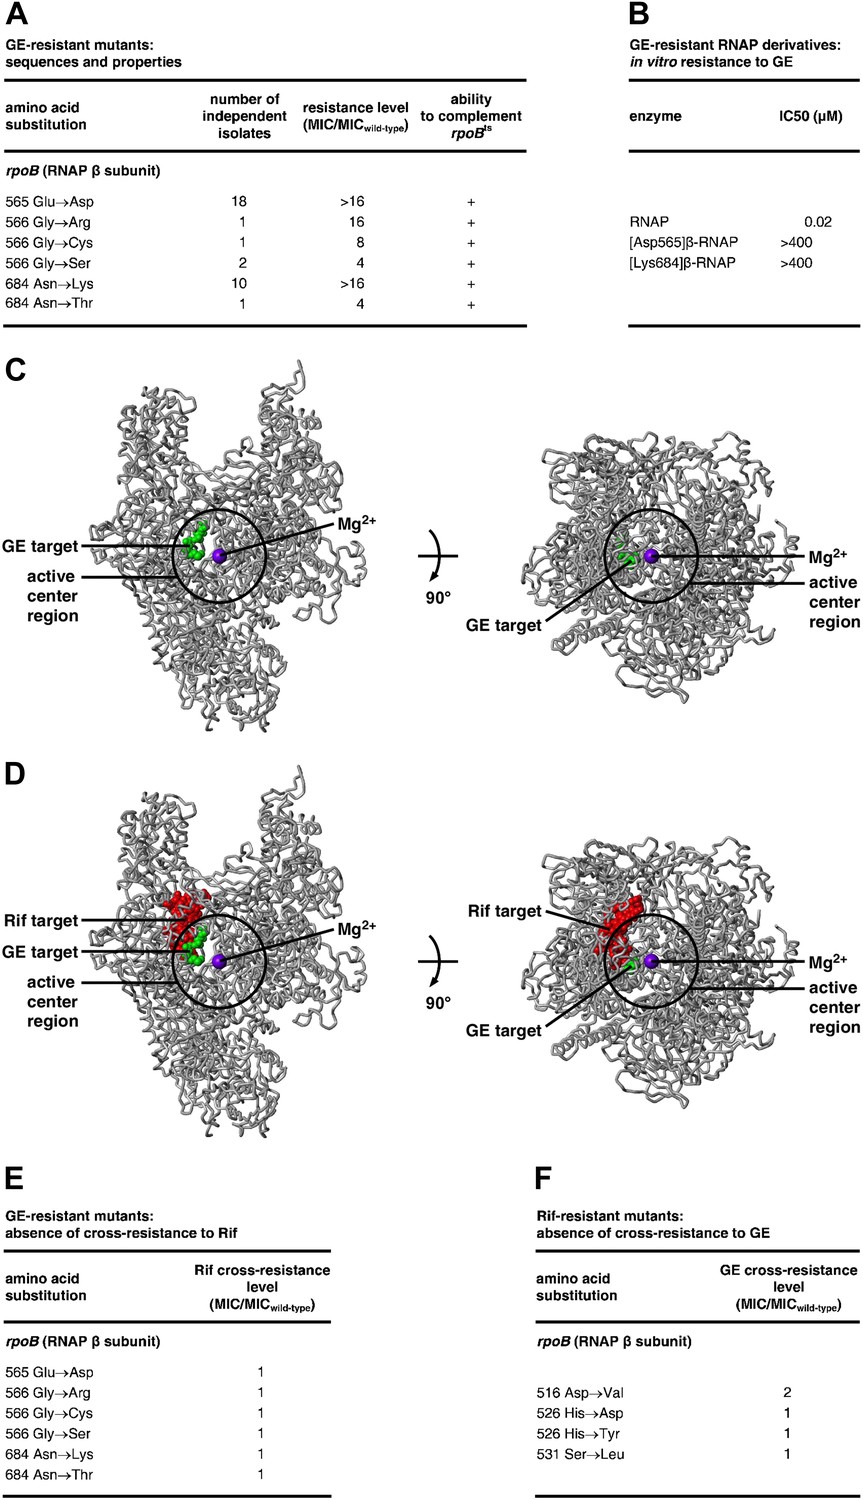
Target of transcription inhibition by GE: RNAP active-center i and i+1 sites.
(A) GER mutants obtained following saturation mutagenesis of E. coli rpoB and rpoC. (B) GER phenotype of RNAP derivatives purified from GER mutants. (C) The GE target overlaps the RNAP active-center region. Structure of RNAP (gray ribbons; black circle for active-center region; violet sphere for Mg2+(I); β’ non-conserved region and σ omitted for clarity; Mukhopadhyay et al., 2008), showing sites of GE-resistant substitutions (green; sequences from A and Supplementary file 2C). Two orthogonal views. (D) The GE target does not overlap the Rif target. Structure of RNAP, showing sites of GER substitutions (green; sequences from A and Supplementary file 2C) and RifR substitutions (red; Jin and Gross, 1988; Severinov et al., 1993). (E) GER mutants are not cross-resistant to Rif. (F) RifR mutants are not cross-resistant to GE. See Figure 2—figure supplements 1, 2.
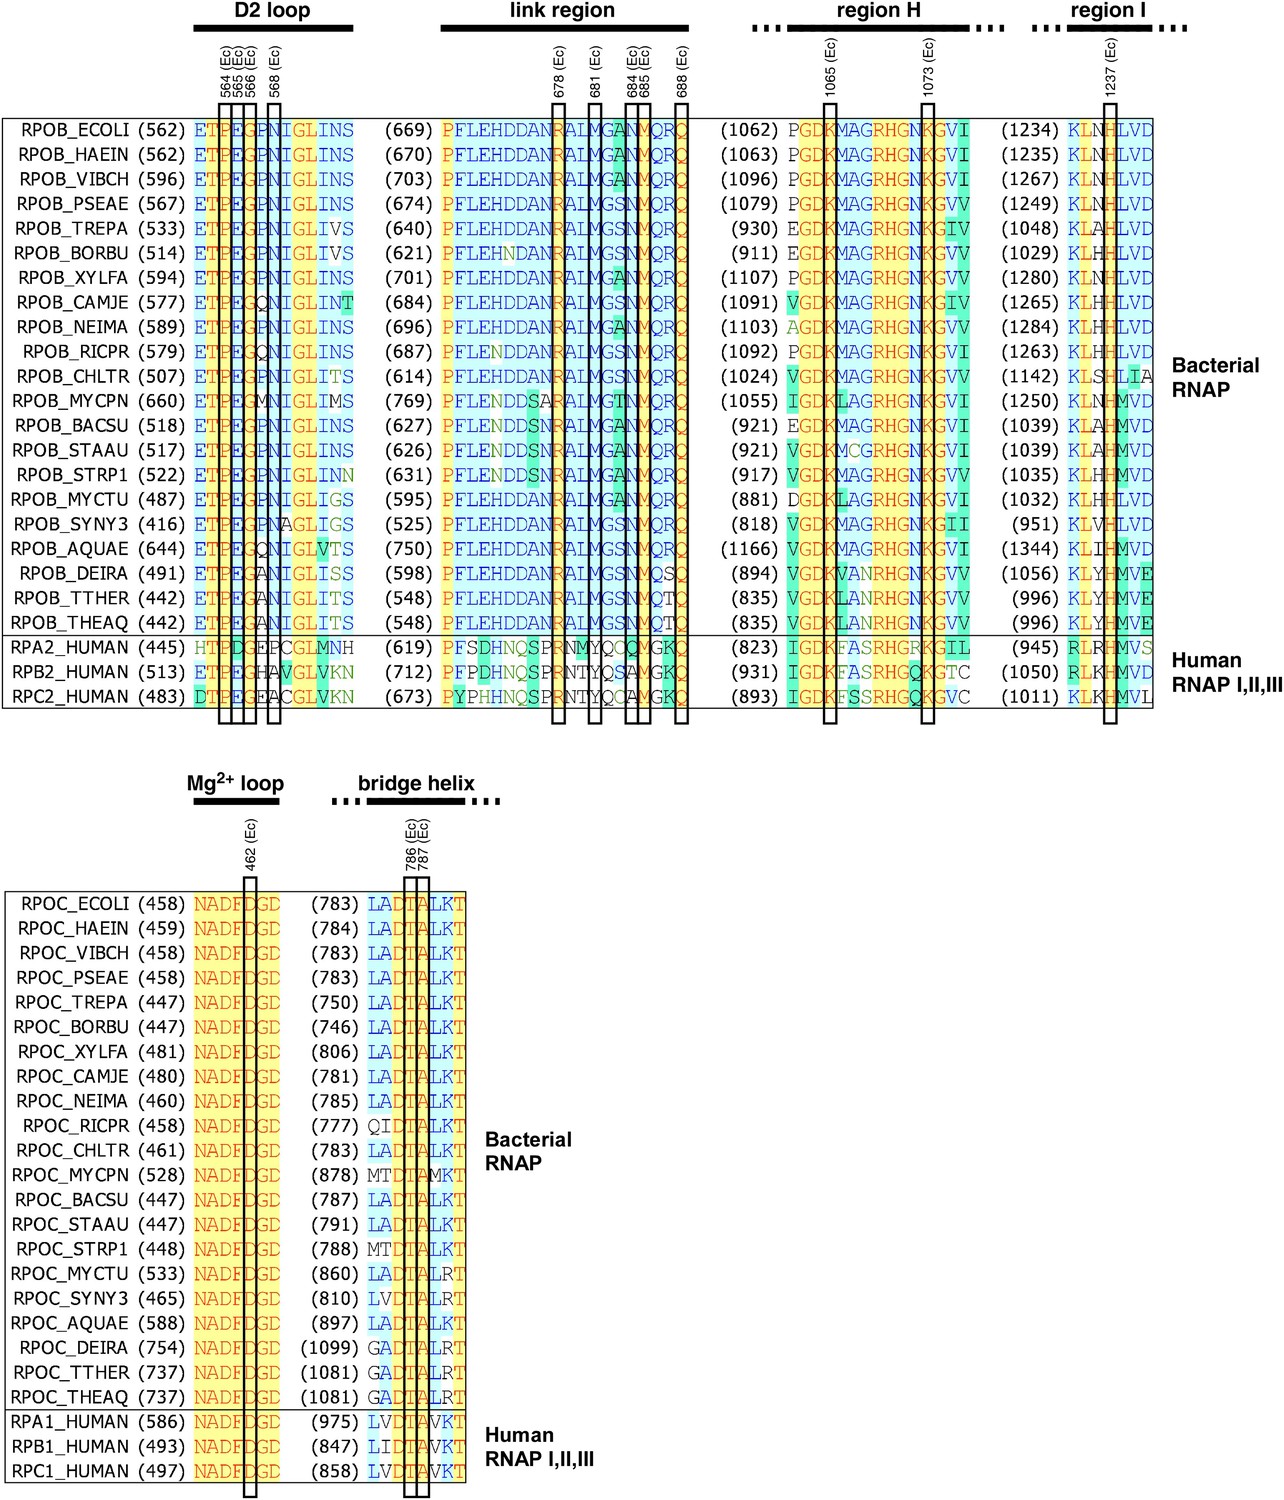
Figure 2—figure supplement 1
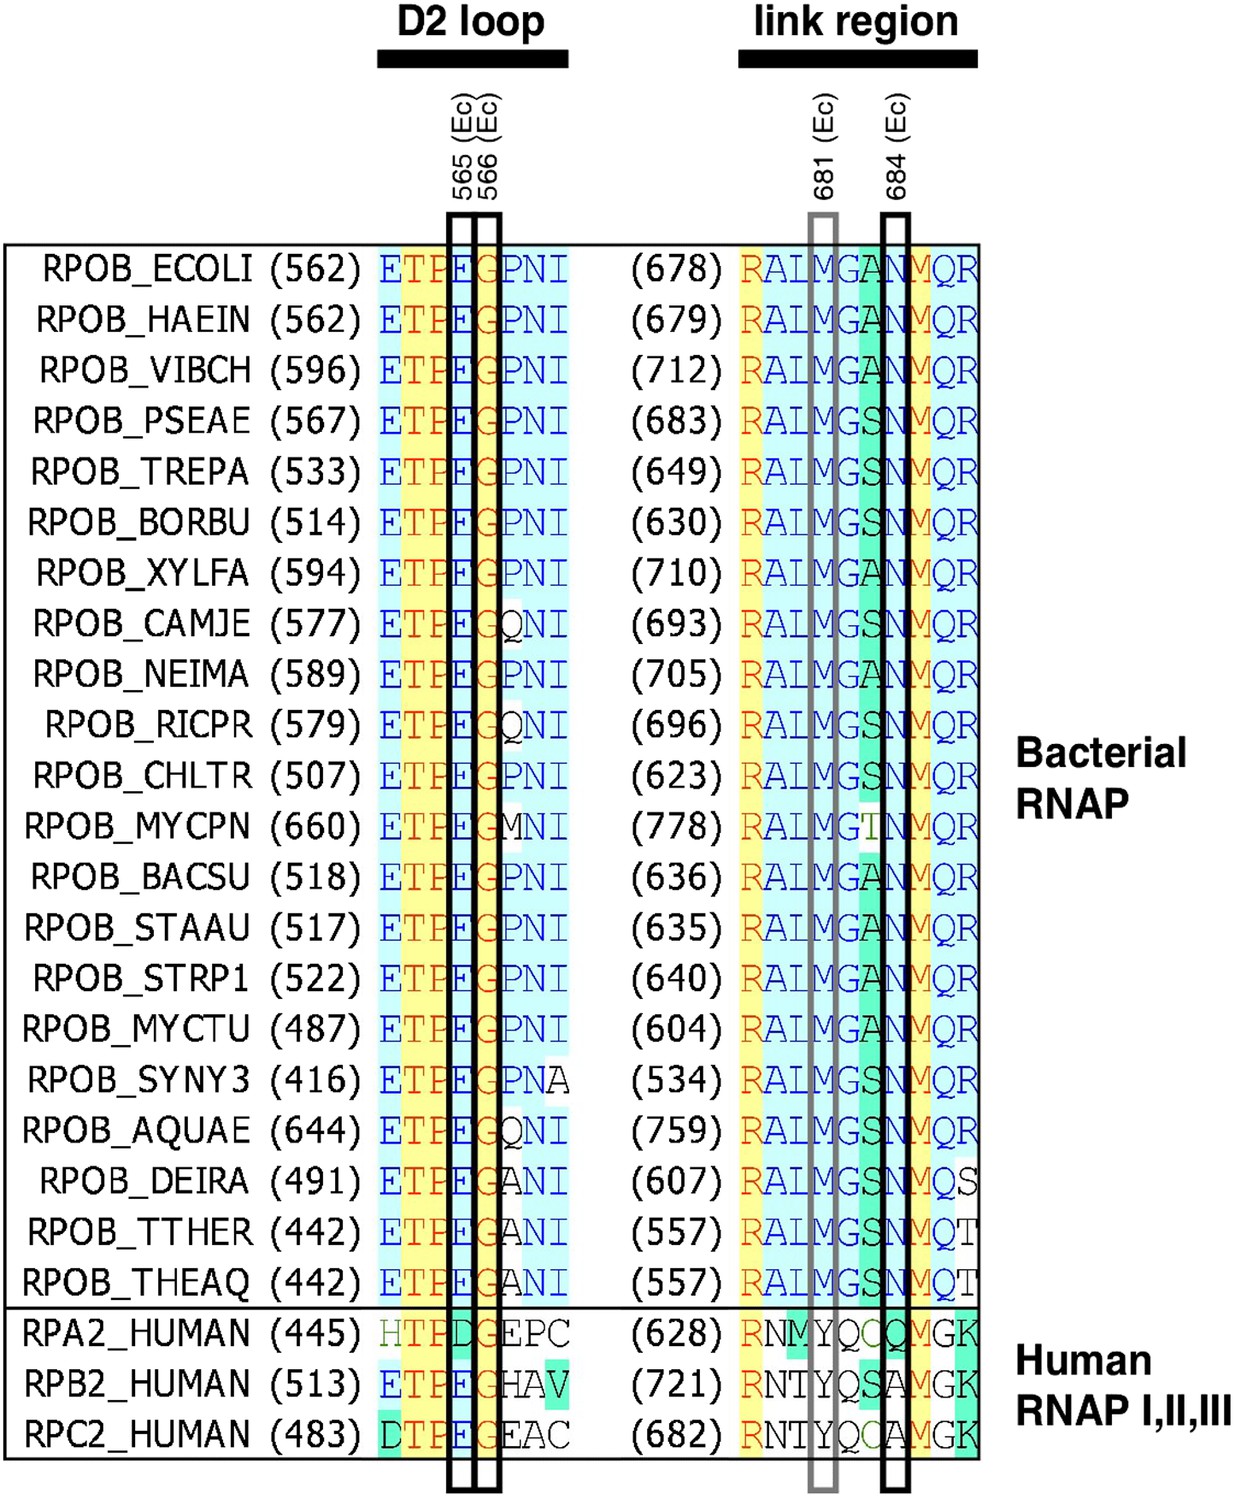
Location of GE target in sequence of RNAP β subunit.
Sequence alignments for the β subunits of bacterial RNAP (top twenty-one sequences) and corresponding subunits of human RNAP I, RNAP II, and RNAP III (bottom three sequences), showing locations of GER substitutions in E. coli (black rectangles; sequences from Figure 2A) and S. pyogenes (black and gray rectangles; sequences in Supplementary file 2C). Species are as follows: E. coli (ECOLI), Haemophilus influenzae (HAEIN), Vibrio cholerae (VIBCH), Pseudomonas aeruginosa (PSEAE), Treponema pallidum (TREPA), Borrelia burgdorferi (BORBU), Xylella fastidiosa (XYLFA), Campylobacter jejuni (CAMJE), Neisseria meningitidis (NEIMA), Rickettsia prowazekii (RICPR), Chlamydia trachomatis (CHLTR), Mycoplasma pneumoniae (MYCPN), Bacillus subtilis (BACSU), Staphylococcus aureus (STAAU), Streptococcus pyogenes (STRP1), Mycobacterium tuberculosis (MYCTU), Synechocystis sp. PCC 6803 (SYNY3), Aquifex aeolicus (AQUAE), Deinococcus radiodurans (DEIRA), Thermus thermophilus (THETH), Thermus aquaticus (THEAQ), and Homo sapiens (HUMAN).
Figure 2—figure supplement 2
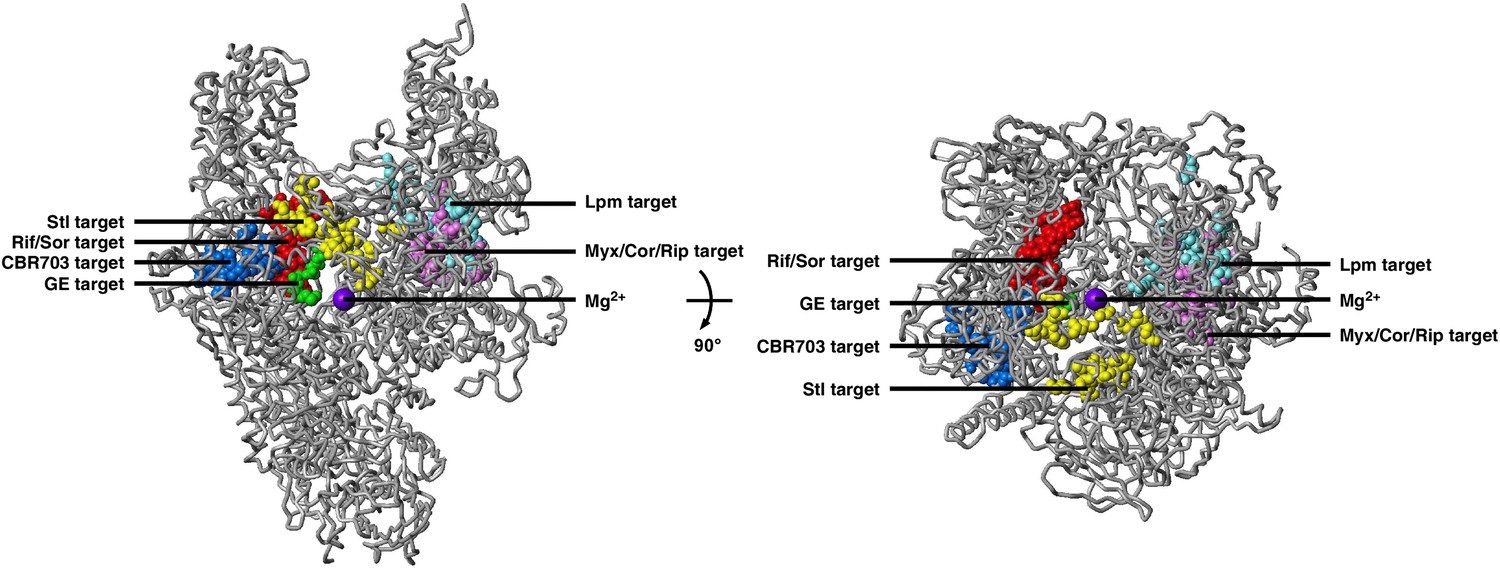
Relationship between GE target and targets of other RNAP inhibitors.
The GE target does not overlap the targets of Rif, Sor, Stl, CBR703, Myx, and Lpm. Structure of bacterial RNAP (gray ribbons; violet sphere for active-center Mg2+; β' nonconserved region and σ omitted for clarity; Mukhopadhyay et al., 2008), showing GE target (green; Figure 2C) and targets of Rif and Sor (red; Ovchinnikov et al., 1981, 1983; Lisitsyn et al., 1984; Jin and Gross, 1988; Severinov et al., 1993, 1994; Garibyan et al., 2003, Campbell et al., 2005; Xu et al., 2005; Rodriguez-Verdugo et al., 2013; ES and RHE, unpublished), Stl (yellow; Lisitsyn et al., 1985; Heisler et al., 1993; Severinov et al., 1995; Tuske et al., 2005), CBR703 (blue; Artsimovitch et al., 2003; X Wang and RHE, unpublished), Myx (magenta; Mukhopadhyay et al., 2008), and Lpm (cyan; Ebright, 2005; Srivastava et al., 2011; RY Ebright, DD, and RHE, unpublished). Views as in Figure 2C.
Figure 3 with 1 supplement

Structural basis of transcription inhibition by GE: crystal structure of RNAP-GE.
(A) Overall structure. Green, GE; violet sphere, Mg2+(I); yellow, σ. (B) Crystallographic data and refinement statistics. (C) Electron density and atomic model for GE. Blue mesh, mFo-DFc omit map for GE (contoured at 2.5σ); blue sticks, GE; gray ribbons, RNAP backbone; green surfaces, RNAP residues at which substitutions confer GE-resistance (Figure 2A; Supplementary file 2C); cyan sticks, additional RNAP residues that contact GE; gray and red sticks additional RNAP residues that coordinate Mg2+(I); violet sphere, Mg2+(I). D2, LR, H, I, Mg2+, and BH denote the RNAP D2 loop, link region, H region, I region, Mg2+ loop, and bridge helix. RNAP residues are numbered both as in T. thermophilus RNAP and as in E. coli RNAP (in parentheses). (D) Contacts between RNAP and GE (stereodiagram). Gray ribbons, RNAP backbone; gray sticks, RNAP carbon atoms; green, GE carbon atoms; red, oxygen atoms; blue, nitrogen atoms; red spheres, water molecules; violet sphere, Mg2+(I). Blue dashed lines, H-bonds; orange dashed lines, coordinate-covalent bonds. (E) Contacts between RNAP and GE (schematic). Red dashed lines, H-bonds; orange dashed lines, coordinate-covalent bonds; blue arcs, van der Waals interactions; W, water molecule. See Figure 3—figure supplement 1.
Figure 3—figure supplement 1
Structural basis of transcription inhibition by GE.
Location of contacting residues in the sequences of RNAP β subunit (top) and RNAP β' subunit (bottom). Sequence alignments for the β and β' subunits of bacterial RNAP (top twenty-one sequences in each panel) and corresponding subunits of human RNAP I, RNAP II, and RNAP III (bottom three sequences in each panel), showing locations of residues that contact GE in the crystal structure of RNAP-GE (black rectangles; identities from Figure 3E), and locations of the RNAP D2 loop, link region, H region, I region, Mg2+ loop, and bridge helix (black bars; boundaries from Sweetser et al., 1987 and Weinzierl, 2010). Species names are as in Figure 2—figure supplement 2.
Figure 4 with 3 supplements
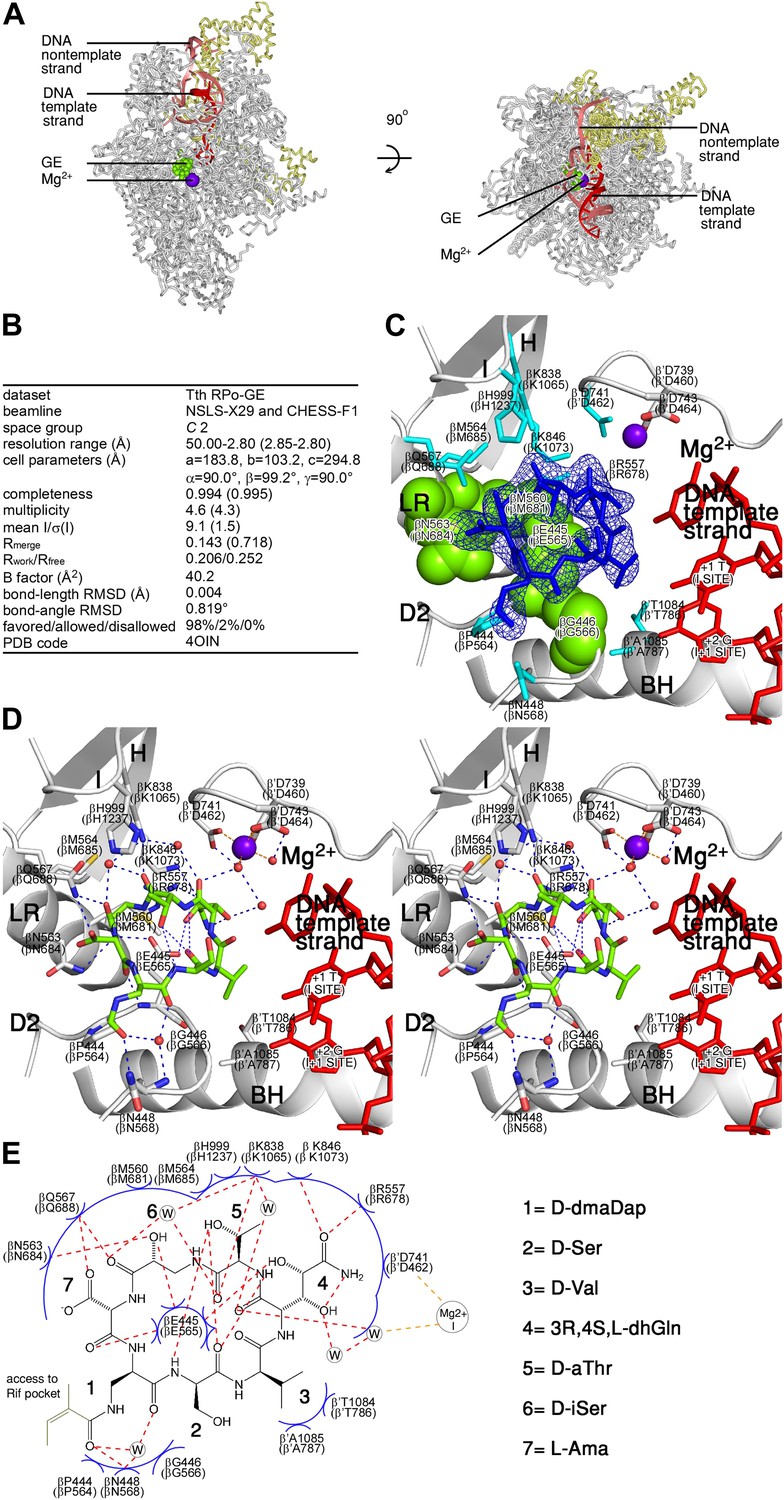
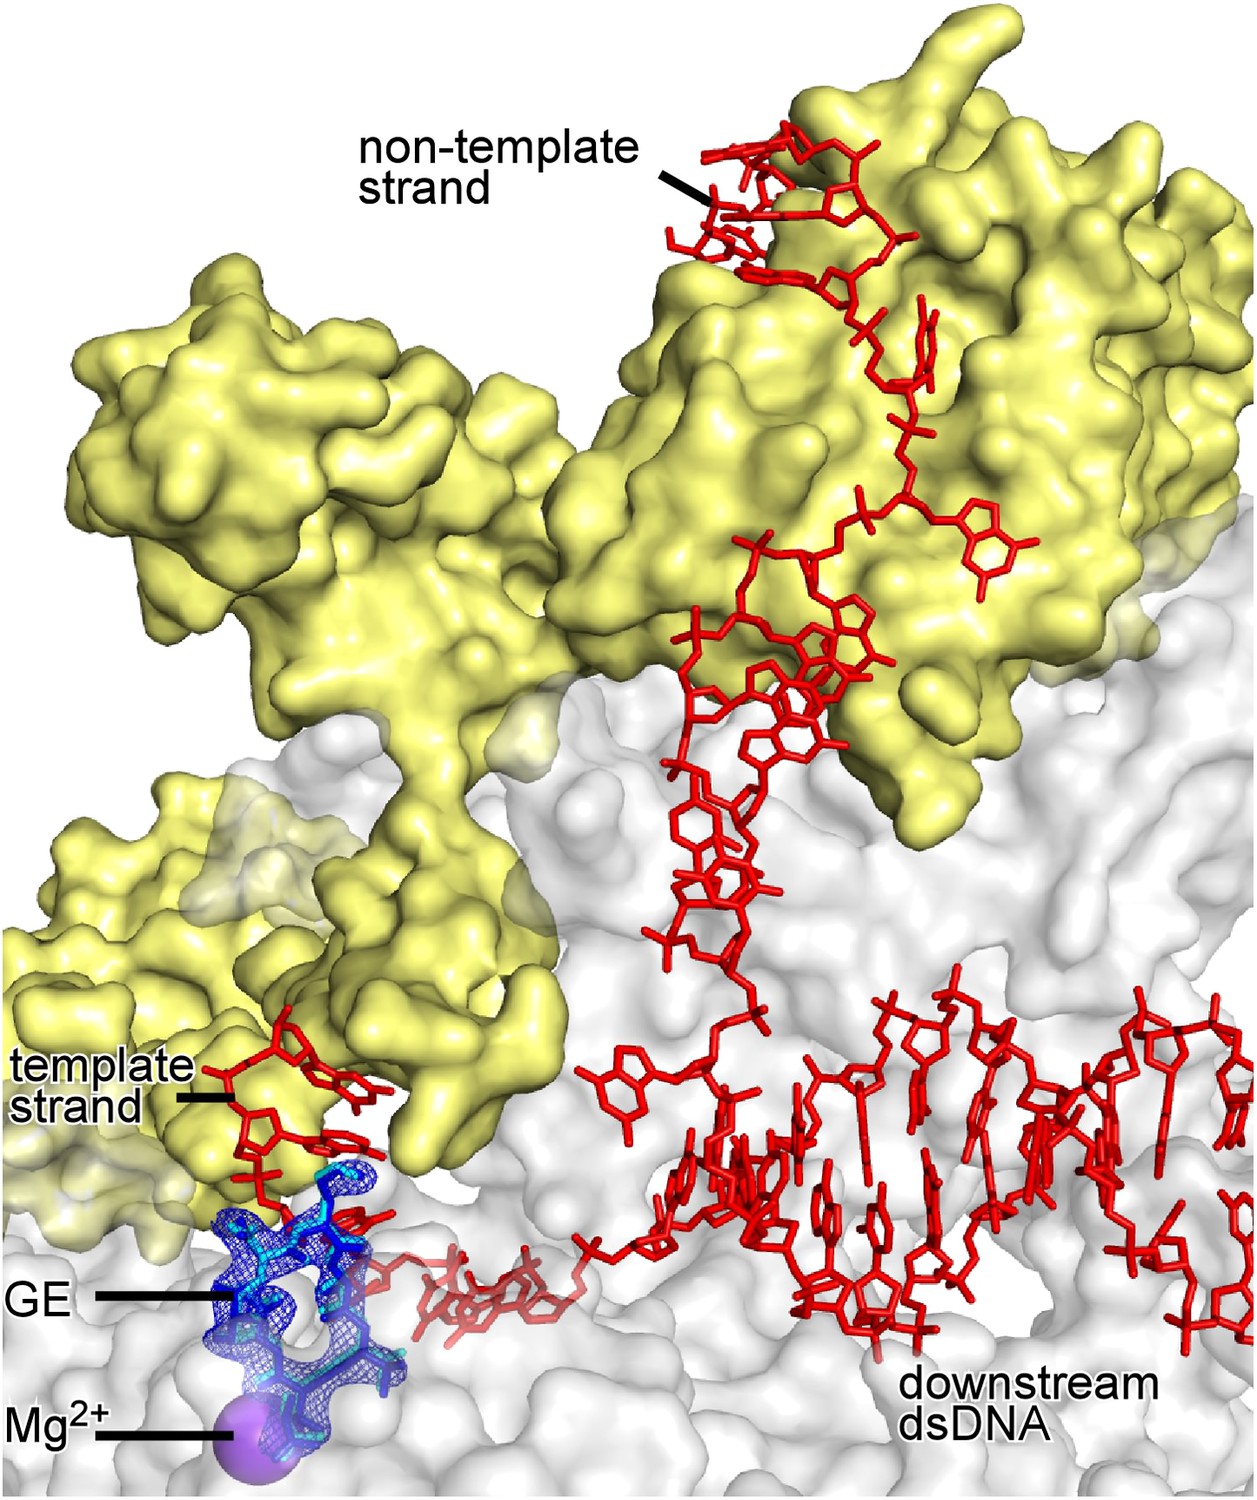
Structural basis of transcription inhibition by GE: crystal structure of RPo-GE.
(A) Overall structure. (B) Crystallographic data and refinement statistics. (C) Electron density and atomic model for GE. (D) Contacts between RPo and GE (stereodiagram). (E) Contacts between RPo and GE (schematic). See Figure 4—figure supplements 1, 2.
Figure 4—figure supplement 1
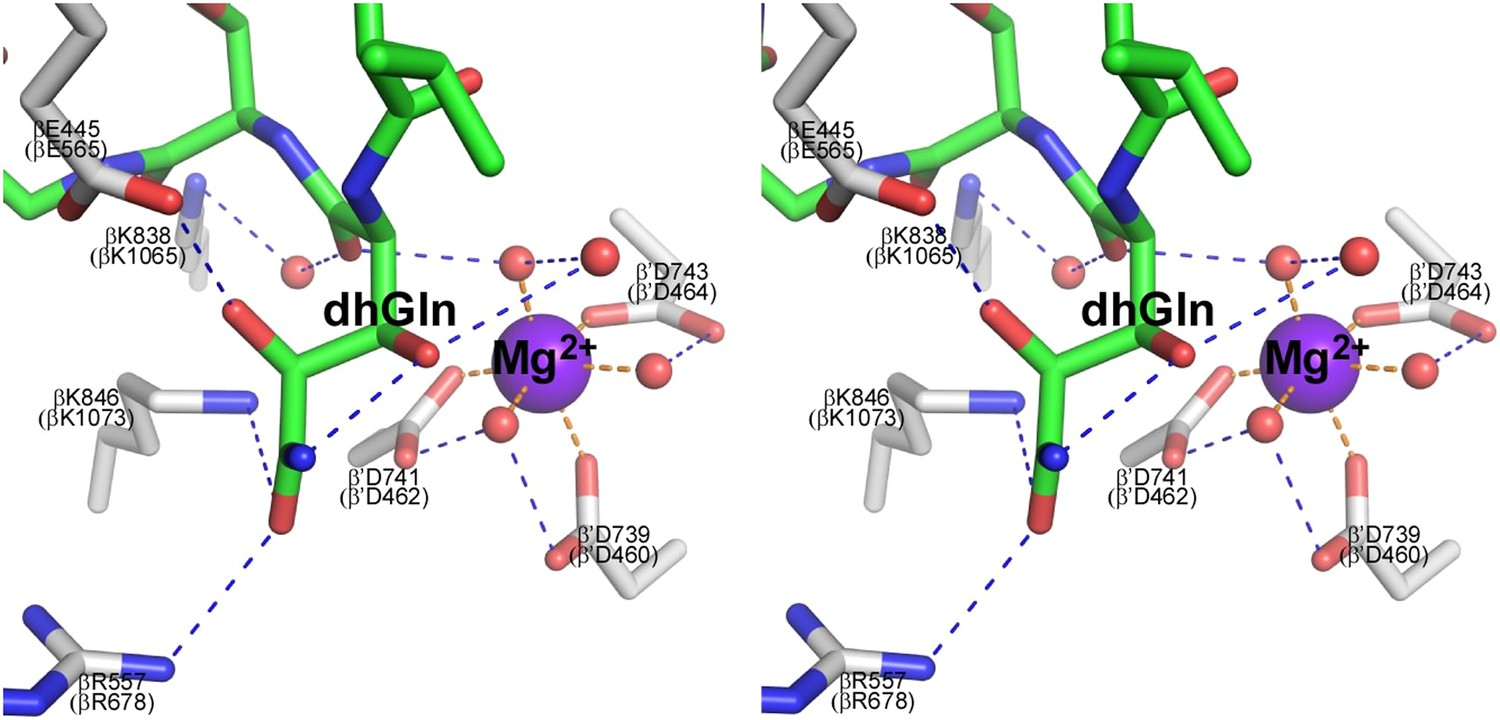
Structural basis of transcription inhibition by GE.
Network of contacts to GE dhGln residue. Stereoview. Gray, RNAP carbon atoms. Green, GE carbon atoms. Red, oxygen atoms. Blue, nitrogen atoms. Violet sphere, Mg2+(I). Red spheres, water molecules. Dashed blue lines, H-bonds. Dashed orange lines, coordinate-covalent bonds.
Figure 4—figure supplement 2
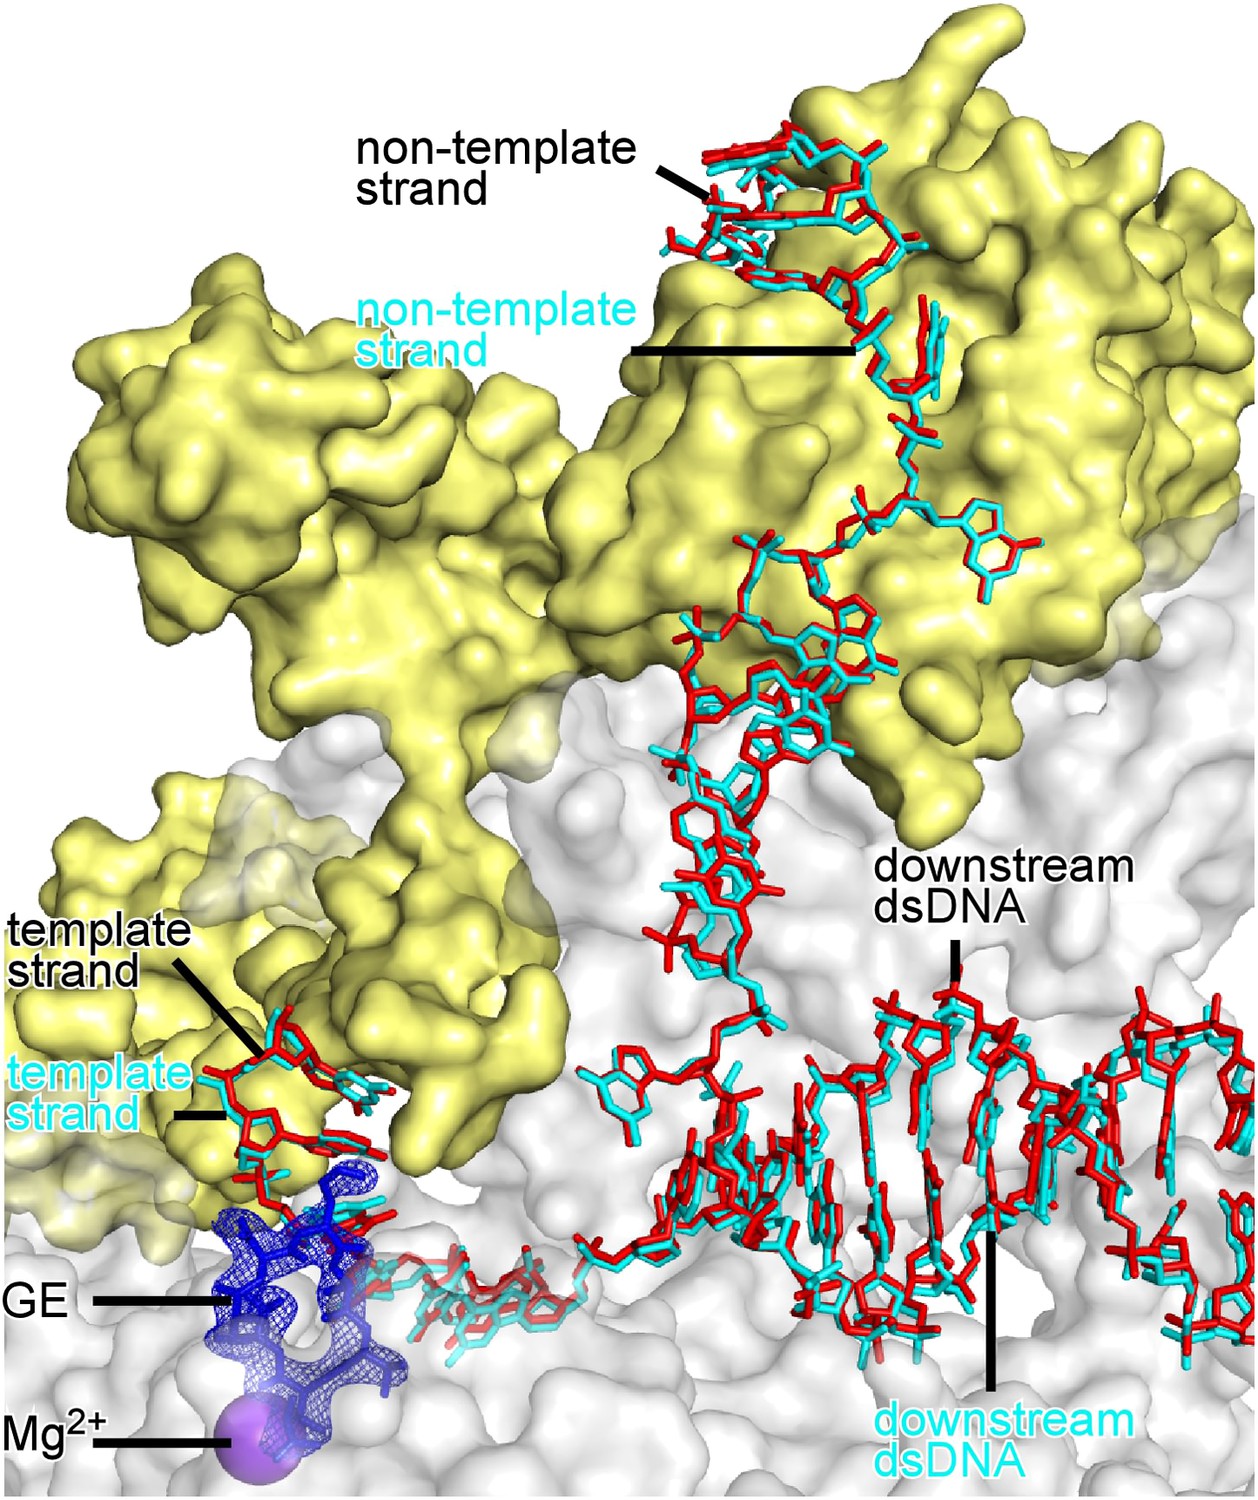
Absence of effects of DNA on GE conformation and RNAP-GE interactions.
Superimposition of crystal structures of RPo-GE (Figure 4) and RNAP-GE (Figure 3). Blue mesh, blue sticks, red sticks, gray surface, yellow surface, and violet sphere: mFo-DFc omit map for GE, atomic model for GE, DNA, RNAP, σ, and Mg2+(I) from crystal structure of RPo-GE (Figure 4). Cyan sticks, atomic model for GE from crystal structure of RNAP-GE (Figure 3).
Figure 4—figure supplement 3
Absence of effects of GE on DNA conformation and RNAP-DNA interactions.
Superimposition of crystal structures of RPo-GE (Figure 4) and RPo (Zhang et al., 2012). Blue mesh, blue sticks, red sticks, gray surface, yellow surface, and violet sphere: mFo-DFc omit map for GE, atomic model for GE, DNA, RNAP, σ, and Mg2+(I) from crystal structure of RPo-GE (Figure 4). Cyan sticks, DNA from crystal structure of RPo (Zhang et al., 2012).
Figure 5 with 1 supplement
Relationship between GE and initiating NTPs: mutually exclusive binding.
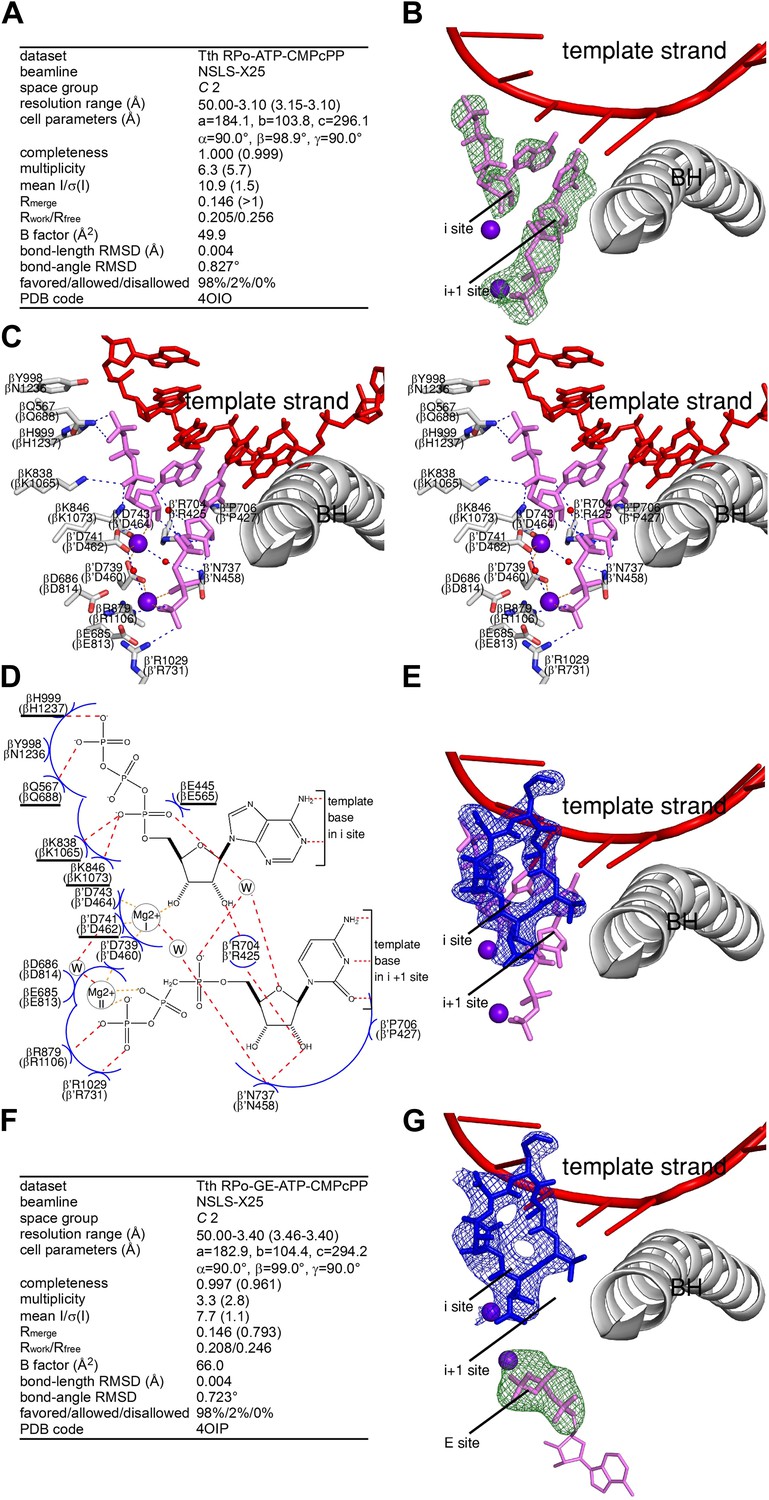
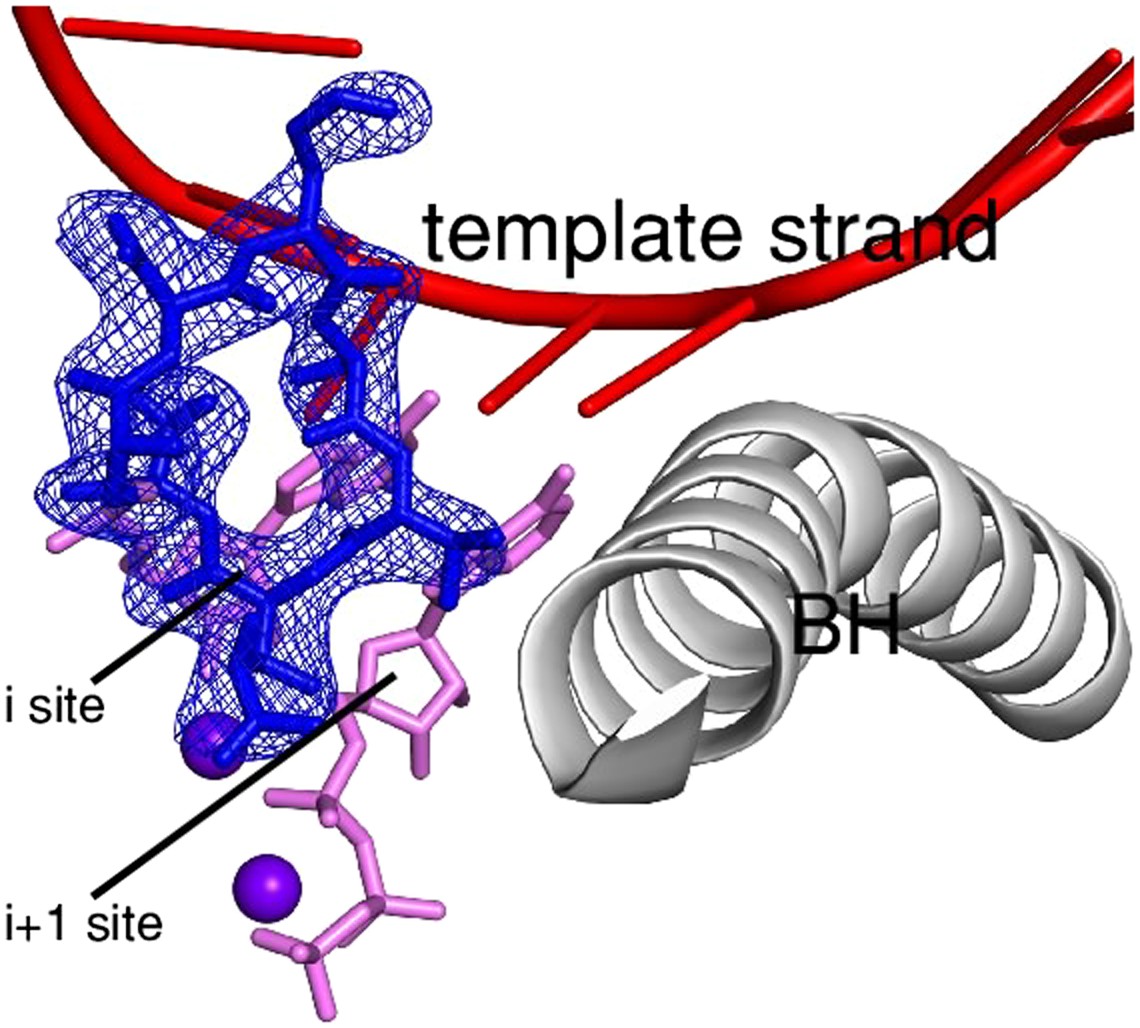
(A) Crystal structure of RPo-ATP-CMPcPP: crystallographic data and refinement statistics. (B) Crystal structure of RPo-ATP-CMPcPP: electron density and model. Green mesh, mFo-DFc omit map for ATP and CMPcPP:Mg2+(II) (contoured at 2.5σ); pink sticks, ATP and CMPcPP; red ribbon, DNA template strand; gray ribbon, RNAP bridge helix; upper and lower violet spheres, Mg2+(I) and Mg2+(II). (C) Crystal structure of RPo-ATP-CMPcPP: contacts between RNAP and initiating NTPs (stereodiagram). Gray ribbon, RNAP bridge helix; gray sticks, RNAP carbon atoms; continuous red sticks, DNA atoms; pink sticks, ATP and CMPcPP carbon atoms; individual red sticks, oxygen atoms; individual blue sticks, nitrogen atoms; red spheres, water molecules; upper and lower violet spheres, Mg2+(I) and Mg2+(II). Blue dashed lines, H-bonds; orange dashed lines, coordinate-covalent bonds. (D) Crystal structure of RPo-ATP-CMPcPP: contacts between RNAP and initiating NTPs (schematic summary). Red dashed lines, H-bonds; orange dashed lines, coordinate-covalent bonds; blue arcs, van der Waals interactions; W, water molecule; underlined residues, GE-contacting residues in RPo-GE. (E) Superimposition of crystal structures of RPo-GE and RPo-ATP-CMPcPP: inferred steric clash between GE and initiating NTPs. Blue mesh, blue sticks, red sticks, and gray ribbon: mFo-DFc omit map for GE, atomic model for GE, DNA template strand, and RNAP bridge helix from RPo-GE (Figure 4). Pink sticks and violet spheres: ATP, CMPcPP, Mg2+(I), and Mg2+(II) from RPo-ATP-CMPcPP. (F) Crystal structure of RPo-GE plus ATP and CMPcPP: crystallographic data and refinement statistics. (G) Crystal structure of RPo-GE plus ATP and CMPcPP: electron density and model. Blue mesh, mFo-DFc omit map for GE (contoured at 2.7σ); blue sticks, GE; green mesh, mFo-DFc omit map for NTP triphosphate:Mg2+(II) in RNAP E site (contoured at 2.7σ); pink sticks, NTP triphosphate; thin pink sticks, NTP sugar and base (projected); red ribbon, DNA template strand; gray ribbon, RNAP bridge helix; upper and lower violet spheres, Mg2+(I) and Mg2+(II). See Figure 5—figure supplement 1.
Figure 5—figure supplement 1
Relationship between GE and initiating NTPs.
Superimposition of crystal structures of RPo-GE, RPo-GpA, and the transcription elongation complex: predicted steric clash between GE and NTPs in i and i+1 sites. Blue mesh, blue sticks, red sticks, gray ribbon: mFo-DFc omit map for GE, atomic model for GE, DNA template strand, and RNAP bridge helix from crystal structure of RPo-GE (Figure 4). Upper pink sticks and violet sphere: RNA 3' nucleotide in i site and Mg2+(I) from crystal structure of RPo-GpA (Zhang et al., 2012). Lower pink sticks and violet sphere: NTP in i+1 site and Mg2+(II) from crystal structure of the transcription elongation complex (Vassylyev et al., 2007).
Figure 6 with 2 supplements
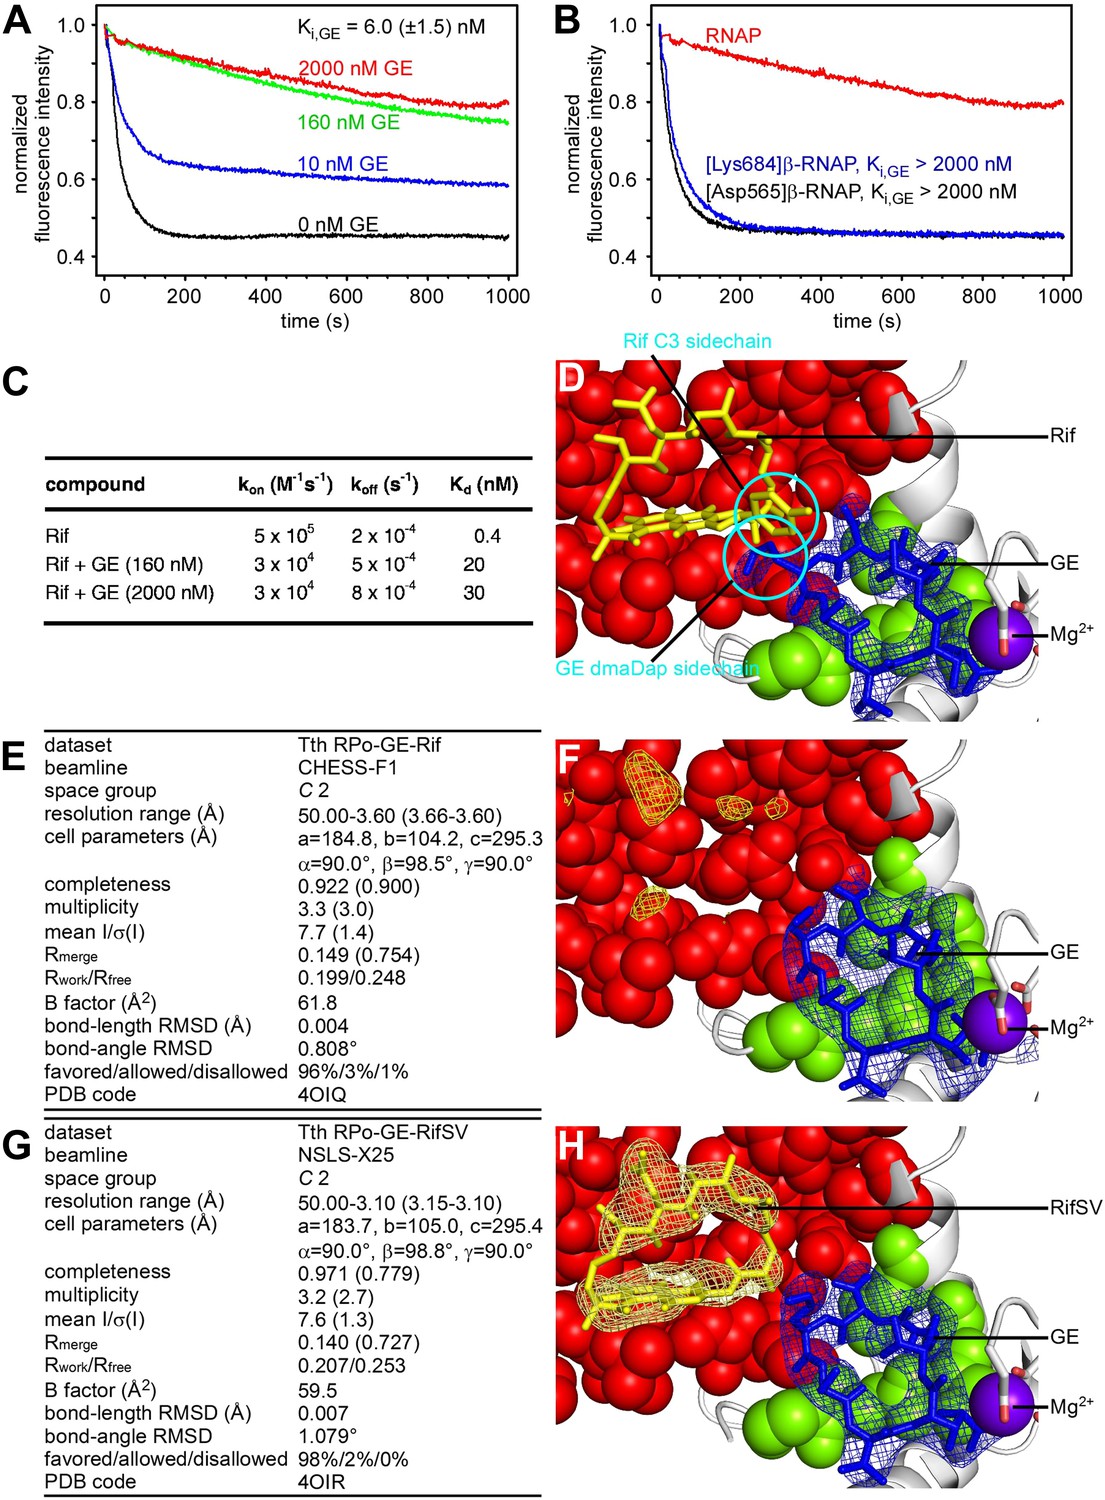
Relationship between GE and Rif: simultaneous binding.
(A) Partial-competitive binding of GE and Rif: association kinetics for Rif in presence of 0–2000 nM GE. (B) Partial-competitive binding of GE and Rif: association kinetics for Rif in presence of 2000 nM GE, using wild-type RNAP (red) and GE-resistant RNAP derivatives [Asp565]β-RNAP (black) and [Lys684]β-RNAP (blue). (C) Partial-competitive binding of GE and Rif: kon, koff, and Kd for Rif in absence of GE and in presence of saturating GE (160 nM or 2000 nM; ∼30 × Ki or ∼300 × Ki). (D) Superimposition of crystal structures of RPo-GE and RNAP-Rif: inferred simultaneous binding. Blue mesh, blue sticks, gray ribbon, and violet sphere: mFo-DFc omit map for GE, atomic model for GE, RNAP, and Mg2+(I) from RPo-GE (Figure 4). Yellow sticks: Rif from RNAP-Rif (PDB: 1YNN). Green surfaces, GE target residues at which substitutions confer GE-resistance; red surfaces, residues at which substitutions confer Rif-resistance. (E) Crystal structure of RPo-GE plus Rif: crystallographic data and refinement statistics. (F) Crystal structure of RPo-GE plus Rif: electron density and model. Yellow mesh, patchy electron density potentially attributable to Rif (mFo-DFc omit map; contoured at 2.7σ). Other colors as in D. (G) Crystal structure of RPo-GE-RifSV: crystallographic data and refinement statistics. (H) Crystal structure of RPo-GE-RifSV: electron density and model. Yellow mesh, mFo-Fc omit map for RifSV (contoured at 2.7σ); yellow sticks, RifSV. Other colors as in D. See Figure 6—figure supplements 1, 2.
Figure 6—figure supplement 1
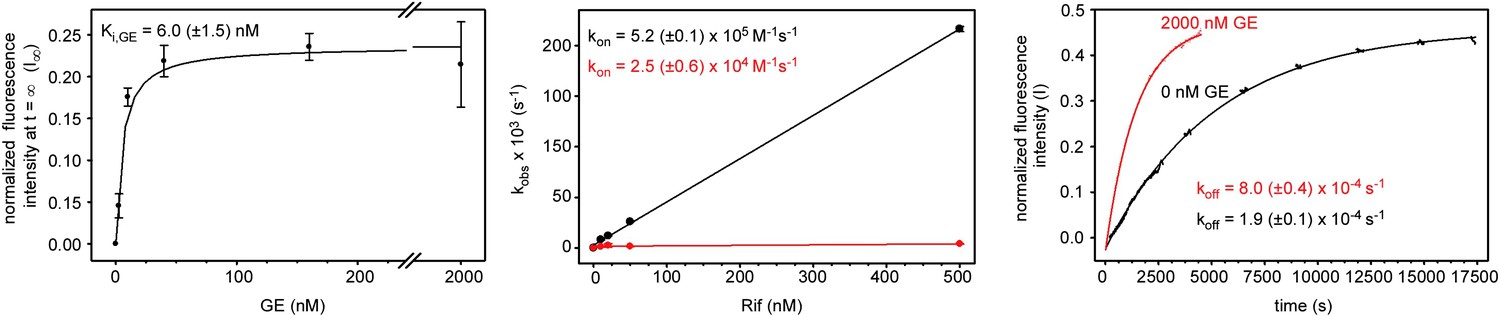
Relationship between GE and Rif: effects of GE on RNAP-Rif interaction.
Left panel, association kinetics: I∞ for RNAP-Rif interaction in the presence of 0, 2.5, 10, 40, 160, or 2000 nM GE. Center panel, association kinetics: kobs for RNAP-Rif interaction in the presence of 0 or 2000 nM GE. Right panel, dissociation kinetics: I for RNAP-Rif interaction in the presence of 0 or 2000 nM GE.
Figure 6—figure supplement 2
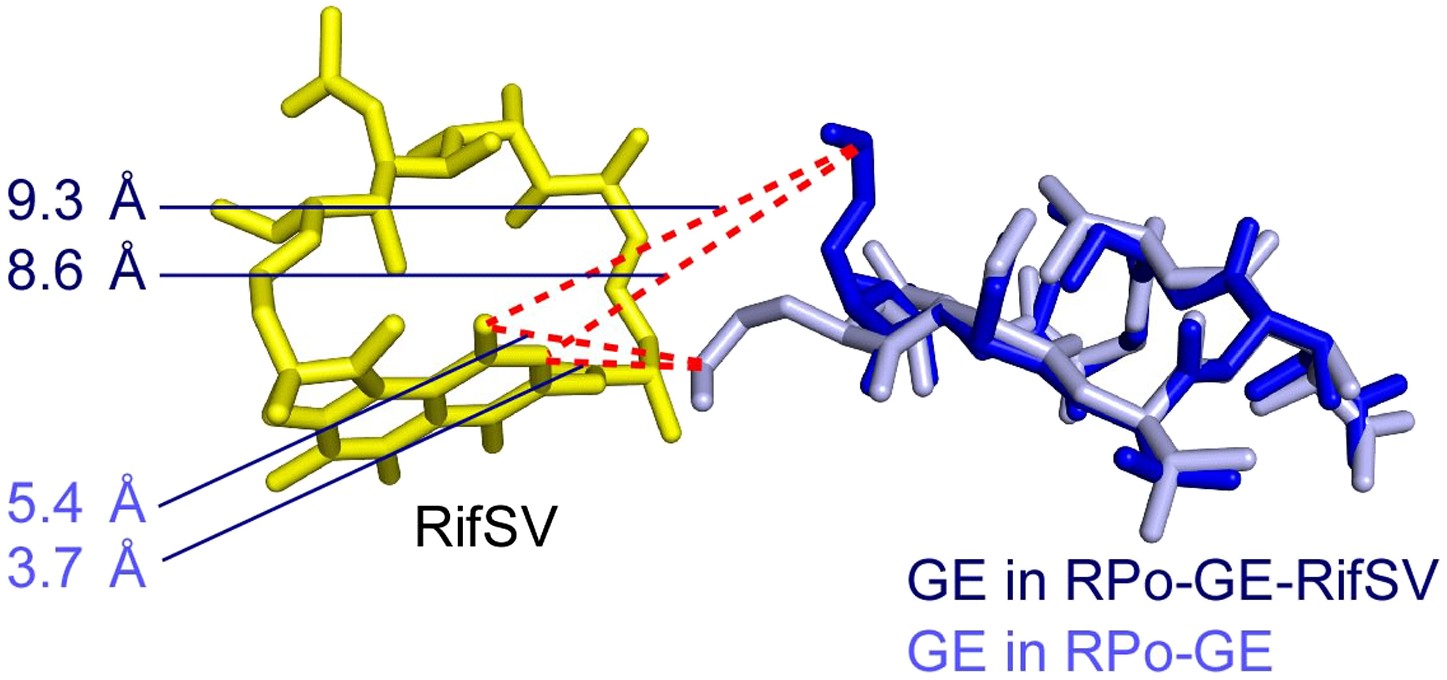
Relationship between GE and Rif: superimposition of crystal structures of RPo-GE and RPo-GE-RifSV showing differences in conformations of GE dmaDap residue.
Blue sticks, yellow sticks, and blue numbers: GE, RifSV, and distances between GE dmaDap sidechain carbonyl carbon and RifSV C3 and O4 atoms, in RPo-GE-RifSV. Gray sticks and gray numbers: GE in RPo-GE and corresponding distances calculated for the GE conformation in RPo-GE.
Figure 7
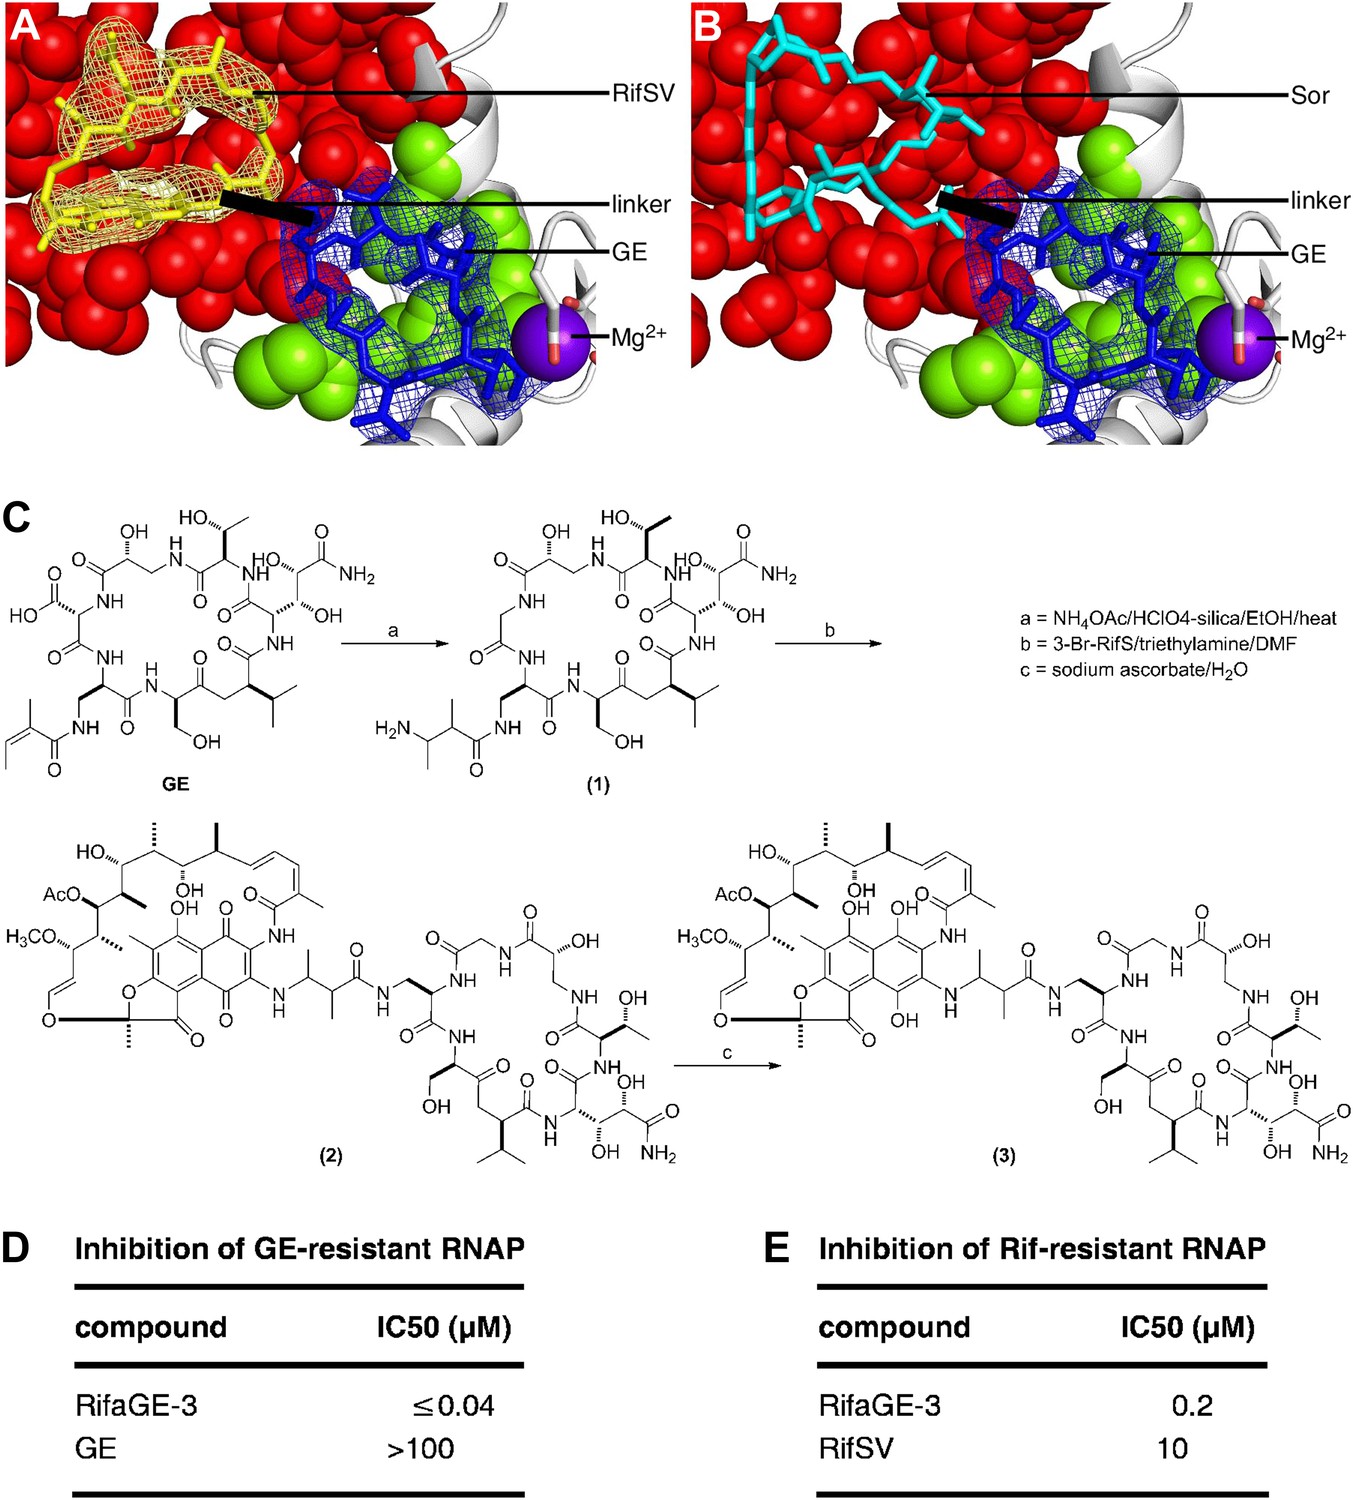
Bipartite inhibitors: GE-rifamycin and GE-sorangicin.
(A) Proposed bipartite inhibitor having GE dmaDap sidechain linked to RifSV C3 or O4 atom. Crystal structure of RPo-GE-RifSV. Black line, linker. Other colors as in Figure 6H. (B) Proposed bipartite inhibitor having GE dmaDap sidechain linked to Sor sidechain carboxyl. Superimposition of crystal structures of RPo-GE and RNAP-Sor (PDB: 1YNJ). Cyan, Sor; red, residues at which substitutions confer Sor-resistance. Other colors as in A. (C) Synthesis of bipartite inhibitor having GE dmaDap sidechain linked to RifSV C3 atom (RifaGE-3). (D) Inhibition of GE-resistant RNAP ([Asp565]β-RNAP) by RifaGE-3. (E) Inhibition of Rif-resistant RNAP ([Asn516]β-RNAP) by RifaGE-3.
Additional files
-
Supplementary file 1
(A) GE: antibacterial activity. (B) GE: RNAP-inhibitory activity.
- https://doi.org/10.7554/eLife.02450.021
-
Supplementary file 2
(A) ‘Doped’ oligonucleotide primers used for saturation mutagenesis. (B) Chromosomal GER mutants in E. coli D21f2tolC: sequences and properties. (C) Chromosomal GER mutants in S. pyogenes: sequences and properties. (D) Chromosomal GER mutants in E. coli D21f2tolC: absence of cross-resistance to Rif. (E) Chromosomal RifR mutants in E. coli D21f2tolC: absence of cross-resistance to GE. (F) GER mutants from saturation mutagenesis: absence of cross-resistance to Sor, Stl, CBR703, Myx, and Lpm.
- https://doi.org/10.7554/eLife.02450.022
Download links
A two-part list of links to download the article, or parts of the article, in various formats.
Downloads (link to download the article as PDF)
Open citations (links to open the citations from this article in various online reference manager services)
Cite this article (links to download the citations from this article in formats compatible with various reference manager tools)
GE23077 binds to the RNA polymerase ‘i’ and ‘i+1’ sites and prevents the binding of initiating nucleotides
eLife 3:e02450.
https://doi.org/10.7554/eLife.02450


