Interactions with RNA direct the Polycomb group protein SCML2 to chromatin where it represses target genes
- Howard Hughes Medical Institute, New York University School of Medicine, United States
- Yale University School of Medicine, United States
Figures
Figure 1
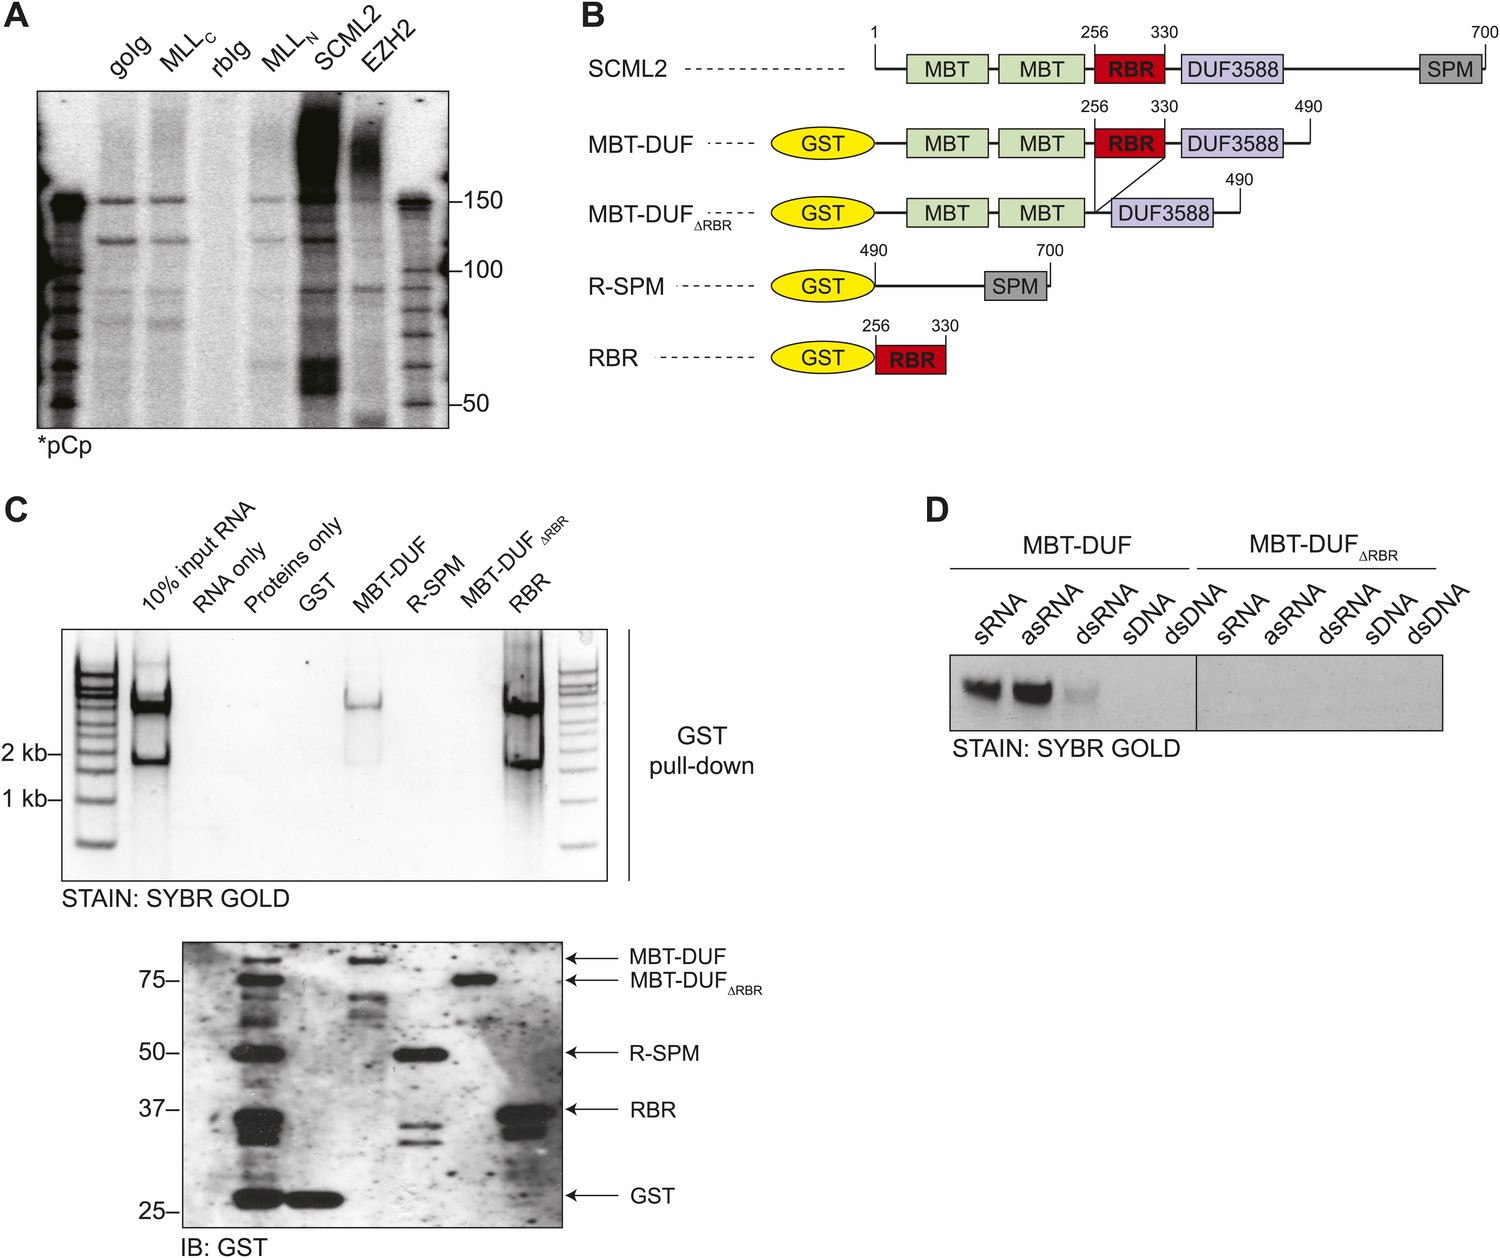
Identification of the RNA-binding region of SCML2.
(A) Endogenous RIP from HeLaS3 nuclear extract for the indicated chromatin proteins or with goat (goIg) and rabbit (rbIg) control antibodies. Co-precipitating RNA was labeled in 3′ and resolved by denaturing PAGE. (B) Domain organization of SCML2 and scheme of the GST-fused truncations. (C) In vitro pull-down of total RNA with the indicated SCML2 fragments. RNA fraction (top) and protein fraction (bottom) are shown. (D) The indicated sense RNA (sRNA) and antisense RNA (asRNA) were transcribed in vitro from a synthetic random 100 nts DNA template, PAGE-purified and annealed to form double-stranded RNA (dsRNA). The sense DNA oligonucleotide (sDNA) and the double-stranded DNA template (dsDNA) were used as controls.
Figure 2 with 2 supplements
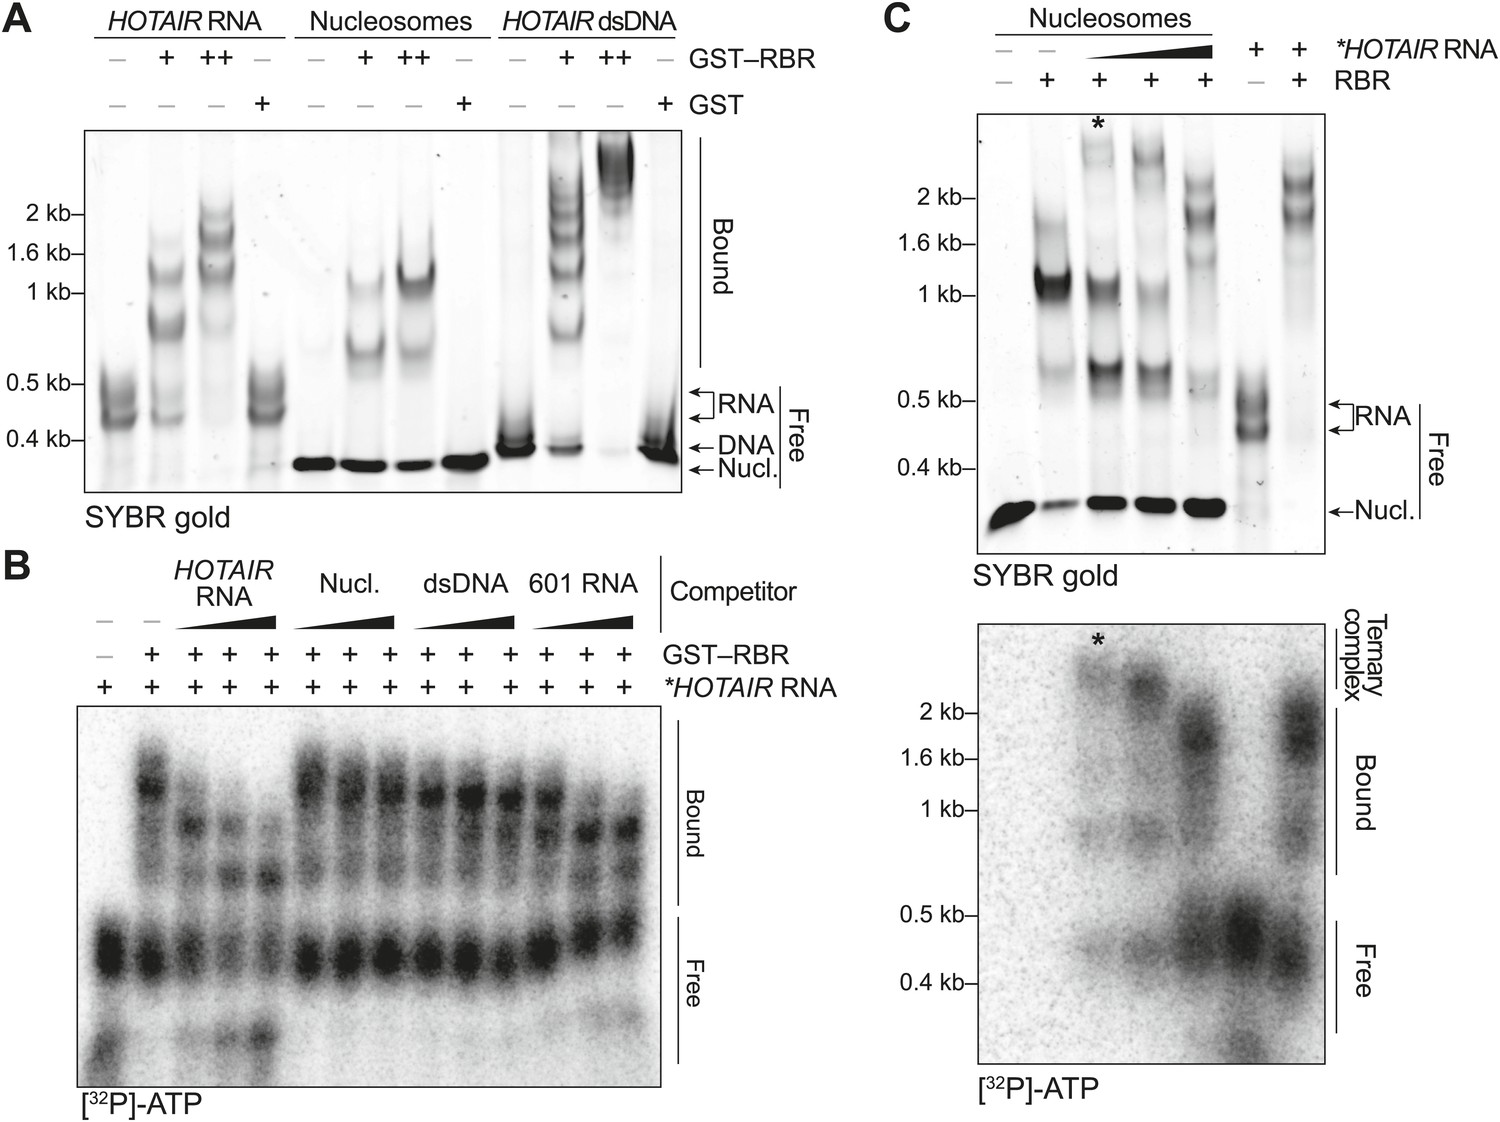
In vitro characterization of the binding preferences of the SCML2 RBR.
(A) EMSA with 2 (+) and 4 (++) pmol GST-fused RBR and 520 fmol HOTAIR RNA 1–300, 690 fmol nucleosomes, or 275 fmol dsDNA encoding HOTAIR1–300. 5.2 pmol GST were used as a control. Complexes were separated on native gels and detected with SYBR gold stain. Data are representative of ≥4 experiments. (B) EMSA with 3.4 pmol GST–RBR and 520 fmol of labeled HOTAIR RNA was performed as in (A) with the addition of, from left to right, 260, 520, and 1040 fmol of unlabeled HOTAIR RNA, nucleosome particles, dsDNA, and 601 RNA. Bands were visualized by autoradiography. Data are representative of ≥4 experiments. (C) EMSA of RBR with nucleosomes and labeled HOTAIR RNA. Assay was performed as in (B) varying the amount of labeled RNA. Nucleic acid stain (top) and autoradiography (bottom) are shown. The asterisk indicates the putative ternary complex.
Figure 2—figure supplement 1

Additional EMSAs.
(A) Assay performed as in Figure 2A but using the MBT–DUF fragment of SCML2. Data shown is representative of ≥4 experiments. (B) Assay performed as in Figure 2B but using the MBT–DUF fragment of SCML2. Data shown is representative of ≥4 experiments.
Figure 2—figure supplement 2
Ternary complex EMSAs and pull-downs.
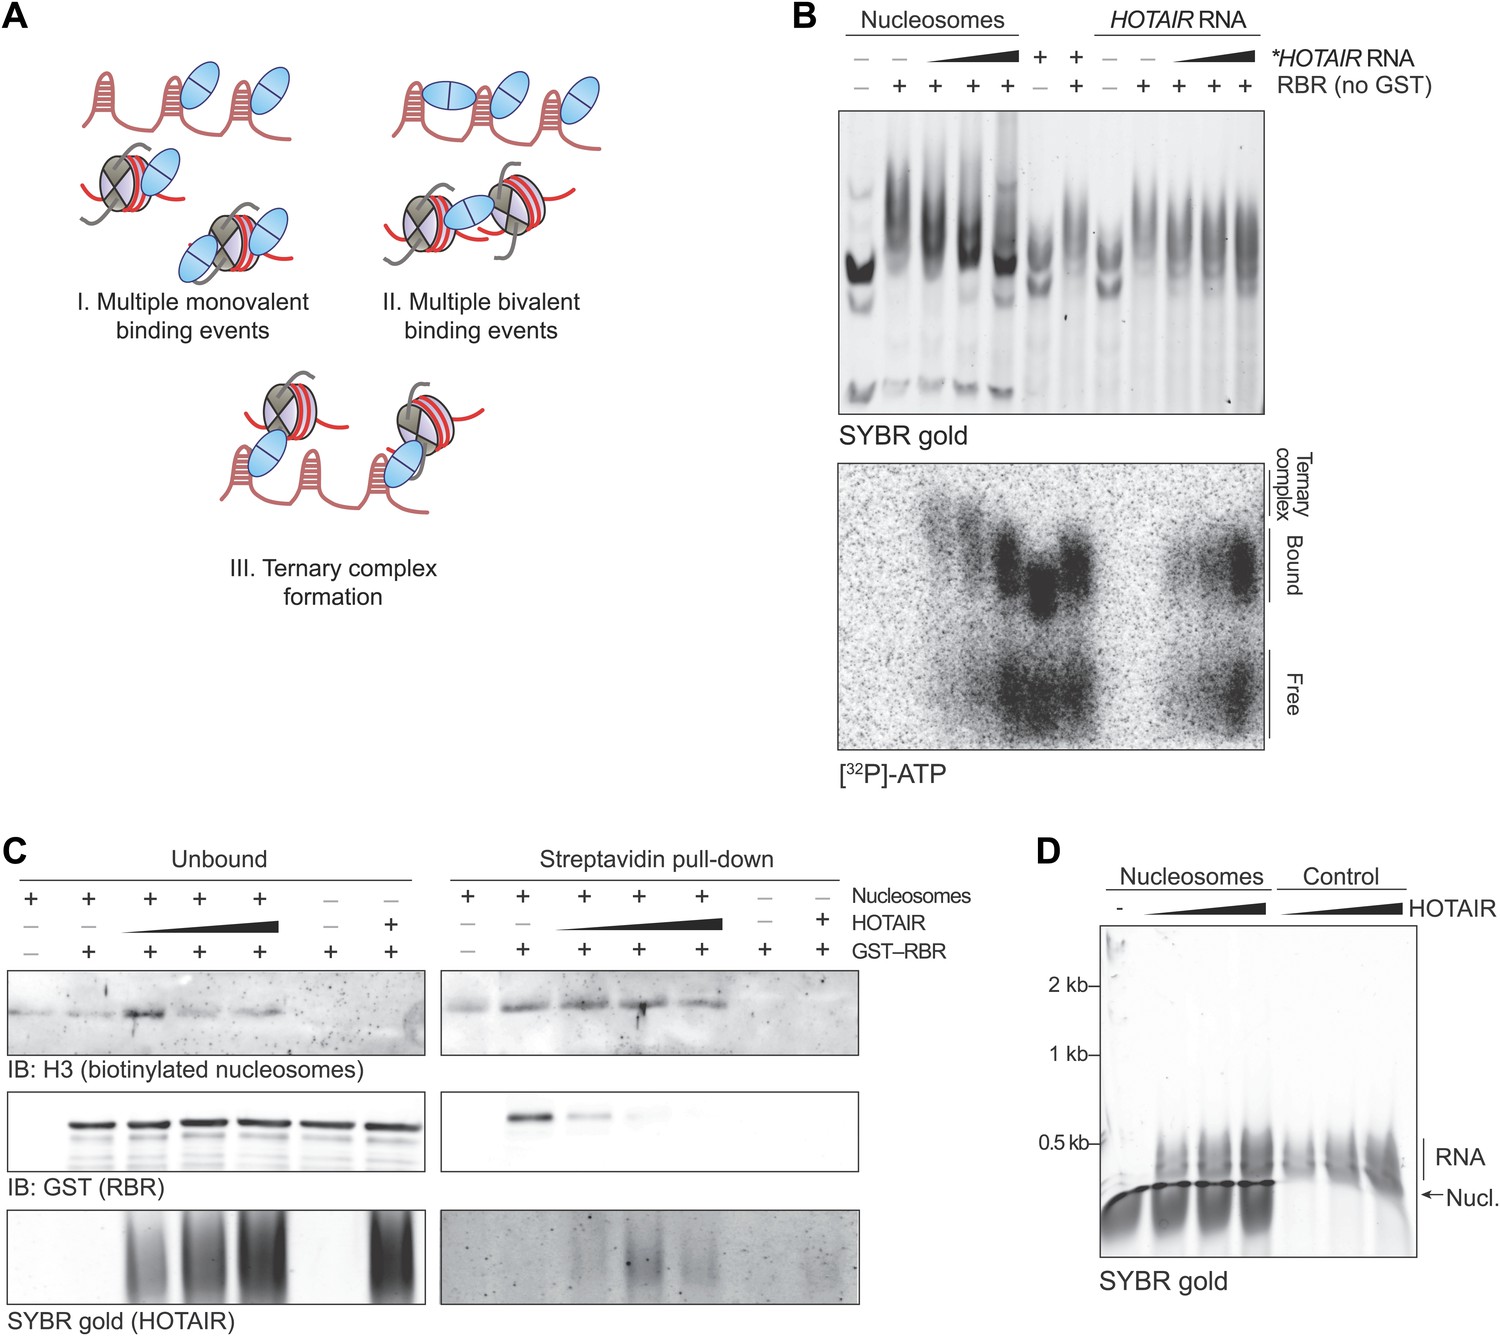
(A) Models for the interpretation of EMSA results shown here and in Figure 2. (I) The multiple shifted bands can be explained by multiple copies of SCML2 fragments binding to a single RNA molecule or nucleosome. (II) Alternatively, multiple copies of SCML2 can establish bi- or poly-valent interactions with the nucleic acids. (III) Finally, results shown in Figure 2 support the possibility that a monomer of RBR establishes multiple simultaneous contacts with the RNA and nucleosomes. (B) Assay performed as in Figure 2C but this time after removing the GST moiety from the RBR fragment to exclude the possibility of GST-induced dimerization. (C) Biotinylated nucleosomes were incubated with GST–RBR and various amounts of HOTAIR RNA and pulled-down with streptavidin. Western blots for histone H3 (top), GST–RBR (middle), and SYBR stain for HOTAIR (bottom) are shown. Data are representative of two experiments. (D) EMSA with 690 fmol nucleosomes and HOTAIR RNA 1–300 (260, 520, 1040 fmol). Complexes were separated on native gels and detected with SYBR gold stain.
Figure 3 with 1 supplement
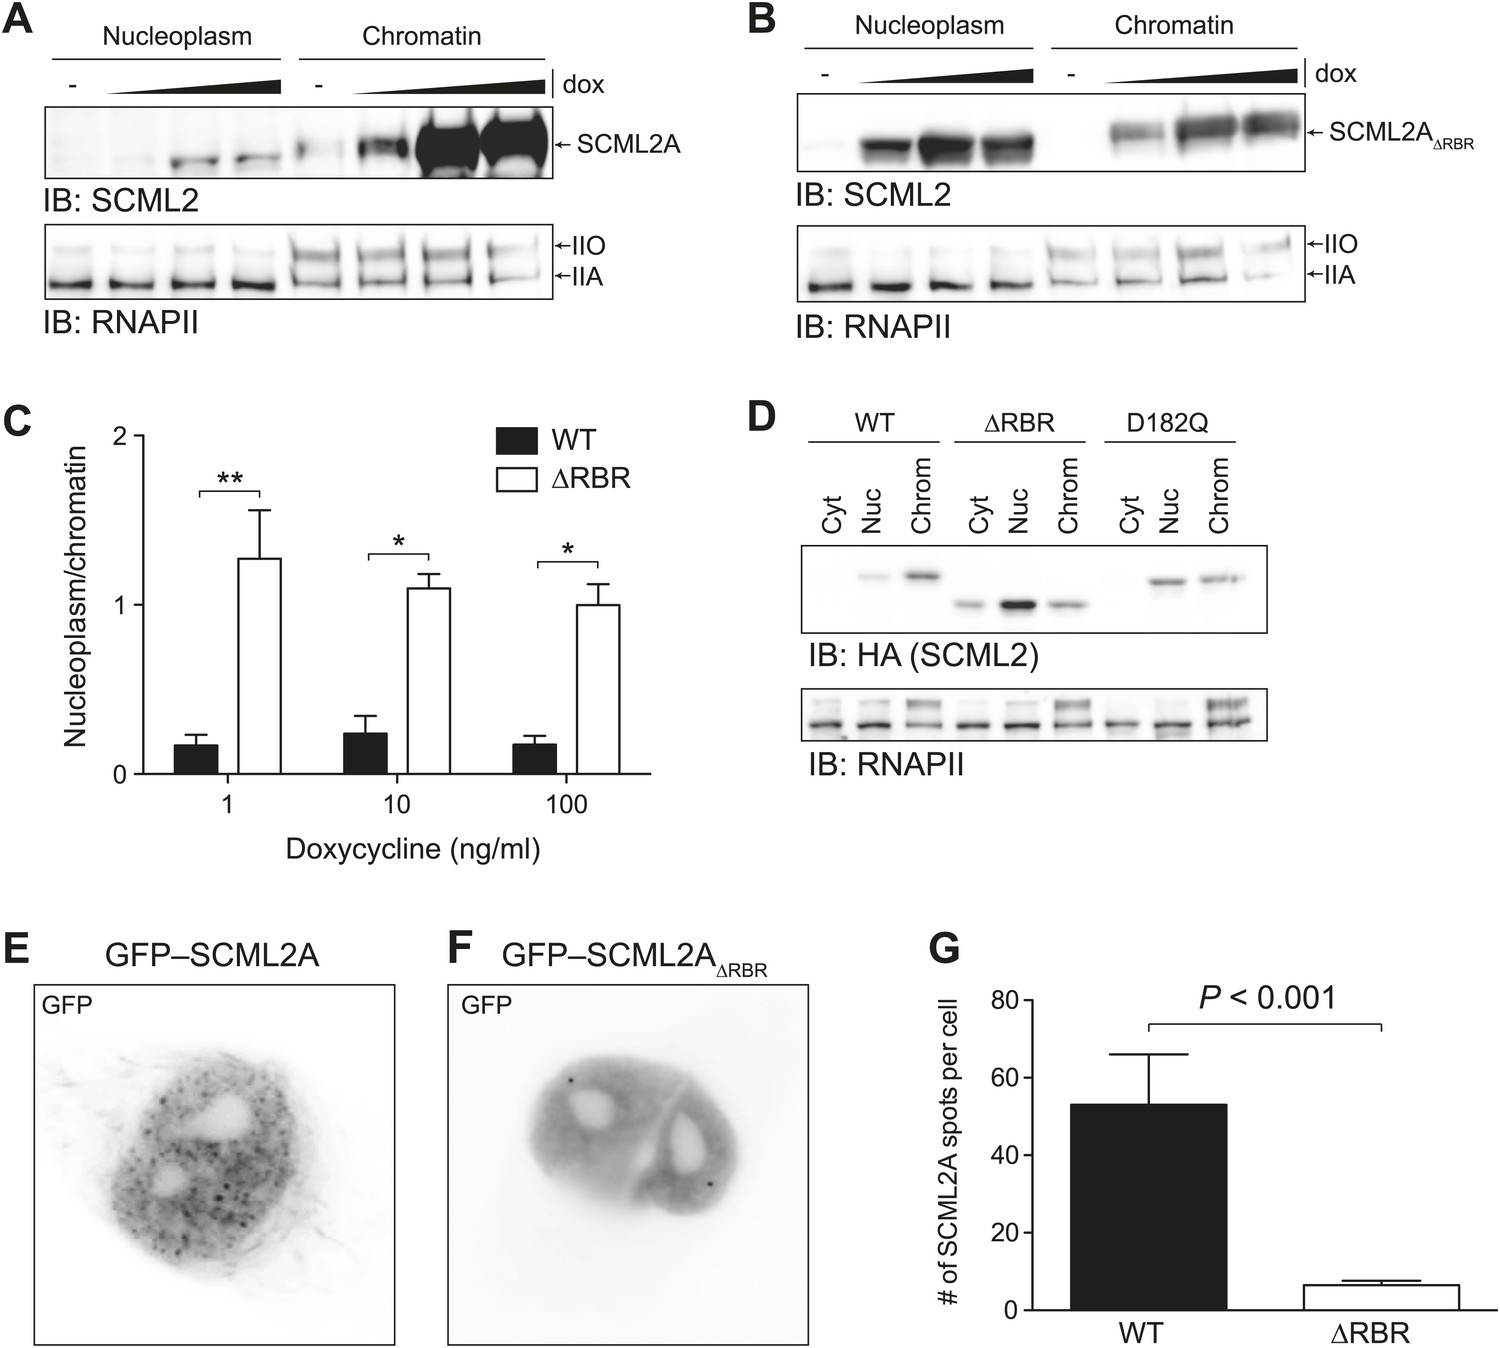
Loss of the RBR alters the subnuclear distribution of SCML2A.
(A and B) Salt fractionation of 293T-REx induced to express SCML2A WT (A) and ΔRBR (B) with increasing amounts of doxycycline (dox). The distribution of RNAPIIA and RNAPIIO are shown as fractionation and loading control. (C) Densitometry-based quantification of the ratio of nucleoplasmic vs chromatin-associated SCML2A WT (black bars) and ΔRBR (white bars). Bars show mean measurements from two independent clones at increasing levels of inductions. p-values were calculated with 2-way ANOVA. (D) Salt fractionation of 293T-REx induced to express SCML2A WT, ΔRBR, and the MBT-domain mutant D182Q. (E and F) Fluorescence microscopy of HeLa cells transiently transfected with vectors encoding GFP-SCML2AWT (E) or GFP-SCML2AΔRBR (F). (G) Quantification of SCML2 spots in multiple cells transfected as in (E) and (F). Bars represent mean + SEM. N = 11 for SCML2A; N = 17 for SCML2AΔRBR. p-value was calculated with an unpaired t test.
Figure 3—figure supplement 1

Nuclear distribution of SCML2AD182A and SCML2B.
(A) Domain organization of SCML2A and SCML2B. (B) Salt fractionation experiment as in Figure 3D but using a different mutation (ala instead than gln) in the MBT domain. (C and D) Salt fractionation of 293T-REx induced to express SCML2B WT (A) and ΔRBR (B) with increasing amounts of doxycycline (dox). The distribution of RNAPIIA and RNAPIIO are shown as fractionation and loading control. (E) Densitometry-based quantification of the ratio of nucleoplasmic vs chromatin-associated SCML2B WT (black bars) and ΔRBR (white bars). Bars show mean measurements from two independent clones at increasing levels of inductions. (F and G) Fluorescence microscopy of HeLa cells transiently transfected with vectors encoding GFP-SCML2B (F) or GFP-SCML2BΔRBR (G). (H) Immunofluorescence microscopy of endogenous SCML2 in HeLa cells using affinity-purified SCML2 antibody.
Figure 4 with 1 supplement
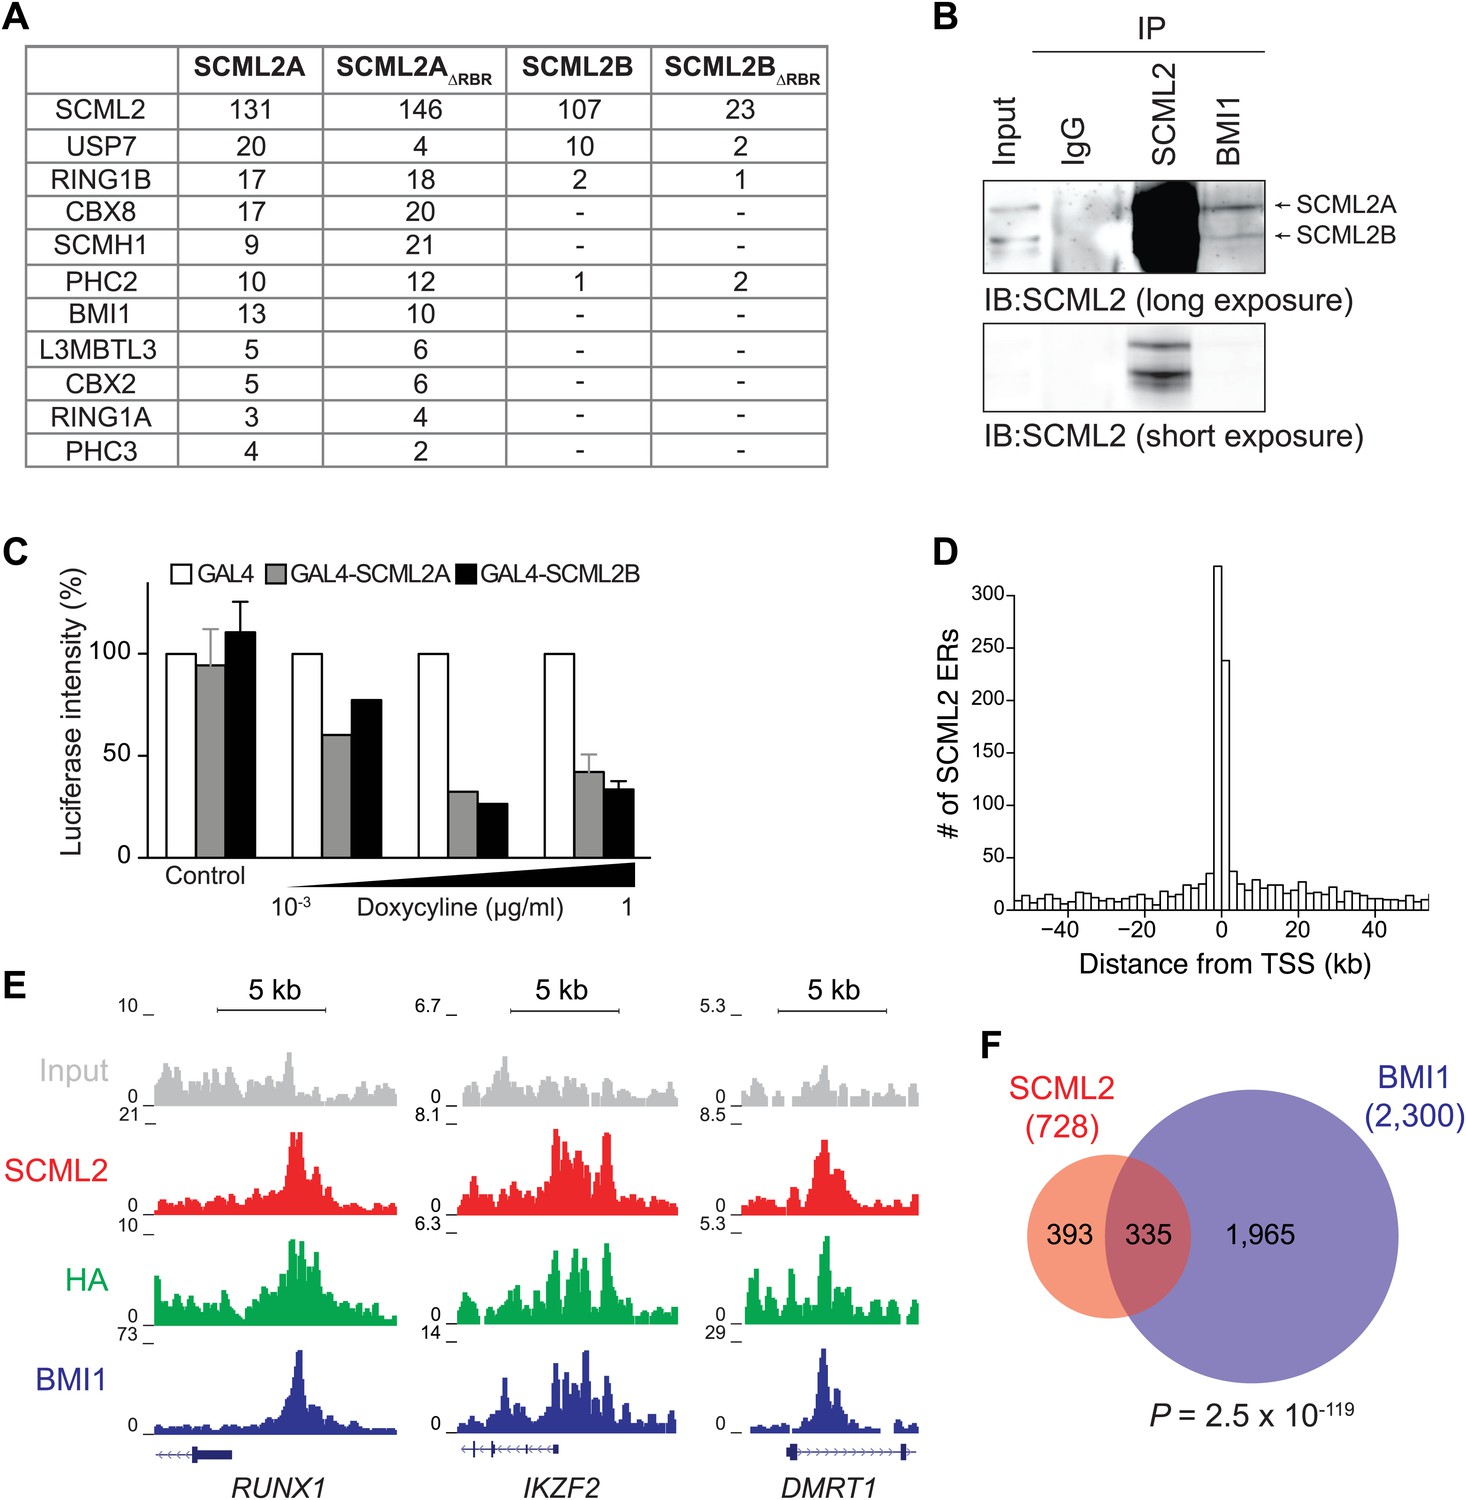
SCML2 interacts and shares target genes with BMI1.
(A) Proteins detected by mass spectrometry after affinity purification of SCML2A, SCML2AΔRBR, SCML2B and SCML2BΔRBR from the chromatin fraction of 293T-REx cells. The number of peptides identified for each protein is indicated. (B) IP of SCML2 and BMI1 from the chromatin fraction of HeLa cells. Two exposures are shown. (C) 293T-REx cells containing an integrated luciferase reporter preceded by UAS repeats were induced to express the indicated transgenes with increasing amounts of doxycycline. 24 hr after induction the activity of the luciferase reporter was assayed. Bars represent the luciferase activity normalized to the non-induced GAL4-only control. (D) Distribution of SCML2 ERs around TSSs of protein coding genes. (E) Normalized ChIP-seq read densities for SCML2 (red), HA (green), and BMI1 (blue) as compared to input (gray) at three representative loci. (F) Overlap of gene targets for SCML2 and BMI1, as defined by having an ER for the respective protein within 10 kb of the TSS. p-value was calculated according to the hypergeometric distribution.
Figure 4—figure supplement 1

Artificial recruitment of SCML2 and ChIP-seq analysis.
(A and B) ChIP-qPCR quantification of SCML2 (A) and BMI1 (B) association with a reporter locus in 293T-REx cells after artificial tethering of SCML2A or SCML2B. ChIP from cells with the tethering tag alone (GAL4) is shown as control. (C) Top 10 most enriched GO terms in the 728 genes with SCML2 ERs within 10 kb from the TSS in 293T-REx cells. (D) Overlap of gene targets for SCML2 and BMI1 as in Figure 4F but only considering ERs with p-value <10−15. (E) Overlap of gene targets for SCML2 and BMI1 (y axis) as a function of the ER p-value (x axis). The control line was obtained by shuffling the p-values assigned to the ERs. (F) Top 10 most enriched GO terms in genes with SCML2 ERs within 10 kb from the TSS in K562 cells. (G) Overlap of gene targets for SCML2 and BMI1 in K562 cells, as defined by having an ER for the respective protein within 10 kb of the TSS. p-value was calculated according to the hypergeometric distribution.
Figure 5 with 1 supplement
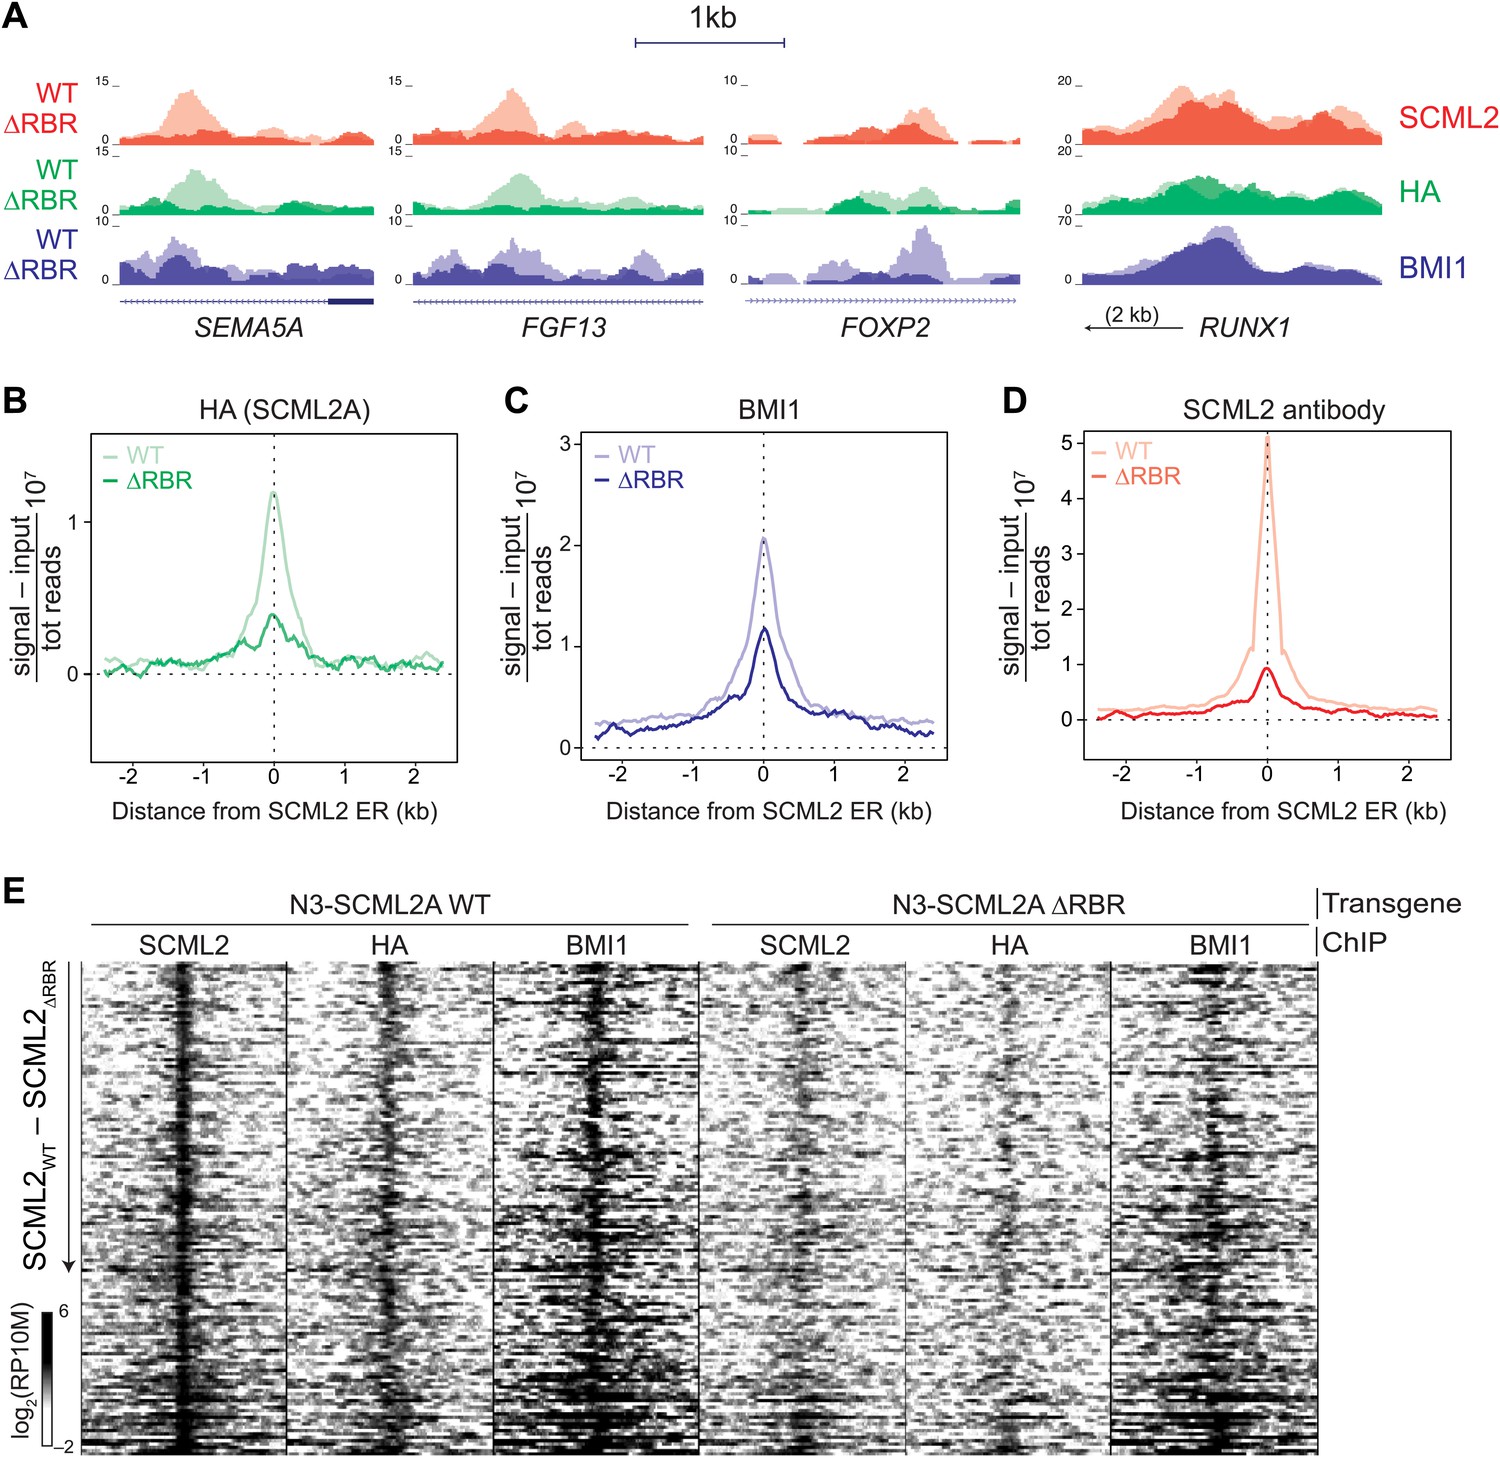
The role of the RBR in the localization of SCML2A and PRC1 to target genes.
(A) Normalized read density profiles for SCML2 (red), HA (green), and BMI1 (blue) in cells expressing N3-SCML2A WT (light colors) or ΔRBR (dark colors). Three RBR-dependent and one RBR-independent sites are shown. (B–D) Normalized ChIP-seq enrichment (signal reads–input reads) for HA (B), BMI1 (C), and SCML2 (D), centered around 2479 SCML2 ERs in 293T-REx::N3-SCML2A. (E) Heatmap of read densities for the indicated ChIP-seq samples centered on 148 overlapping ERs for SCML2, HA, and BMI1 in the WT sample. Each row represents a genomic region spanning ±2.5 kb from the center of the ER. For each sample the log-converted normalized read density was calculated in 25 bp bins and is represented by color intensity. Regions were sorted by difference in SCML2 read densities in WT vs ΔRBR transgenic lines.
Figure 5—figure supplement 1
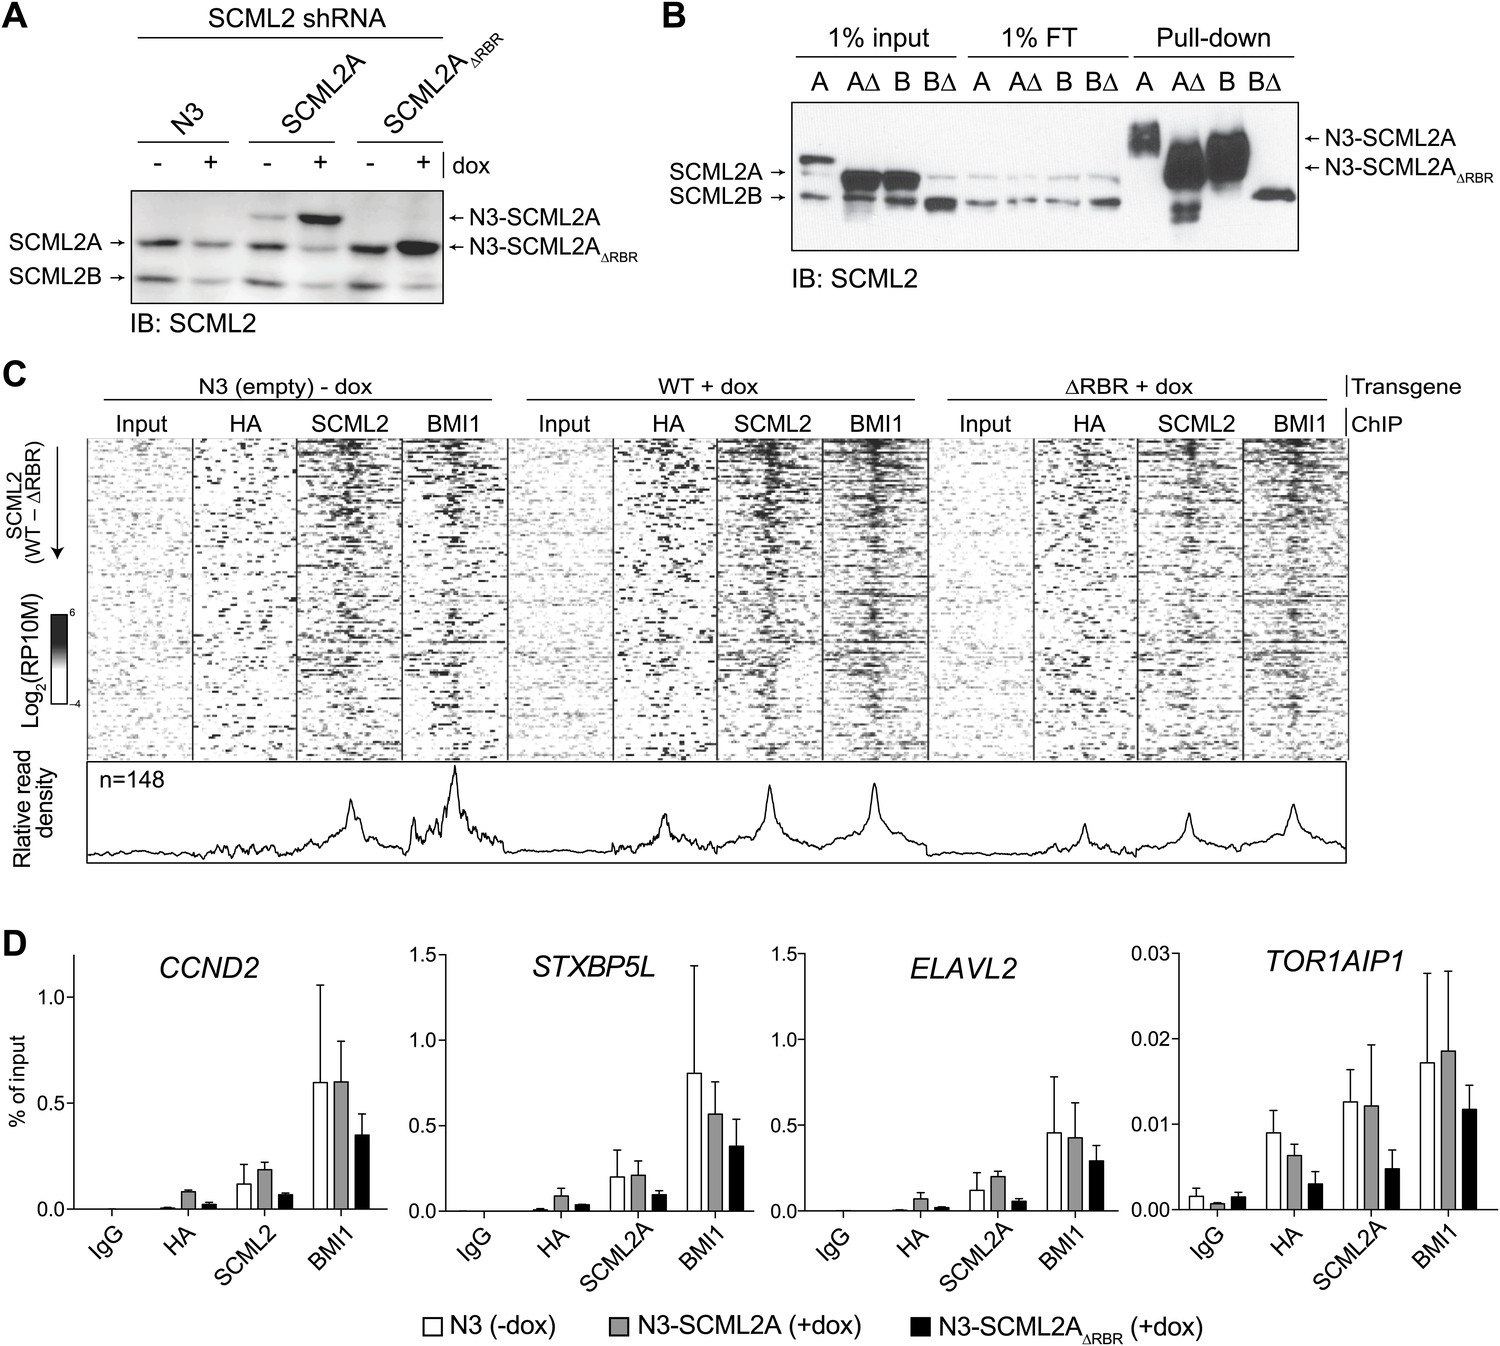
Validation and replication of ChIP-seq for SCML2 WT and ΔRBR.
(A) Western blot of total cellular extract from 293T-REx carrying a stable integration of an inducible shRNA for the 3′ UTR of the endogenous SCML2, and inducible N3-tagged transgenes for SCML2A WT and ΔRBR, or empty vector as control (N3). Cell were harvested before (−) or after (+) 48 hr induction of shRNA and transgene expression with 1 µg/ml of doxycycline (dox). (B) Input, flow-through (FT) and pull-down of epitope-tagged SCML2A (A), SCML2AΔRBR (AΔ), SCML2B (B), SCML2BΔRBR (BΔ). (C) Heatmap of read densities for the indicated ChIP-seq samples centered on 148 overlapping ERs for SCML2, HA, and BMI1 in the WT sample, as in Figure 5E. The bottom panel shows the profile obtained by collapsing the rows of the heatmap. Data are averaged from two biological replicates performed in addition to the experiment shown in Figure 5E. ChIP-seq from a control line carrying the empty vector and not treated with doxycycline is shown (N3-dox). (D) ChIP-qPCR with the indicated antibodies for four representative loci with SCML2 and BMI1 occupancy. Bars represent the mean of two biological replicates, each measured in two technical replicates, + SEM.
Figure 6 with 1 supplement

RIP-seq for SCML2 in 293T-REx and K562 cells.
(A and B) HA IP from 293T-REx expressing the empty tag alone (N3), N3–SCML2A WT (WT) or N3–SCML2AΔRBR (Δ). After washing, the bound fraction was divided into two parts; one was analyzed by western blot (A) and one by denaturing RNA electrophoresis (B). (C) Principal component analysis of the lincRNA abundances for the four samples. (D) RIP enrichment heatmap for 668 lincRNAs in K562 stimulated to differentiate with hemin or PMA. Colors indicate log2 enrichment in SCML2 RIP-seq compared to the respective inputs. A set of lincRNAs specifically associated with SCML2 in PMA-treated K562 cells is indicated. (E) ChIP and RIP profiles at the CHD3 promoter. Normalized read densities are shown for input chromatin (gray), BMI1 ChIP (blue), SCML2 ChIP (red), input RNA (dark gray), and SCML2 RIP (light gray). For simplicity, only the (−) strand of the RNA is shown (antisense to the CHD3 transcript).
Figure 6—figure supplement 1

Examples of SCML2-associated RNAs.
(A) As in Figure 6D but plotting the enrichment values for 12,124 protein-coding mRNAs with at least one mapped read in each sample. (B–E) ChIP and RIP profiles in K562 cells. Four representative promoters were chosen for their enrichment in ncRNAs bound to SCML2 and for SCML2 occupancy on chromatin. ChIP-seq tracks for input (gray), BMI1 (blue), and SCML2 (red) are shown, as well as RIP-seq tracks for normalized reads in the input (dark gray) and SCML2 RIP (light gray) fraction. The strandedness of the RNA is also depicted: signal above the RIP-seq midline indicates reads mapping to the plus (+) strand, signal below the RIP-seq midline represents the minus (−) strand. Examples of SCML2-bound antisense ncRNAs (B–D) and TSS-associated sense ncRNAs (E) are shown.
Figure 7 with 1 supplement
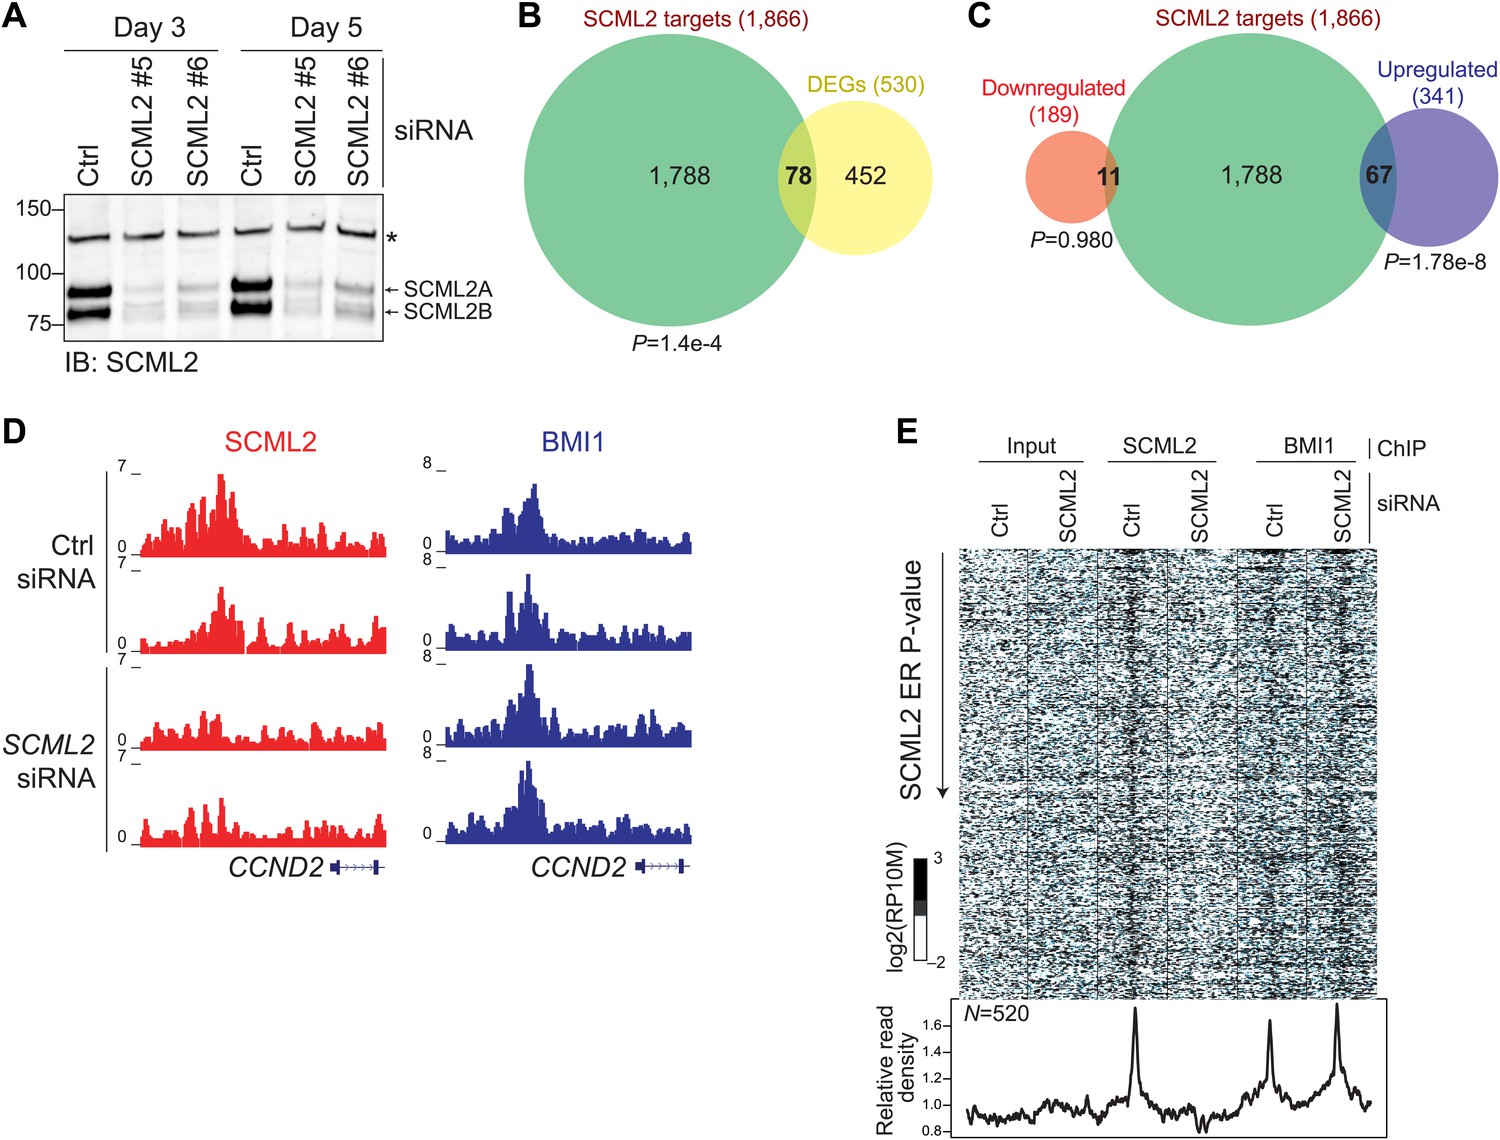
Functional consequences of SCML2 depletion.
(A) Western blot for SCML2 in 293T-REx treated for 3 or 5 days with control siRNAs (Ctrl) or two different siRNAs against SCML2 (#5 and #6). The band marked with an asterisk corresponds to a cross-reacting protein and serves as loading control. (B) Overlap of all DEGs with p<0.2 and genes closest to an SCML2 ER. (C) Same as (B) but DEGs were divided in downregulated and upregulated. (D) Normalized ChIP-seq read densities for SCML2 (red) and BMI1 (blue) in two biological replicates after treating 293T-REx with control (Ctrl) or SCML2 siRNAs. (E) Heatmap for all SCML2 ERs showing decreased occupancy (log2 (SCML2ctrl/SCML2KD) > 0.5) after SCML2 KD (n = 520). Profiles for input chromatin, SCML2 and BMI1 ChIP-seq are shown. Read densities were normalized and log-converted. Windows span 2.5 kb on each side of the ER summit and were divided into 25 bp bins.
Figure 7—figure supplement 1
Additional RNA-seq analyses.
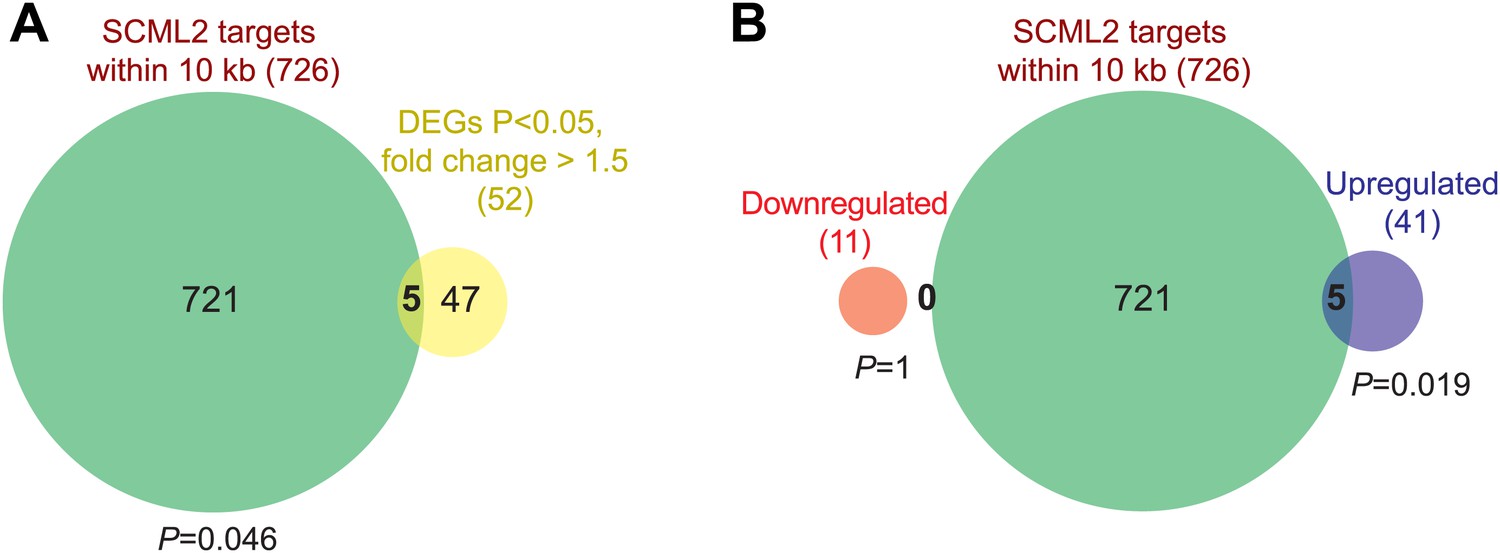
(A) Overlap of all DEGs with p<0.05 and fold-change >1.5 and genes closest to an SCML2 ER. p-values are from the hypergeometric distribution. (B) Same as (A) but DEGs were divided in downregulated and upregulated. p-values are from the hypergeometric distribution.
Author response image 1
Enrichment of SCML2-bound RNAs at SCML2 ERs on chromatin.
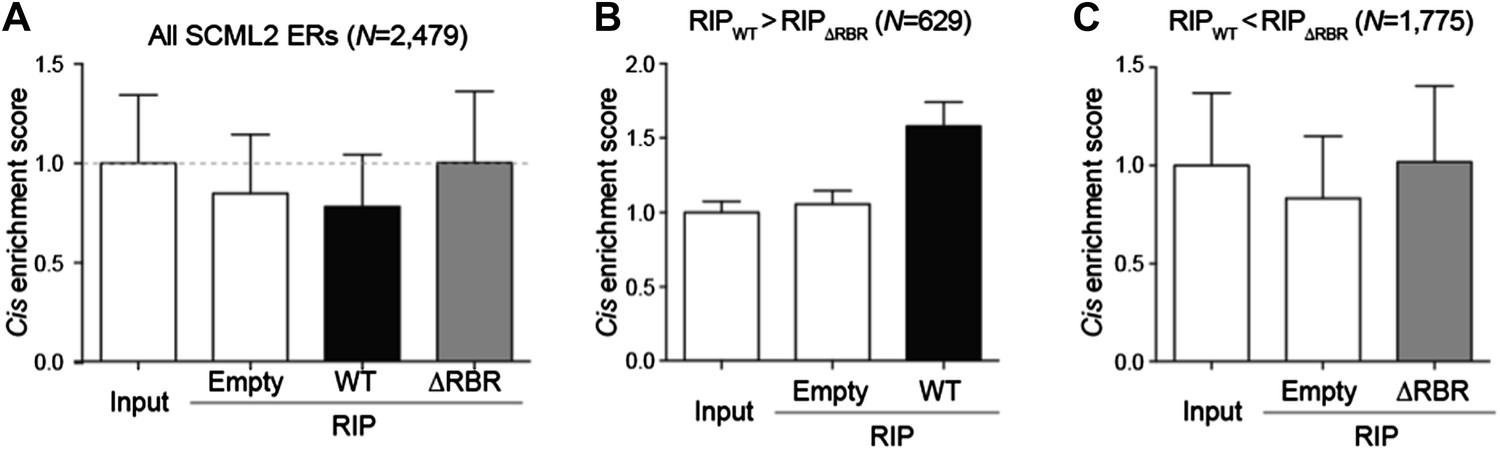
(A) The cis enrichment score was calculated by first counting the reads per million sequenced (RP10M) for each RIP sample in 5kb windows spanning the SCML2 ERs, dividing by the RP10M for the same sample in 1,000 simulations of an equal number of randomly selected regions in the genome, and then normalized to the input signal. Bars represent the mean score over all ERs + s.e.m. (B) Same as (A) but restricting the analysis to those SCML2 ERs where the RP10M for the WT RIP was higher than the RP10M for the ΔRBR RIP. (C) Same as (A) but restricting the analysis to the SCML2 ERs filtered out in (B).
Author response image 2
Immunoprecipitations for SCML2 and EZH2.
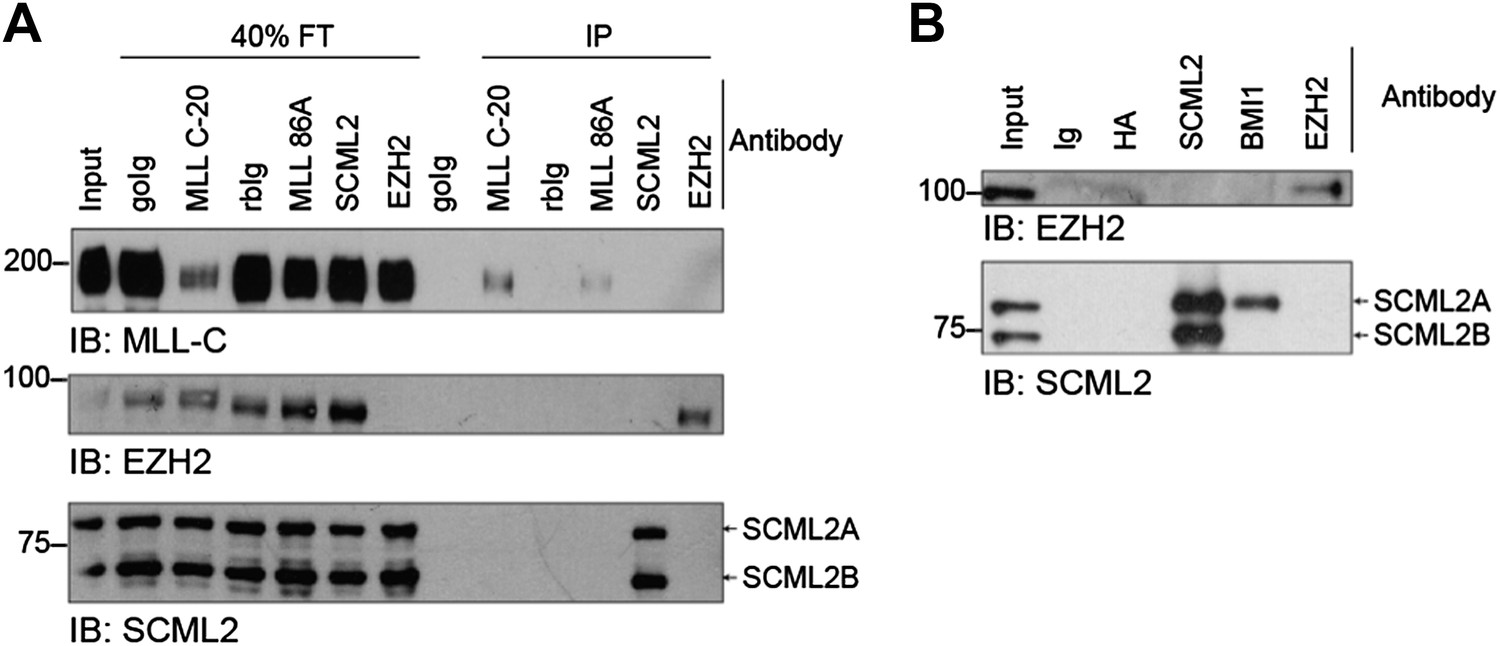
(A) IPs were performed in native conditions (200 mM KCl, 0.05% NP-40) with the indicated antibodies (C-20 and 86A are two different commercial antibodies against MLL). Flow-through (FT) and IP fractions were resolved on SDS-PAGE and immunoblotted (IB) for MLL (top), EZH2 (middle), and SCML2 (bottom). goIG, goat IgG control; rbIg, rabbit IgG control. (B) As in (A) but IPs were performed after crosslinking with formaldehyde as for the ChIP protocol. Crosslinks were reversed before SDS-PAGE by boiling for 20’. Note that SCML2A but not SCML2B co-immunoprecipitates with BMI1, as expected.
Author response image 3
Comparison of WT and ΔRBR ChIP-seq on unfiltered SCML2 ERs.
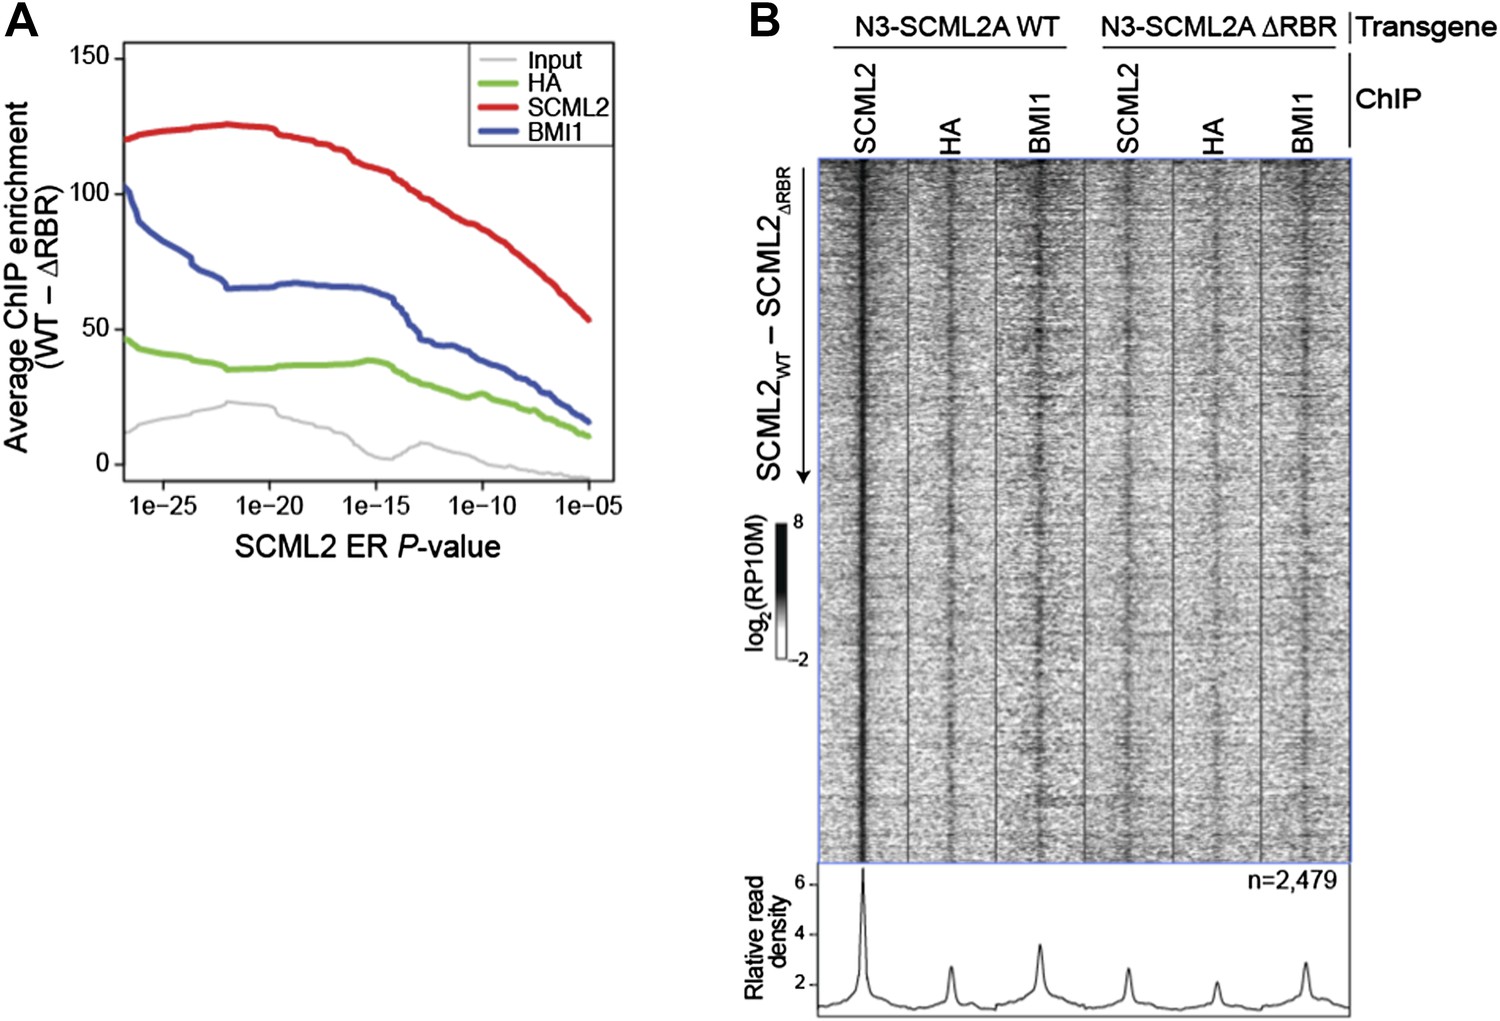
(A) Enrichment is defined as the normalized number of reads for the indicated sample in 1 kb regions centered on the ER summit in 293T-REx expressing N3–SCML2 WT minus the reads in the same regions in cells expressing N3–SCML2 ΔRBR. The average enrichment for each set of ERs, as defined by their P-value is shown on the y axis, starting from the full SCML2 ER set on the right (N = 2,479, P < 10-5), to only ERs with P < 10-26 on the left of the graph (N = 24). (B) Same heatmap as shown in Figure 5E, but this time including all 2,479 SCML2 ERs.
Author response image 4
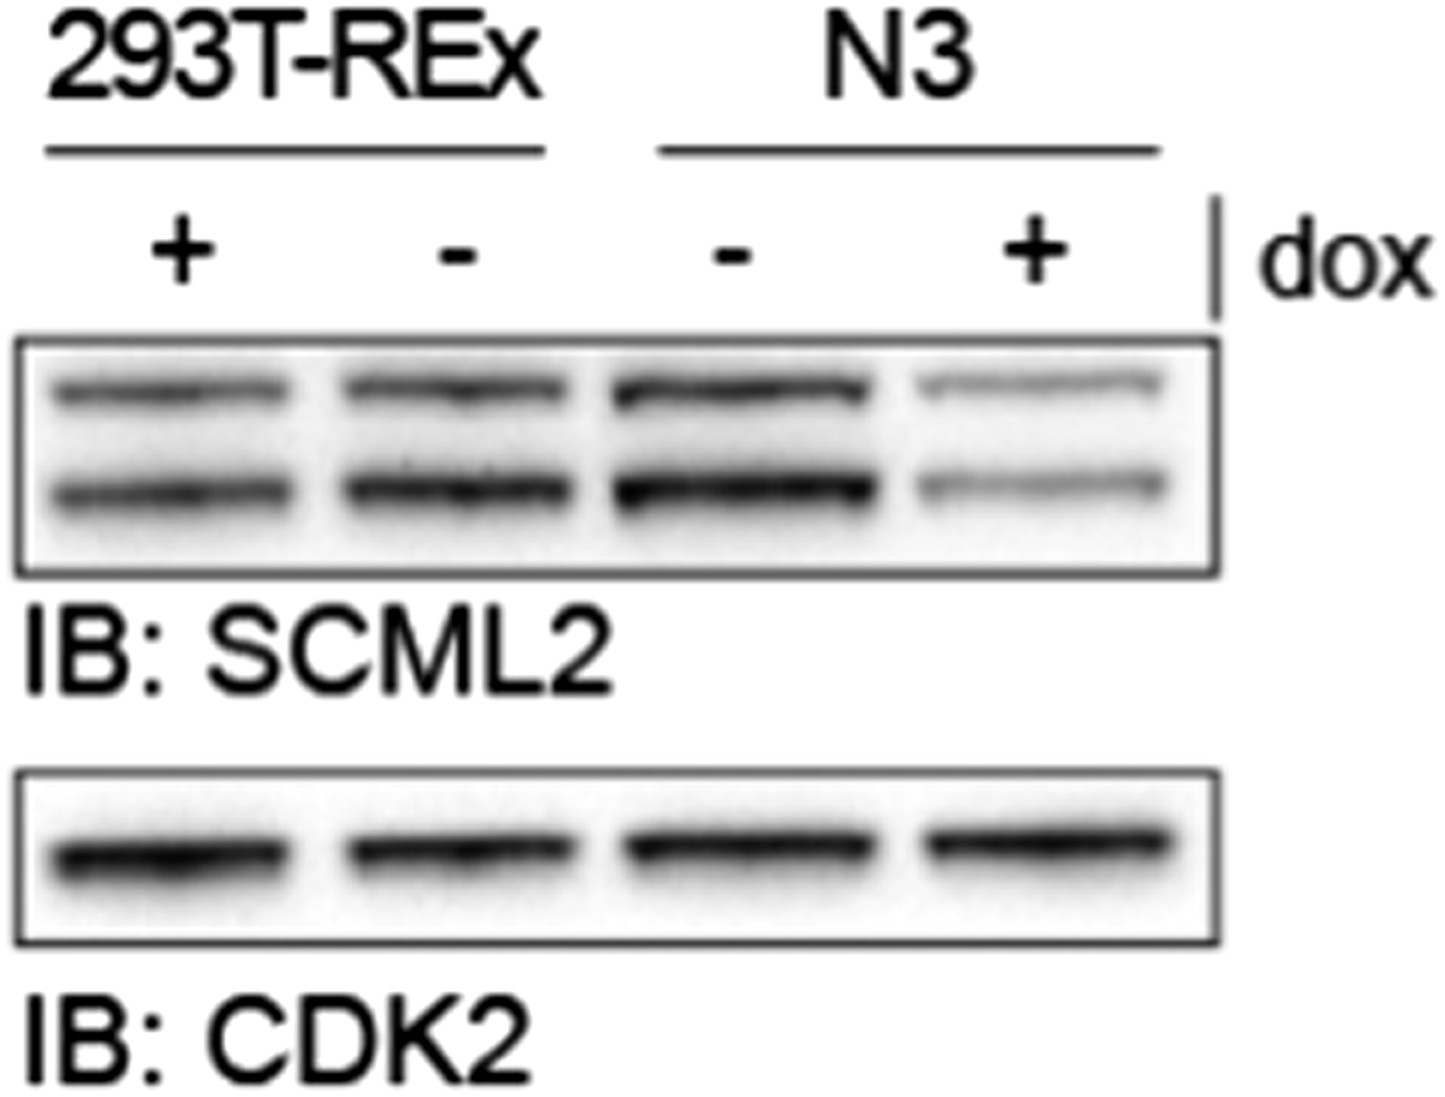
SCML2 expression in parental 293T-REx and N3 cell lines.
293T-REx either untreated (-) or treated with 1 µg/ml doxycycline for 48 h were lysed and proteins resolved on SDS-PAGE. Immunoblots for SCML2 (top) and CDK2 (bottom) as a loading control are shown. Note the knockdown of SCML2 in the N3 line +dox and that the levels of SCML2 in N3 cells -dox are equivalent to those in the parental 293T-REx line.
Additional files
-
Supplementary file 1
(A) GO enrichment analysis for SCML2 targets in 293T-Rex. (B) SCML2 target genes in 293T-REx. (C) Differentially expressed genes after SCML2 KD. (D) Oligonucleotide sequences.
- https://doi.org/10.7554/eLife.02637.017
Download links
A two-part list of links to download the article, or parts of the article, in various formats.
Downloads (link to download the article as PDF)
Open citations (links to open the citations from this article in various online reference manager services)
Cite this article (links to download the citations from this article in formats compatible with various reference manager tools)
Interactions with RNA direct the Polycomb group protein SCML2 to chromatin where it represses target genes
eLife 3:e02637.
https://doi.org/10.7554/eLife.02637


