Conformational dynamics of the nucleotide binding domains and the power stroke of a heterodimeric ABC transporter
- Vanderbilt University, United States
- University of Illinois, United States
- Center for Biophysics and Computational Biology, University of Illinois, United States
- The Beckman Institute for Advanced Science and Technology, University of Illinois, Unites States
Figures
Figure 1 with 5 supplements
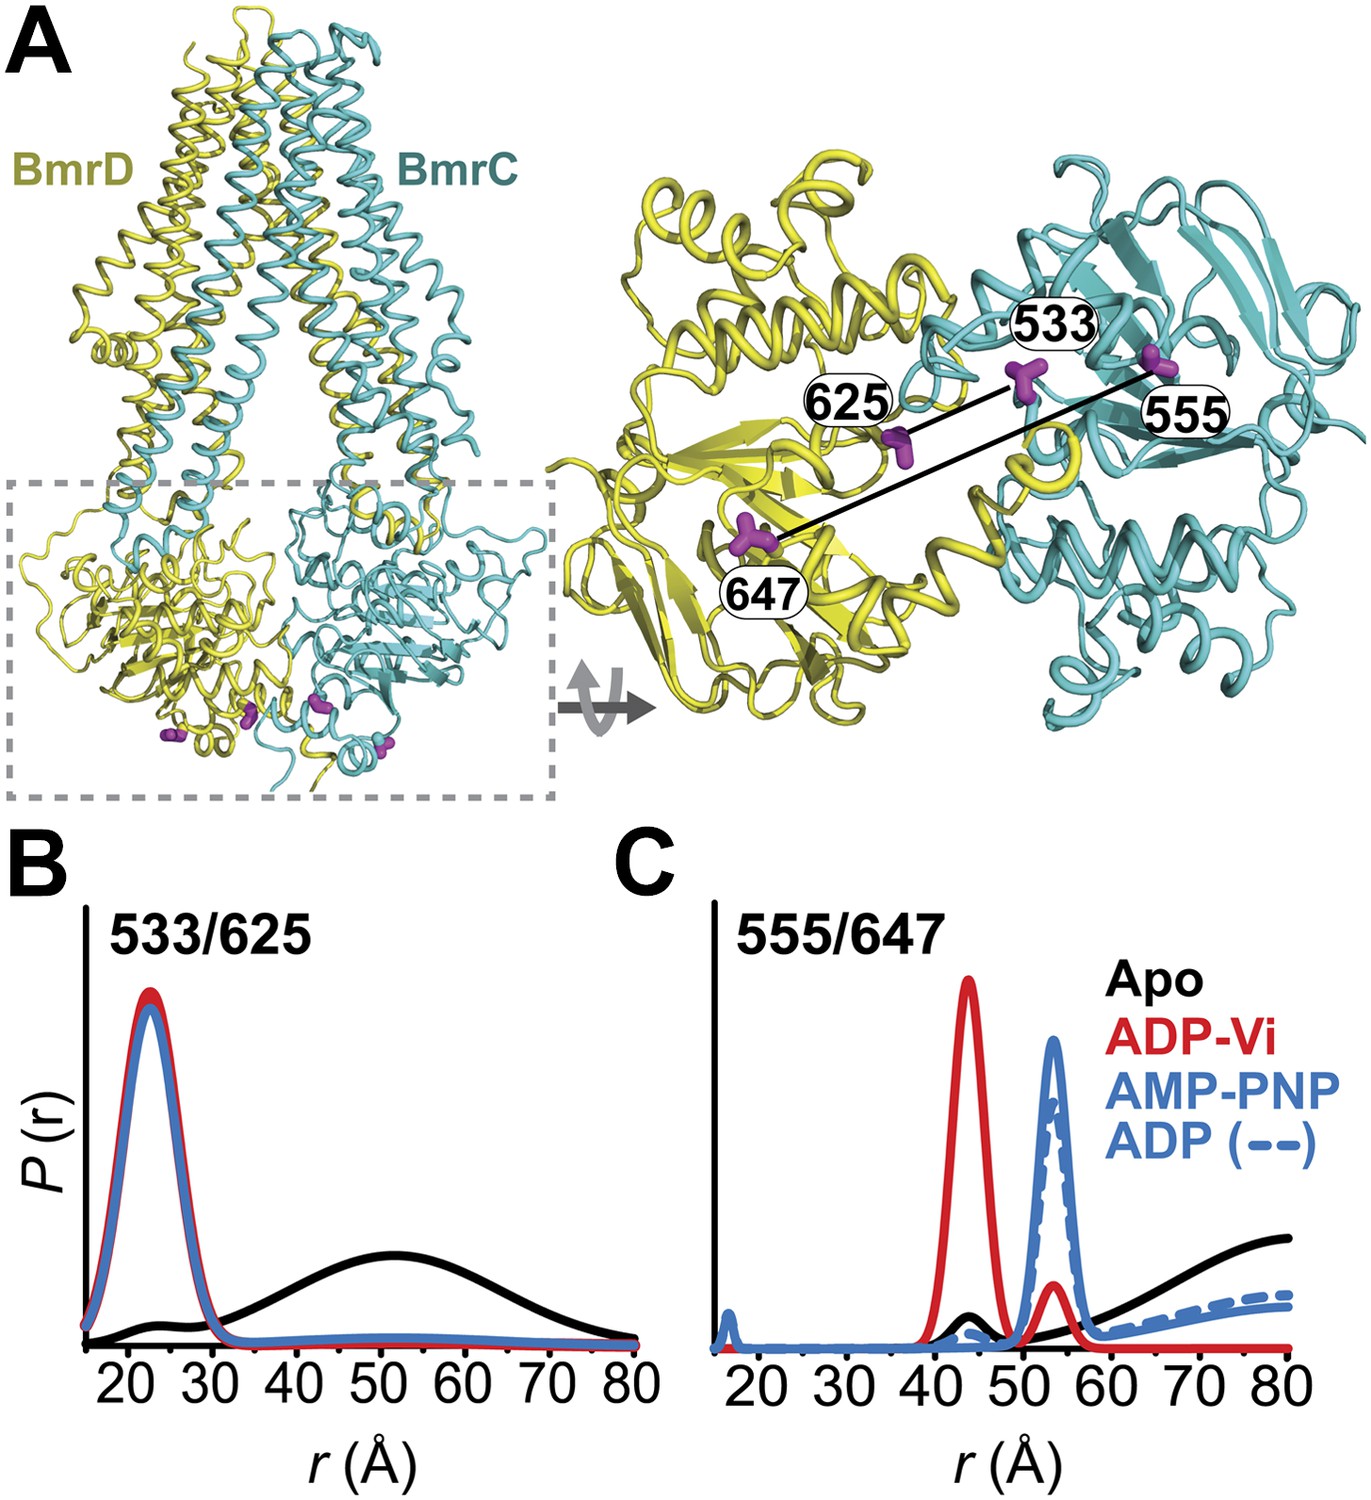
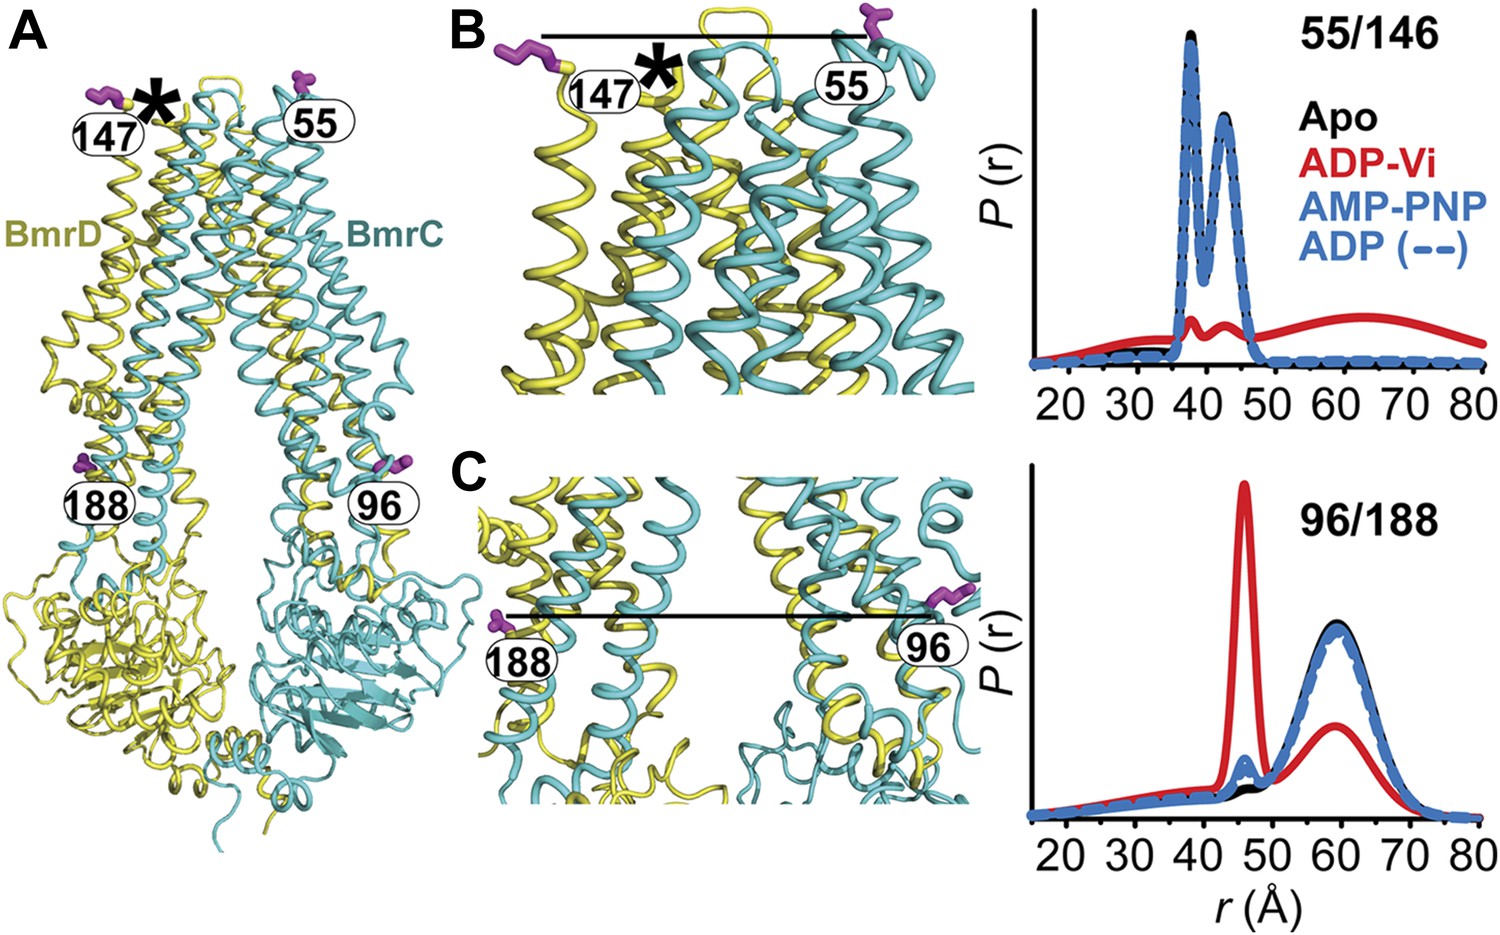
Conformational states of BmrCD NBDs.
(A) Ribbon representation of BmrCD homology model showing the spin label pairs at symmetric sites across the NBD dimer interface (the transporter is rotated 90° and NBD interface is viewed from cytoplasm). (B and C) Distance distributions revealing conformational changes upon ADP and AMP-PNP binding (blue traces) and ATP hydrolysis (red traces). ATP binding mimicked by AMP-PNP induces the formation of an intermediate state distinct from that stabilized by ATP hydrolysis.
Figure 1—figure supplement 1
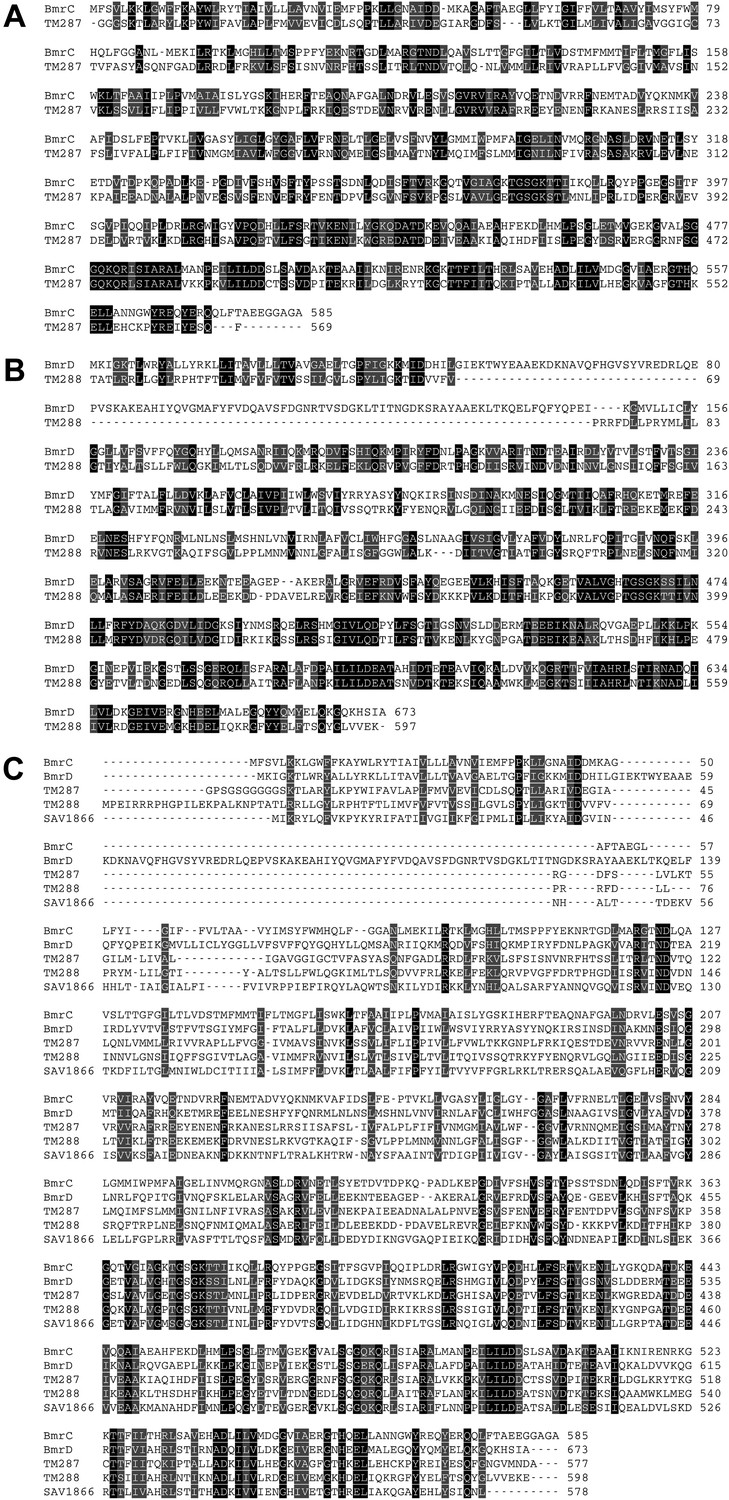
Sequence alignments.
(A) Sequence alignment of BmrC with TM287. (B) Sequence alignment of BmrD with TM288. These sequence alignments were used as input for BmrCD homology modeling. (C) Multiple sequence alignment to identify the non-homologous region of BmrD for the homology model. The sequence of BmrC, BmrD, TM287, TM288 and Sav1866 were used to constrain the alignment of TM1 and an unconserved insertion in BmrD. The alignments were formatted using the Sequence Manipulation Suite (Stothard, 2000) web server.
Figure 1—figure supplement 2
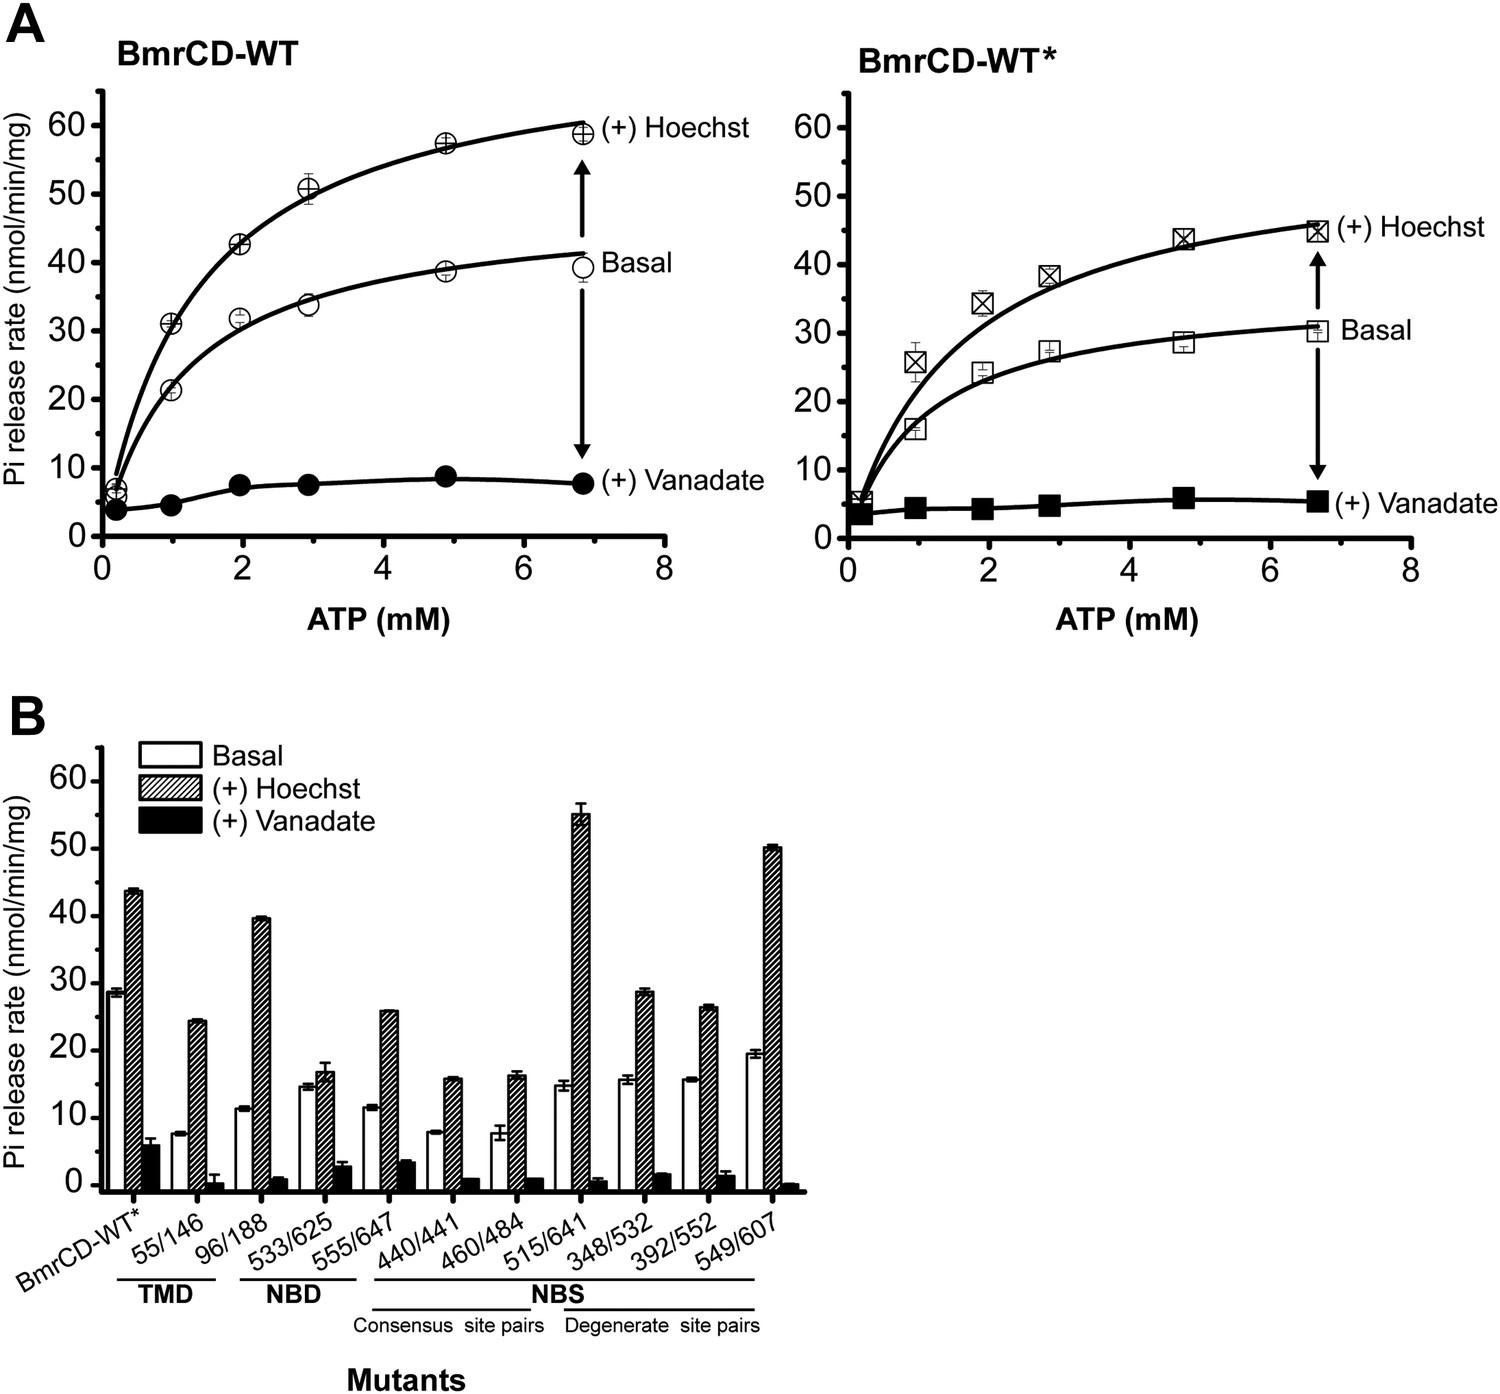
The ATPase activity of BmrCD-WT (wild type BmrCD), BmrCD-WT* (Cysteine-less BmrCD) and its spin-labeled mutants is stimulated by Hoechst33342 (hereafter referred as Hoechst) (10 µM) and inhibited by vanadate (1 mM).
(A) Substitution of the native cysteines with alanines marginally reduces the Vmax of ATP turnover. The solid line is a non-linear least-squares fit that yields Vmax (48.52 ± 1.85 nmol/min/mg), Km (1.19 ± 0.13 mM) for BmrCD-WT (basal); Vmax (72.39 ± 2.86 nmol/min/mg), Km (1.35 ± 0.14 mM) for BmrCD-WT (in presence of Hoechst) and Vmax (36.02 ± 1.51 nmol/min/mg), Km (1.08 ± 0.17 mM) for BmrCD-WT* (basal); Vmax (56.86 ± 2.47 nmol/min/mg), Km (1.6 ± 0.27 mM) for BmrCD-WT* (in presence of Hoechst 33,342). Vmax and Km values for BmrCD-WT, BmrCD-WT* and spin-labeled BmrCD are the average of three independent measurements. (B) All spin-labeled BmrCD pairs used for this study turnover ATP well above the background observed from inhibition by vanadate. Vmax increased for all pairs following the addition of Hoechst although the level of stimulation was somewhat variable.
Figure 1—figure supplement 3
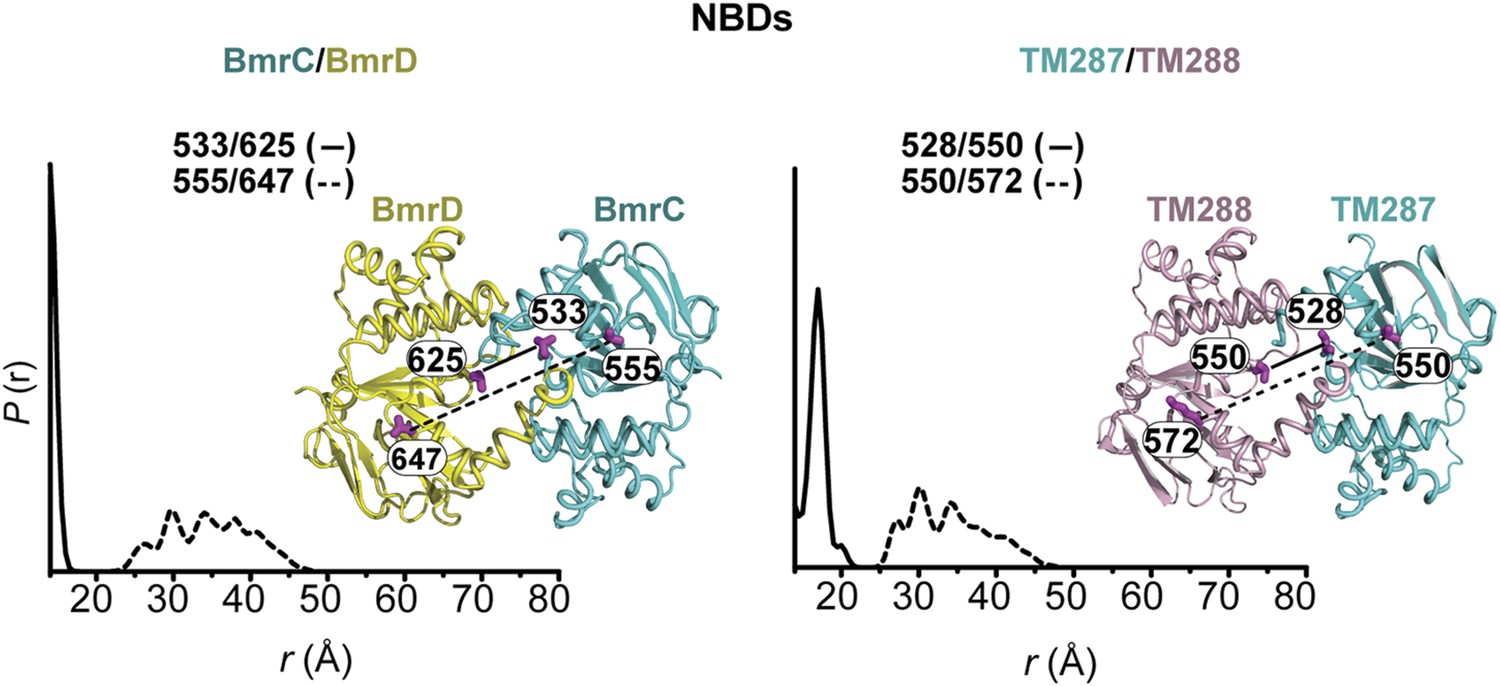
Predicted distance distributions between spin-labeled pairs monitoring the NBD interface.
The distributions were calculated using the MMM package (Polyhach et al., 2011) for the BmrCD homology model and nucleotide-bound TM287/TM288 crystal structure.
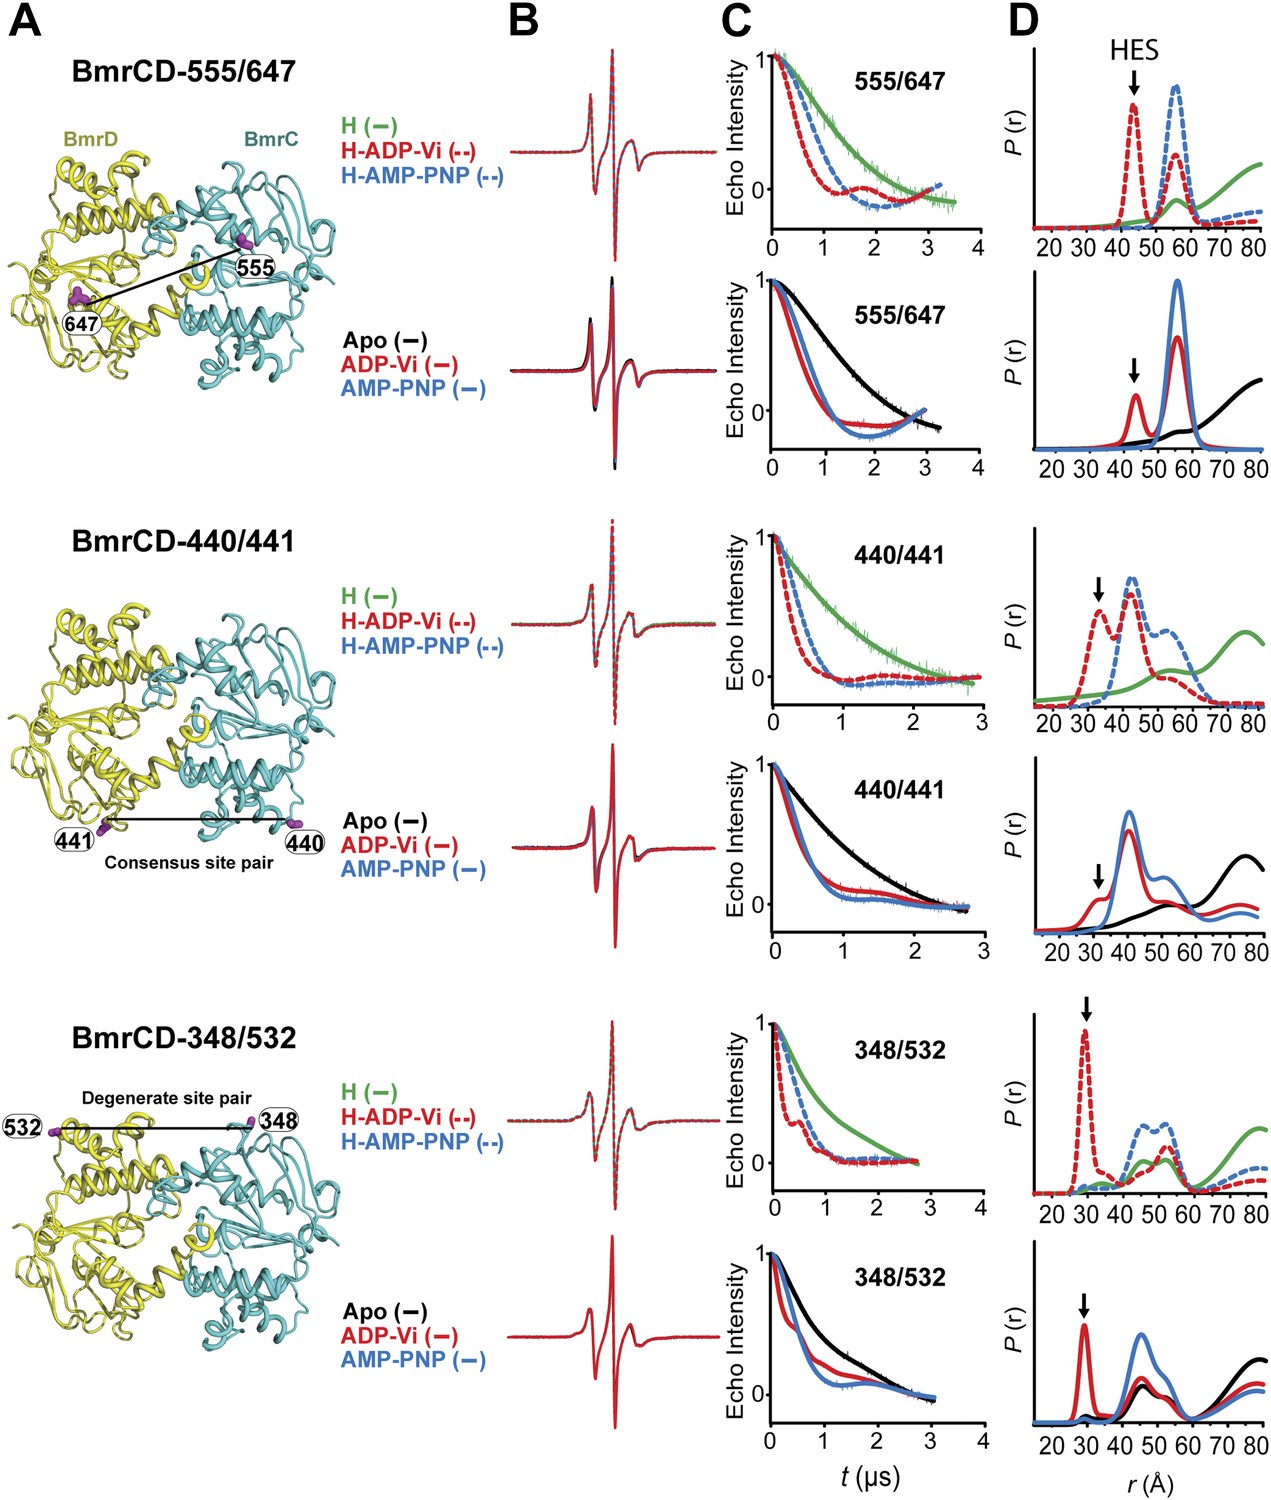
Figure 1—figure supplement 4
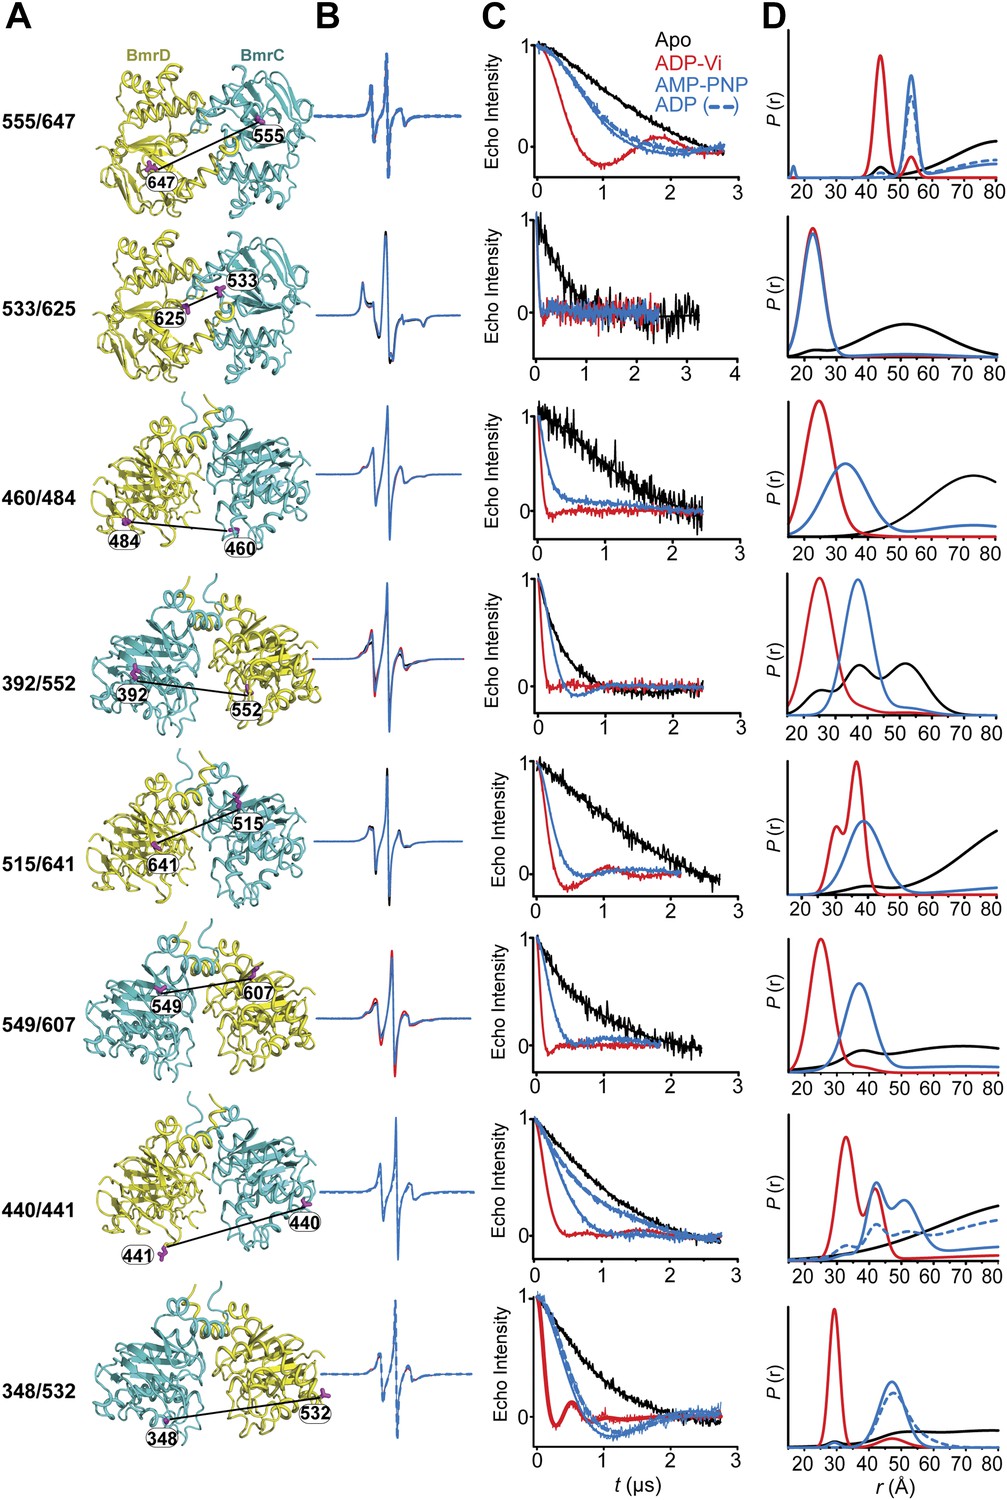
CW-EPR and DEER data analysis for spin-labeled pairs in the NBDs.
(A) Close up view of BmrCD homology model highlighting the location of the spin-labeled pairs in the NBDs. (B) Superposition of the CW-EPR spectra demonstrates minimal changes in the lineshape, and by extension the spin label rotamer preferences. (C) Baseline-corrected DEER signals along with the fits corresponding to the distance distributions in panel (D).
Figure 1—figure supplement 5
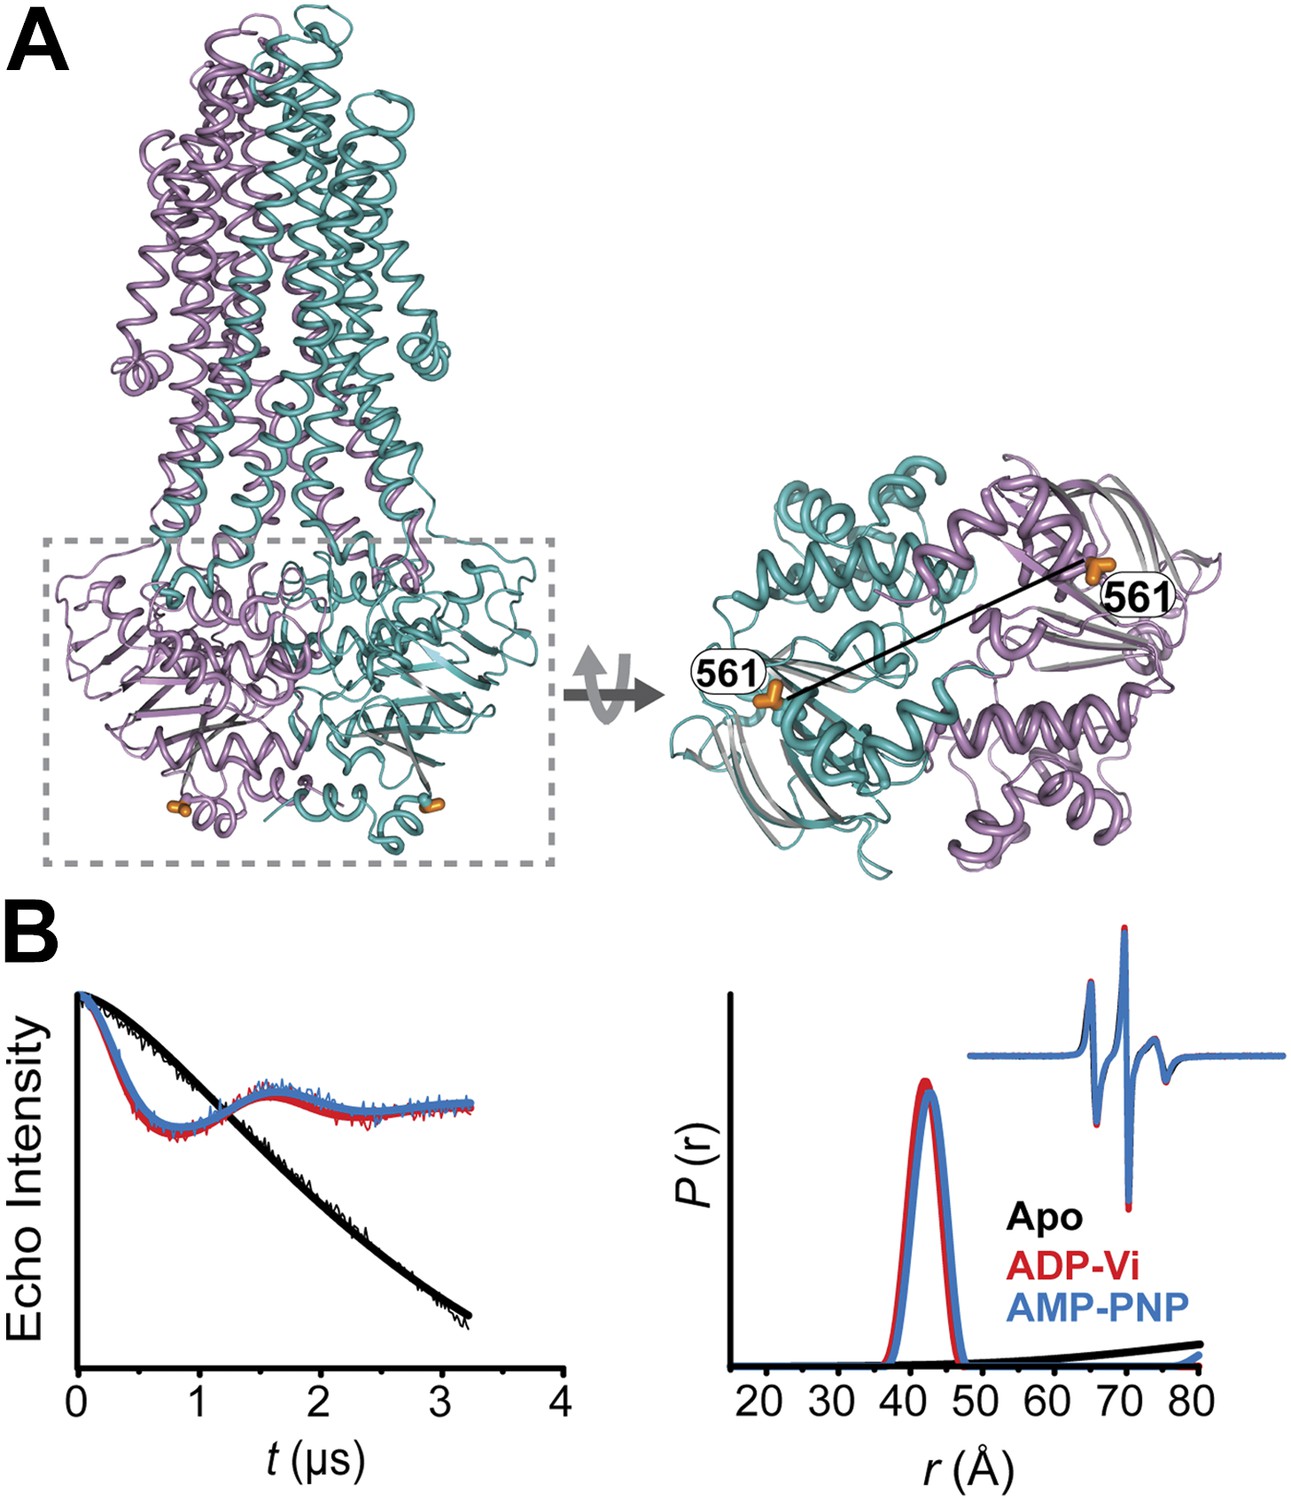
Conformational states of MsbA NBDs.
(A) Ribbon representation of MsbA (PDB:3B60) showing the spin label pair 561 at symmetric sites across the NBD dimer interface (the transporter is turned 90° and NBD interface is viewed from cytoplasm). (B) DEER Echo (left panel) and corresponding distance distributions (right panel) revealing large amplitude movement upon trapping MsbA in the ADP-Vi state (red trace) and upon AMP-PNP binding (blue trace). Both conditions result in the same average distance demonstrating that ATP binding is sufficient for the formation of the NBD sandwich observed in the crystal structure.
Figure 2 with 1 supplement
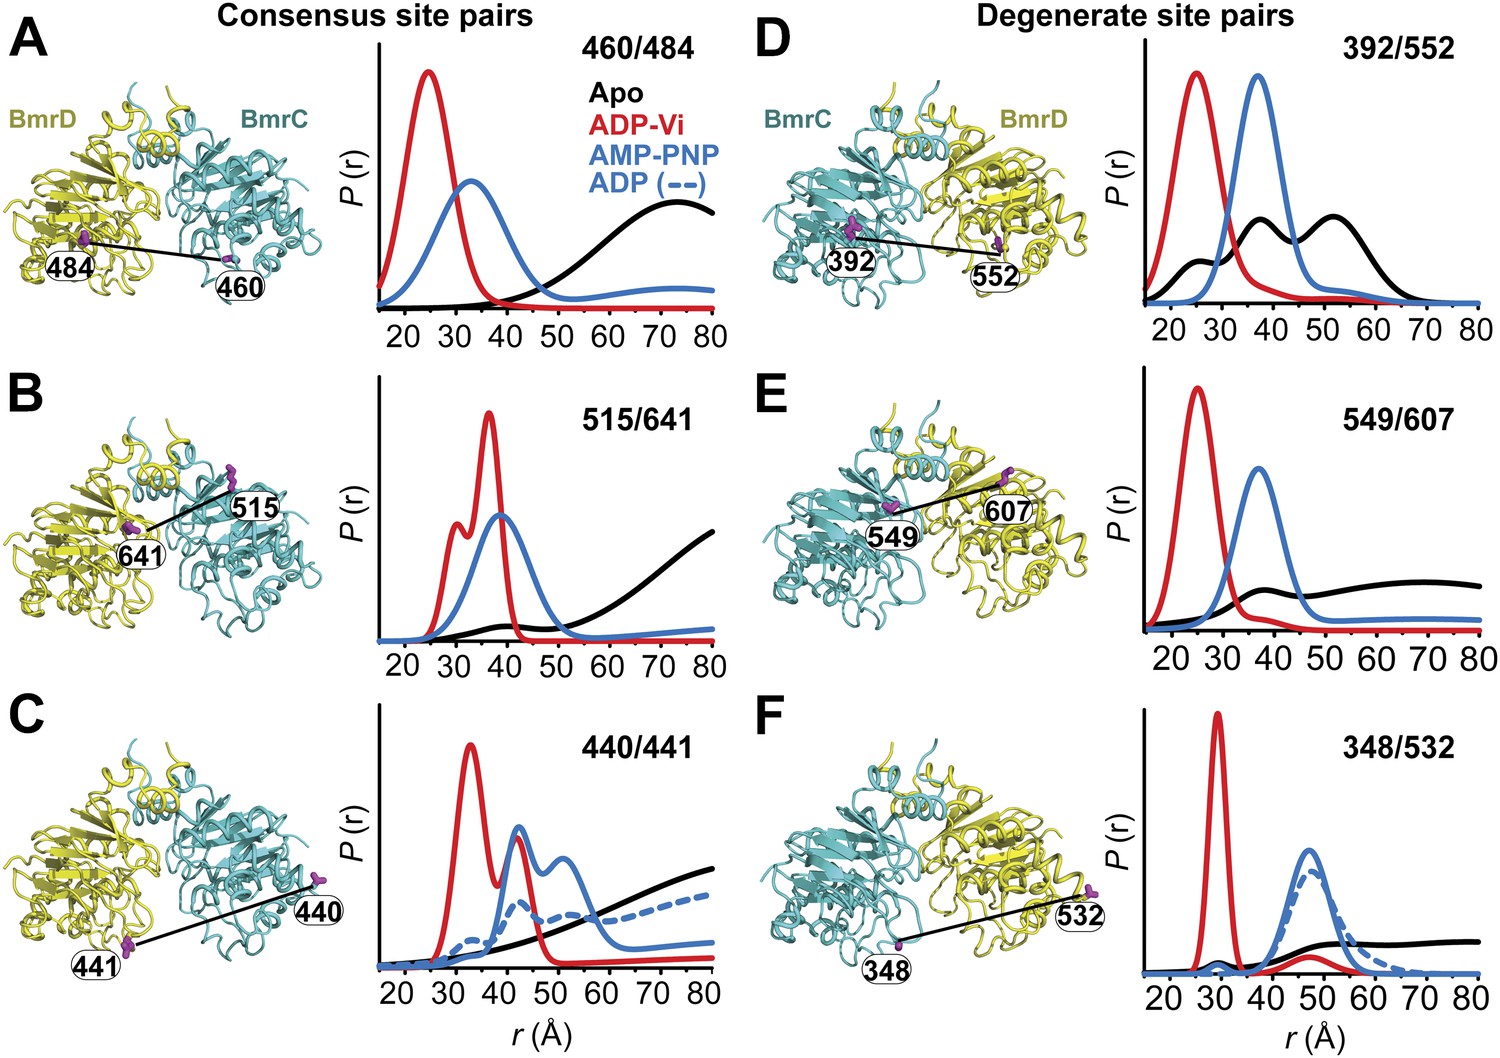
Structural asymmetry of the NBSs.
(A–C) Close up side view of the NBD dimer and distance distributions for spin label pairs monitoring the consensus NBS. The overlapping distributions in the AMP-PNP bound and ADP-Vi trapped intermediates demonstrate that ATP binding can induce formation of the HES state. In contrast, distance distributions of structurally equivalent pairs monitoring the degenerate NBS (D–F) are predominantly non-overlapping. The views in (D–F) are obtained by rotating the views of A–C by 180°. See also Figure 1—figure supplement 2B and Figure1—figure supplement 4.
Figure 2—figure supplement 1
DEER data analysis for spin-labeled pairs in the NBSs.
Close up view of BmrCD homology model highlighting the location of the pairs (A) (440/441), (B) (348/532) along with the baseline-corrected DEER decays and the corresponding distance distributions. Addition of Hoechst does not affect the distance distribution in detergent micelles.
Figure 3 with 1 supplement
The inward- to outward-facing transition of the TMD requires ATP hydrolysis.
(A) Ribbon representation of the BmrCD homology model showing the spin-labeled pairs designed to monitor the conformation of the TMD. Residue 147 is shown since 146 was not included in the homology model. ATP turnover and trapping with Vi, but not AMP-PNP binding, induces opening of (B) the extracellular side and (C) the closing of the intracellular side of the transporter. See also Figure 1—figure supplement 2B.
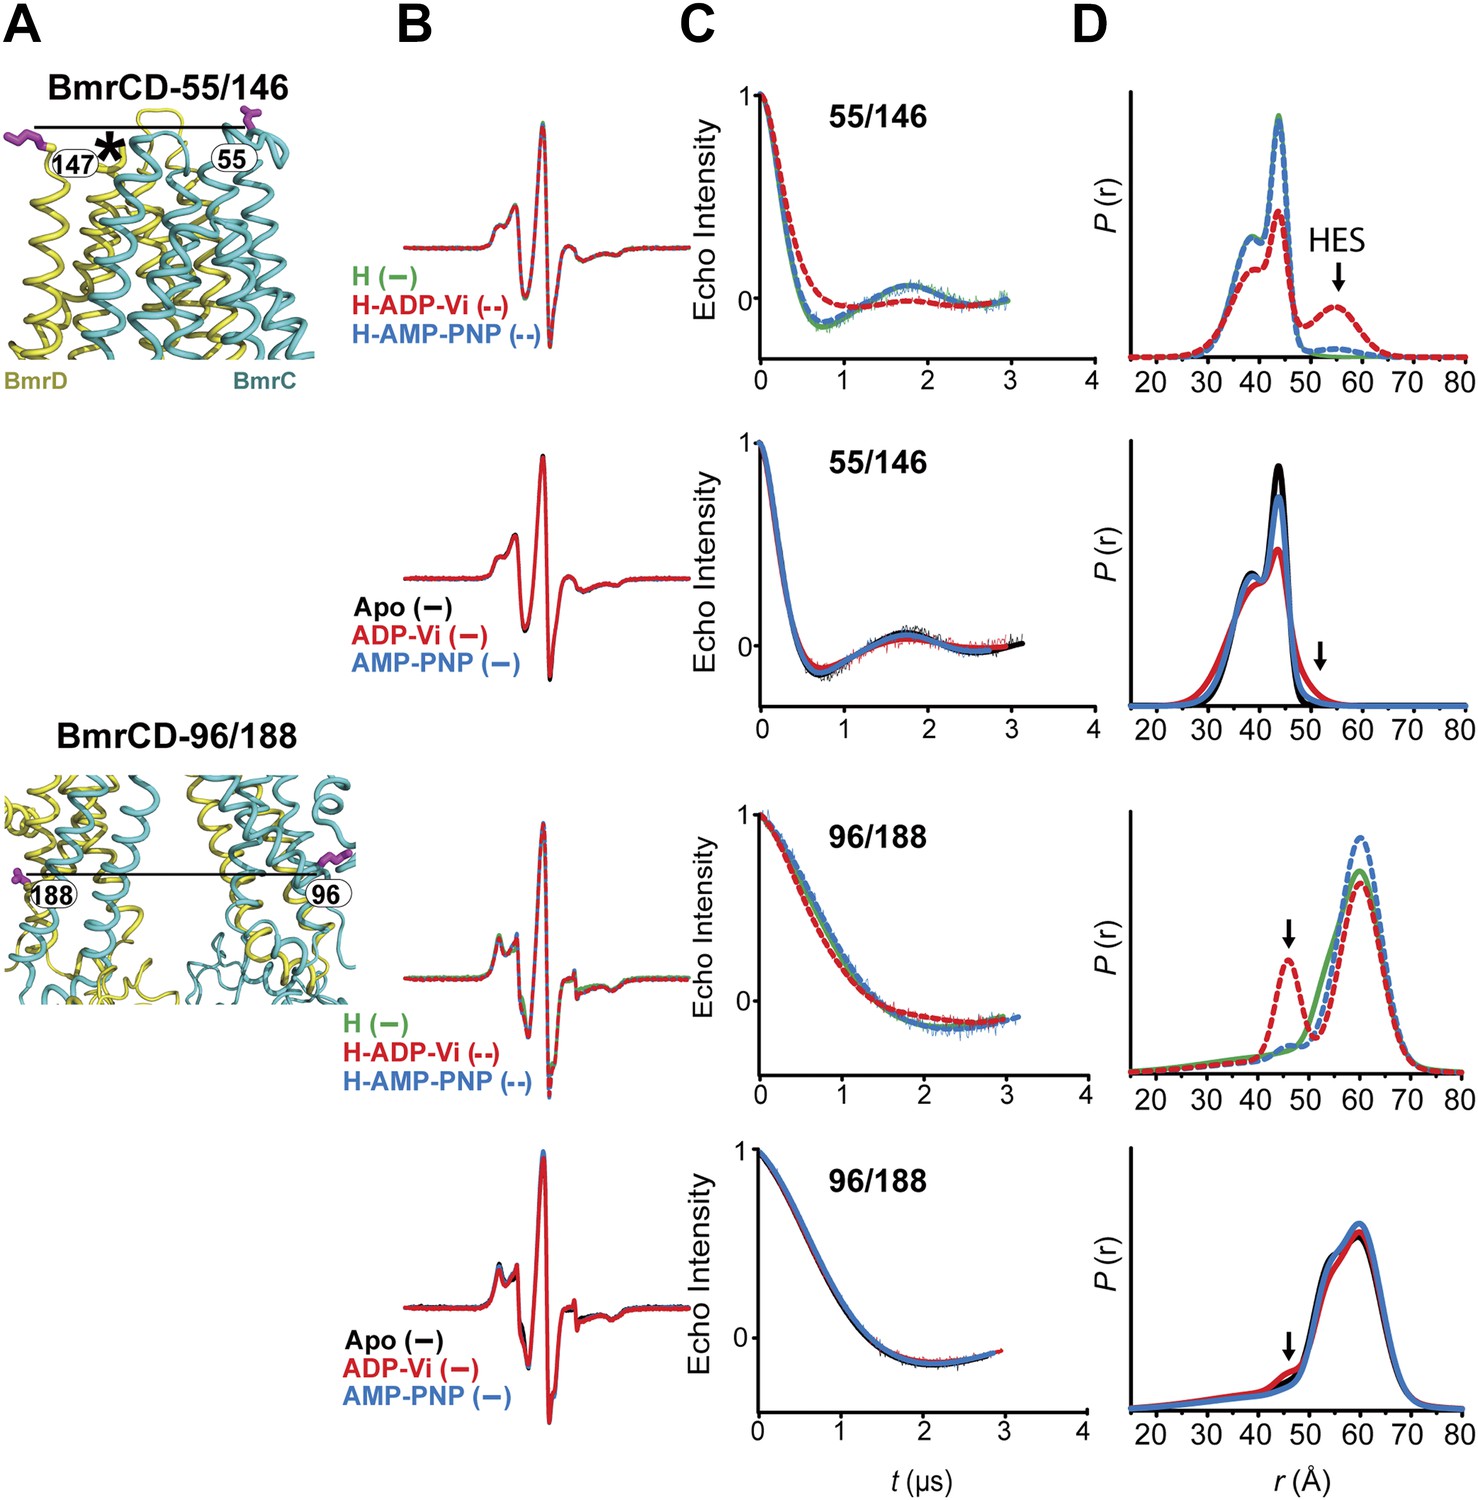
Figure 3—figure supplement 1
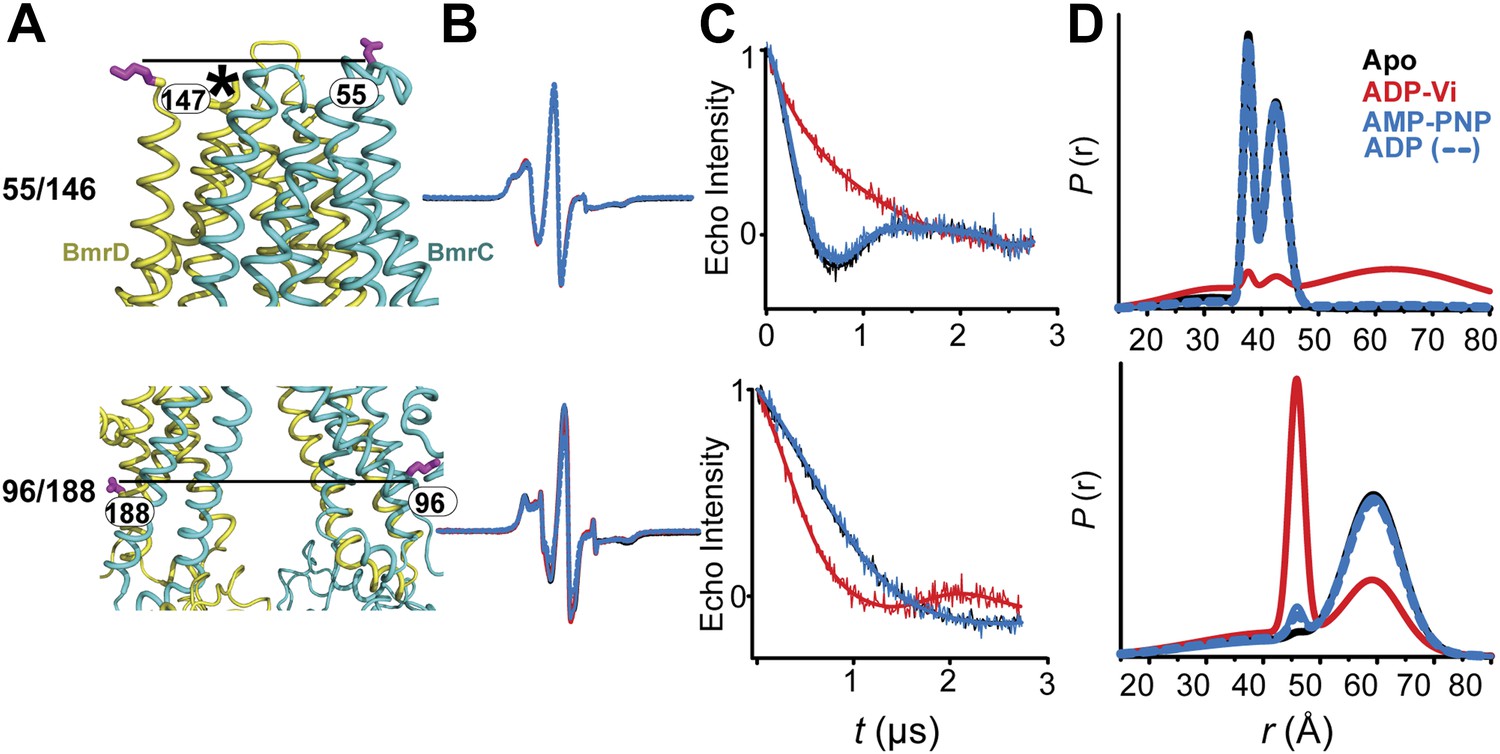
CW-EPR and DEER data analysis for spin-labeled pairs in the TMDs.
(A) Close up view of BmrCD homology model highlighting the location of the spin-labeled pairs at the extracellular (upper panel) and intracellular (lower panel) side. * residue 146 was not modeled therefore residue 147 is displayed. (B) Superposition of the CW-EPR spectra demonstrates minimal changes in the EPR lineshape, and by extension the rotamer preferences of the spin label pairs, following addition of nucleotides. (C) Baseline-corrected DEER signals along with the fits corresponding to the distance distributions in panel (D).
Figure 4 with 4 supplements
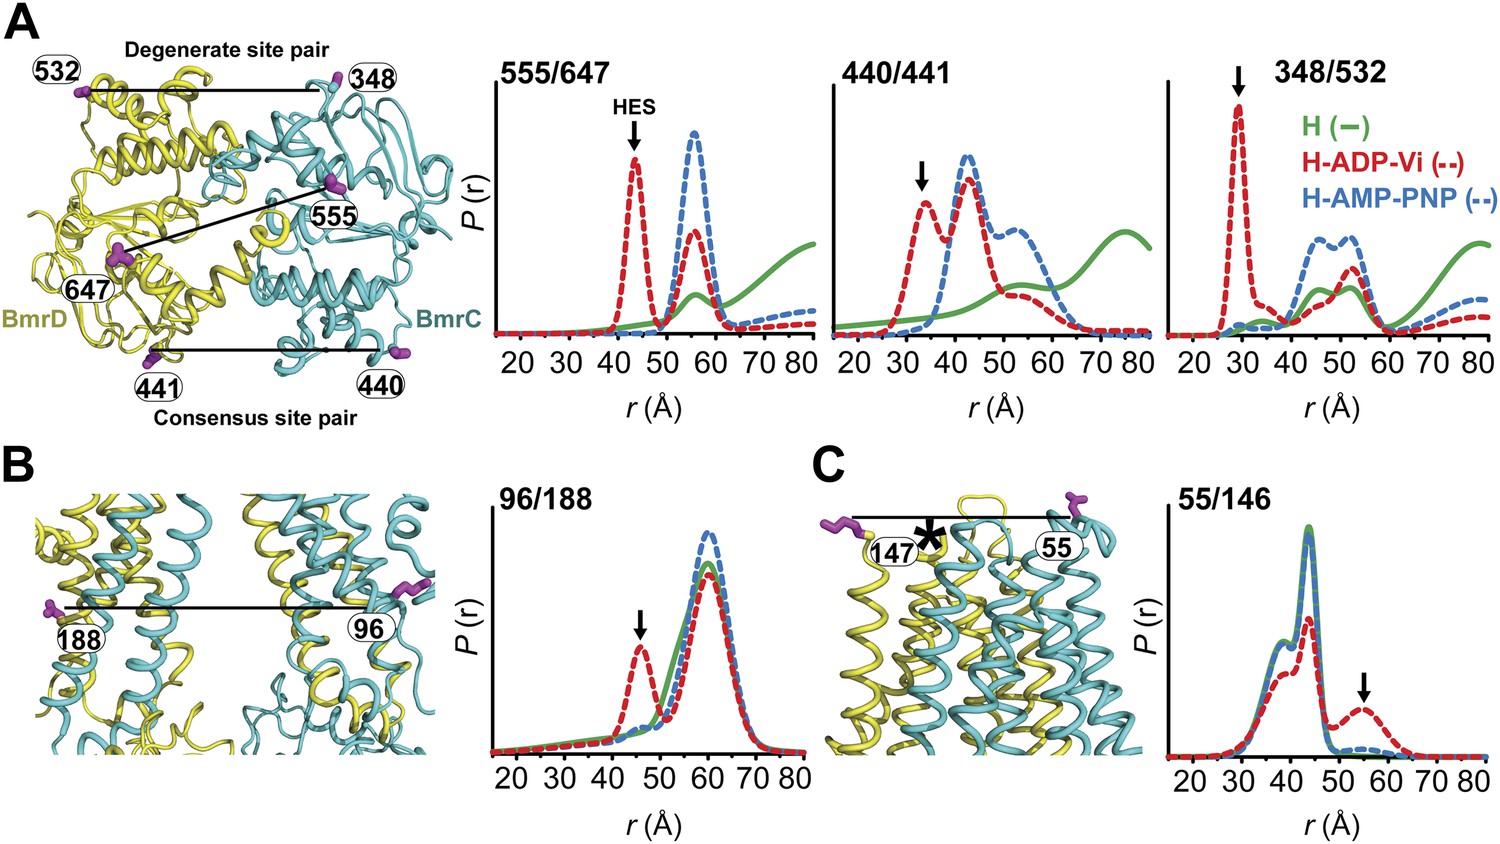
Conformational states of BmrCD in lipid bilayers.
(A) Close up view from cytoplasmic side for spin label pairs monitoring the NBD dimer, the consensus NBS and the degenerate NBS along with the corresponding distance distributions. (B) Close up view from the membrane for spin label pairs monitoring the closing on intracellular side and (C) the opening on extracellular side of the transporter. The arrow points to the distance corresponding to HES.
Figure 4—figure supplement 1
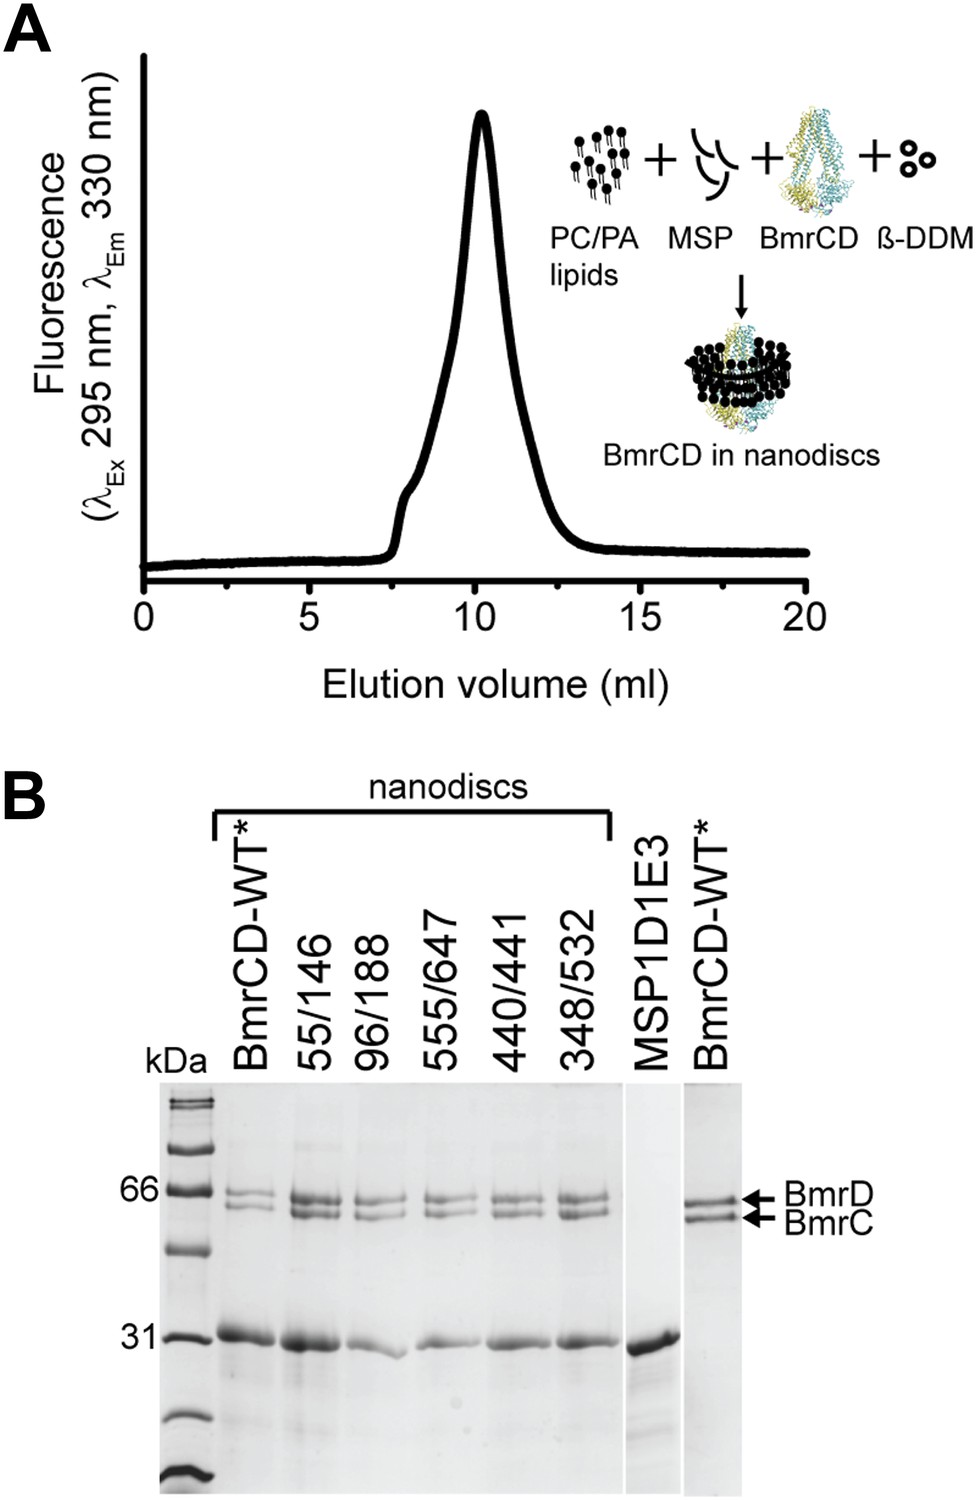
Reconstitution of BmrCD-WT* (Cysteine-less BmrCD) and its spin-labeled mutants in PC/PA nanodiscs.
(A) Size-exclusion chromatography of BmrCD in nanodiscs and a cartoon depicting BmrCD-WT* assembly in nanodiscs. Similar size-exclusion chromatographs were obtained for spin-labeled mutants. (B) SDS-PAGE of BmrCD-WT* and its spin-labeled mutants assembled in nanodiscs showing the presence of MSP and BmrCD.
Figure 4—figure supplement 2

The ATPase activity of BmrCD-WT (wild type BmrCD), BmrCD-WT* (Cysteine-less BmrCD) and its spin-labeled mutants in PC/PA nanodiscs is stimulated by Hoechst (10 µM) and inhibited by vanadate (5 mM).
(A) Reconstitution of BmrCD-WT, BmrCD-WT* and its spin-labeled mutants in PC/PA nanodiscs stimulates the basal ATPase activity. The solid line is a non-linear least-squares fit that yields Vmax (527.6 ± 14.9 nmol/min/mg), Km (1.53 ± 0.2 mM) for BmrCD-WT (basal); Vmax (1065 ± 32.9 nmol/min/mg), Km (1.65 ± 0.18 mM) for BmrCD-WT (in presence of Hoechst) and Vmax (494.2 ± 45.41 nmol/min/mg), Km (2.19 ± 0.39 mM) for BmrCD-WT* (basal); Vmax (1067.2 ± 98.3 nmol/min/mg), Km (2.13 ± 0.37 mM) for BmrCD-WT* (in presence of Hoechst). Vmax and Km values for BmrCD-WT, BmrCD-WT* and spin-labeled BmrCD are the average of three independent measurements. (B) All spin-labeled BmrCD pairs used for this study turnover ATP well above the background observed from inhibition by vanadate. Vmax increased for all pairs following the addition of Hoechst although the level of stimulation was somewhat variable.
Figure 4—figure supplement 3
CW-EPR and DEER data analysis for BmrCD spin-labeled pairs reconstituted in nanodiscs.
(A) Close up view of BmrCD homology model highlighting the location of the spin-labeled pairs in the NBDs and NBSs. (B) Superposition of the CW-EPR spectra demonstrates minimal changes in the lineshape, and by extension the spin label rotamer preferences. (C) Baseline-corrected DEER signals along with the fits corresponding to the distance distributions in panel (D). The arrow points to the distance corresponding to HES.
Figure 4—figure supplement 4
CW-EPR and DEER data analysis for BmrCD spin-labeled pairs reconstituted in nanodiscs.
(A) Close up view of BmrCD homology model highlighting the location of the spin-labeled pairs at the extracellular (upper panel) and intracellular (lower panel) side. * residue 146 was not modeled therefore residue 147 is displayed. (B) Superposition of the CW-EPR spectra demonstrates minimal changes in the EPR lineshape, and by extension the rotamer preferences of the spin label pairs, following addition of nucleotides. (C) Baseline-corrected DEER signals along with the fits corresponding to the distance distributions in panel (D). The arrow points to the distance corresponding to the HES.
Figure 5 with 1 supplement
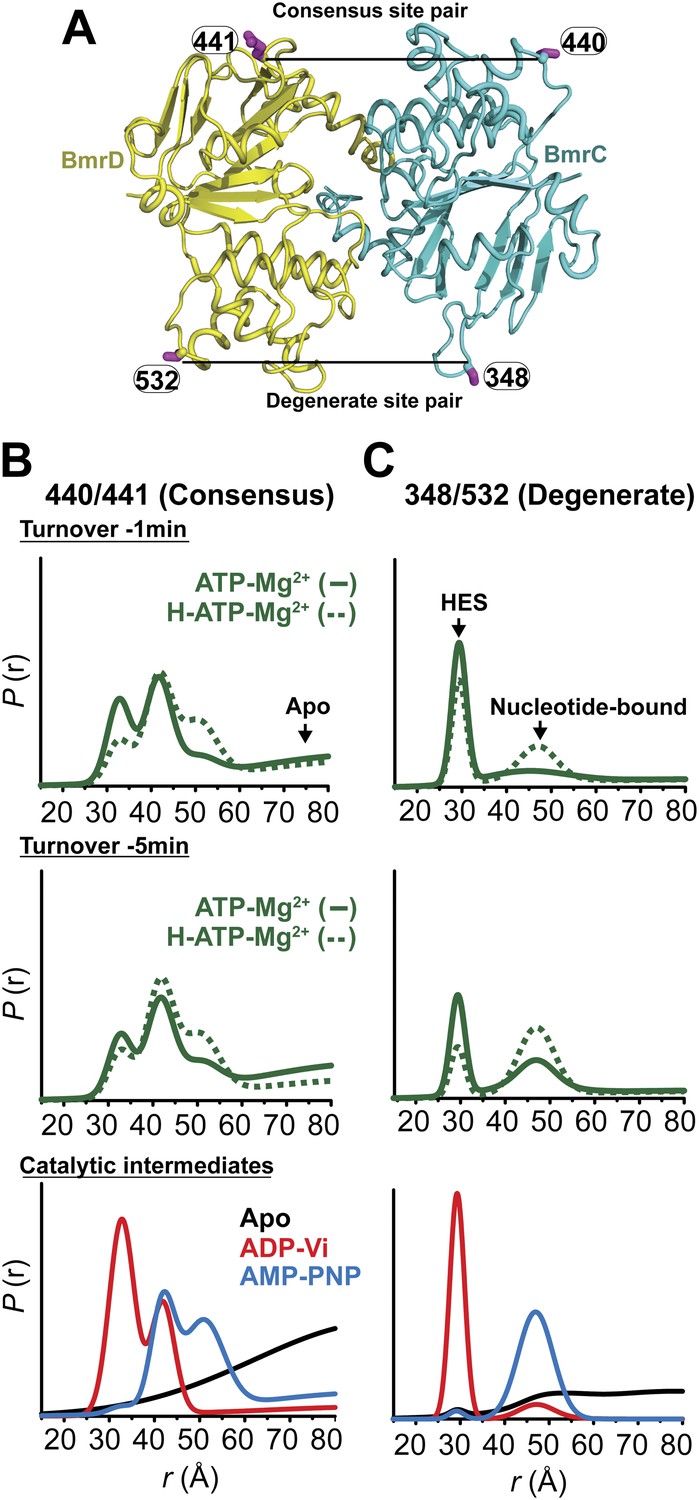
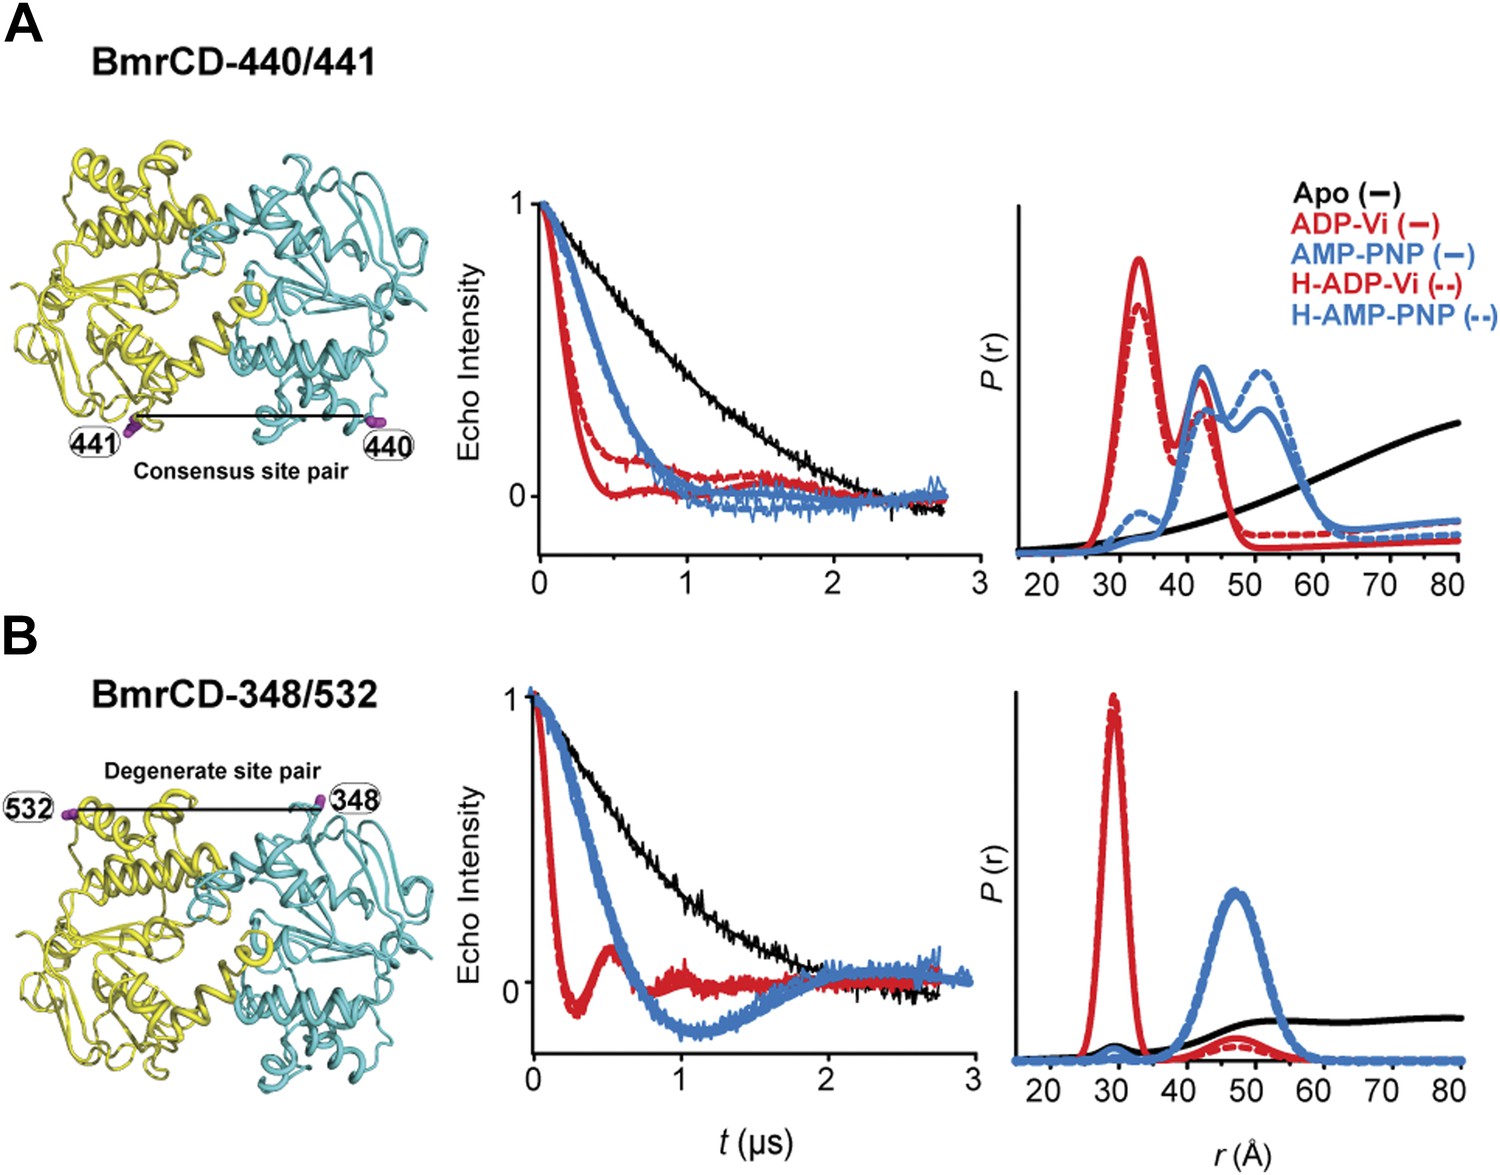
Structural asymmetry of the NBSs under turnover conditions.
(A) Ribbon diagram of BmrCD NBDs showing the location of spin label pairs monitoring the consensus and the degenerate NBS (the NBD dimer is viewed from the cytoplasm, along the membrane normal). Following 1 or 5 min of incubation with 10 mM ATP at 30°C in (B) and (C) in presence (dashed traces) or absence (solid traces) of the substrate Hoechst (H), samples of spin-labeled BmrCD were immediately cooled to 4°C and then analyzed by DEER spectroscopy (Jeschke and Polyhach, 2007; Mchaourab et al., 2011). The two panels labeled ‘Catalytic intermediates’ are identical to those in Figure 2 and serve as a reference to assign the components in the distance distributions under turnover conditions.
Figure 5—figure supplement 1

DEER data analysis for spin-labeled pairs in the NBSs under turnover conditions.
Panels from left to right: location of spin-labeled pairs on BmrCD homology model, baseline-corrected DEER decays along with the fits and the resulting distance distributions.
Figure 6 with 1 supplement
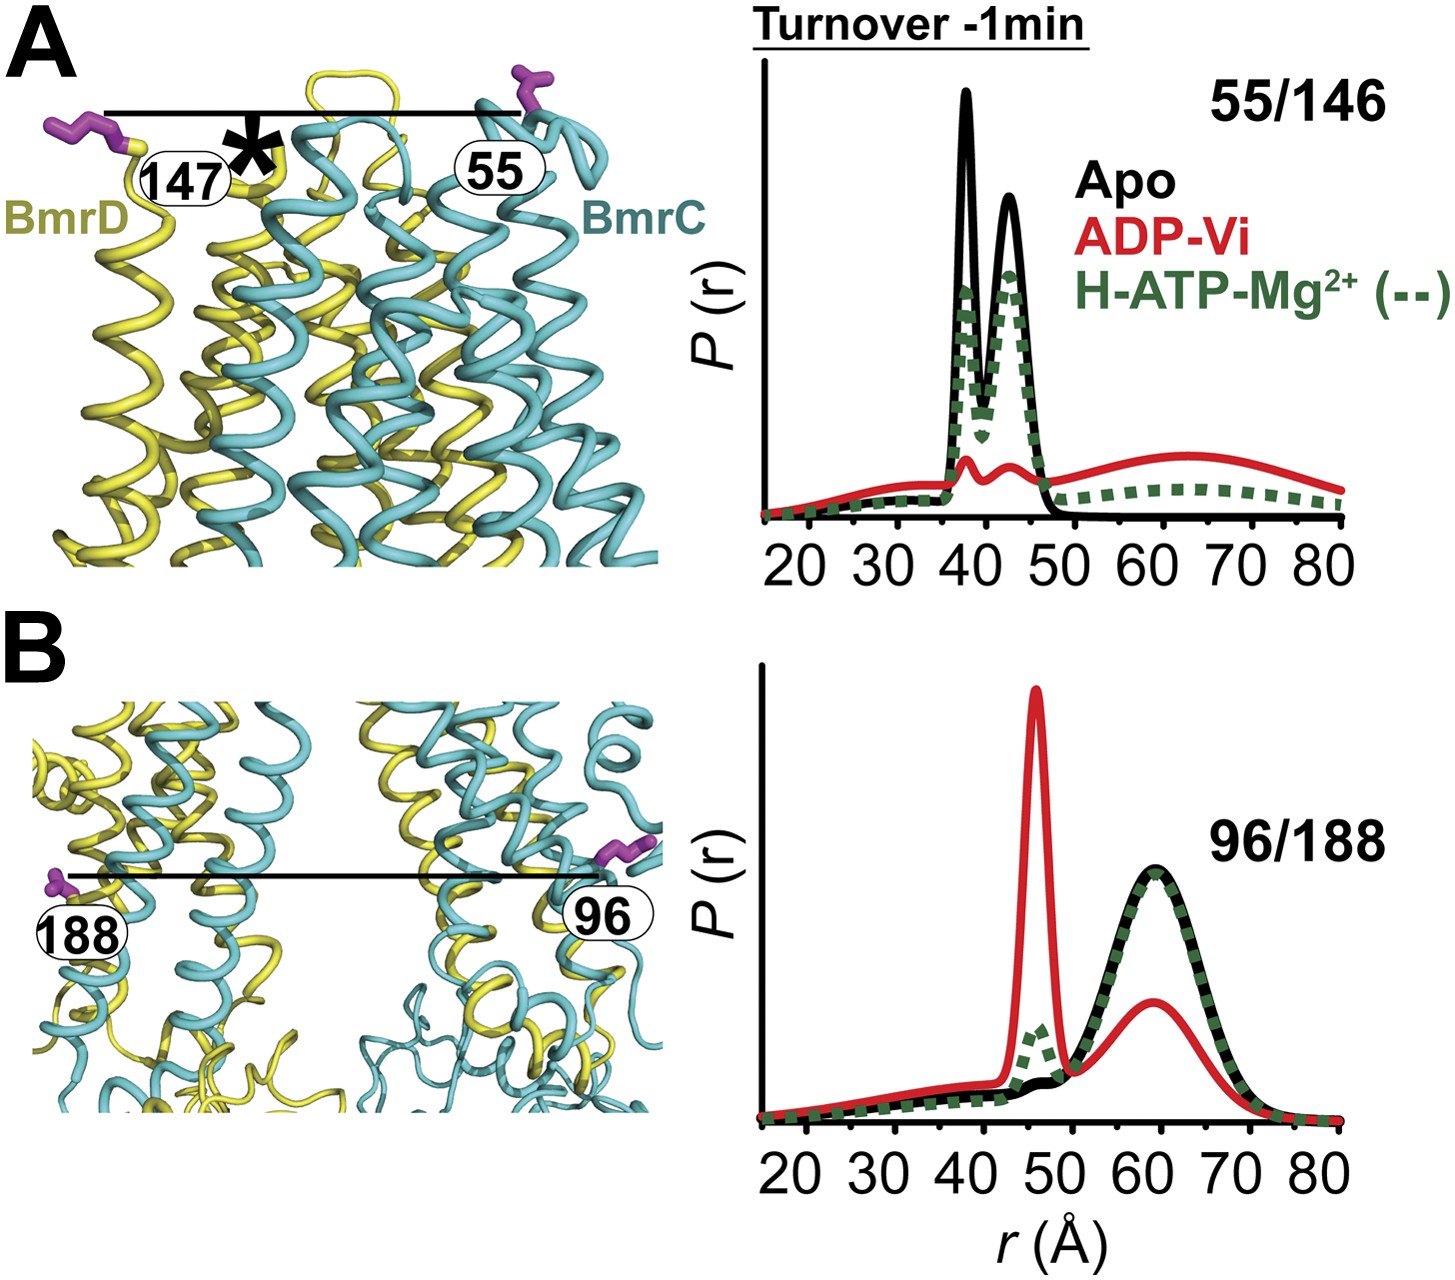
In the presence of excess ATP, the inward-facing state of BmrCD is favored.
Distance distributions of spin label pairs monitoring the (A) extracellular and (B) intracellular side demonstrate that in the presence of 10 mM ATP the predominant population is inward-facing.
Figure 6—figure supplement 1

DEER data analysis for spin-labeled pairs in the TMDs under turnover conditions.
Panels from left to right: location of spin-labeled pairs on BmrCD homology model, baseline-corrected DEER decays along with the fits and the resulting distance distributions.
Figure 7 with 2 supplements

MsbA conformational dynamics under turnover conditions reveal a two-state equilibrium.
(A) Ribbon representation of the AMP-PNP structure of MsbA (PDB:3B60) showing the spin-labeled pairs. (B) Binding of ATP induces the formation of the closed NBD dimer and concomitantly drives the transition to an outward-facing conformation of the TMD (C and D) In the presence of excess ATP, the equilibrium favors the outward-facing conformation (green trace).
Figure 7—figure supplement 1
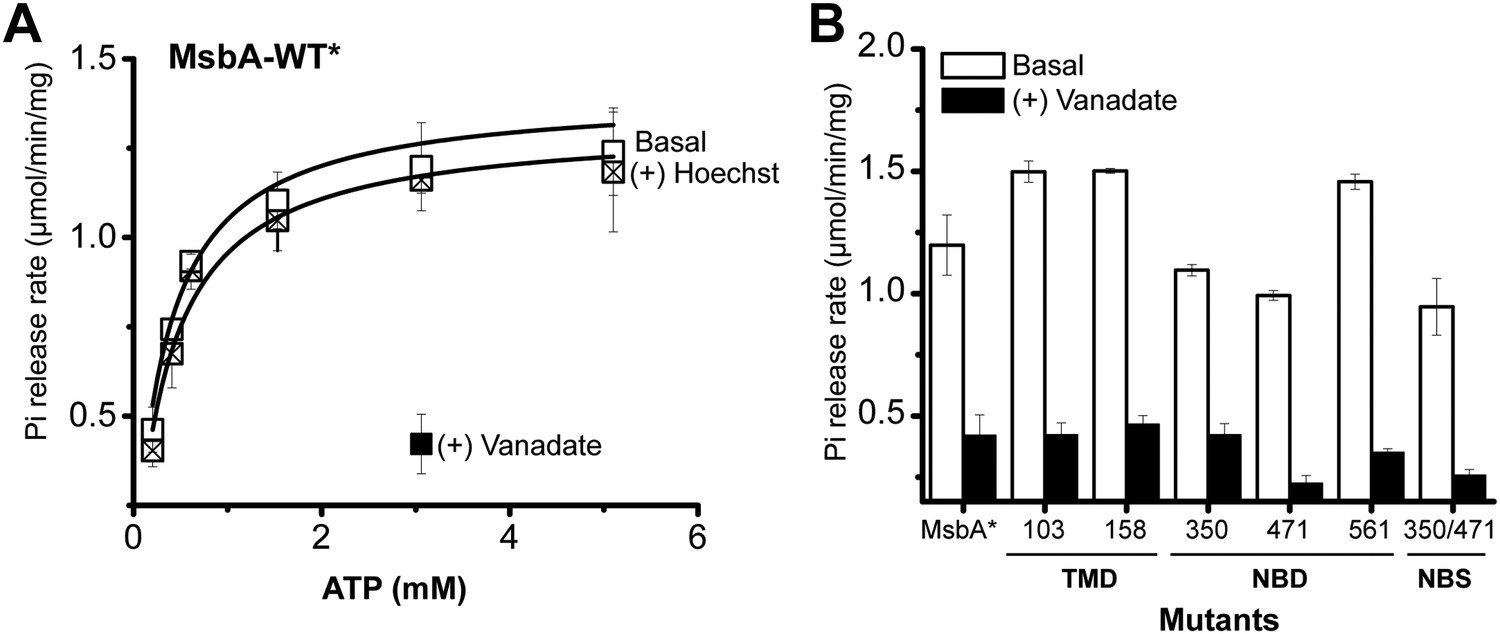
ATPase activity of MsbA.
(A) Hoechst33342 (hereafter referred to as Hoechst) does not stimulate, but vanadate inhibits the ATPase activity of cysteine-less MsbA (MsbA-WT*) and (B) spin label mutants. ATPase activity of MsbA-WT* in the absence and presence of vanadate (1 mM) was measured as described in the methods section. The solid line is a non-linear least-squares fit that yields Vmax (1.32 ± 0.059 µmol/min/mg), Km (0.38 ± 0.06 mM) for MsbA-WT* (basal); Vmax (1.4 ± 0.09 µmol/min/mg), Km (0.33 ± 0.06 mM) for MsbA-WT* (in presence of Hoechst). Vmax and Km values for MsbA-WT* and spin label pairs are derived from three independent measurements.
Figure 7—figure supplement 2
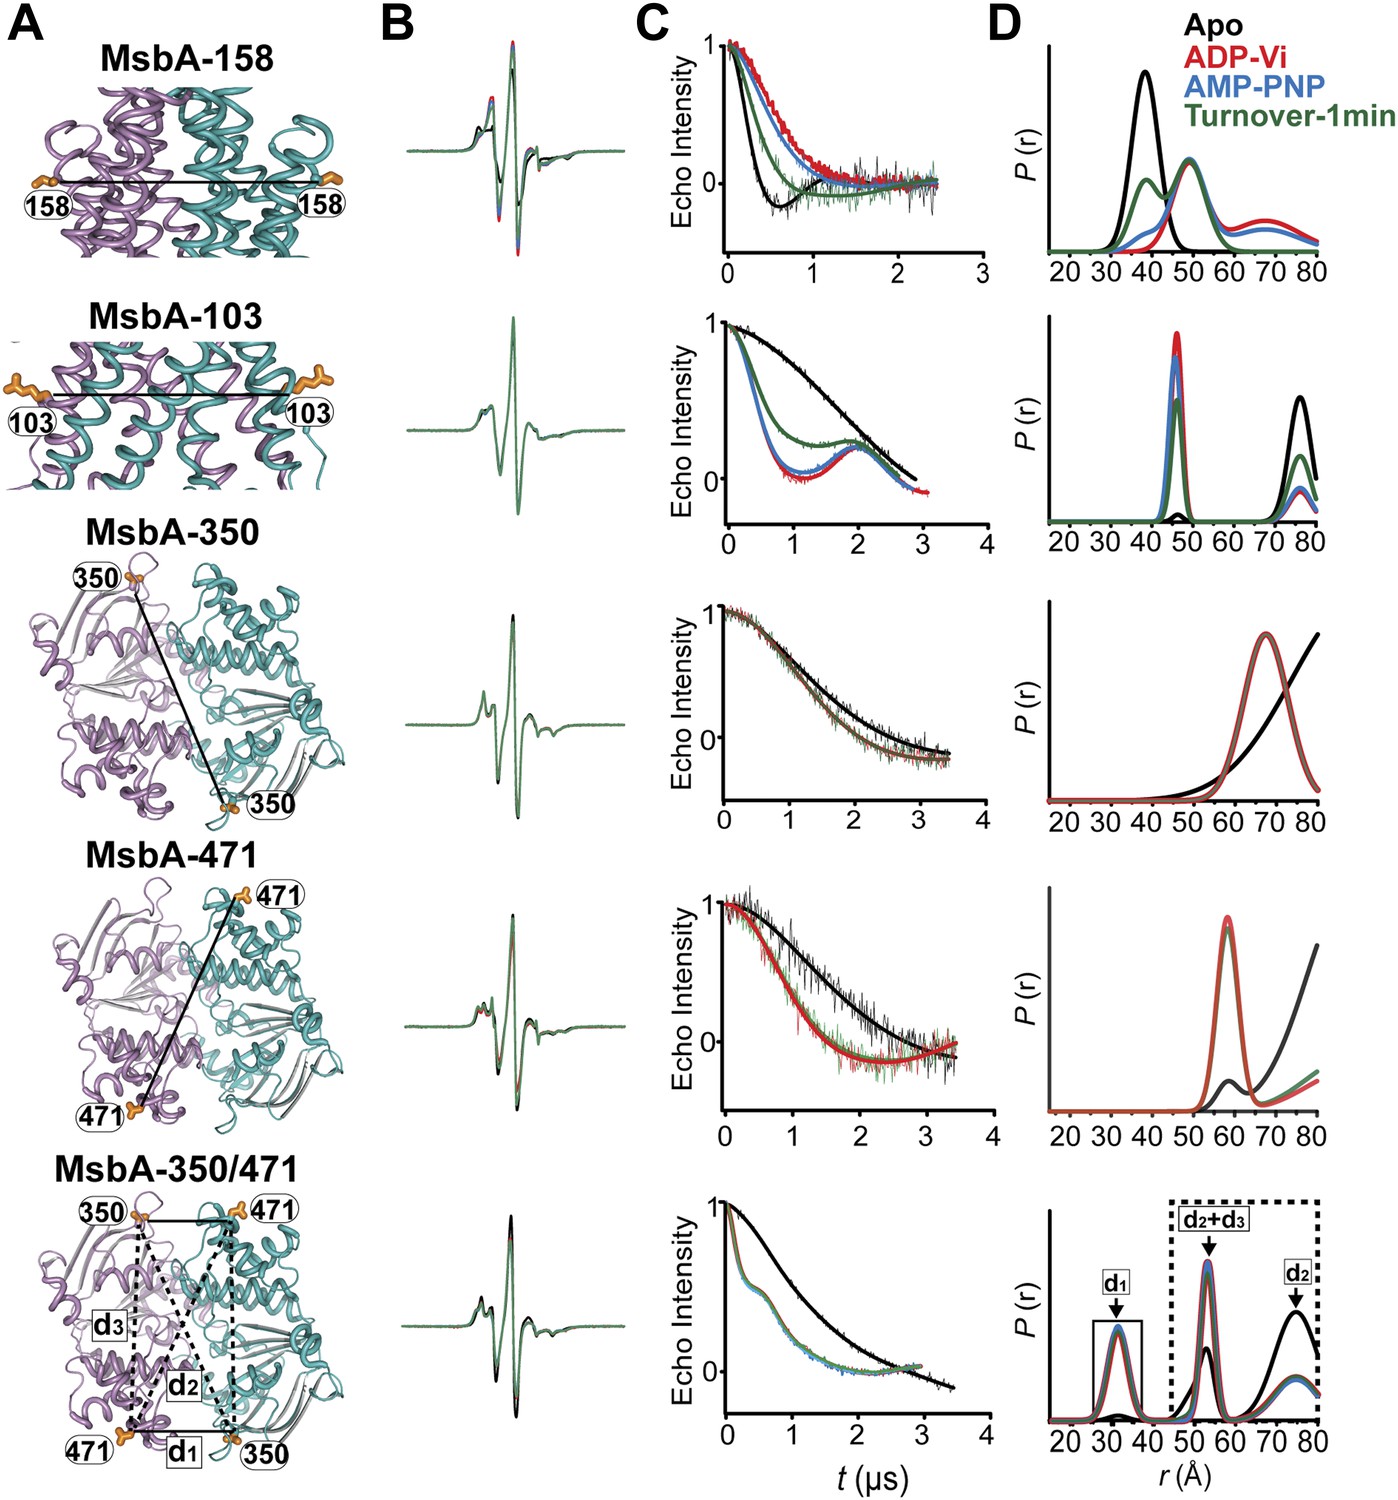
DEER data analysis for spin-labeled pairs.
(A) Ribbon representation of the TMDs and NBDs of MsbA showing the spin label pairs (B) CW-EPR spectra (C) baseline-corrected DEER signals along with the fits and (D) the resulting distance distributions.
Figure 8
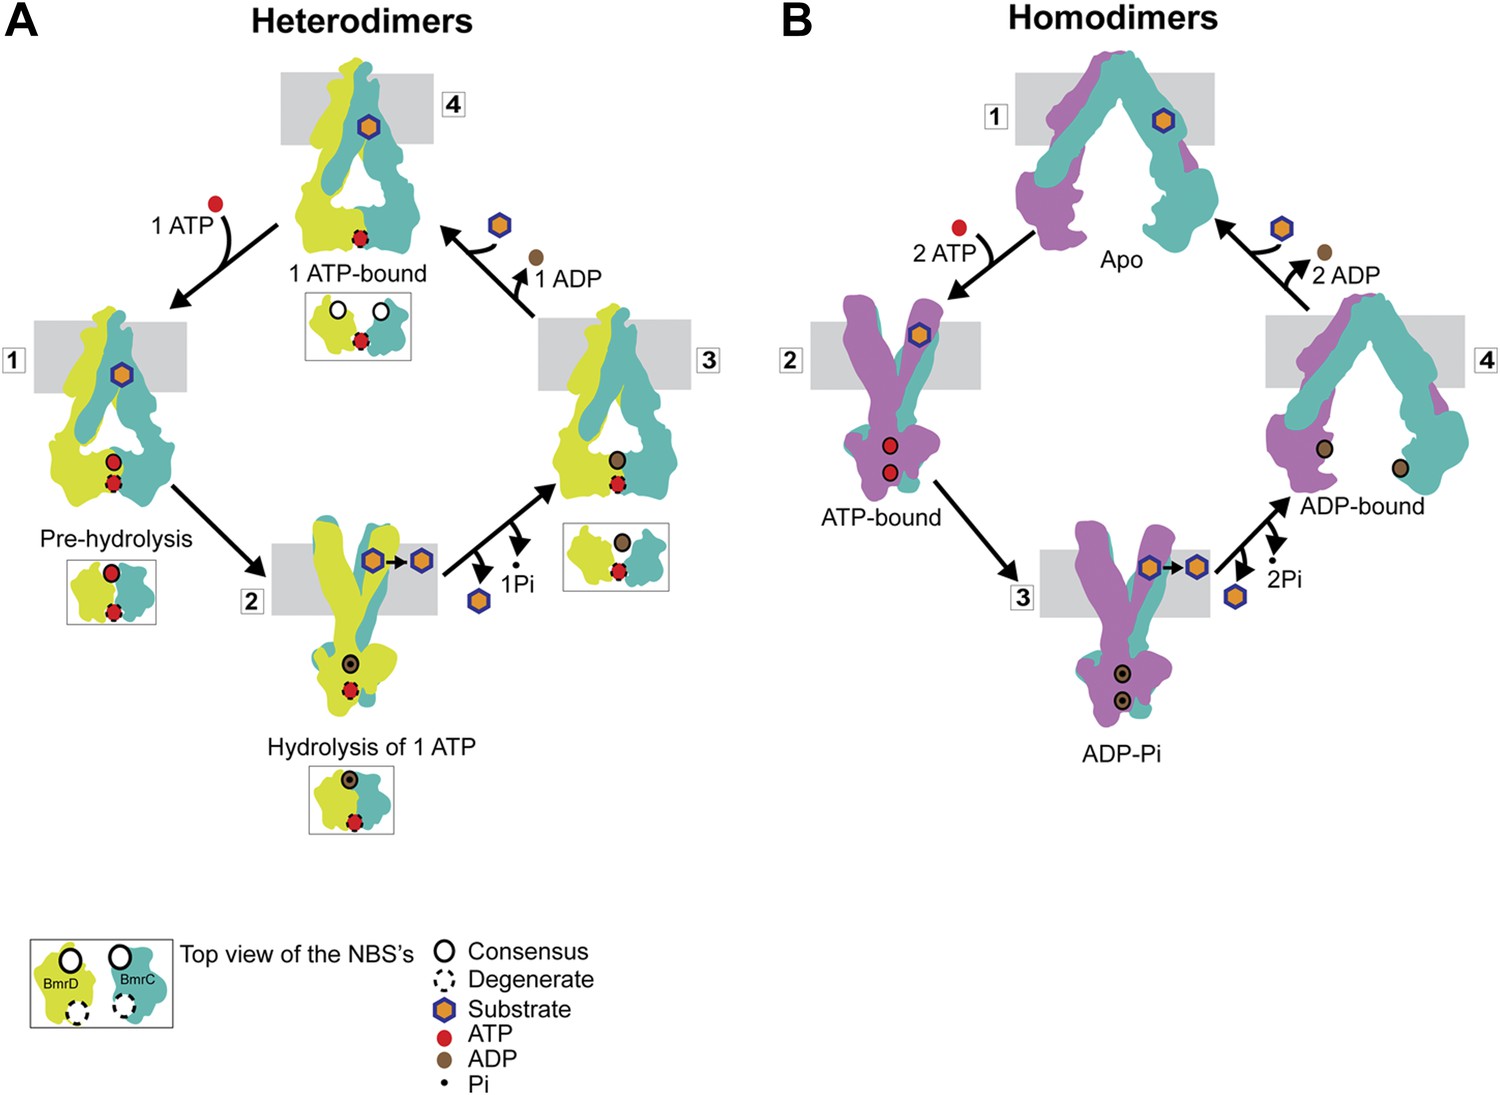
Distinct mechanisms of ABC heterodimers and homodimers.
(A) Asymmetric hydrolysis of ATP in an ABC heterodimer. The conformation of the transporter and a top view of the NBD dimer are shown for each catalytic state. Substrate binding can precede or follow ATP binding to the NBSs. The cycle is triggered when ATP is bound at both NBSs (1). The top view of the NBDs shows the partially engaged ATP-bound intermediate state. Hydrolysis proceeds preferentially at the consensus NBS (2) driving substrate extrusion and leading to another asymmetric state of the NBD wherein the degenerate NBS is ATP-bound while the consensus NBS is ADP-bound (3). Dissociation of ADP occurs via a local apo-like conformation of the consensus NBS (4) thereby enabling a new transport cycle. (B) Two-state cycle of an ABC homodimer. Here substrate must precede ATP binding, which induces the parallel formation of the closed NBD and the outward-facing state of the TMD. Sequence symmetric NBSs hydrolyze two ATP molecules prior to disengagement of the NBDs.
Download links
A two-part list of links to download the article, or parts of the article, in various formats.
Downloads (link to download the article as PDF)
Open citations (links to open the citations from this article in various online reference manager services)
Cite this article (links to download the citations from this article in formats compatible with various reference manager tools)
Conformational dynamics of the nucleotide binding domains and the power stroke of a heterodimeric ABC transporter
eLife 3:e02740.
https://doi.org/10.7554/eLife.02740


