Evidence for a DNA-relay mechanism in ParABS-mediated chromosome segregation
- Yale University, United States
- Microbial Diversity Institute, Yale University, United States
- Howard Hughes Medical Institute, Yale University, United States
- Louisiana State University, United States
- Yale School of Medicine, United States
Figures
Figure 1 with 8 supplements
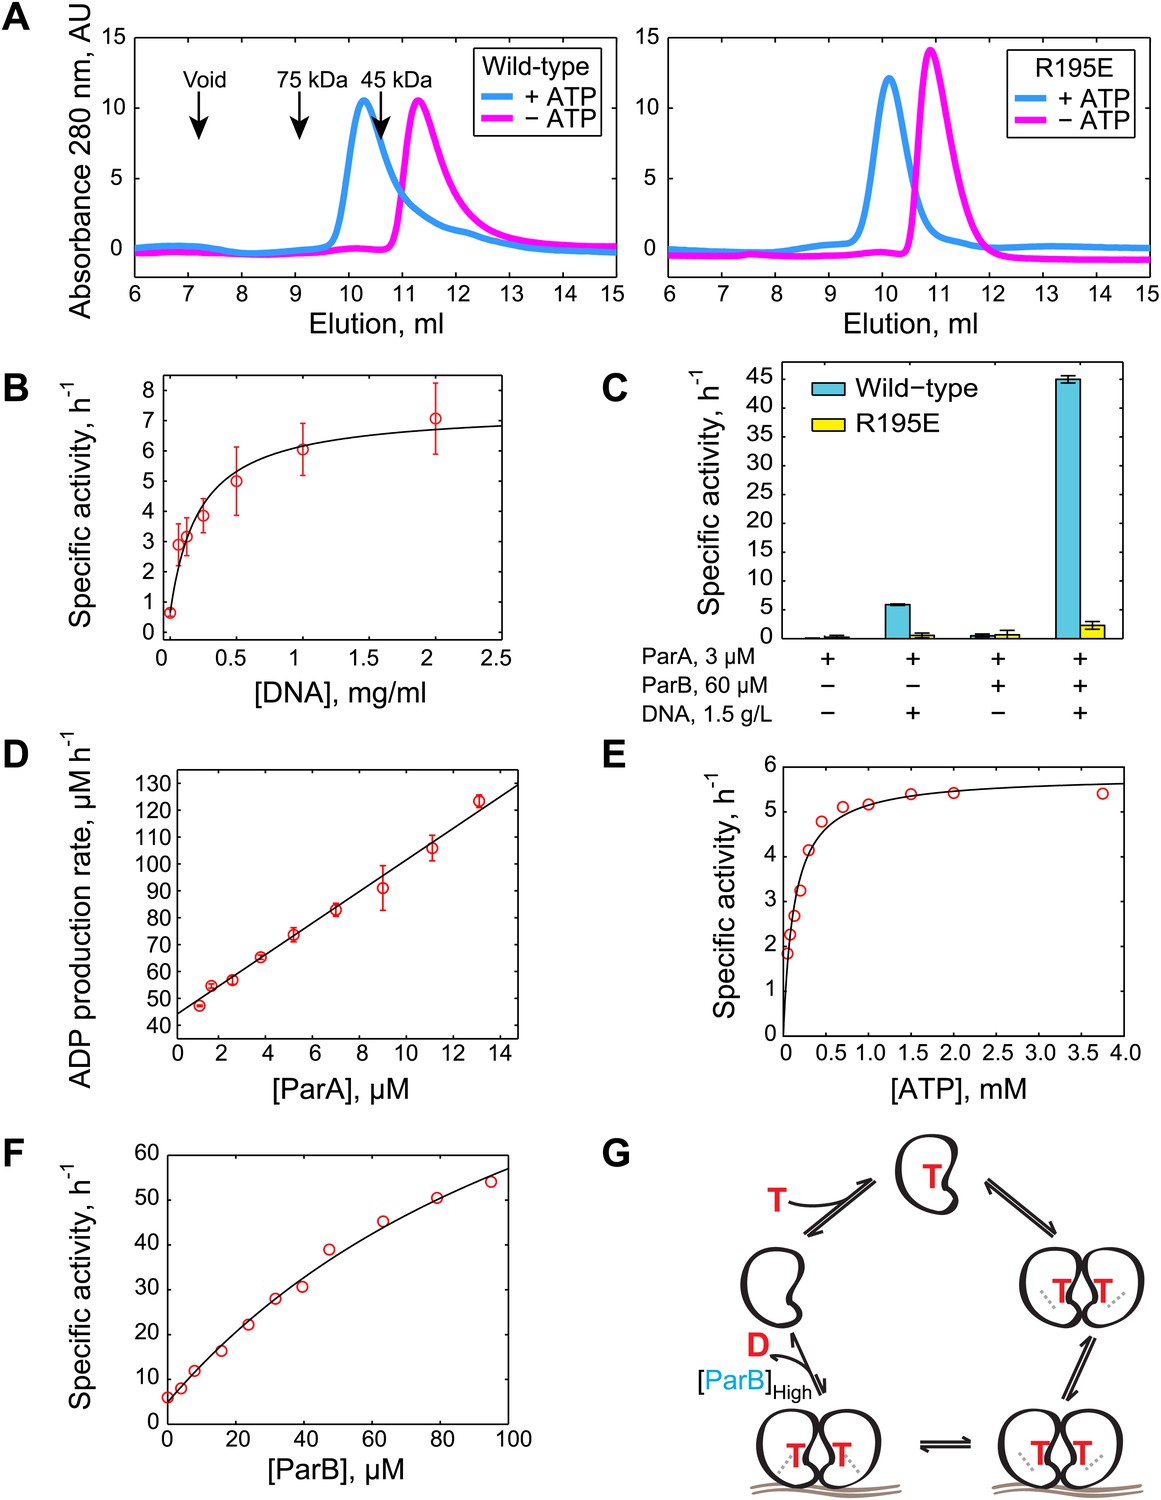
Biochemical analysis of ParA ATPase cycle.
(A) Gel filtration analysis of purified wild-type ParA (left) and DNA-binding deficient mutant ParAR195E (right) in the presence and absence of ATP. (B) Specific activity of ParA (concentration fixed at 6 µM) measured as a function of DNA concentration (0–2.0 mg/ml). Michaelis–Menten equation fit to the data (black) gives KDNA = 0.15 mg/ml. (C) Effects of DNA and ParB on ATPase activities of ParA (cyan) and ParAR195E (yellow). (D) ADP production rate as a function of ParA concentration measured with fixed ATP (2.5 mM) and DNA (1.5 mg/ml) concentrations. Linear fit to the data (black line) gives kcat = 5.8 hr−1. (E) Dependence of ATPase activity of ParA upon ATP concentration measured with fixed ParA (10 µM) and DNA (1.5 mg/ml) concentrations. Fitting the Michaelis–Menten equation (black line) gives kcat = 5.9 hr−1 and KM = 150 µM. (F) Dependence of ParA (3 µM) ATPase activity on ParB concentrations. Michaelis–Menten equation fit to the data (black line) gives kcat = 120 hr−1 and KM = 80 µM. (G) Model of ParA ATPase cycle. ATP-binding promotes ParA dimerization. Upon binding DNA, ParA-ATP dimers presumably adopt an ATP-hydrolysis competent state. A high concentration of ParB is required to stimulate ATP hydrolysis of DNA-associated ParA-ATP dimers. The cycle reinitiates through nucleotide exchange. SDS-PAGE images showing the purity of the purified protein preparations and the results from experiments comparing the stimulatory effects of wild-type (WT) ParB and mutant ParBL12A on ParA ATPase activity are presented in Figure 1—figure supplements 1 and 2. Experiments performed to correlate the biochemical activities measured in vitro with in vivo conditions are presented in Figure 1—figure supplements 3–8.
Figure 1—figure supplement 1
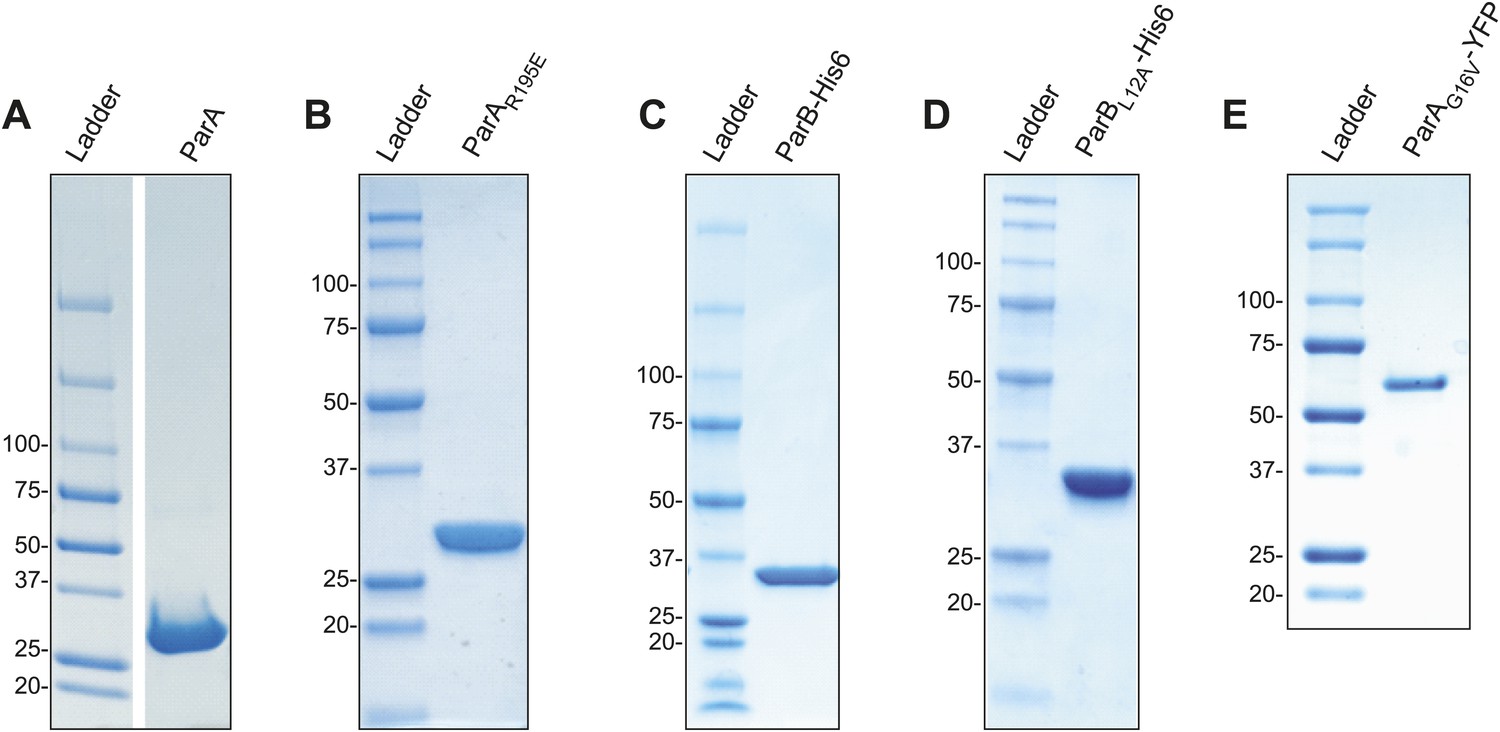
SDS-PAGE analysis of purified protein preparations used in this study.
(A) ParA, (B) ParAR195E, (C) ParB-His6, (D) ParBL12A-His6, and (E) ParAG16V-YFP. Approximately 5–15 µg of proteins were loaded in each lane.
Figure 1—figure supplement 2
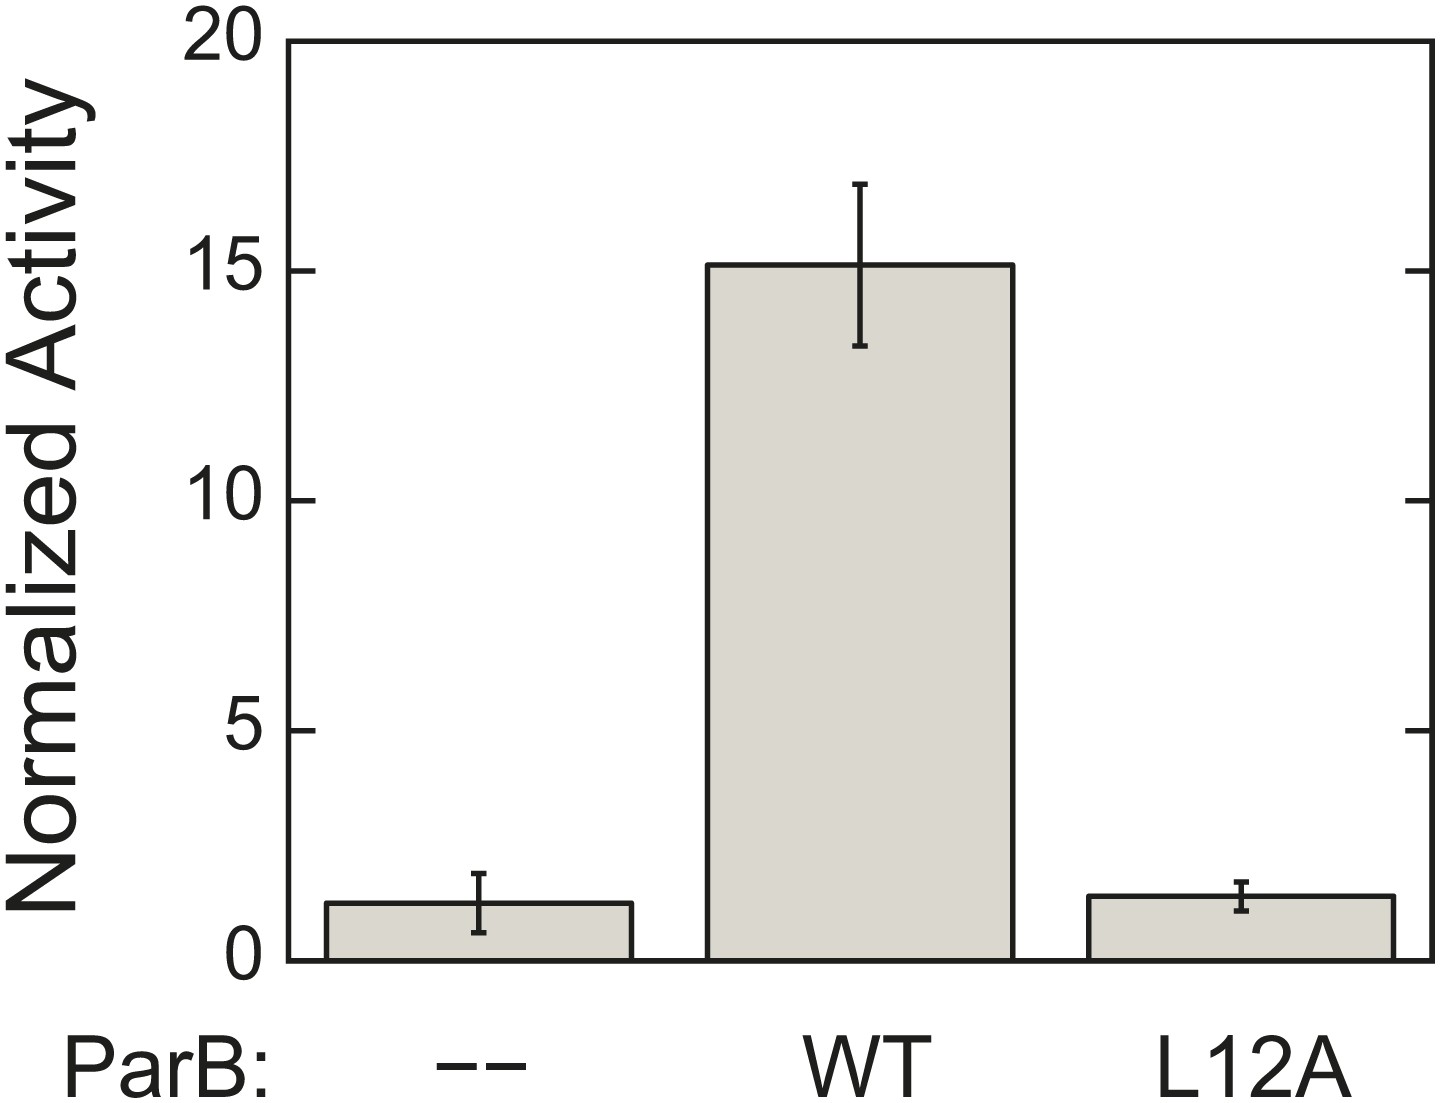
L12A mutation, which prevents ParA–ParB interaction, severely compromises ParB ability to activate ParA ATPase activity.
ATPase rates were measured from reactions containing 3 µM ParA and 1.5 mg/ml salmon sperm DNA in the absence or presence of 90 µM of either wild-type ParB or ParBL12A. The measured rates were compared to the rate of the reaction lacking ParB. Error bars represent the standard deviations (SD) of results measured in duplicates.
Figure 1—figure supplement 3
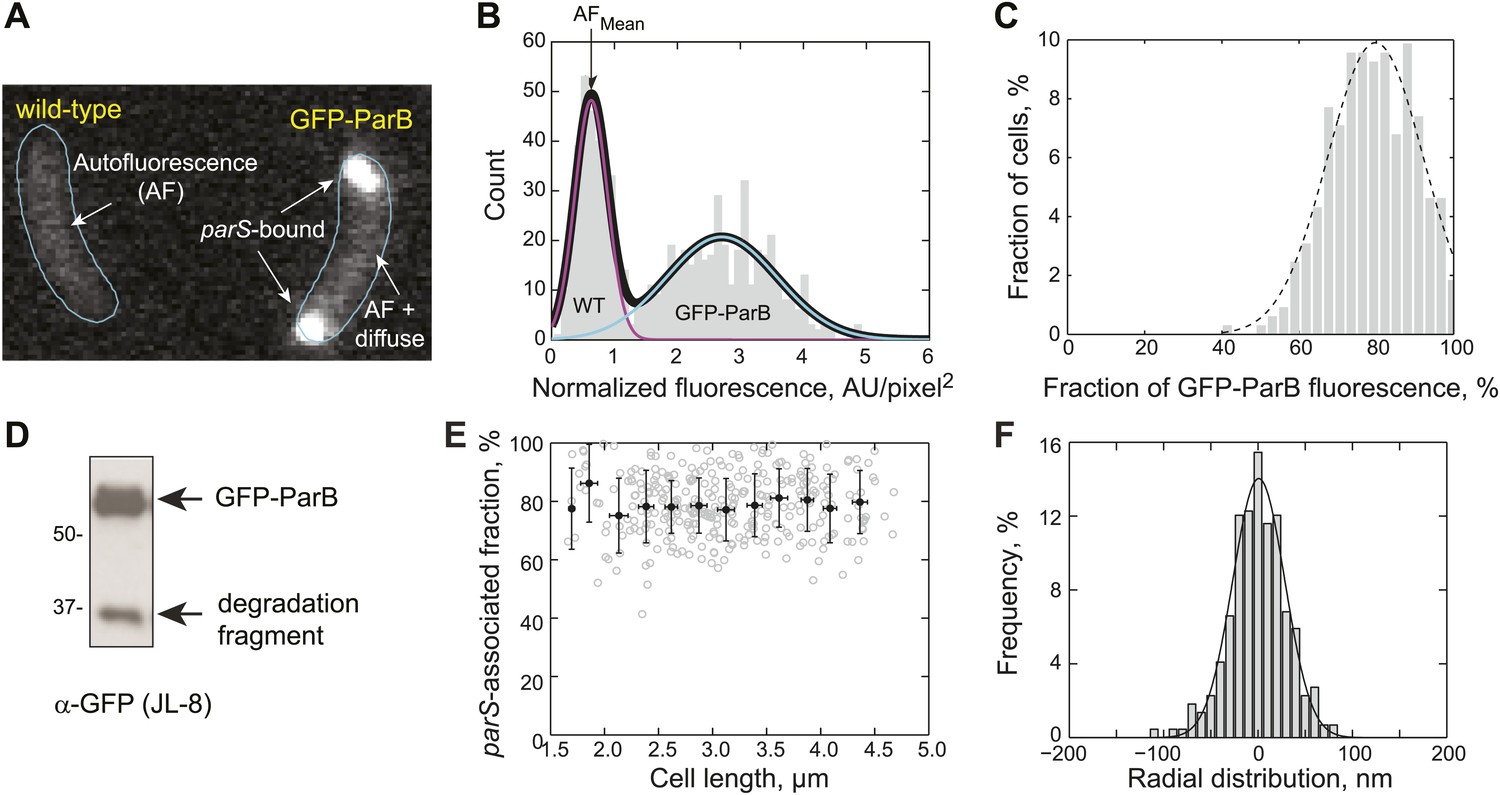
Measurement of GFP-ParB distribution at the subcellular level.
(A) Representative fluorescence image showing autofluorescence in wild-type (CB15N) cells and subcellular distribution of GFP-ParB fluorescence in MT174 cells, which produce GFP-ParB from the native parB promoter on the chromosome as the only ParB copy. (B) Single-cell total fluorescence and cell areas were quantified using MicrobeTracker and a histogram of normalized fluorescence (total fluorescence divided by cell area) is shown. The two-peak distribution was fit by a bimodal Gaussian (black), representing fluorescence detected in two populations of cells: wild-type (magenta) and GFP-ParB-producing cells (cyan). The mean of the magenta curve was designated as the mean normalized autofluorescence (AFmean), which was used for background subtraction. (C) Histogram showing the fraction of GFP-ParB associated with parS in single cells. The experimental distribution (grey) was fitted with a Gaussian function (dashed black curve), giving an average of 80% ParB molecules associated with the partition complex. (D) Western blot of a lysate made from an MT174 culture using an anti-GFP monoclonal antibody (JL-8) or an anti-ParB polyclonal antibody (data not shown). GFP-ParB and a degradation fragment were detected. (E) The fraction of GFP-ParB fluorescence associated with parS stays constant as a function of cell length. Single-cell raw data (grey circles) and average fraction GFP-ParB fluorescence associated with parS (black circles) ± SD across 0.25 μm intervals are shown. (F) Subcellular volume occupied by a ParB/parS complex as determined by PALM microscopy. mEos3.2-ParB synthesis in CJW4978 cells was induced with 0.03% xylose for 1 hr in M2G before imaging using PALM. Fluorescent emitters within six polar partition complexes were analyzed. The histogram was fitted with a Gaussian function with σ = 39 nm (solid line). Radial distribution of mEos3.2-ParB from the foci were then combined and plotted as a histogram (n = 440 localizations). This means that 95% of the molecules were localized within 78 nm (2σ) from the center of the spot. We used 78 nm as the radius of the spherical volume occupied by ParB dimers within a partitioning complex. Such a sphere occupied a volume of 2 × 10⁻³ fL.
Figure 1—figure supplement 4
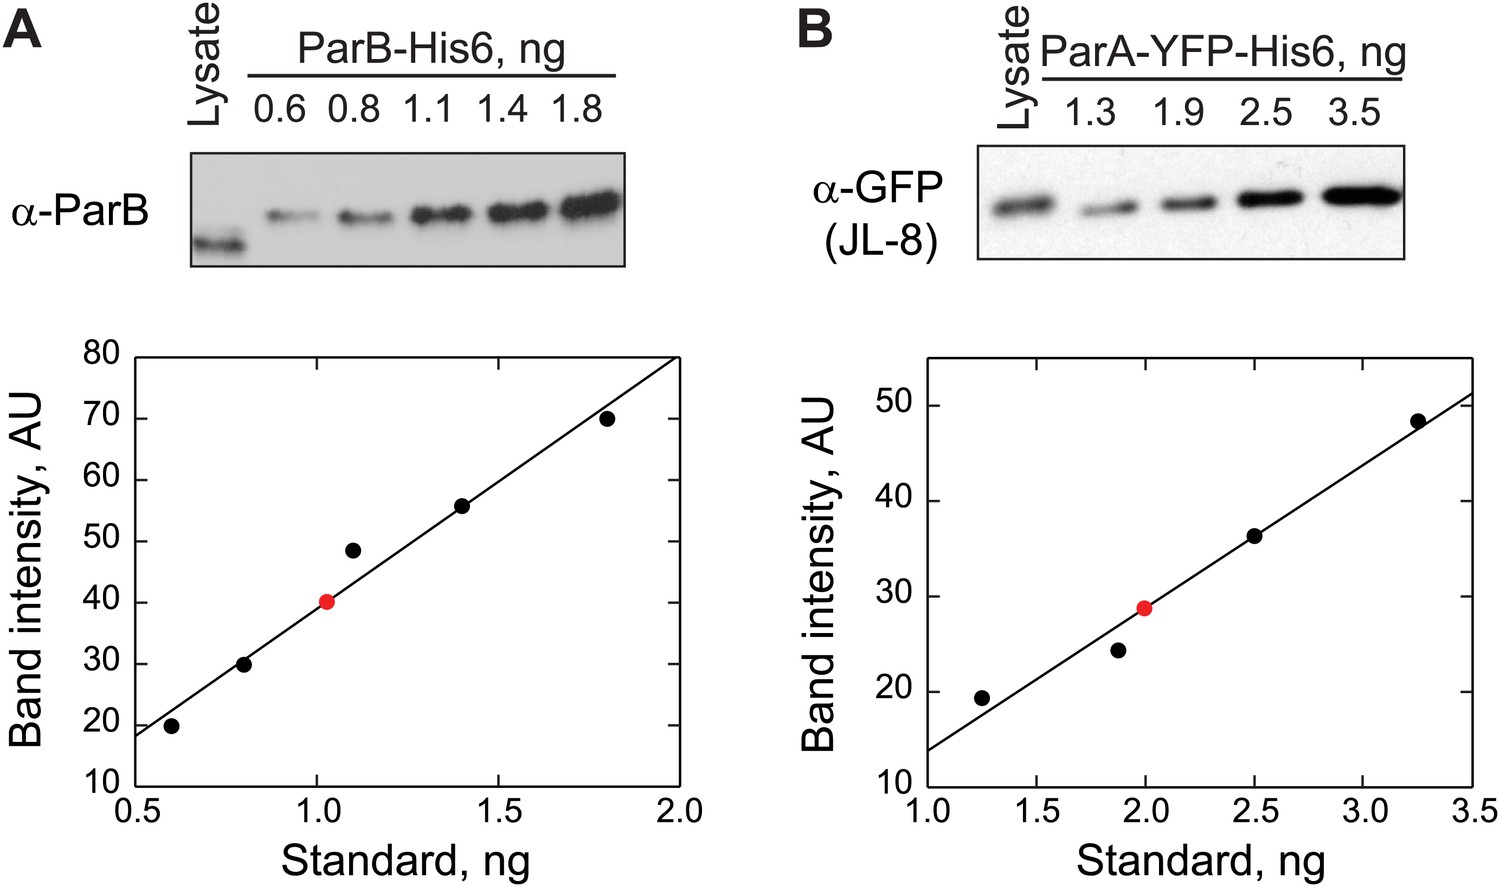
Quantification of ParB and ParA abundance in cell lysates by quantitative Western blotting.
(A) Top, a Western blot of a wild-type swarmer cell lysate (CB15N producing endogenous ParB) and indicated amounts of purified ParB-His6 using a polyclonal antibody against ParB. Bottom, the optical densities (OD) of the bands corresponding to ParB-His6 standards were quantified (black circles) and were fit by a linear function (black line). The amount of ParB in the cell lysate (red circle) was calculated from the calibration. This measurement was repeated twice. The number of ParB per cell was calculated using this formula: ParB molecules per cell. (B) Top, a Western blot of a swarmer cell lysate of CJW3010 strain (in which parA-yfp replaces parA at the native location in the chromosome) and indicated amounts of purified ParAG16V-YFP-His6 using a monoclonal antibody against GFP (JL-8). Bottom, the ODs of the bands corresponding to ParAG16V-YFP-His6 standards were quantified (black circles) and fit with a linear function to create a calibration curve (black line). Red circle represents the calculated amount of ParA-YFP in the cell lysate. This measurement was repeated three times. The number of ParA-YFP per cell was calculated using the formula ParA-YFP molecules per cell.
Figure 1—figure supplement 5
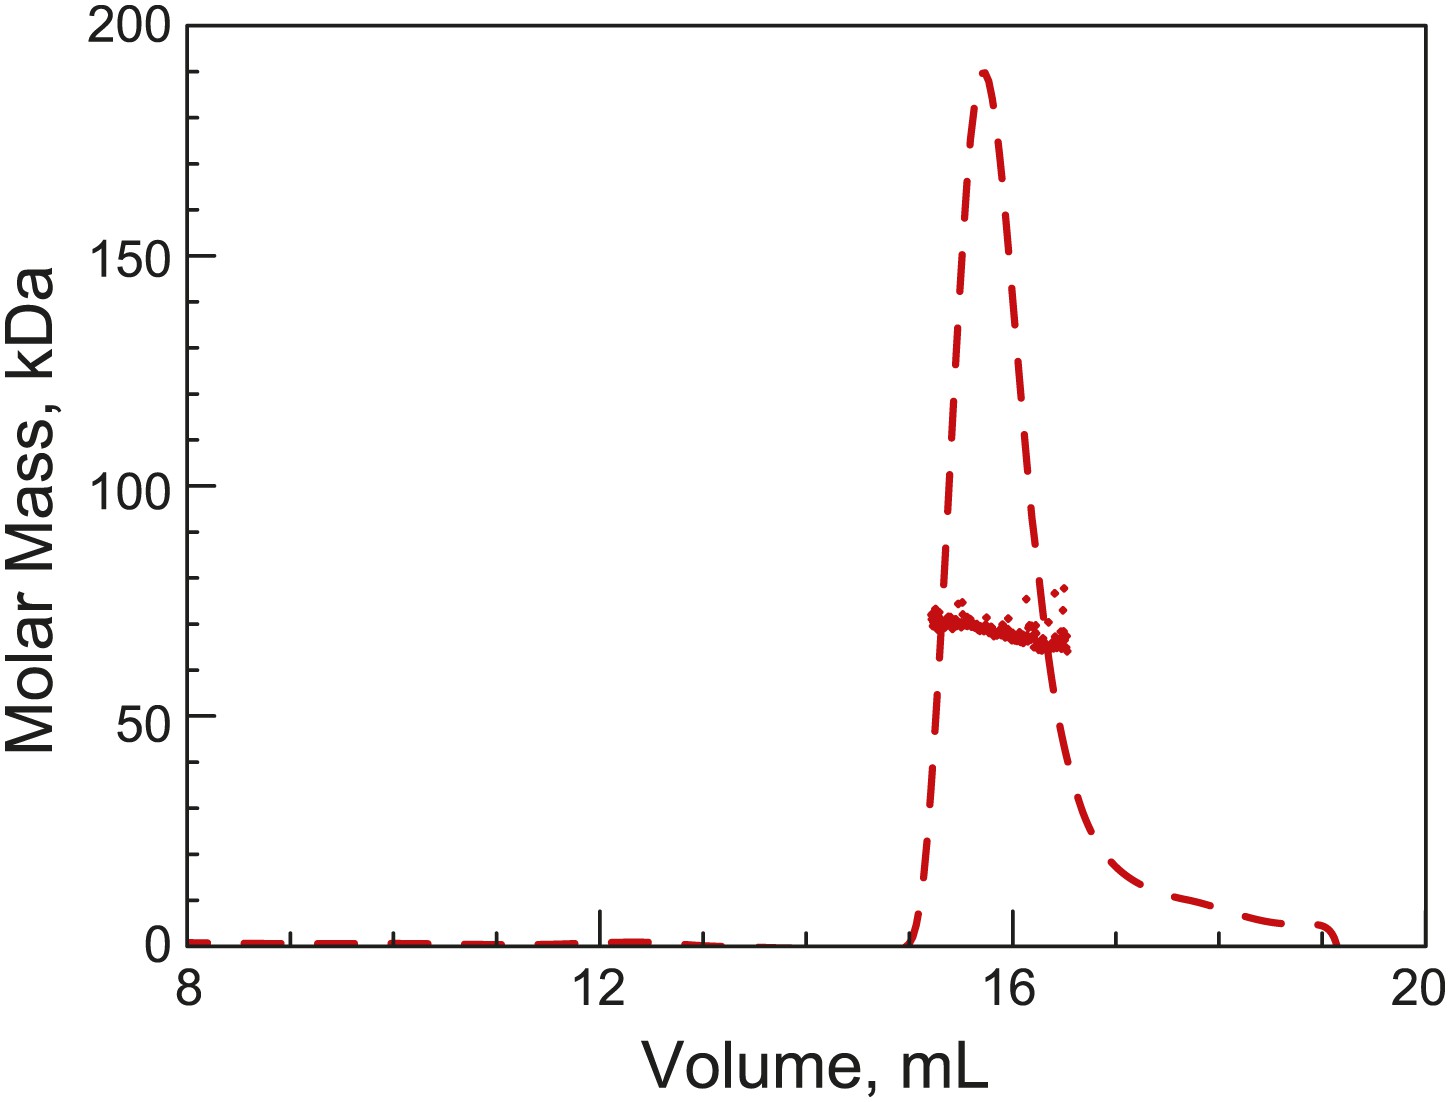
His6-ParB forms a dimer in solution.
Purified His6-ParB was subjected to HPLC size exclusion chromatography (SEC) coupled with UV, on-line laser light scattering (LS) and refractive index (RI) detectors (SEC-UV/LS/RI) to measure its absolute MW. The dashed lines indicate the elution profile of His6-ParB from an RI detector while the dots are MW calculated from LS measurements at 1-s intervals. The MW measurement showed an average MW of 69 kDa, which is consistent with His6-ParB (monomeric MW = 34 kDa) forming a dimer in solution under this experimental condition.
Figure 1—figure supplement 6
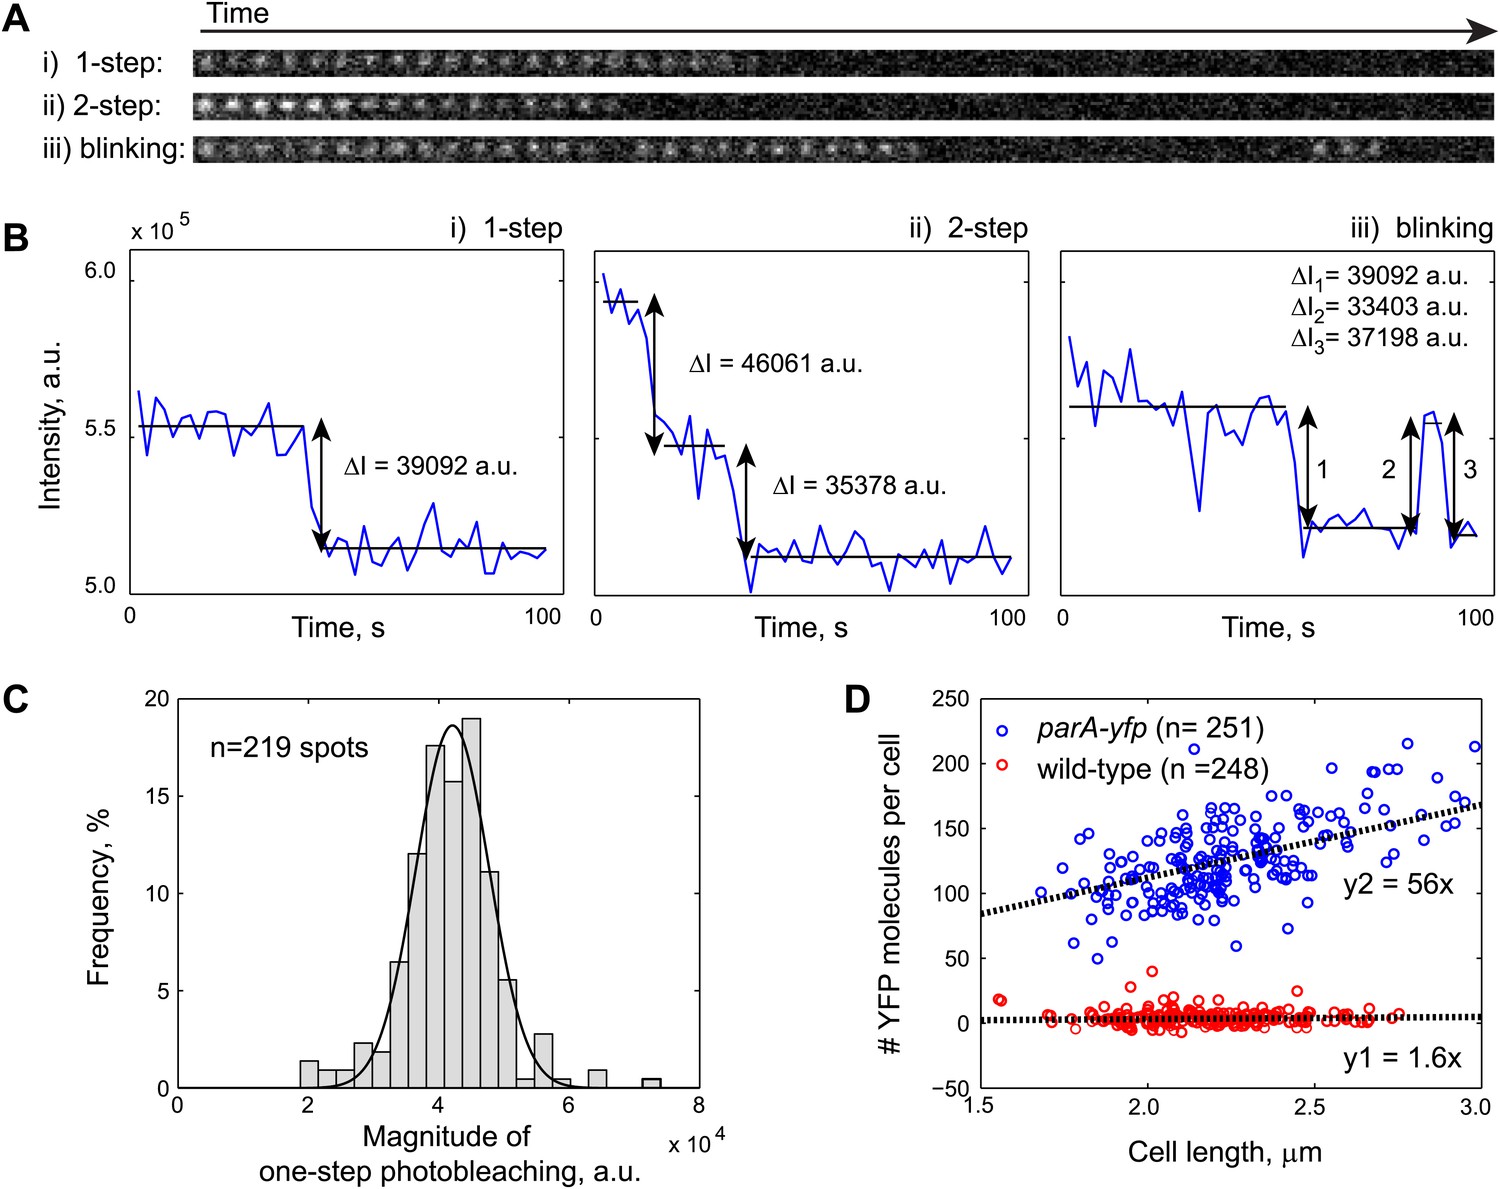
Fluorescence-based quantification of ParA-YFP abundance in C. crescentus cells.
Purified ParAG16V-YFP-His6 molecules were immobilized on a poly-Lysine-coated cover slip and imaged by stream acquisition using 2-s integration time. ParAG16V-YFP-His6 molecules were observed as immobile diffraction-limited spots. Shown in (A) are time lapse sequences representing the three most observed spot behaviors: (i) one-step photobleaching, (ii) two-step photobleaching and (iii) blinking. (B) Intensity profiles of single diffraction-limited spots shown in (A) showing 1-step photobleaching, 2-step photobleaching and blinking of YFP molecules. ΔI was calculated as the difference between the averaged fluorescence intensities before and after each stepwise photobleaching. (C) Histogram showing the magnitude of fluorescence loss following 1-step photobleaching (n = 219). The mean of a Gaussian fit to the histogram gives the fluorescence value of a single YFP molecule. (D) Number of YFP molecules per cell as a function of cell length. Swarmer cells from CJW3010 strain, which expresses parA-yfp from the native promoter of parA, were imaged on the same pad as wild-type swarmer cells. The number of YFP molecule per cell was calculated by dividing single-cell YFP fluorescence values by single YFP fluorescence. The cells were color-coded based on the YFP count using 50 as a cut-off (blue: parA-yfp-expressing cells, n = 251; red: wild-type, n = 248). The black lines represent linear fits to the red (y1 = 1.6x; autofluorescence in wild type cells on average equals to 1.6 YFP molecules per 1 µm cell length) and blue (y2 = 56x; fluorescence in parA-yfp cells on average equals to 56 YFP molecules per 1 µm cell length) data points, respectively. Typically, C. crescentus is ∼2.3 µm in length when parS translocation commences. Thus, there are 2.3 × (56–1.6) = 120 ParA-YFP molecules at the beginning of parS translocation.
Figure 1—figure supplement 7
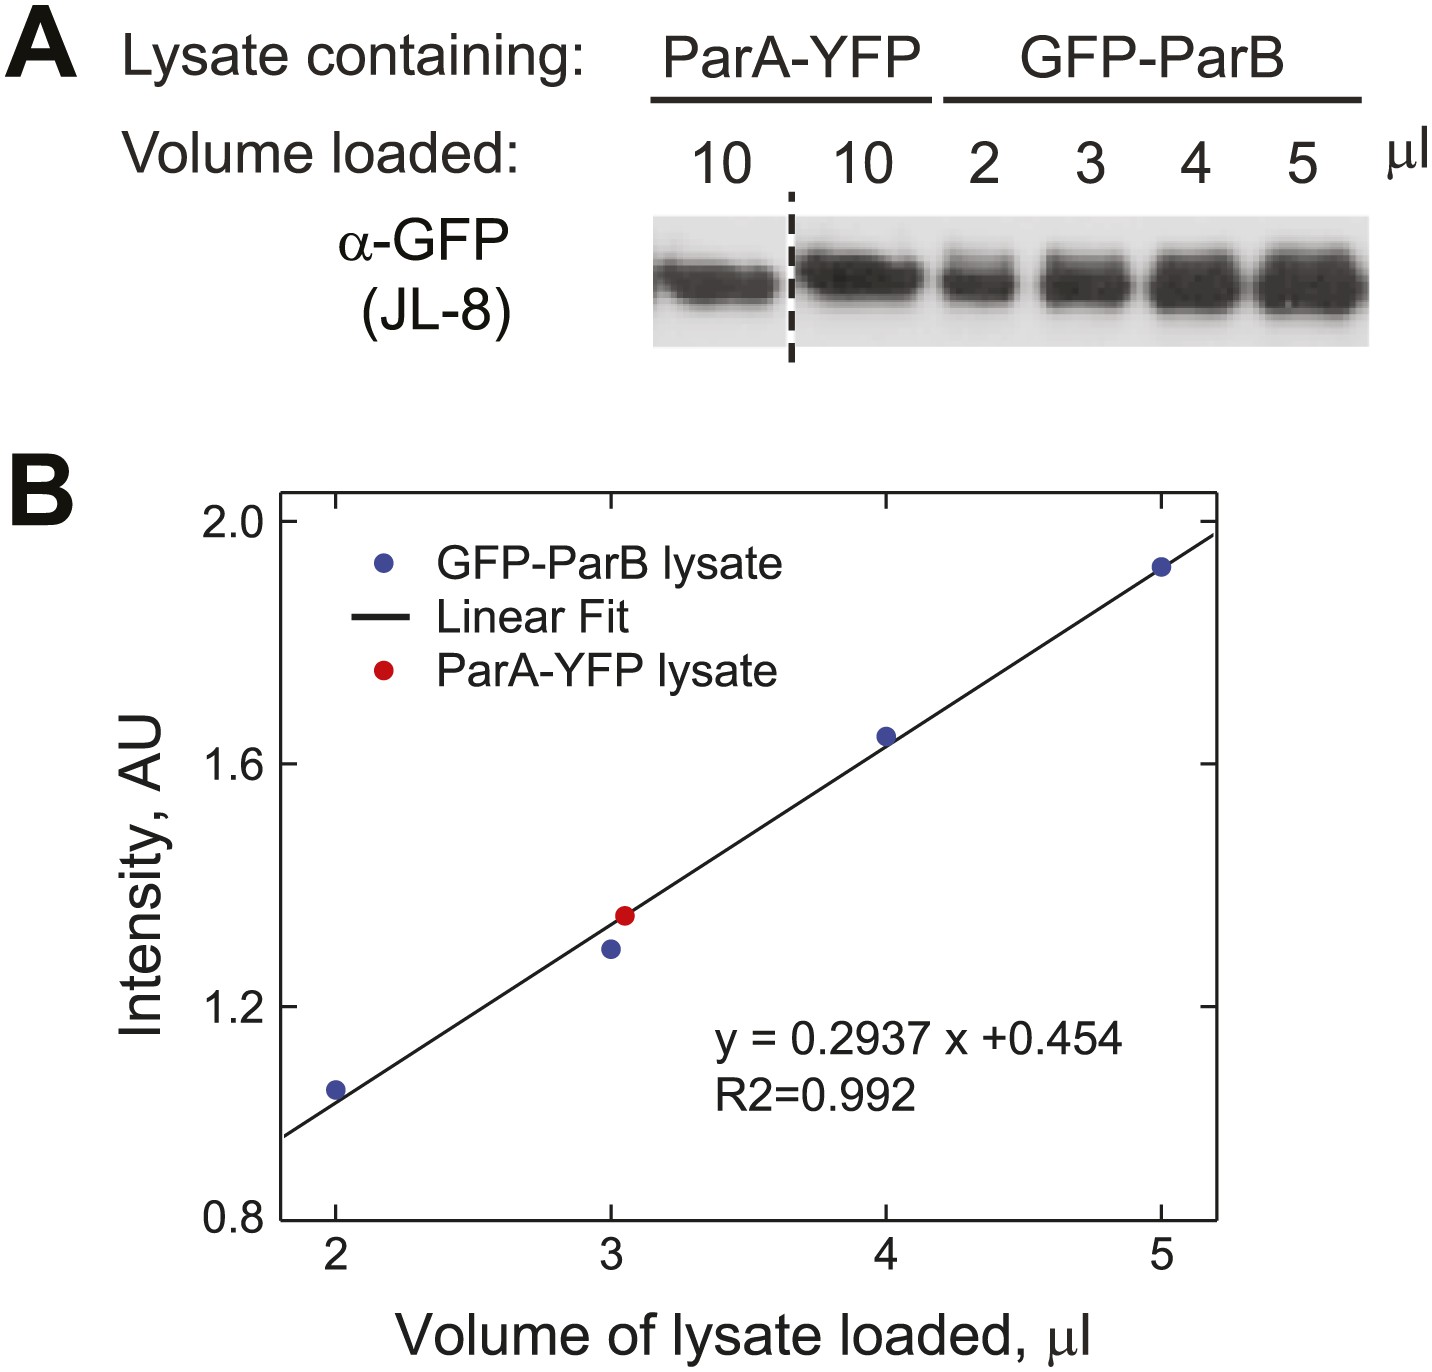
Estimation of the relative abundance of ParA and ParB in vivo.
(A) Cultures (1.5 ml) of CJW3010 (parA-yfp-expressing) and MT174 (gfp-parB-expressing) cells at OD660 = 0.25 were harvested and lysed by boiling in equal volumes of SDS buffer followed by sonication. Duplicates of 10 µl ParA-YFP lysate were resolved on the same gel as GFP-ParB lysates (in varied volumes as indicated) and subjected to Western blot analysis using the JL-08 monoclonal α-GFP antibody (Clontech). The first lane separated by the dashed line was moved from a different region of the same blot for easier comparison. (B) All bands were quantified using ImageJ and the intensities of the GFP-ParB bands were plotted as a function of volume of lysate loaded. The solid line represents the best linear fit, which we used to calculate that 10 µl of ParA-YFP lysate (the red dot represents the mean intensity of two lanes on the same blot) contained approximately the same amount of GFP fusion molecules as those in ∼3 µl of GFP-ParB lysate. In other words, assuming that YFP/GFP fusions do not affect protein levels, the ParA:ParB ratio in swarmer/early stalked cell stage is approximately 1:3. This method estimated that there are 720 ÷ 3 = 240 ParA molecules per cell.
Figure 1—figure supplement 8
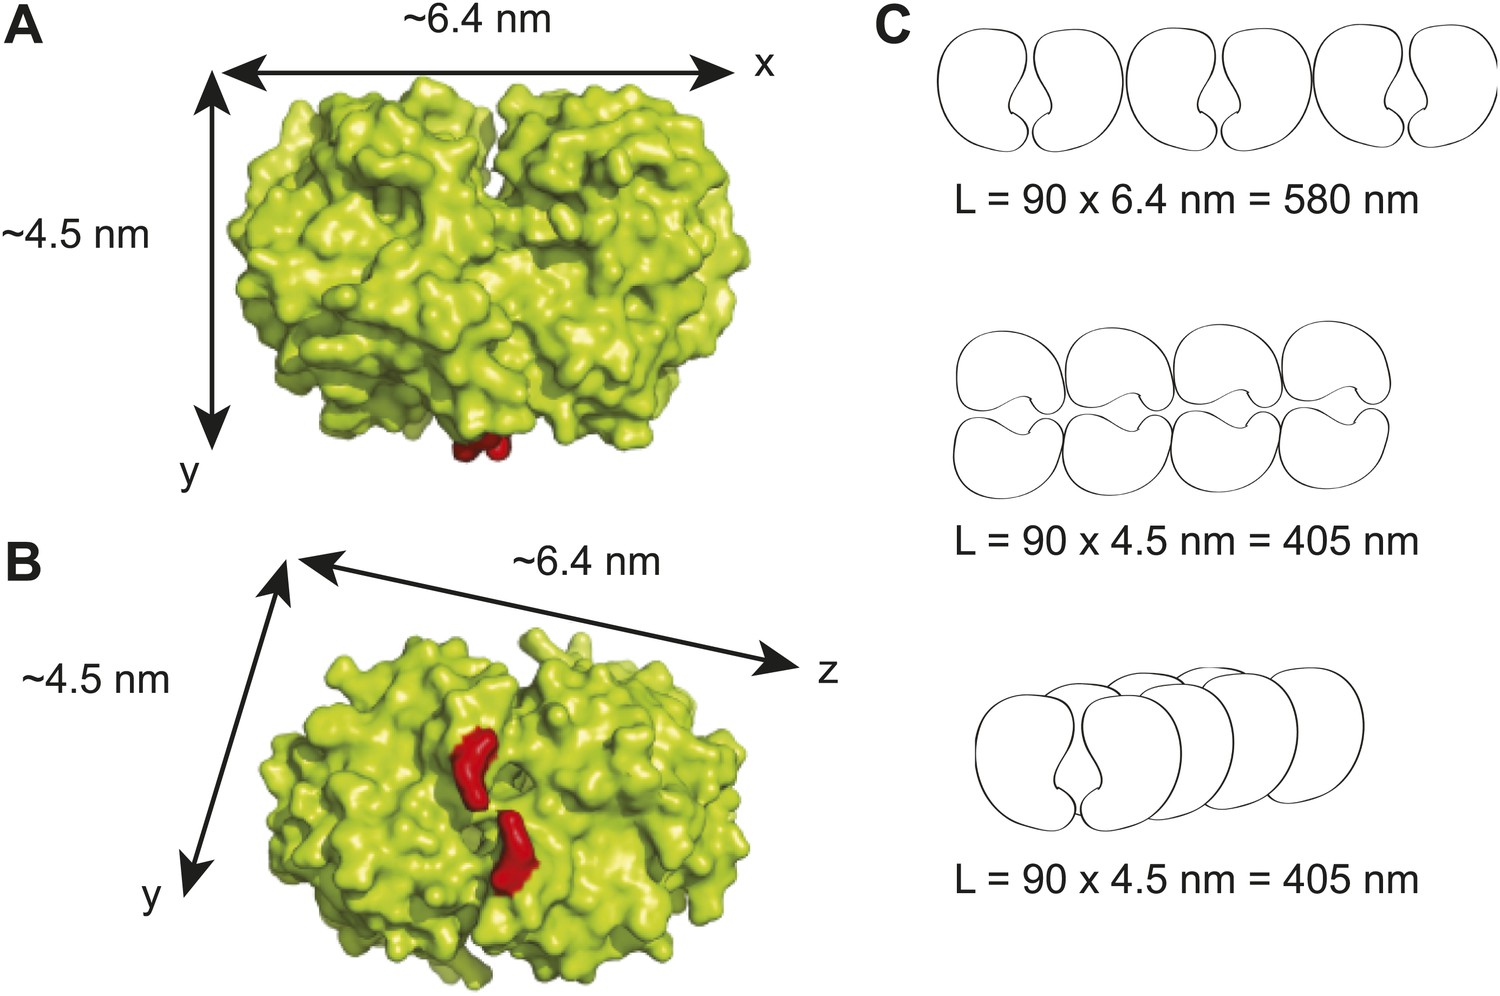
Maximum lengths of different possible ParA polymer configurations.
(A) A surface representation of the Thermus thermophilus Soj dimer crystal structure showing the dimensions of the dimer along the x- and y- axes (Leonard et al., 2005). The red areas represent the positions of arginine 182 which corresponds to arginine 195 in C. crescentus ParA and which has been shown to be critical for DNA-binding (Ptacin et al., 2010; Schofield et al., 2010). (B) Bottom view of the T. thermophilus Soj dimer showing the dimensions of the dimer along the x- and z- axes. (C) Three possible polymer configurations considering polymerization along the x-, y- and z-axes of a ParA dimer. The maximal achievable length of each polymer (L) was calculated as the product of the physiological abundance of ParA (90 dimers) and the unit length of a ParA dimer along each axis.
Figure 2
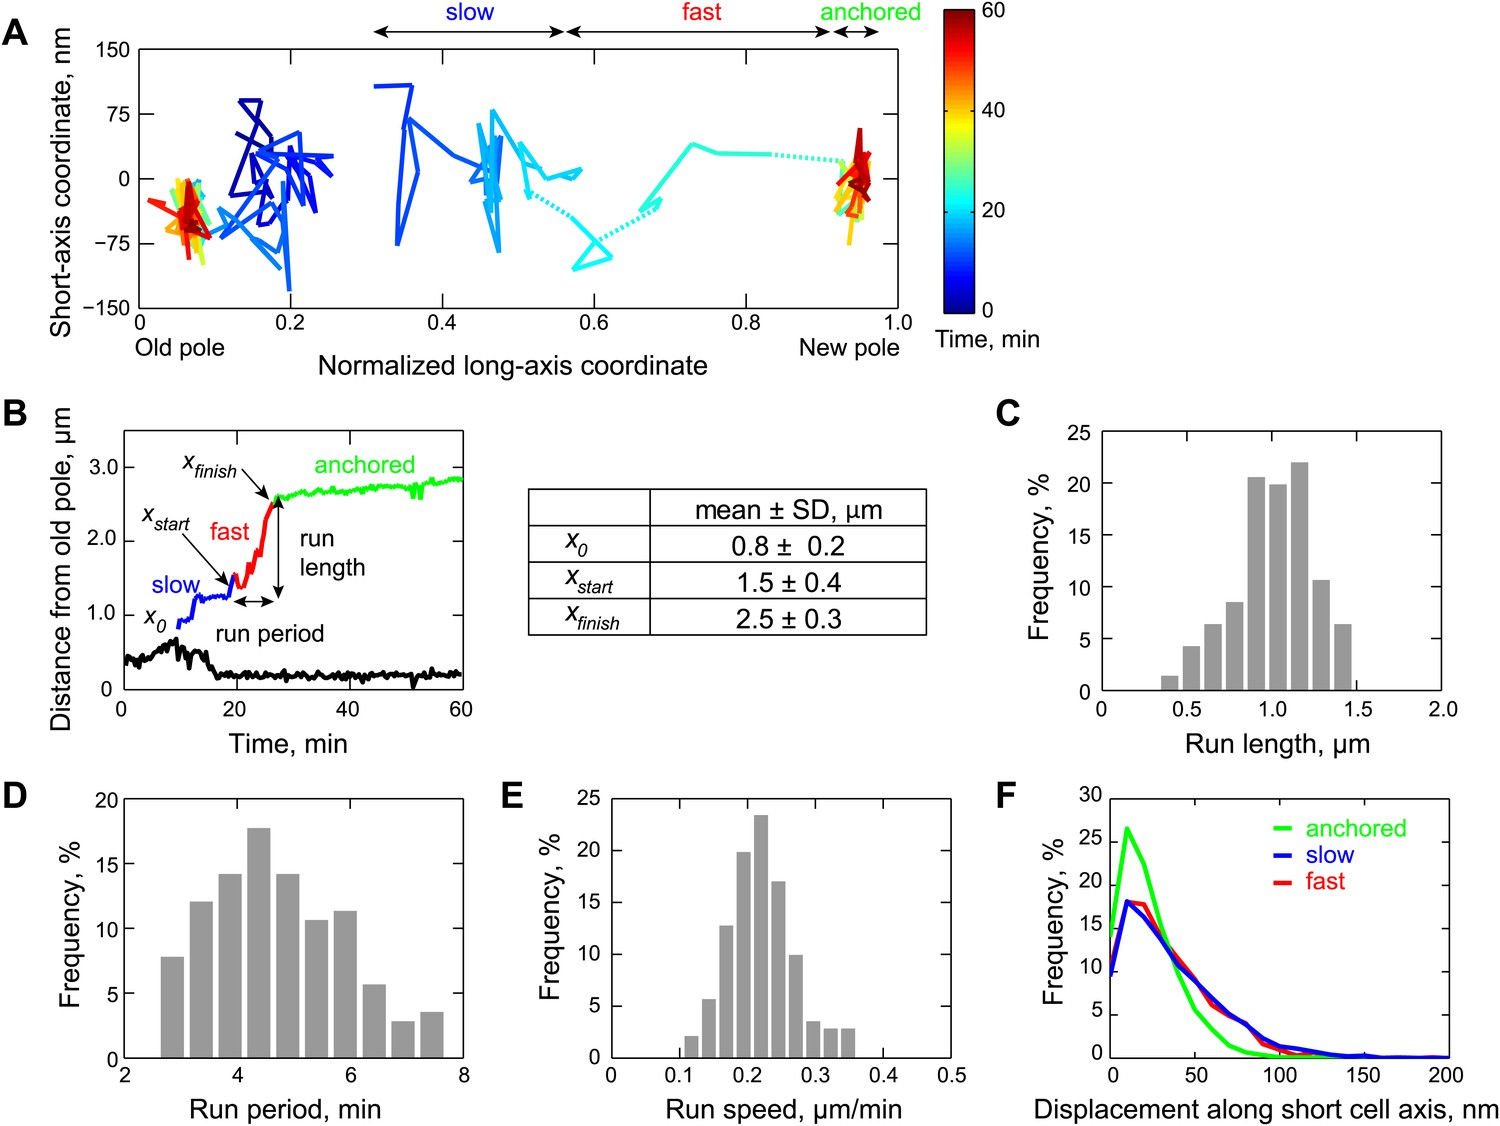
Two-dimensional dynamics of the partition complex.
(A) Representative 2-D trajectory (Δt = 20 s) of duplicated GFP-ParB/parS complexes in a CJW4762 cell. Positions of each partition complex detected in consecutive frames were joined with solid lines while dotted lines were used to connect positions interrupted by frame(s) with failed localization. (B) Trajectory of GFP-ParB/parS complexes in (A) along the long cell axis (black, old pole-proximal ParB/parS complex; for the distal partition complex: blue, ‘slow’ phase, red, ‘fast’ phase, and green, the anchored phase). x0 is the position of the distal partition complex at the moment the second GFP-ParB/parS spot appeared in a cell. xfinish is the position of the distal partition complex at the moment it became anchored at the new pole. xstart is the position when the partition complex transitions from the ‘slow’ phase into the ‘fast’ phase. Run length is the distance between xfinish and xstart along the long cell axis. Run period is the time taken to travel from xstart to xfinish along the long axis. Also shown is a table summarizing the mean ± SD values for x0, xstart and xfinish. There were more counts for xstart and xfinish (n = 141) than for x0 (n = 96) because in some cells the GFP-ParB/parS complex had already duplicated prior image acquisition. These values were used to define the start position for the ParB/parS complex in our computer simulations and the fast phase in the analysis. (C) Histogram showing the distribution of run lengths (n = 141). (D) Histogram showing the distribution of run periods (n = 141). (E) Histogram showing the distribution of translocation speeds of partitioning ParB/parS complexes during the fast phase (n = 141). (F) Histogram showing the distribution of short-axis displacements of segregating partition complexes during the slow (blue), fast (red) and pole-anchored (green) phases.
Figure 3 with 1 supplement
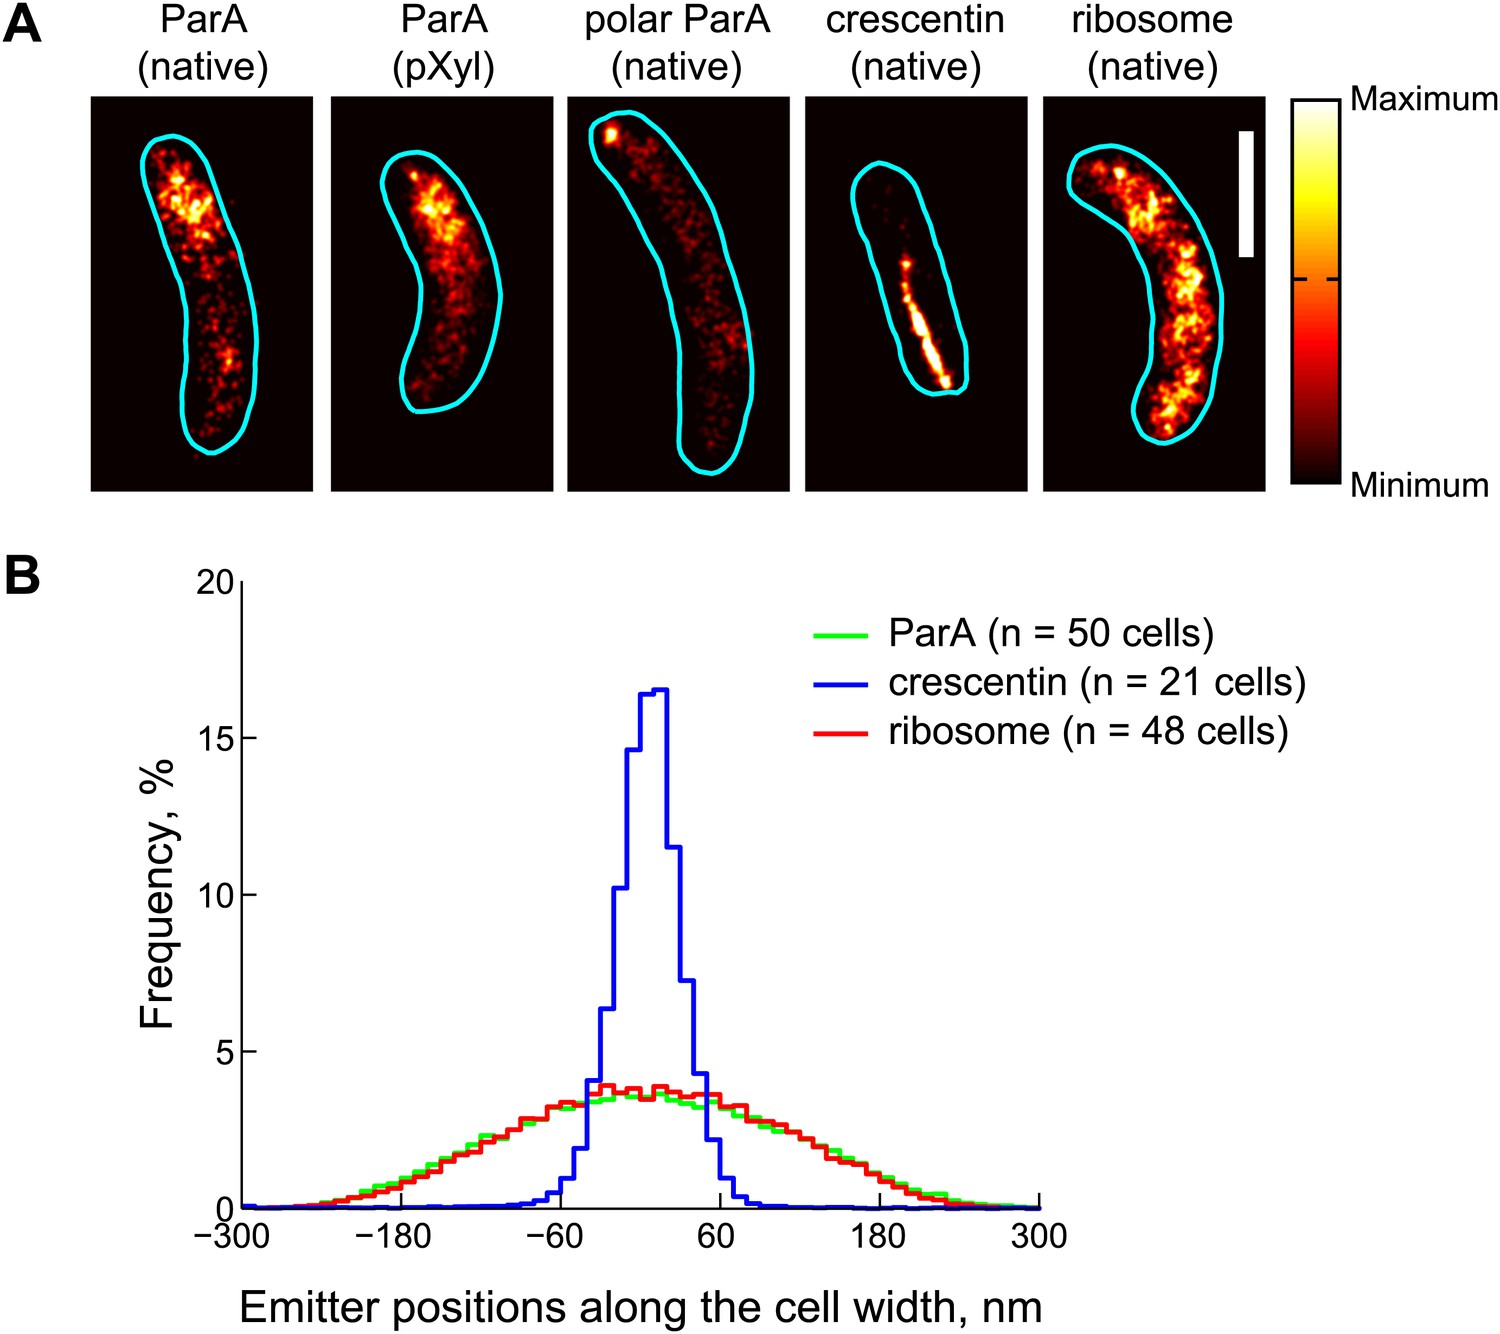
Subdiffraction visualization of ParA-Dendra2 in live cells.
(A) Representative super-resolution PALM images of cells producing ParA-Dendra2 at native levels in place of ParA (strain CJW4915), ParA-Dendra2 at xylose-inducible levels in addition to ParA-Dendra2 expressed from the native promoter (CJW5154), crescentin-Dendra2 at native levels (CJW4902) and ribosome-associated L1-Dendra2 at native levels (CJW5156). Synthesis of ParA-Dendra2 in CJW5154 cells was induced with 0.3% xylose for 1 hr before swarmer cells were isolated for imaging. Scale bar = 1 µm. (B) Positional distributions of single emitters along the short-cell axis for cells expressing ParA-Dendra2 (CJW5154, green), crescentin-Dendra2 (CJW4902, blue) and L1-Dendra2 (CJW5156, red). For each cell, a 0.5–0.8 μm segment containing at least 600 emitters was selected. Emitter positions along the short cell axis were calculated relative to the mean position. Additional super-resolution microscopy images and analysis are presented in Figure 3—figure supplement 1.
Figure 3—figure supplement 1
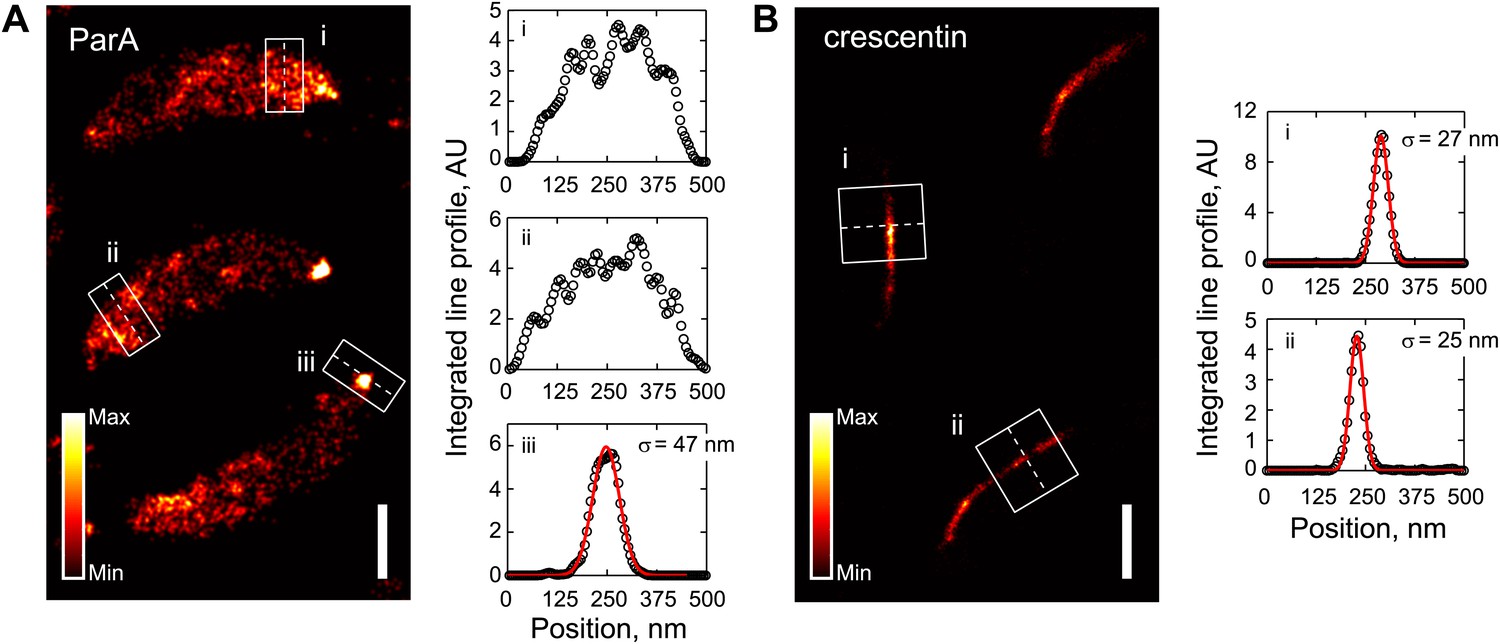
Comparison of ParA and crescentin localization by super-resolution imaging.
(A) Left, super-resolution image of CJW5154 cells producing ParA-Dendra2 from both the native and xylose promoters. Cells were imaged at 100 frames/s for 30 s using a custom-built microscope setup equipped with a sCMOS camera (Huang et al., 2013). ParA-Dendra2 synthesis was induced with 0.3% xylose for 1 hr before swarmer cells were isolated for imaging. The data set was processed using a sCMOS-specific algorithm (Huang et al., 2013). Right, line profiles of emitter positions in the white boxes show the spread of ParA-Dendra2 across the cell width near the new pole (i and ii) and the distribution of ParA-Dendra2 localized at the cell pole (iii). (B) Same as A, except for the CJW4902 strain, which produces crescentin-Dendra2 from the native creS promoter, were imaged. Scale bars = 500 nm. For visualization purpose, the upper bounds in the color map have been adjusted for A and B separately. AU, arbitrary units.
Figure 4 with 2 supplements
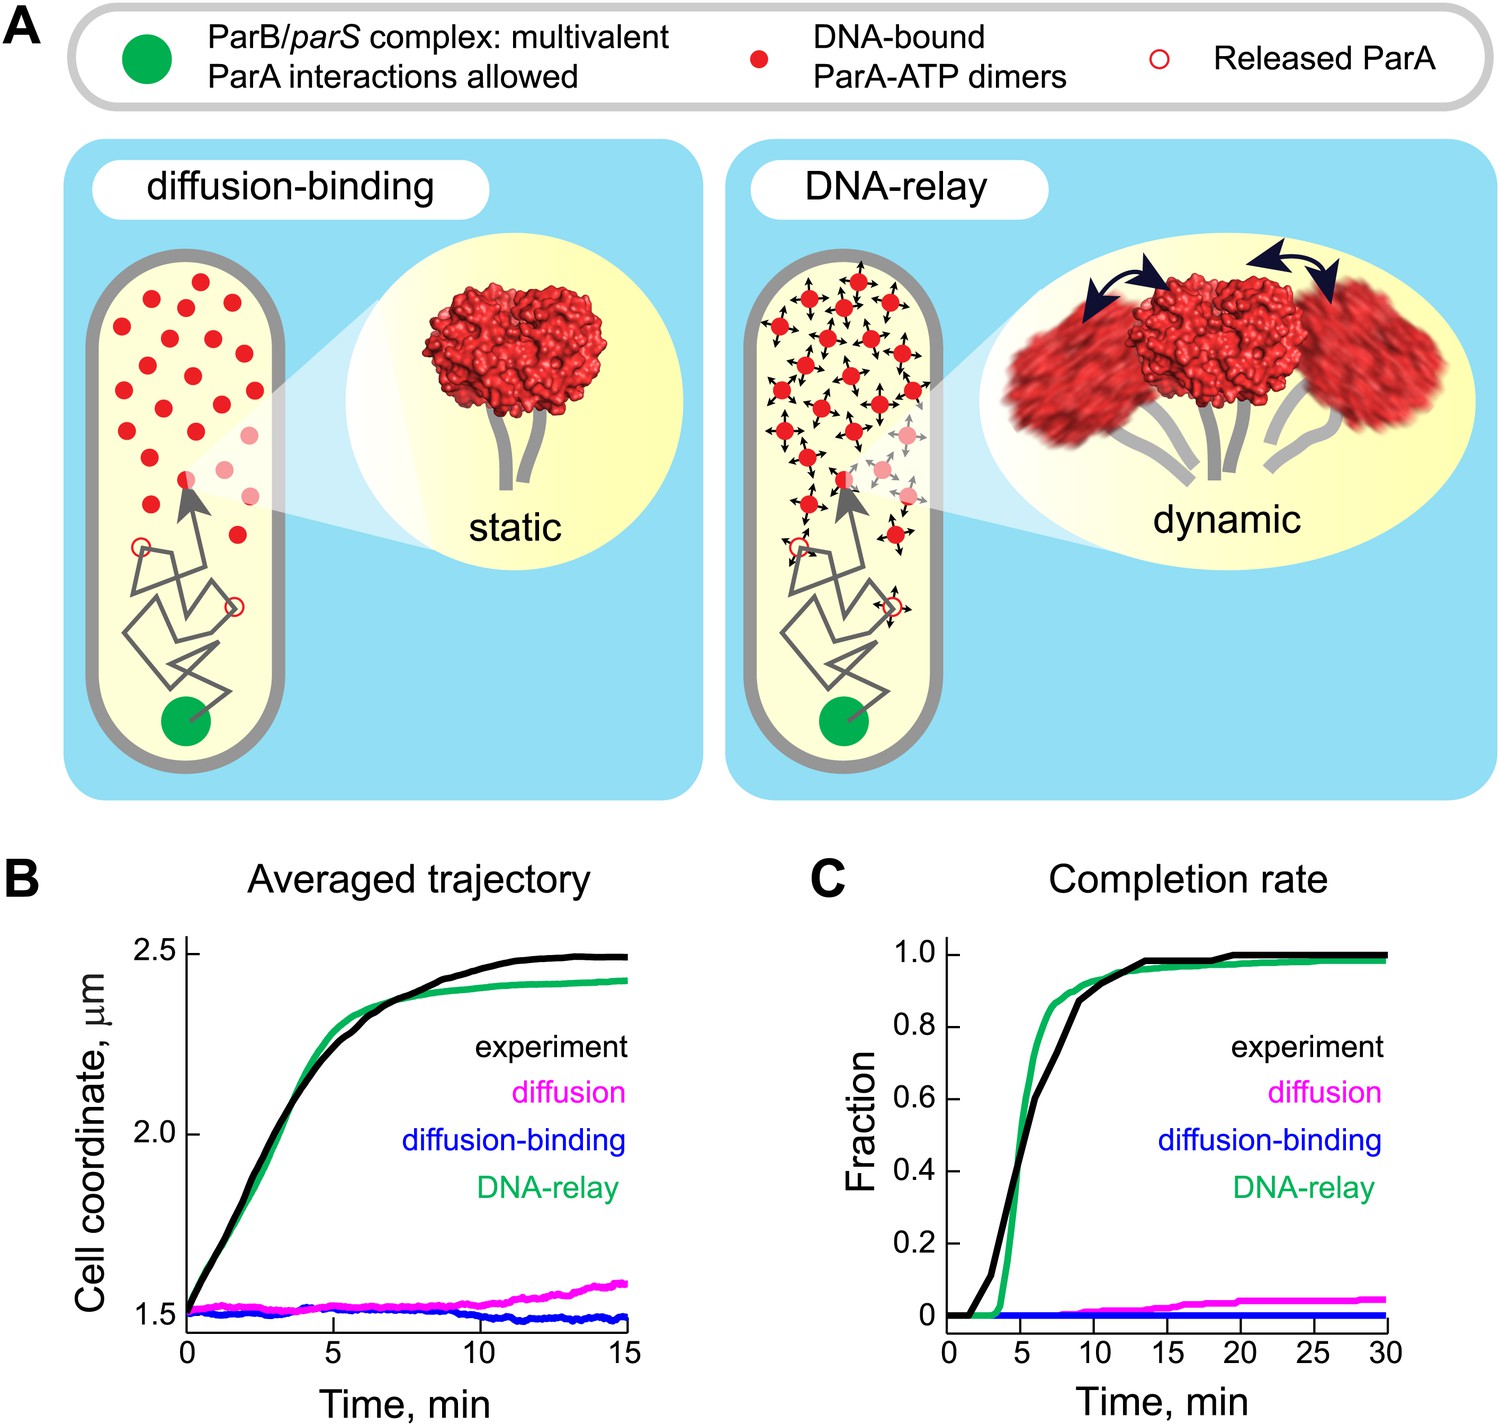
The DNA-relay model results in robust translocation of the ParB/parS complex.
(A) Left, graphical representation of the ‘diffusion-binding’ model: the diffusing ParB/parS complex (green disk) interacts with DNA-immobilized ParA-ATP dimers (filled red disks), stimulates ATPase activity, resulting in the dissociation of ParA from the DNA (open red disks). Right, graphical representation of the ‘DNA-relay model’: same as in (A) except that DNA-bound ParA-ATP dimers fluctuate randomly according to the movement of the associated DNA. When the ParB/parS complex is associated with one or more DNA-bound ParA-ATP dimers, it experiences the elastic force governing the dynamics of the DNA loci associated with ParA dimers. (B) Averaged positions of the simulated ParB/parS complex as a function of time. (C) Fraction of trajectories that completed translocation as a function of time. A summary of all parameters used in the simulations is presented in Table 2. Additional experiments performed to obtain these parameter values are presented in Figure 4—figure supplements 1 and 2.
Figure 4—figure supplement 1
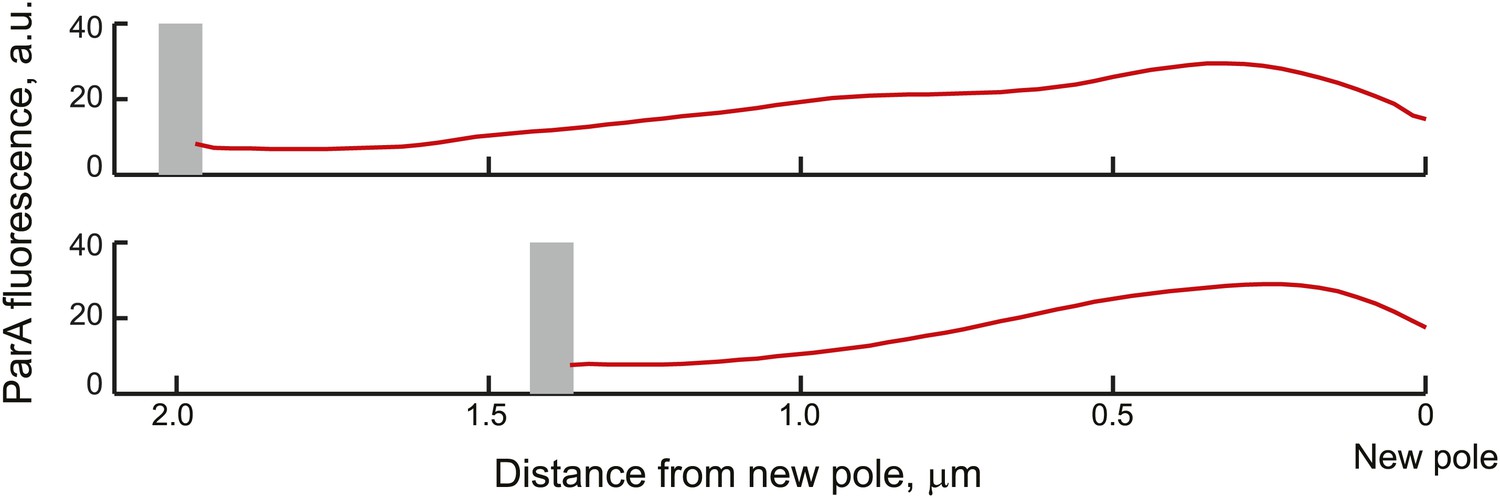
Average ParA-YFP fluorescence profiles during ParB/parS segregation.
Cells expressing ParA-YFP and CFP-ParB (CJW3367 strain) were imaged, analyzed with MicrobeTracker and SpotFinderY, and sorted based on the distance of the translocating partition complex from the new pole at 100-nm intervals. Shown in the figure are the average fluorescence profiles of ParA-YFP between the translocating CFP-ParB/parS partition complex and the new pole (red curves) of cells sorted into the 2.0 ± 0.05 and 1.6 ± 0.05 µm groups. The grey bars mark the average distance of the partition complex from the new pole.
Figure 4—figure supplement 2
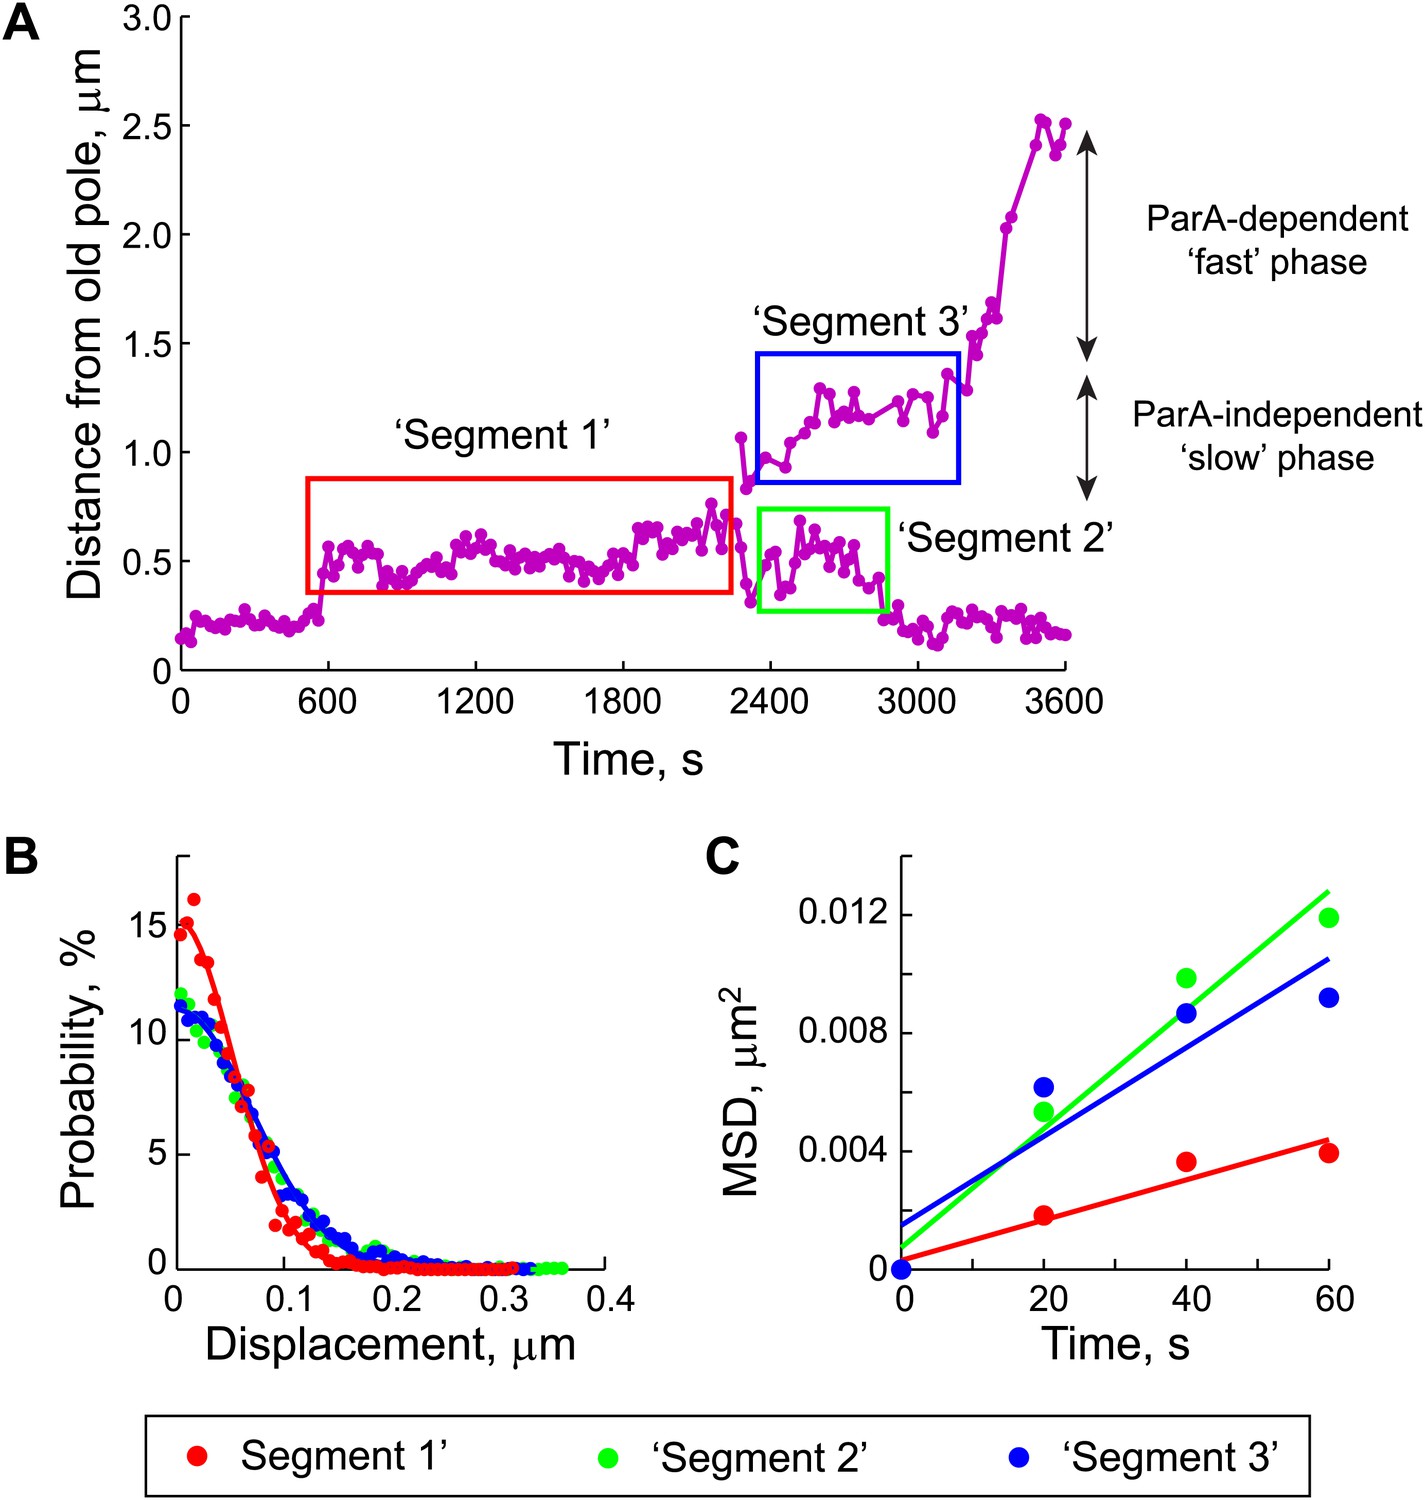
Estimation of the diffusion coefficient of the ParB/parS complex, DPC.
(A) Three segments were identified in the trajectories of GFP-ParB/parS when the partition complexes were not engaged in the fast, ParA-dependent movement (see ‘Materials and methods’ for details). (B) The displacement along the long cell axis within each segment was collected from all cells and the distributions were plotted. Closed circles indicate data while solid lines indicate Gaussian fits to displacement distributions for each of the segments. (C) Mean square displacement (MSD) was plotted for each of the segments (closed circles). Solid lines represent linear fits (MSD = DPC t + C, with a variable offset C, as described previously [Bakshi et al., 2011; English et al., 2011]) to the data points.
Figure 5
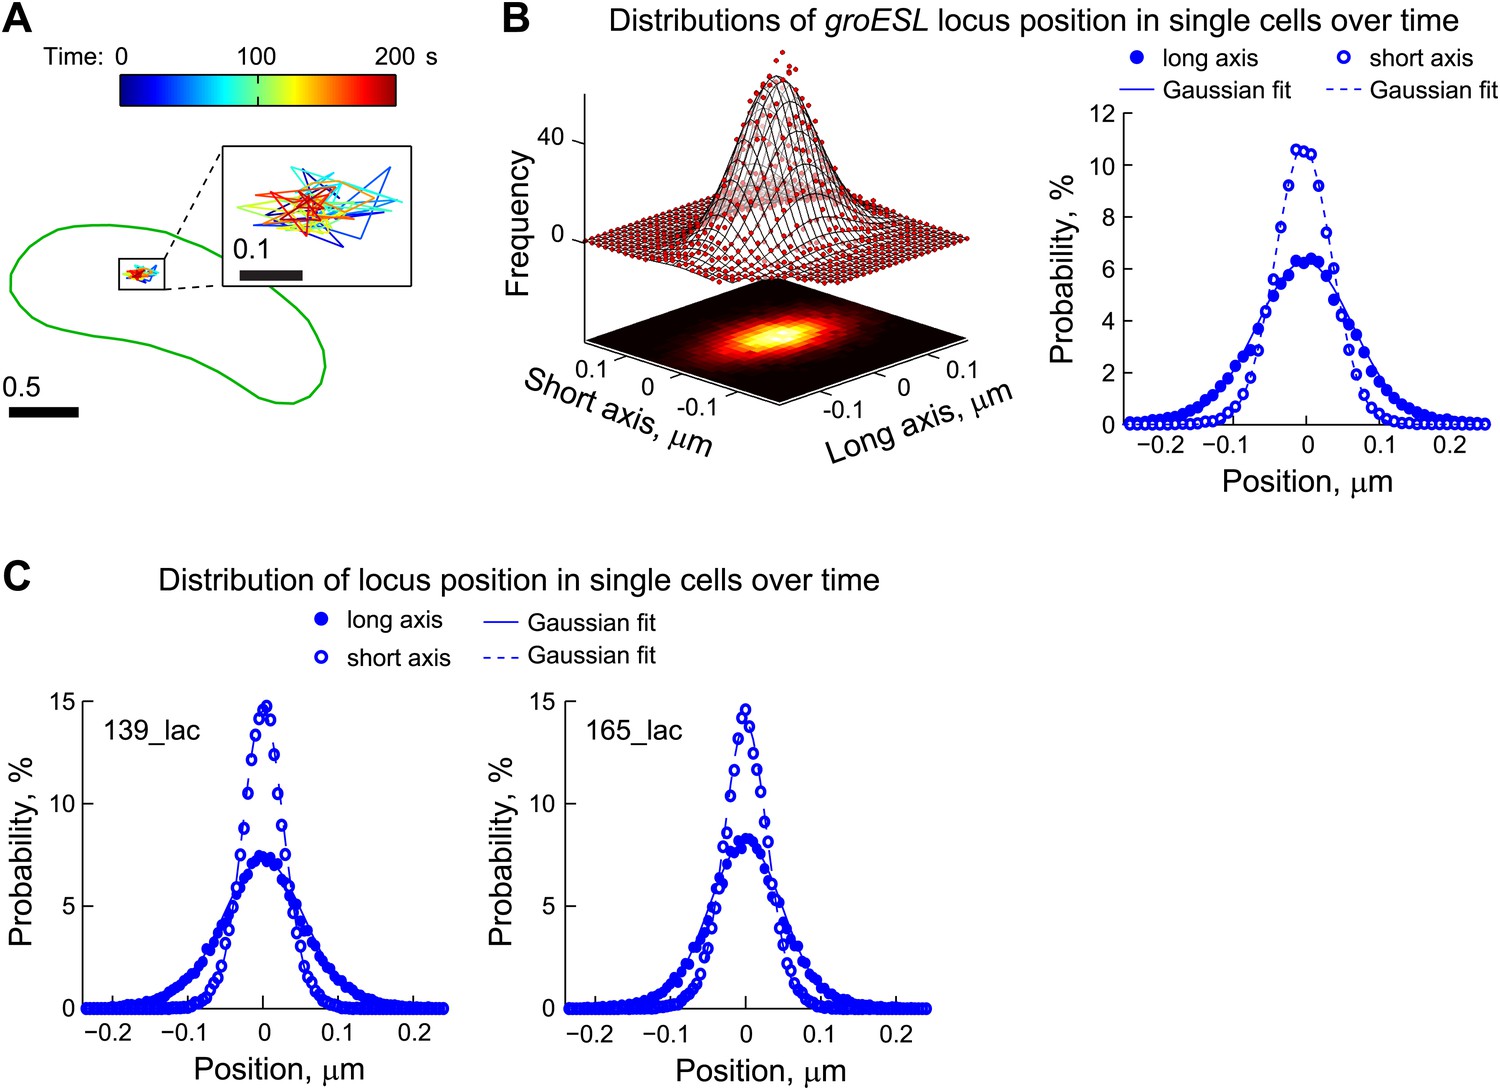
Chromosomal loci exhibit elastic dynamics.
(A) Representative trajectory of a LacI-CFP-labeled groESL locus tracked in live CJW2966 cells showing the dynamics of a chromosomal locus. The DNA locus was imaged every 2 s for 180 s. The displacements were colored as a function of time and overlaid with the cell outline (green). The zoomed trajectory in the inset shows the magnitude of displacements. To induce LacI-CFP expression, cells were incubated for 1 hr with 0.03% xylose prior to imaging. (B) Left, two-dimensional distribution of the groESL locus positions relative to the mean position of each trajectory. The scatter plots were generated from locus positions of 641 trajectories while the mesh surface is the best 2-D asymmetrical Gaussian fit (with σlong = 0.06 µm and σshort = 0.04 µm). The lower plane is a heatmap of the experimental data. Right, the same data set is represented as 1-D distributions of the groESL locus positions relative to the mean position of each trajectory along the long and short cell axes in single cells. Experimental data (filled circles, long axis; open circles, short axis) and Gaussian fits (solid line, long axis; dashed line, short axis) are shown. (C) 1-D distributions of the 139_lac and 165_lac locus positions (Viollier et al., 2004) relative to the mean position of each trajectory along the long and short cell axes in single cells. Left, asymmetrical Gaussian fit gives σlong = 0.06 µm and σshort = 0.03 µm for the 139_lac locus in which the lac operators are inserted at position 1599540 on the C. crescentus chromosome (CJW5466 strain). Right, asymmetrical Gaussian fit gives σlong = 0.05 µm and σshort = 0.03 µm for the 165_lac locus in which the lac operators are inserted at position 2481399 on the C. crescentus chromosome (CJW5468 strain).
Figure 6

The ParB/parS complex transiently adopts an extended conformation during the fast segregation phase.
(A) A fraction of GFP-ParB/parS complexes (red arrows) adopts extended conformation that appears as non-diffraction limited spots in fluorescent images of live CJW4762 cells. (B) Same as (A) except that cells were fixed with 4% formaldehyde prior imaging. (C) The aspect ratio (AR) of CFP-ParB/parS complexes in live CJW3367 cells was calculated as the ratio of the longest dimension, l, to the shortest dimension, d, for each partition complex signal. A representative cell is shown with the fluorescent CFP-ParB/parS signals outlined in yellow. (D) The propensity of a CFP-ParB/parS partition complex (PC) to display a decompacted conformation is shown with respect to cellular position. Individual CFP-ParB/parS complexes were binned according to their relative positions in the cell with old pole = 0 and new pole = 1 (see ‘Materials and methods’ for pole discrimination). The fraction of CFP-ParB/parS complexes with AR >1.5 in each bin are shown. (E) Top, representative time-lapse sequence (4-s intervals) showing de-compaction and recoiling of a segregating partition complex (marked by GFP-ParB) in a CJW4762 cell. Bottom, ARs of the anchored (red) and segregating (blue) ParB/parS complexes as a function of time is shown. For all the experiments indicated above, the expression of ParB fusion proteins was induced with 0.03% xylose in M2G for 60–75 min prior to synchronization and imaging. All scale bars = 1 µm.
Figure 7

Appropriate ParB-stimulated ParA ATPase rates are important for the robustness of the DNA-relay model.
(A) Averaged trajectories of the partition complex along the long cell axis during the fast ParA-dependent phase were simulated using varied ParB-stimulated ParA ATPase rates (kcat) and a fixed diffusion coefficient for the ParB/parS complex (DPC) of 0.0001 μm2/s. (B) Same data set as (A), except that for each kcat, the fraction of trajectories that completed translocation are shown as a function of time.
Videos
Video 1
Example of a simulated trajectory for the diffusion-binding model.
Trajectories were generated by Brownian dynamics simulations with time step dt = 1 ms and the following parameters: diffusion coefficient of the partition complex DPC = 0.0001 µm2 s−1, total number of ParA dimers nParA = 90, ParB-stimulated rate of ParA ATPase activity kcat = 0.03 s−1, rate constant for DNA-binding kDB = 0.03 s−1. The partition complex and ParA-ATP dimers are shown as green and red spheres, respectively. Shown here is a representative trajectory in absolute cell coordinate (0 µm = old pole; 2.5 µm = new pole) as a function of time in a virtual cell.
Video 2
Example of a simulated trajectory for the diffusion model.
Trajectories were generated by Brownian dynamics simulations with time step dt = 1 ms and a diffusion coefficient of partition complex DPC = 0.0001 µm2 s−1. The partition complex is shown in green. Shown here is a representative trajectory in absolute cell coordinate (0 µm = old pole; 2.5 µm = new pole) as a function of time in a virtual cell.
Video 3
Example of a simulated trajectory for the DNA-relay model.
Trajectories were generated by Brownian dynamics simulations with time step dt = 1 ms and following parameters: diffusion coefficient of partition complex DPC = 0.0001 µm2 s−1, total number of ParA dimers nParA = 90, ParB-stimulated rate of ATPase activity kcat = 0.03 s−1, rate constant for DNA binding kDB = 0.03 s−1 and spring constant ksp/kT = 1/σ2 = 280 μm−2. The partition complex and ParA-ATP dimers are shown as green and red spheres, respectively. Shown here is a representative trajectory in absolute cell coordinate (0 µm = old pole; 2.5 µm = new pole) as a function of time in a virtual cell.
Tables
Table 1
Estimation of ParA and ParB concentrations inside cells
| Molecules per cell | Mole x 10−21 | Volume (fL) | Concentration (μM) | |
|---|---|---|---|---|
| ParB | 720 ± 80 | 1.2 | 0.25 | 1.8 |
| ParB (diffusing) | 140 | 0.2 | 0.25 | 0.8 |
| ParB (parS-associated) | 580 | 1 | 0.002 | 500 |
| ParA | 180 ± 30 | 0.3 | 0.25 | 1.2 |
-
This table summarizes the abundance and concentrations of ParA and ParB in swarmer/early stalked C. crescentus cells. Subcellular distribution of ParB was determined by quantitative fluorescence measurements in cells expressing GFP-ParB (MT174, Figure 1—figure supplement 3). ParB abundance was determined by quantitative Western blotting (Figure 1—figure supplement 4A). The result showing dimerization of purified ParB in solution is shown in Figure 1—figure supplement 5. ParA abundance shown here is the average value determined by three independent methods: (1) Quantitative Western blotting of ParA-YFP abundance in CJW3010 cells in which parA-yfp functionally replaces wild-type parA in the chromosome (Figure 1—figure supplement 4B), (2) Calibrated fluorescence measurement (Figure 1—figure supplement 6) and (3) Comparison between ParB-GFP and ParA-YFP amounts by quantitative Western blotting (Figure 1—figure supplement 7). The cell volume represents the cytoplasmic volume calculated from a cryoelectron tomograph of a swarmer cell (Briegel et al., 2008). The volume occupied by parS-associated ParB molecules was inferred from super-resolution PALM images of cells expressing mEos3.2-ParB (CJW4978 strain, Figure 1—figure supplement 3F).
Table 2
Default parameters and values used in simulations of mathematical models
| Model | Parameter | Value | Comments | Source | |
|---|---|---|---|---|---|
| 1, 2, 3 | Time step of simulations | Δt | 0.001 s | No significant differences with simulations using smaller steps | |
| 1, 2, 3 | Number of simulated trajectories | nruns | 1024 | ||
| 1, 2, 3 | Duration of simulations | tfin | 2000 s | ∼3 × time scale of translocation | |
| 1, 2, 3 | Cell length | l0 | 2.6 µm | Average cell length and width of cells with first appearance of 2 ParB foci | This study |
| Cell width | w0 | 0.4 µm | |||
| 1, 2, 3 | Initial coordinates of ParB/parS complex, relative to the long cell axis(0 = old pole; l0 = new pole) and short axis (cell walls at −w0/2 and w0/2) | x0 | 0.8 µm | Average coordinate of the distal ParB focus in cells at the first appearance of 2 ParB foci | This study |
| y0 | 0.0 µm | ||||
| 1, 2, 3 | Start of ‘fast’ phase (used only in analysis of the simulations) | xstart | 1.5 µm | Calculated from xfinish - run length (from Figure 2D) | This study |
| 1, 2, 3 | End point of translocation | xfinish | 2.5 µm | Average coordinate at which distal ParB focus became anchored | This study |
| 1, 2, 3 | Radius of the disk for ParB/parS complex | RParB | 50 nm | Value close to an estimate from super-resolution images | This study |
| 2, 3 | Radius of the disk for ParA dimer | RParA | 2 nm | Value close to the dimension of the crystal structure of a Soj dimer (PDB: 2BEK) | (Leonard et al., 2005) |
| 2, 3 | Number ParA dimers | nParA | 90 | Average of three measurements by different techniques | This study |
| 2, 3 | Rate of ParB-stimulated hydrolysis of ATP by ParA dimers | kcat | 0.03 s−1 | Best fit value to ParB dependence curve | This study |
| 2, 3 | Rate of ParA dimer rebinding to the DNA | kdb | 0.03 s−1 | Results do not depend on the exact values (0.01–1 s−1 range tested) | |
| 2, 3 | Spatial distribution of DNA-bound ParA dimers | PParA-DNA | Equation 6 | Measured from ParA-YFP fluorescence profile during segregation | This study |
| 1, 2, 3 | Diffusion coefficient of the translocating ParB/parS complex | DPC | 0.0001 µm2s−1 | Estimated from non-directional phases of ParB trajectories | This study |
| 3 | Diffusion coefficient of DNA-bound ParA dimers | DA | 0.01 µm2s−1 | Calculated from the time-dependent generalized diffusion coefficient | (Weber et al., 2010; Javer et al., 2013) |
| 3 | Standard deviations of fluctuating DNA-bound ParA dimers used to define elastic constants (1/σ2 = ksp/kT) | σlong | 0.06 µm | Measured from the positional fluctuation of the groESL, 139_lac and 165_lac DNA loci. | This study |
| σshort | 0.04 µm | ||||
-
Model 1: diffusion, Model 2: diffusion-binding, Model 3: DNA-relay.
Additional files
-
Supplementary file 1
Strains used in this study and the methods of strains construction.
- https://doi.org/10.7554/eLife.02758.026
-
Supplementary file 2
Oligonucleotide primers used in this study and methods of plasmids construction.
- https://doi.org/10.7554/eLife.02758.027
-
Supplementary file 3
Custom-built MATLAB function (buildTrace.m) for constructing trajectories of ParB/parS complexes in single cells.
- https://doi.org/10.7554/eLife.02758.028
-
Supplementary file 4
Custom-built MATLAB function (findFastSegPhase.m) for identifying the ‘fast’ phase in the segregating trajectory.
- https://doi.org/10.7554/eLife.02758.029
Download links
A two-part list of links to download the article, or parts of the article, in various formats.
Downloads (link to download the article as PDF)
Open citations (links to open the citations from this article in various online reference manager services)
Cite this article (links to download the citations from this article in formats compatible with various reference manager tools)
Evidence for a DNA-relay mechanism in ParABS-mediated chromosome segregation
eLife 3:e02758.
https://doi.org/10.7554/eLife.02758


