RETRACTED: Protein kinase C is a calcium sensor for presynaptic short-term plasticity
- Harvard Medical School, United States
- University of California, Davis, United States
- University of Oslo, Norway
Figures
Figure 1 with 6 supplements
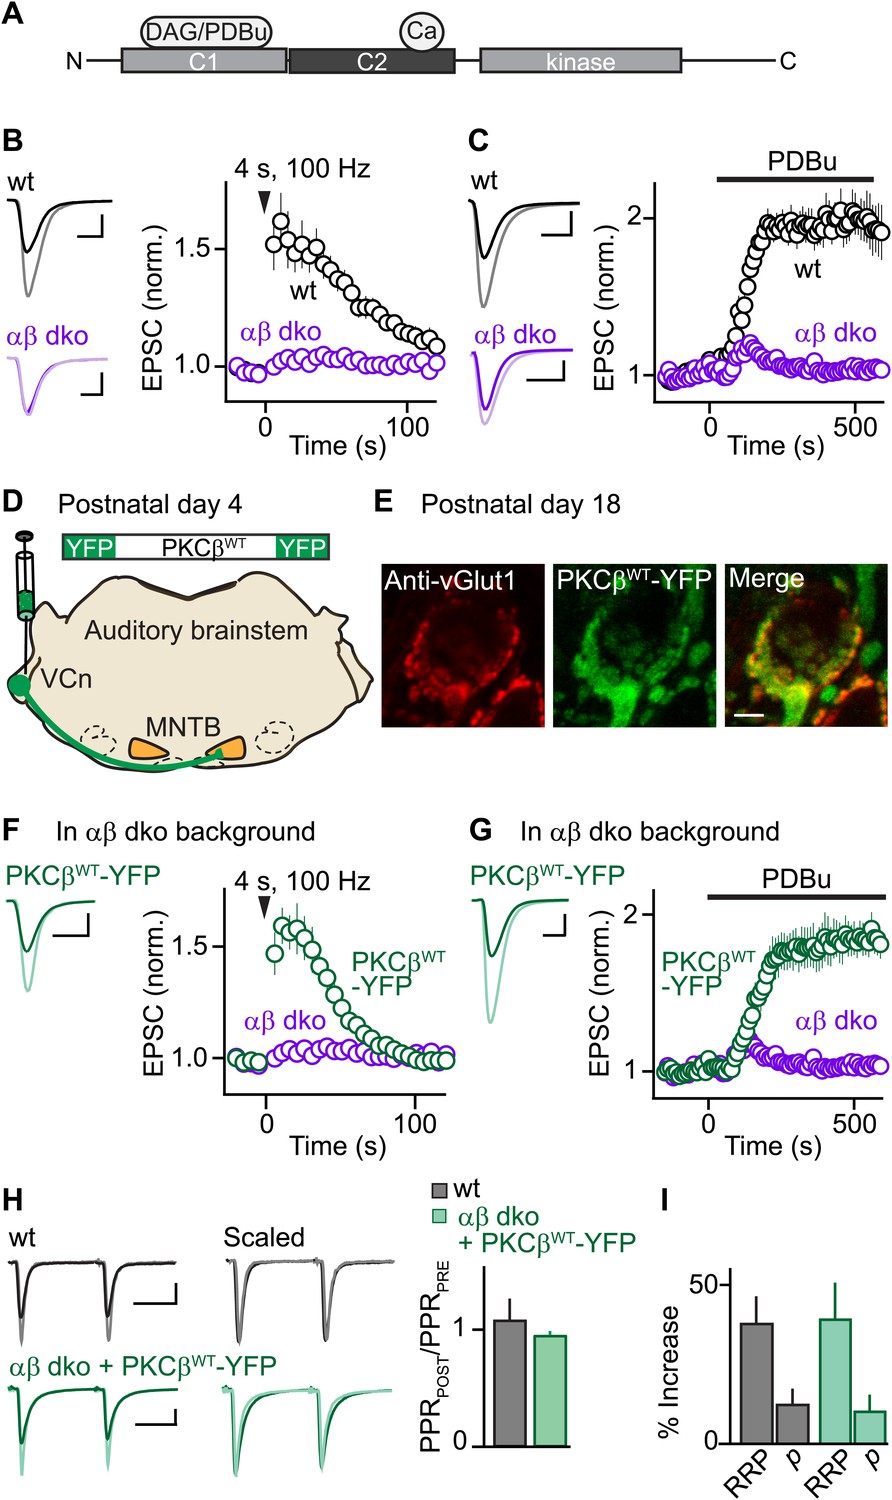
Expression of PKCβ rescues synaptic potentiation in animals lacking calcium-dependent PKCs.
Synaptic plasticity was examined at the calyx of Held following tetanic stimulation (B and F) or bath application of the phorbol ester PDBu (C and G) for wild-type (wt, black), PKCαβ dko animals (purple), and PKCαβ dko animals expressing PKCβWT-YFP (green). (A) Domain arrangement of PKCCa. DAG and PDBu bind to the C1 domain and Ca2+ binds to the C2 domain. (B, C, F, G) Left, example EPSCs recorded prior to (bold traces) and after (light traces) synaptic enhancement for each experimental condition. Right, EPSCs are plotted as a function of time (mean ± SEM). For (B), wild-type: 62 ± 12%; αβ dko: 2.4 ± 1.8%. Also see Figure 1—figure supplement 1 and accompanying legend for PTP induced under elevated-temperature conditions. Similar to PTP induced at room temperature, PTP at near-physiological temperature requires PKCCa (Figure 1—figure supplement 2). For (C), at steady state: wild-type: 97 ± 12%; αβ dko: 3.2 ± 3.4%; for (F), PKCβWT-YFP: 61 ± 7%; for (G), 84 ± 11%. In F and G, the αβ dko group data from B and C respectively are re-plotted for comparison. Also see Figure 1—figure supplement 3 and Figure 1—figure supplement 4. (D) In this schematic of the auditory brainstem, the ventral cochlear nucleus (VCn) and medial nuclei of the trapezoid body (MNTB) are labeled. An AAV expressing PKCβWT-YFP was injected in the VCn at postnatal day 4. (E) Confocal images of a brain section labeled with an antibody against vGlut1 (red) are shown for a calyx of Held expressing PKCβWT-YFP (green) in a PKCαβ dko animal at postnatal day 18. Scale bar: 10 µm. (H and I) The synaptic mechanism through which PKCβ rescues PTP was examined under conditions that relieve AMPA receptor desensitization and saturation. (H) Left, overlay of EPSCs (10 ms inter-stimulus interval) delivered prior to (bold traces) and 10 s after (light traces) PTP-inducing tetanus. Middle, traces are normalized to the first EPSC to allow comparison of PPR. Right, PPRPOST (after tetanus) over PPRPRE (before tetanus) (mean ± SEM, see Figure 1—source data 1 and 2). Wild-type: p=0.49; αβ dko expressing PKCβWT-YFP: p=0.68. (I) Summary of the readily releasable pool (RRP) and release probability (p) contributions to PTP (mean ± SEM, also see Figure 1—figure supplements 5 and 6 and Figure 1—source data 1 and 2). RRPWT: 37 ± 9%; RRPPKCβWT-YFP: 39 ± 12%; p=0.88. Scale bars in B, C, F, and G: 2 nA, 1 ms. Scale bars in H: 2 nA, 5 ms.
-
Figure 1—source data 1
Summary and statistical analyses of synaptic properties during PTP and PDBu-induced potentiation.
- https://doi.org/10.7554/eLife.03011.004
-
Figure 1—source data 2
Summary and statistical analyses of basal synaptic properties.
- https://doi.org/10.7554/eLife.03011.005
Figure 1—figure supplement 1
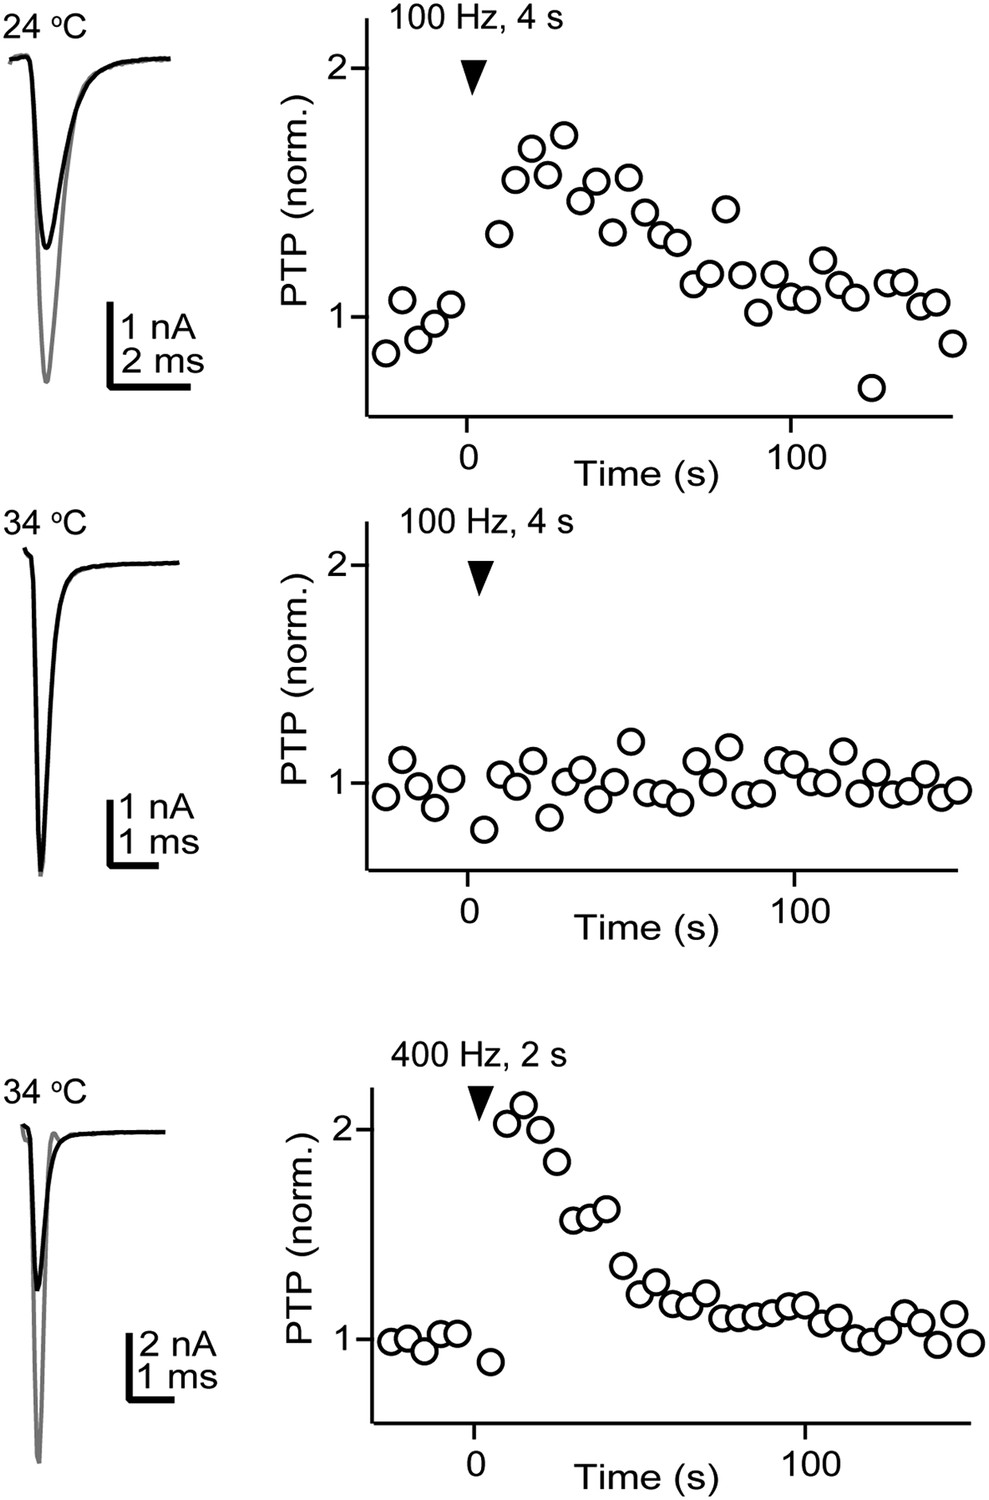
PTP can be induced under near-physiological conditions.
Most studies of PTP are performed at room temperature in 2 mM external Ca2+, 1 mM external Mg2+. We tested whether PTP could also be induced under more physiological conditions (34°C, 1.5 mM external Ca2+, 1.2 mM external Mg2+). In this recording from a representative cell, we first induced PTP with our standard stimulation protocol (100 Hz, 4 s) at 24°C (top). We then increased the temperature to 34°C, repeated the induction protocol, but failed to obtain PTP (middle). However, we successfully induced PTP at 34°C in the same cell with higher frequency stimulation (400 Hz, 2 s). We found that at elevated-temperature, PTP could not be reliably induced with the 100 Hz, 4 s stimulation protocol (2.9% ± 0.6%, n = 8 cells) but it could be readily obtained with the 400 Hz, 2 s protocol (83 ± 14%, n = 5 cells). These results indicate that PTP can be obtained under near-physiological conditions. The higher stimulation frequency needed to induce the plasticity at 34°C is within the physiological firing frequency range observed at matured calyces of Held in vivo (Sonntag et al., 2009).
Figure 1—figure supplement 2
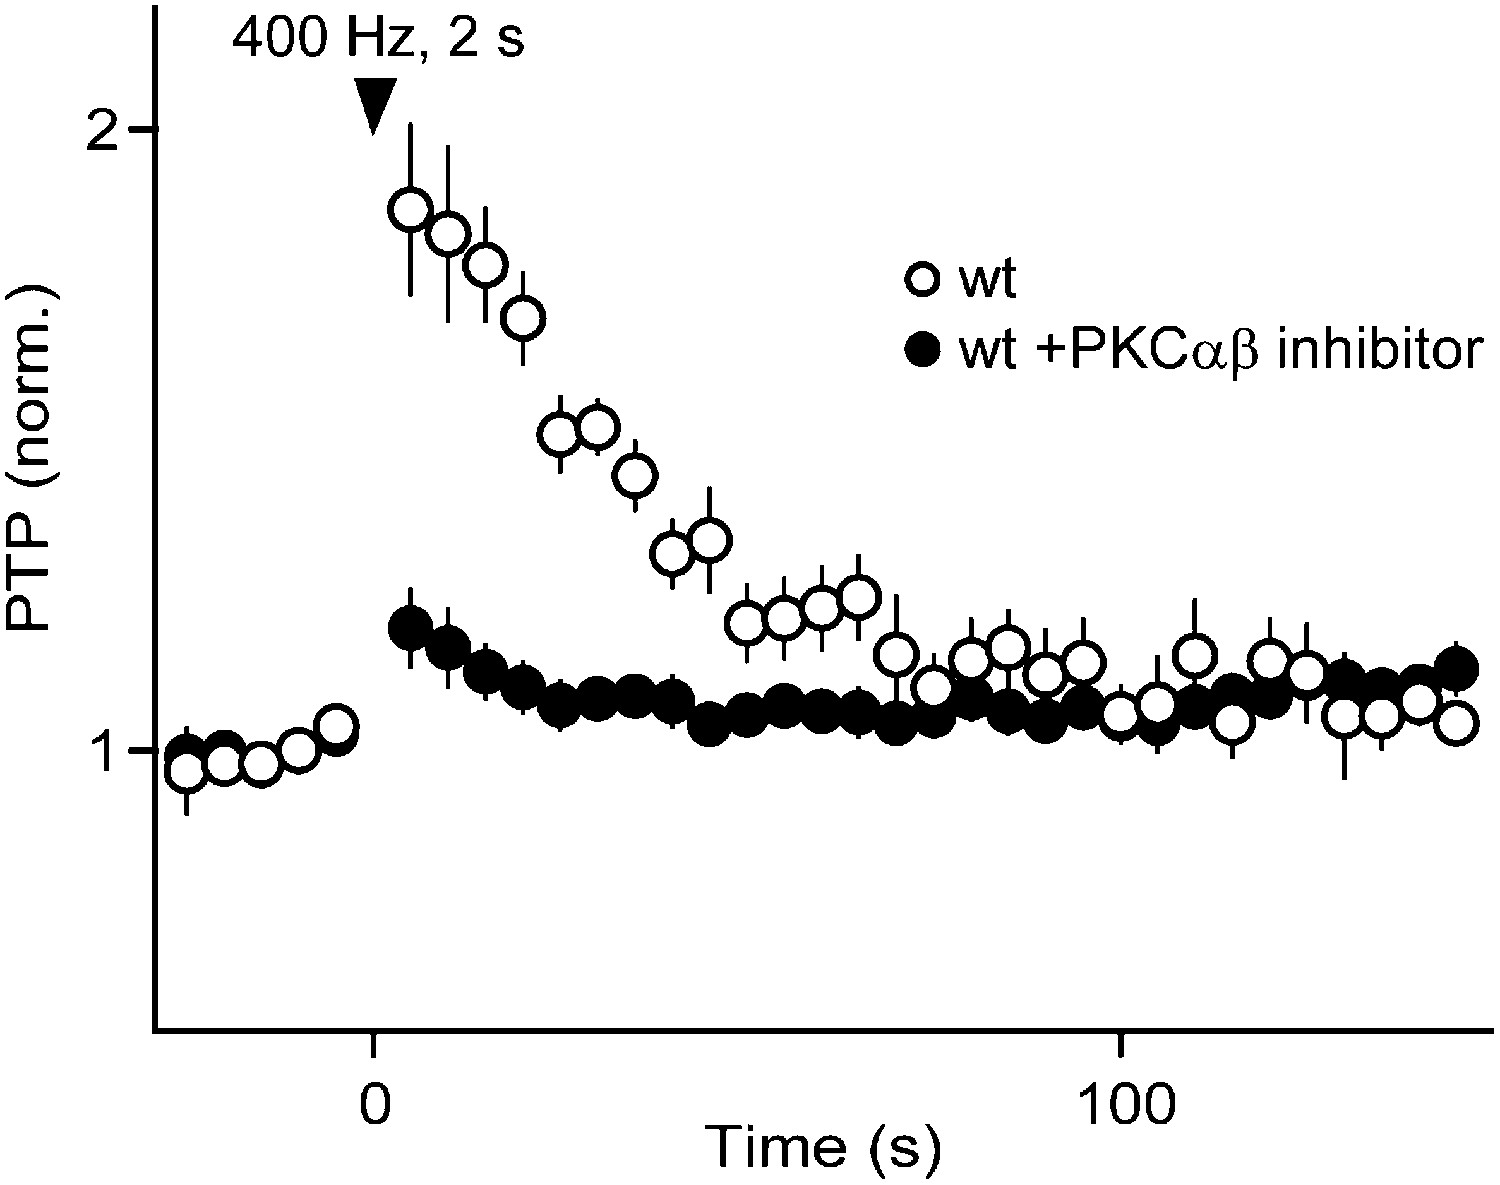
Under near-physiological conditions PTP is mediated by PKCCa.
We used a selective PKCαβ inhibitor (Calbiochem 539654; 250 nM) (Tanaka et al., 2004) to determine whether PKCCa isoforms are essential for PTP obtained under near-physiological conditions (34°C, 1.5 mM external Ca2+, 1.2 mM external Mg2+). We have previously established the specificity of this inhibitor (Chu et al., 2014), which potently blocks PKCβ (Km ∼ 5–20 nM; Km for PKCα ∼ 300 nM). In wild-type (wt) mice, we found that the PTP induced by a 400 Hz, 2 s tetanus (83 ± 14%; n = 5) was dramatically reduced in the presence of the PKCαβ inhibitor (17 ± 6.6%; n = 7; p<0.001). This result establishes that PKCCa isoforms play a crucial role in PTP under near-physiological conditions.
Figure 1—figure supplement 3
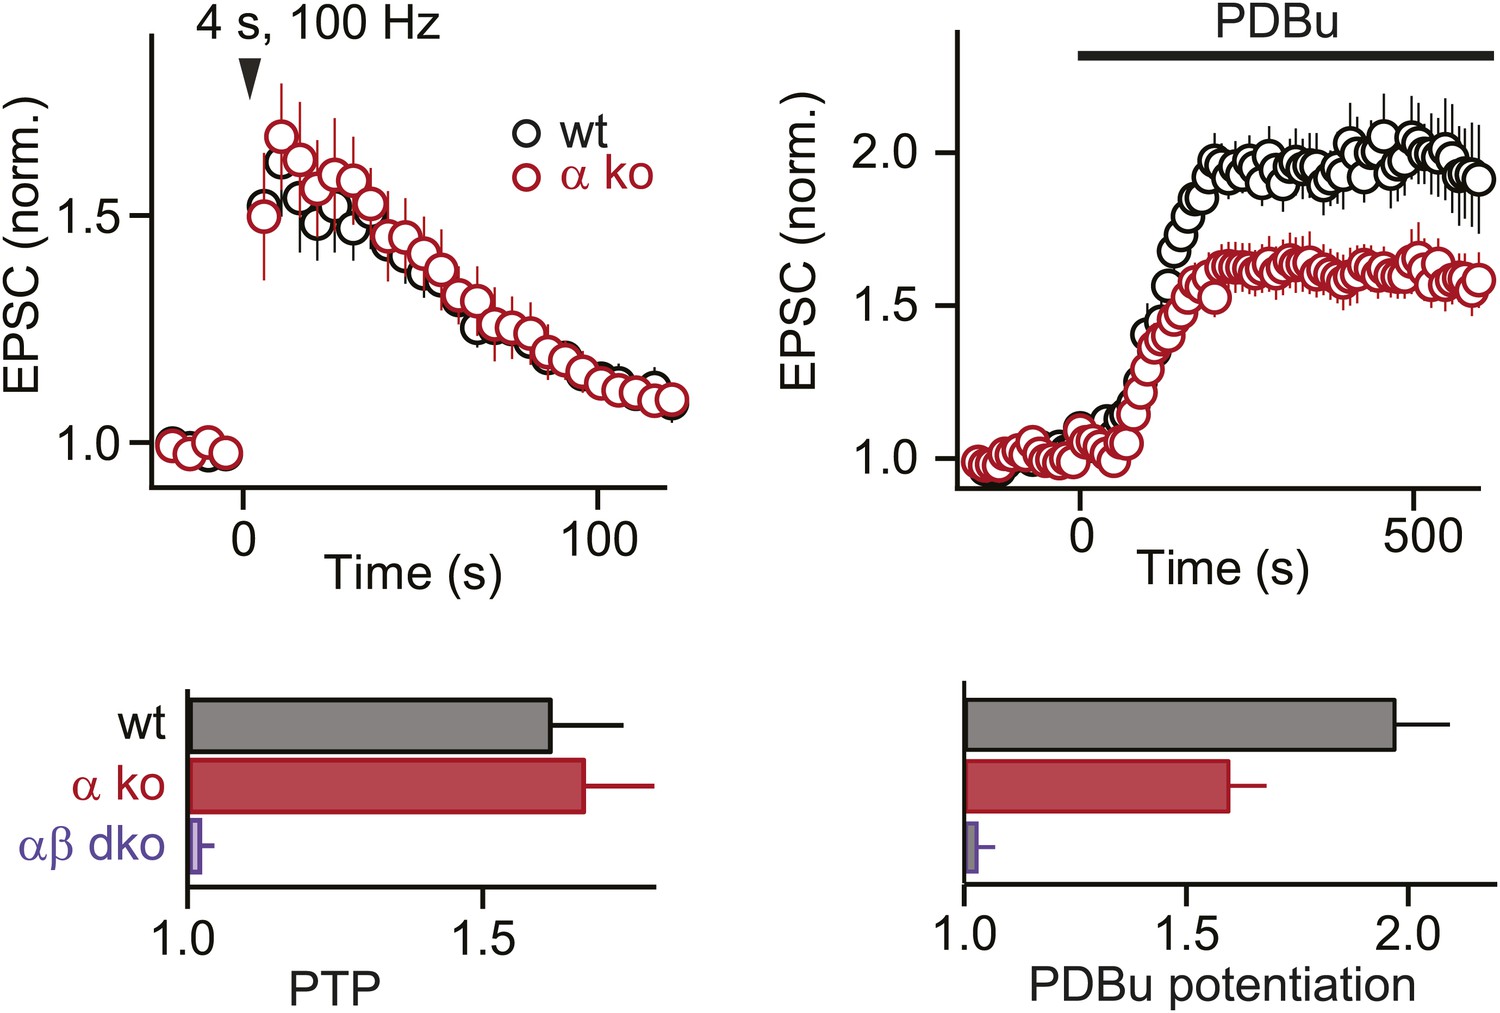
At the functionally mature calyx of Held, PKCα does not contribute to PTP but plays a small role in phorbol ester-induced potentiation.
PTP (top left) and PDBu-induced potentiation (top right) are plotted as a function of time (mean ± SEM), for wild-type (black) and PKCα ko (red) groups. Bottom, summary plots (mean ± SEM) of peak PTP (10 s after tetanus) and steady-state PDBu-induced potentiation (430–600 s in PDBu) for indicated groups.
Figure 1—figure supplement 4
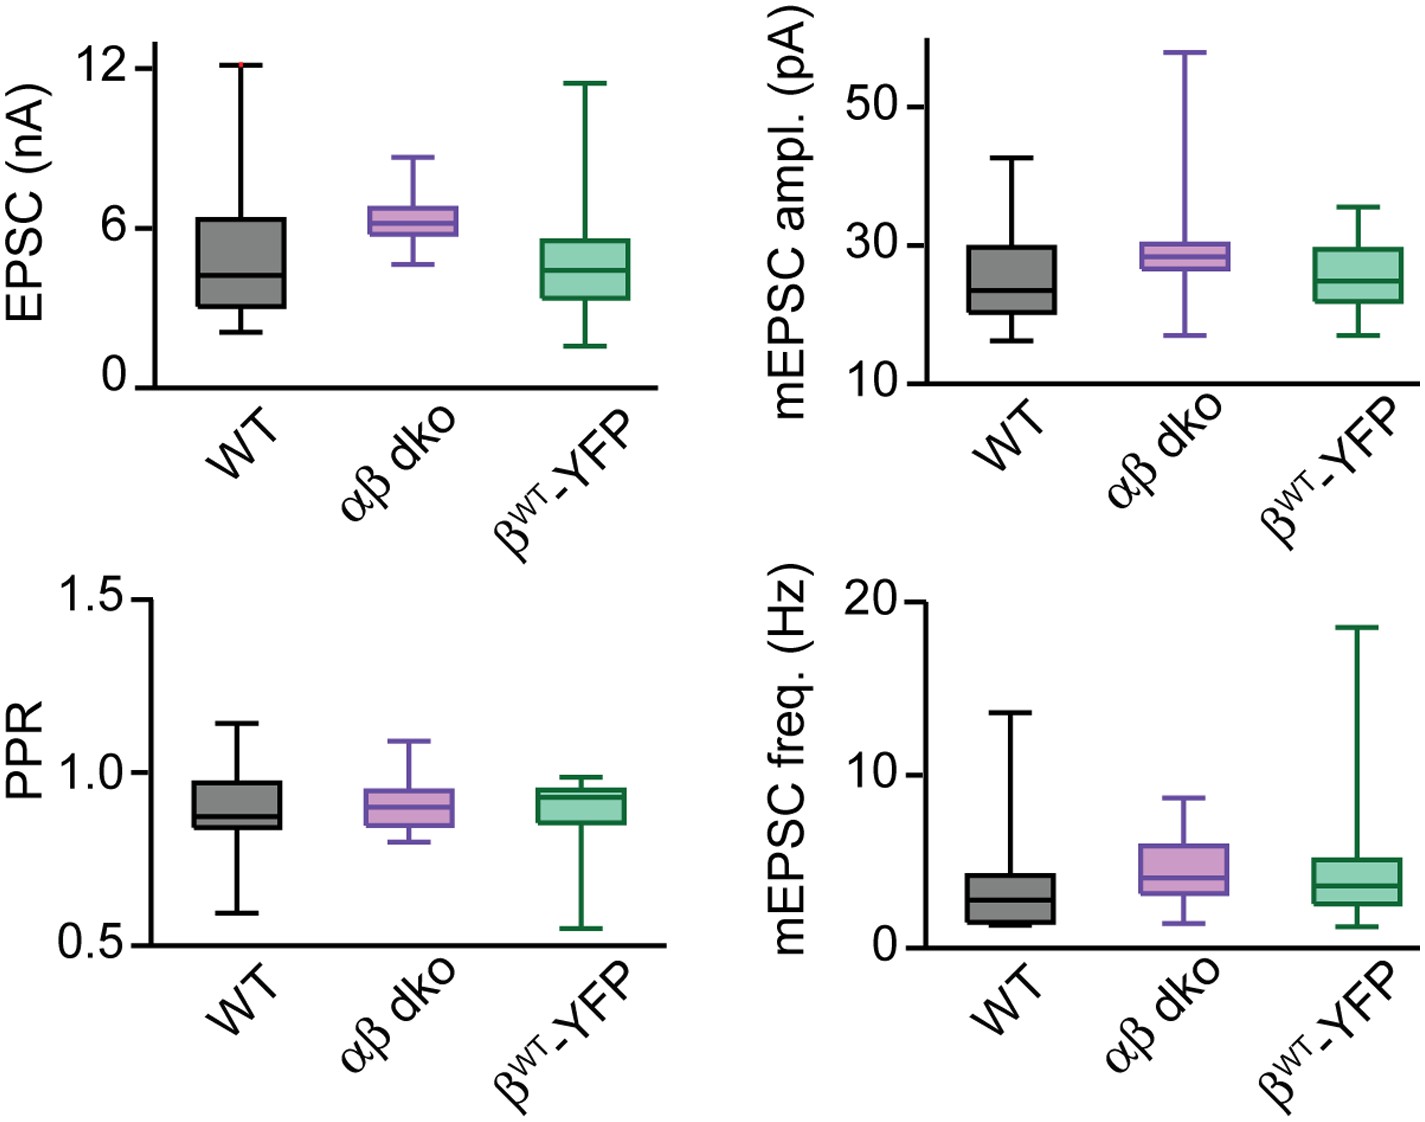
PKCCa isoforms do not regulate basal synaptic properties.
Box-plots of basal synaptic properties for wild-type (black), PKCαβ dko (purple), and PKCαβ dko groups expressing wild-type PKCβ (βWT-YFP; green). Medians and interquartile ranges (Q3-Q1) are shown. Whiskers extend to max and min values for each group. Box-plots were used to illustrate the full data range of each group; additionally, the data sets for mEPSC amplitude were not normally distributed.
Figure 1—figure supplement 5
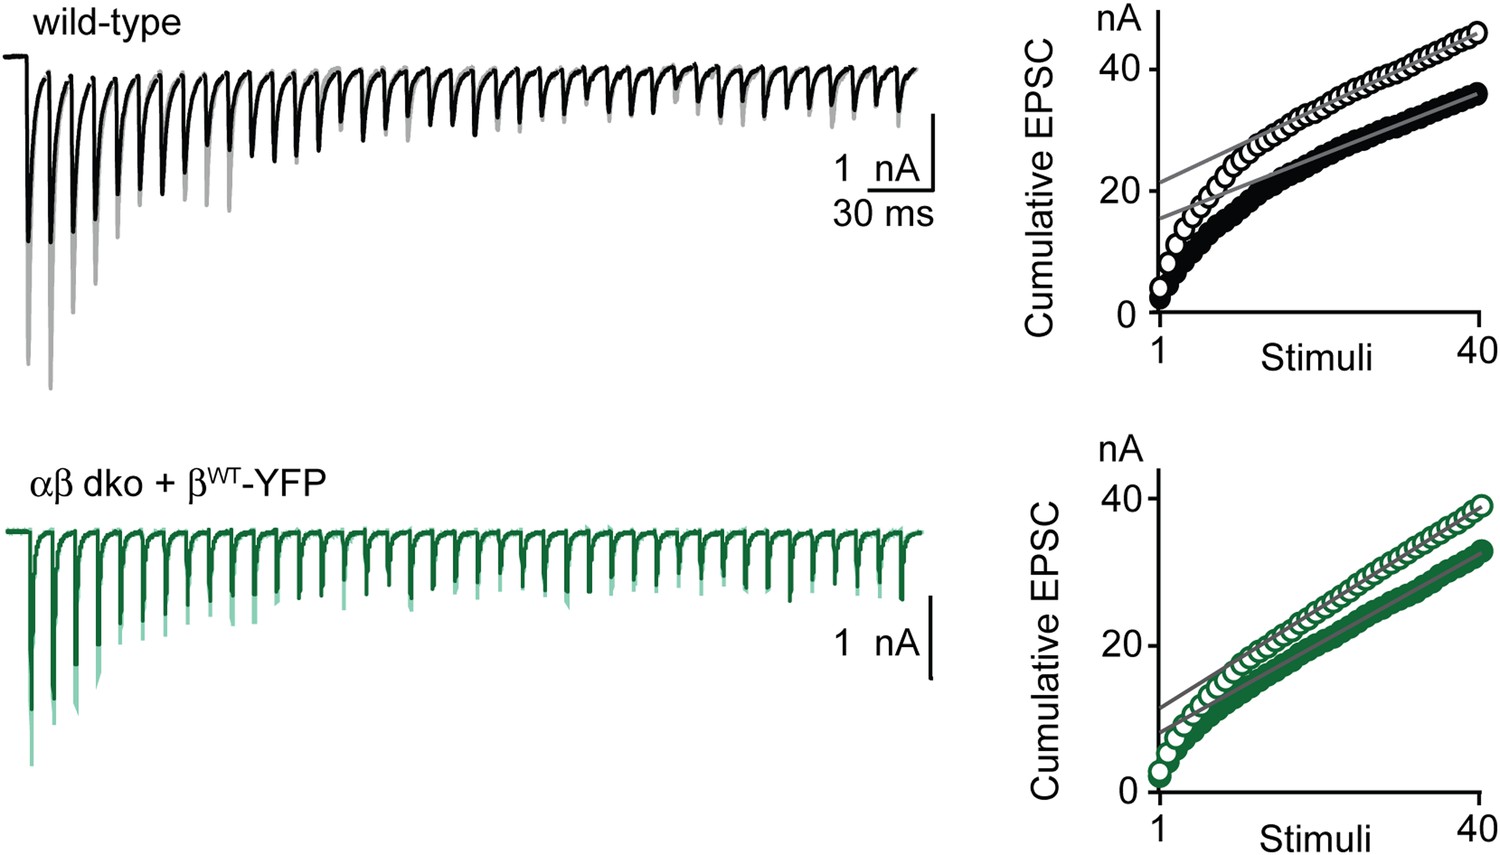
Determining the contributions of RRP and p in wild-type and rescued PTP at the functionally mature calyx of Held.
Synaptic mechanisms of PTP were examined using stimulus trains in the presence of kynurenate and CTZ. Left, example synaptic currents evoked by the first 40 stimuli of a 4 s, 100 Hz train (dark traces) and by a 40-pulse 100-Hz train (light traces) at the peak of PTP are shown for wild-type group (top) and PKCαβ dko group expressing wild-type PKCβ (βWT-YFP; bottom). Right, example plots of cumulative EPSC as a function of stimuli. The linear fits to the last 15 points, back-extrapolated to the y-axis, are shown and were used to determine the change in RRP size and p for the examples shown to the left according to the train method (see ‘Materials and methods’ for methodology).
Figure 1—figure supplement 6
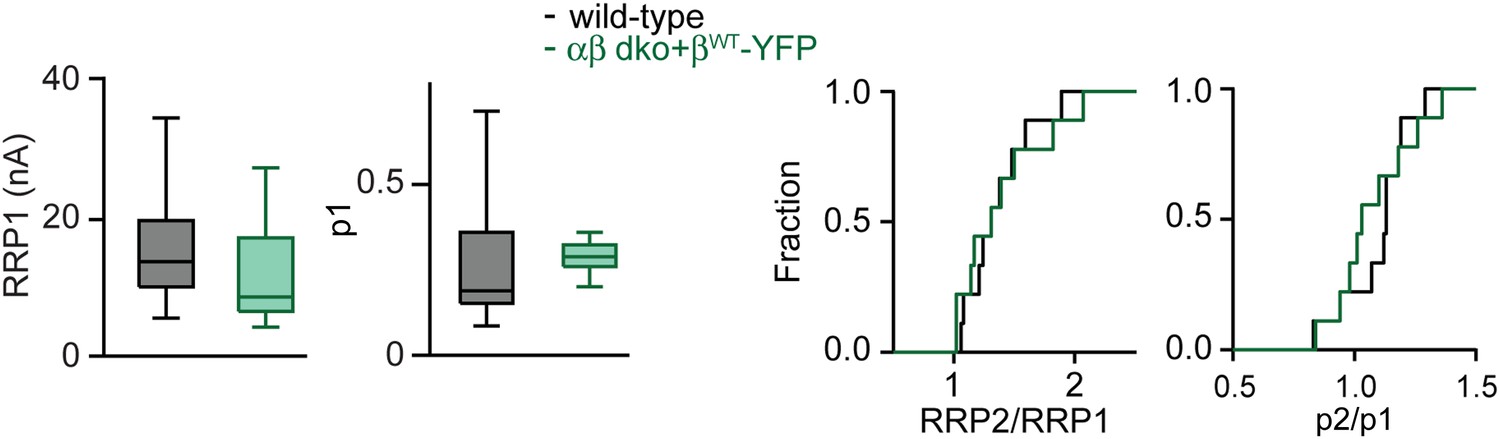
Determining the contributions of RRP and p in wild-type and rescued PTP at the functionally mature calyx of Held.
Synaptic mechanisms of PTP were examined using stimulus trains in the presence of kynurenate and CTZ. Left, box-plots of basal RRP size (RRP1; left) and basal p (p1; right), estimated from the 1st AP train for wild-type group (black) and αβ dko group expressing βWT-YFP (green). Medians and interquartile ranges (Q3-Q1) are shown. Whiskers extend to max and min values for each group. Box-plots were used to illustrate the full data range of each group. Right, cumulative histograms of changes in RRP (RRP2/RRP1) and p (p2/p1) with PTP.
Figure 2 with 1 supplement
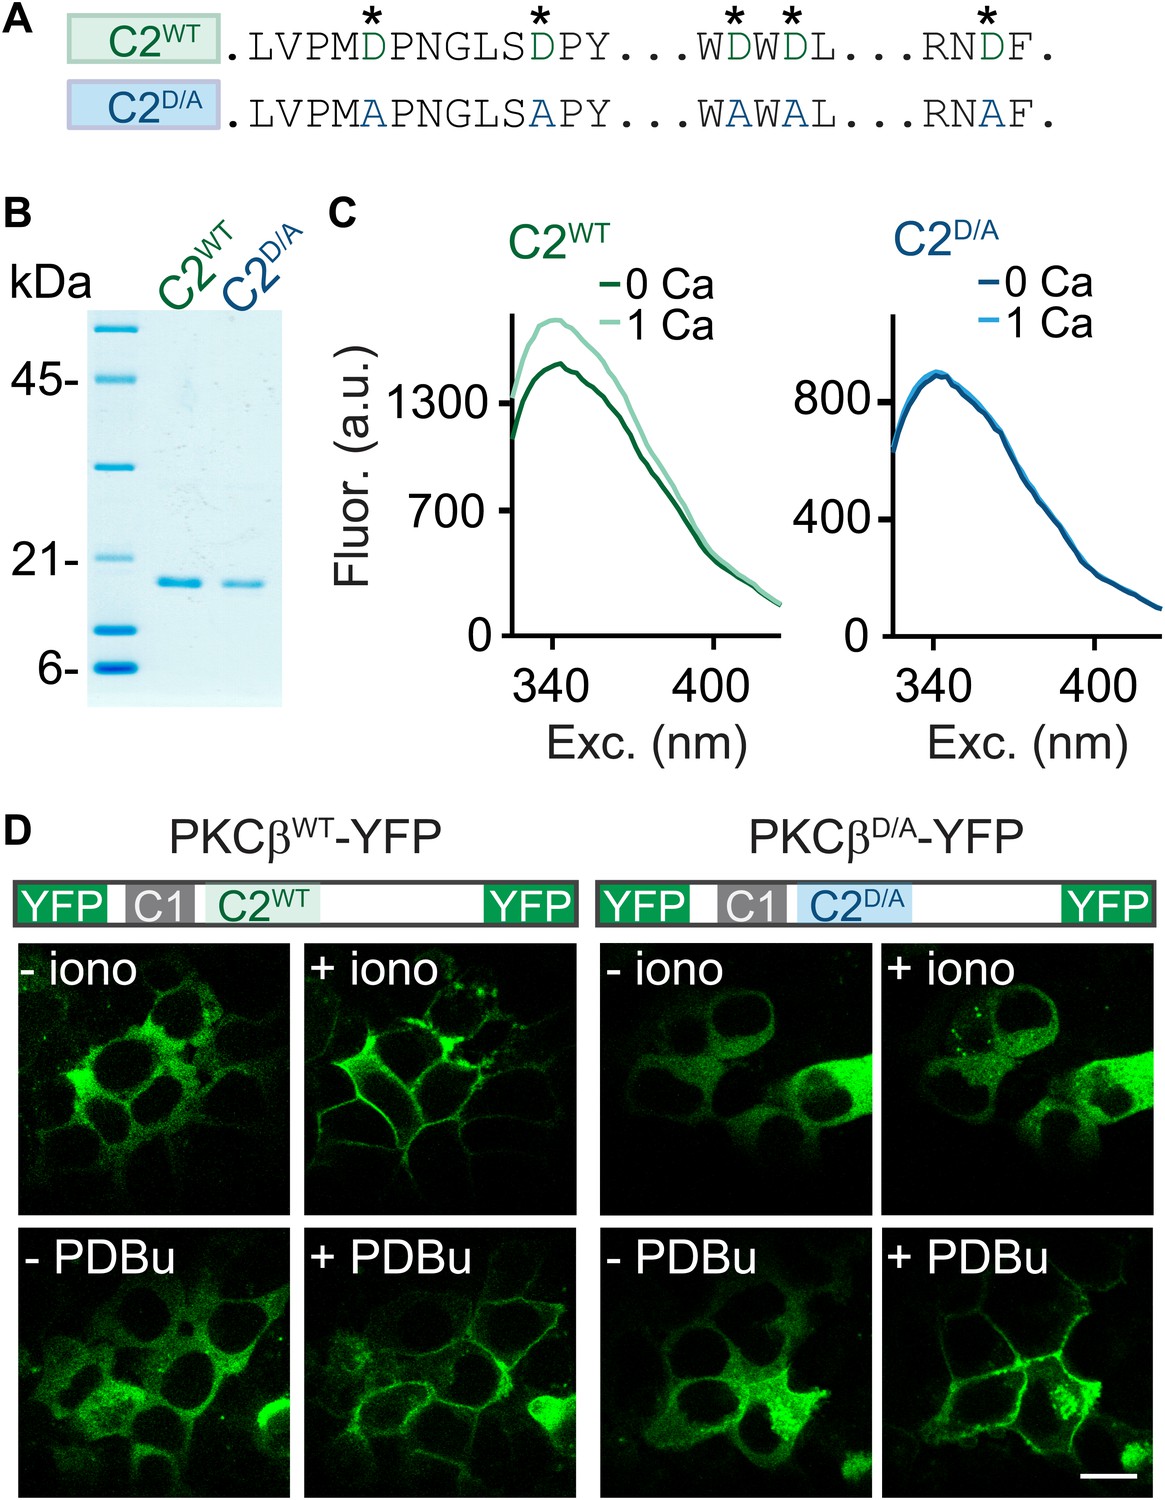
C2-domain mutations of PKCβ abolish Ca2+ binding and Ca2+-induced translocation without impairing phorbol ester-induced translocation.
(A) A partial sequence of the PKCβ C2 domain is shown with Ca2+-coordinating aspartates in green. These aspartates were mutated to alanines (blue) in the C2D/A construct. Also see Figure 2—figure supplement 1. (B) Coomassie blue-stained gel of recombinant wild-type (C2WT) and mutant (C2D/A) PKCβ C2 domains. (C) Averaged intrinsic tryptophan fluorescence is shown for C2WT and C2D/A. Fluorescence emission spectra were recorded in 0 mM Ca2+ (bold traces) and 1 mM Ca2+ (light traces). Peak fluorescence intensity change: C2WT:17 ± 1.3%; C2D/A: −1.3 ± 2.0%. (D) Translocation of PKCβWT-YFP (left) and PKCβD/A-YFP (right) in HEK293T cells was monitored in response to the Ca2+ ionophore ionomycin and in response to PDBu. Ca2+ increases caused PKCβWT-YFP to translocate, but not PKCβD/A-YFP. Both PKCβWT-YFP and PKCβD/A-YFP translocated in response to PDBu. Scale bar: 10 µm.
Figure 2—figure supplement 1
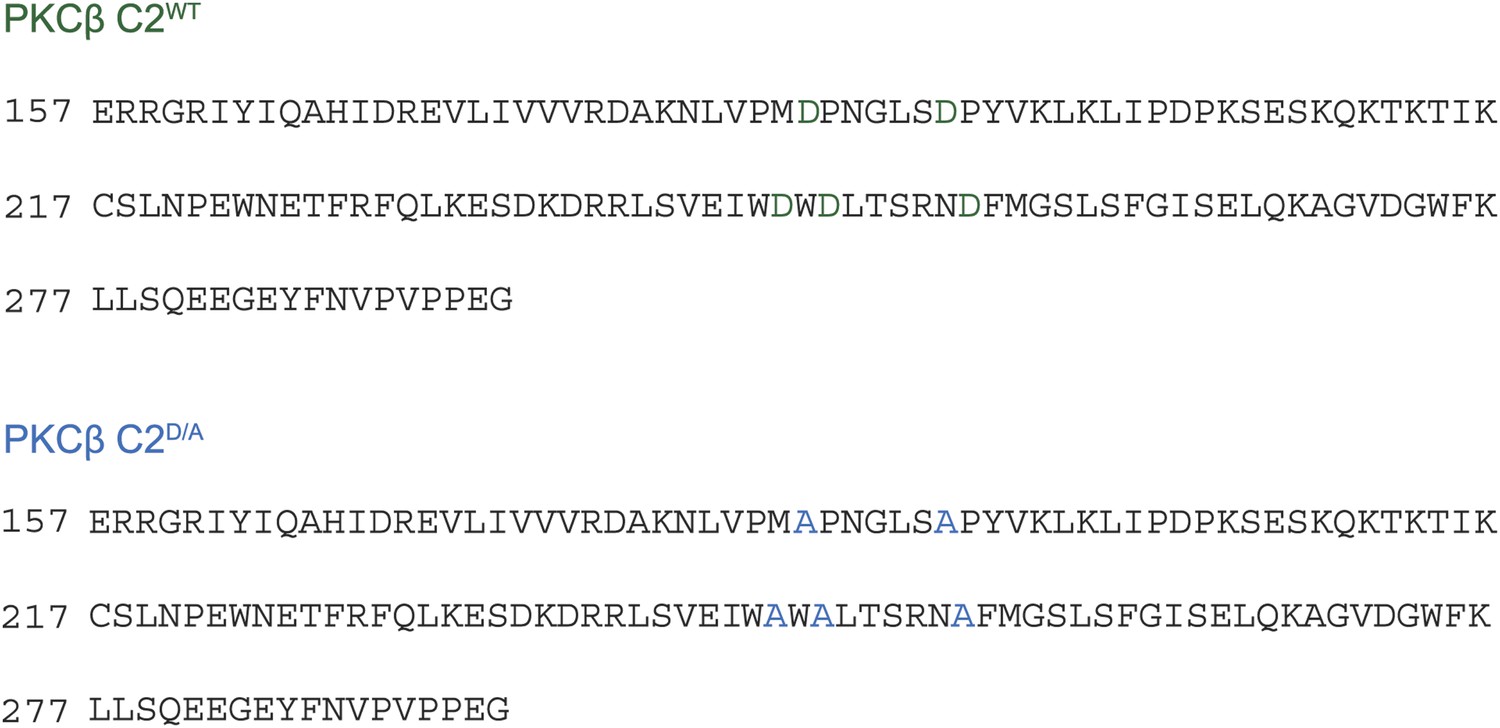
Protein sequence alignment for PKCβ C2WT and PKCβ C2D/A.
https://doi.org/10.7554/eLife.03011.013
Figure 3 with 1 supplement
PTP requires Ca2+ binding to PKCβ but phorbol ester-induced potentiation does not.
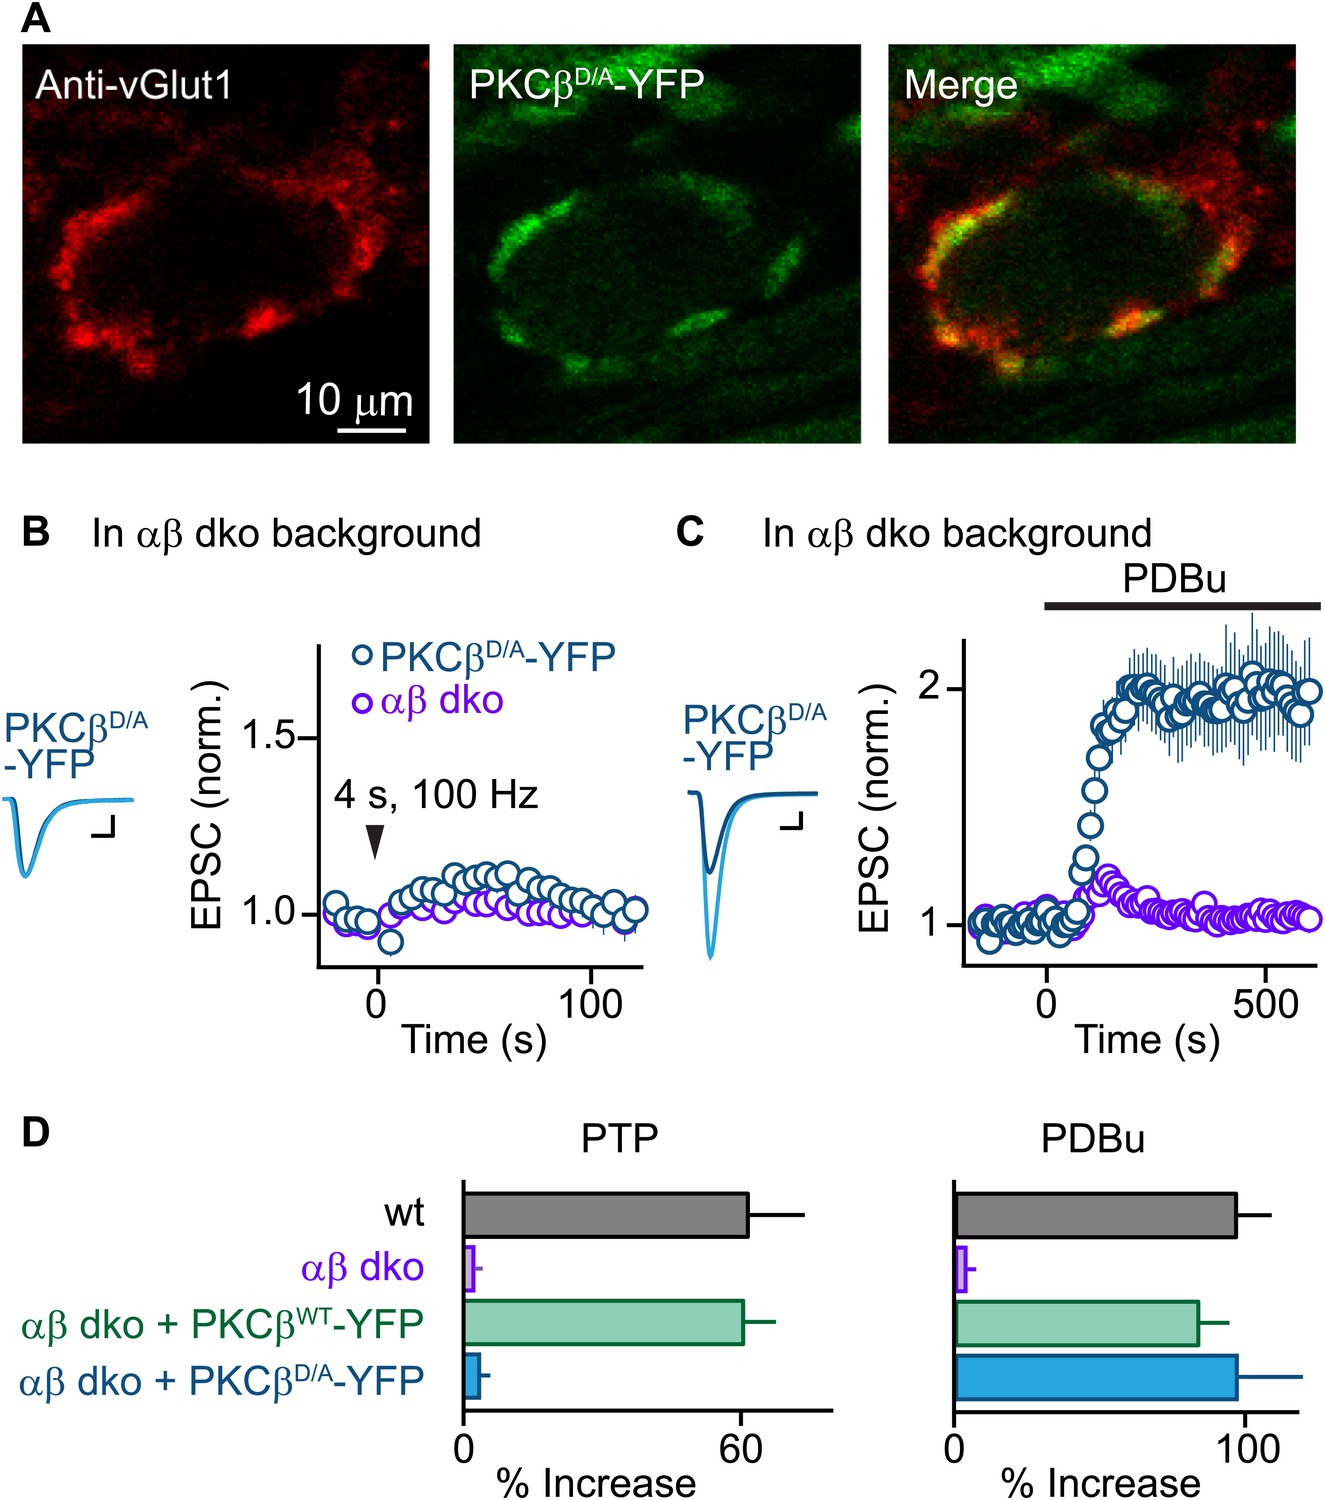
(A) Confocal images of a brain section labeled with an antibody against vGlut1 (red) are shown for a calyx of Held expressing PKCβD/A-YFP (green) in a PKCαβ dko animal. (B and C) Synaptic plasticity was examined in PKCαβ dko animals at calyces of Held expressing Ca2+-insensitive PKCβ (PKCβD/A-YFP, blue traces). Representative traces and time-courses (mean ± SEM) are shown following tetanic stimulation (B) and during bath application of PDBu (C). For (B), PKCβD/A: 3.6 ± 2.2%; for (C), PKCβD/A: 98 ± 23%. Scale bars: 1 nA, 1 ms. In (B and C), the αβ dko group data from Figure 1B,C respectively are re-plotted for comparison. For basal synaptic properties of the PKCβD/A-YFP-expressing group, see Figure 3—figure supplement 1 and Figure 3—source data 2. (D) Summary plots (mean ± SEM) of the magnitude of synaptic enhancement produced by tetanic stimulation (left) and by PDBu (right). Source data are provided in Figure 3—source data 1 and 2. See also Figure 1—source data 1 and 2.
-
Figure 3—source data 1
Summary and statistical analyses of synaptic properties during PTP and PDBu-induced potentiation.
- https://doi.org/10.7554/eLife.03011.015
-
Figure 3—source data 2
Summary and statistical analyses of basal synaptic properties.
- https://doi.org/10.7554/eLife.03011.016
Figure 3—figure supplement 1
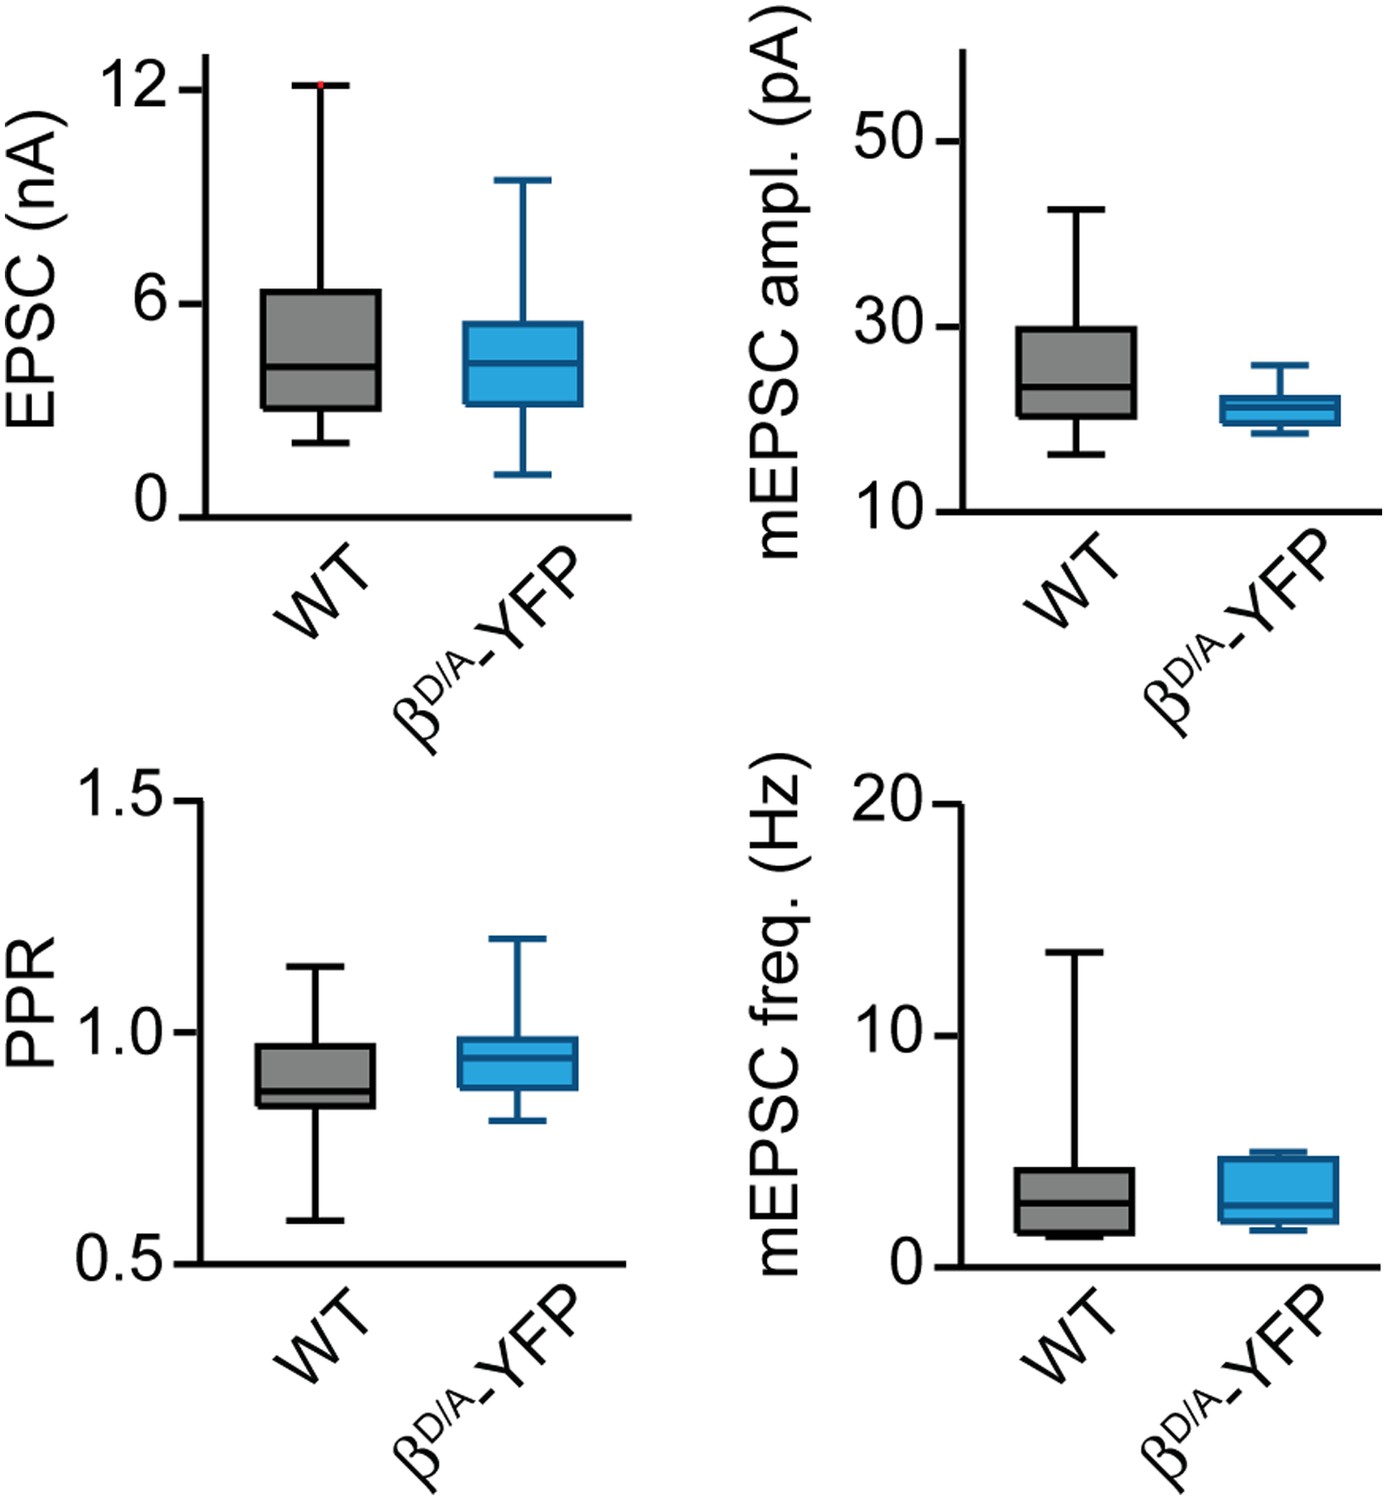
Basal synaptic properties are not altered by PKCβD/A-YFP expression.
Box-plots of basal synaptic properties for wild-type (black) and PKCαβ dko groups expressing D-to-A mutant PKCβ (βD/A-YFP; blue). Medians and interquartile ranges (Q3–Q1) are shown. Whiskers extend to max and min values for each group.
Download links
A two-part list of links to download the article, or parts of the article, in various formats.
Downloads (link to download the article as PDF)
Open citations (links to open the citations from this article in various online reference manager services)
Cite this article (links to download the citations from this article in formats compatible with various reference manager tools)
RETRACTED: Protein kinase C is a calcium sensor for presynaptic short-term plasticity
eLife 3:e03011.
https://doi.org/10.7554/eLife.03011


