Quantitative proteomic analysis reveals posttranslational responses to aneuploidy in yeast
- Harvard Medical School, United States
- University of Massachusetts Medical School, United States
- Howard Hughes Medical Institute, Massachusetts Institute of Technology, United States
Figures
Figure 1 with 2 supplements
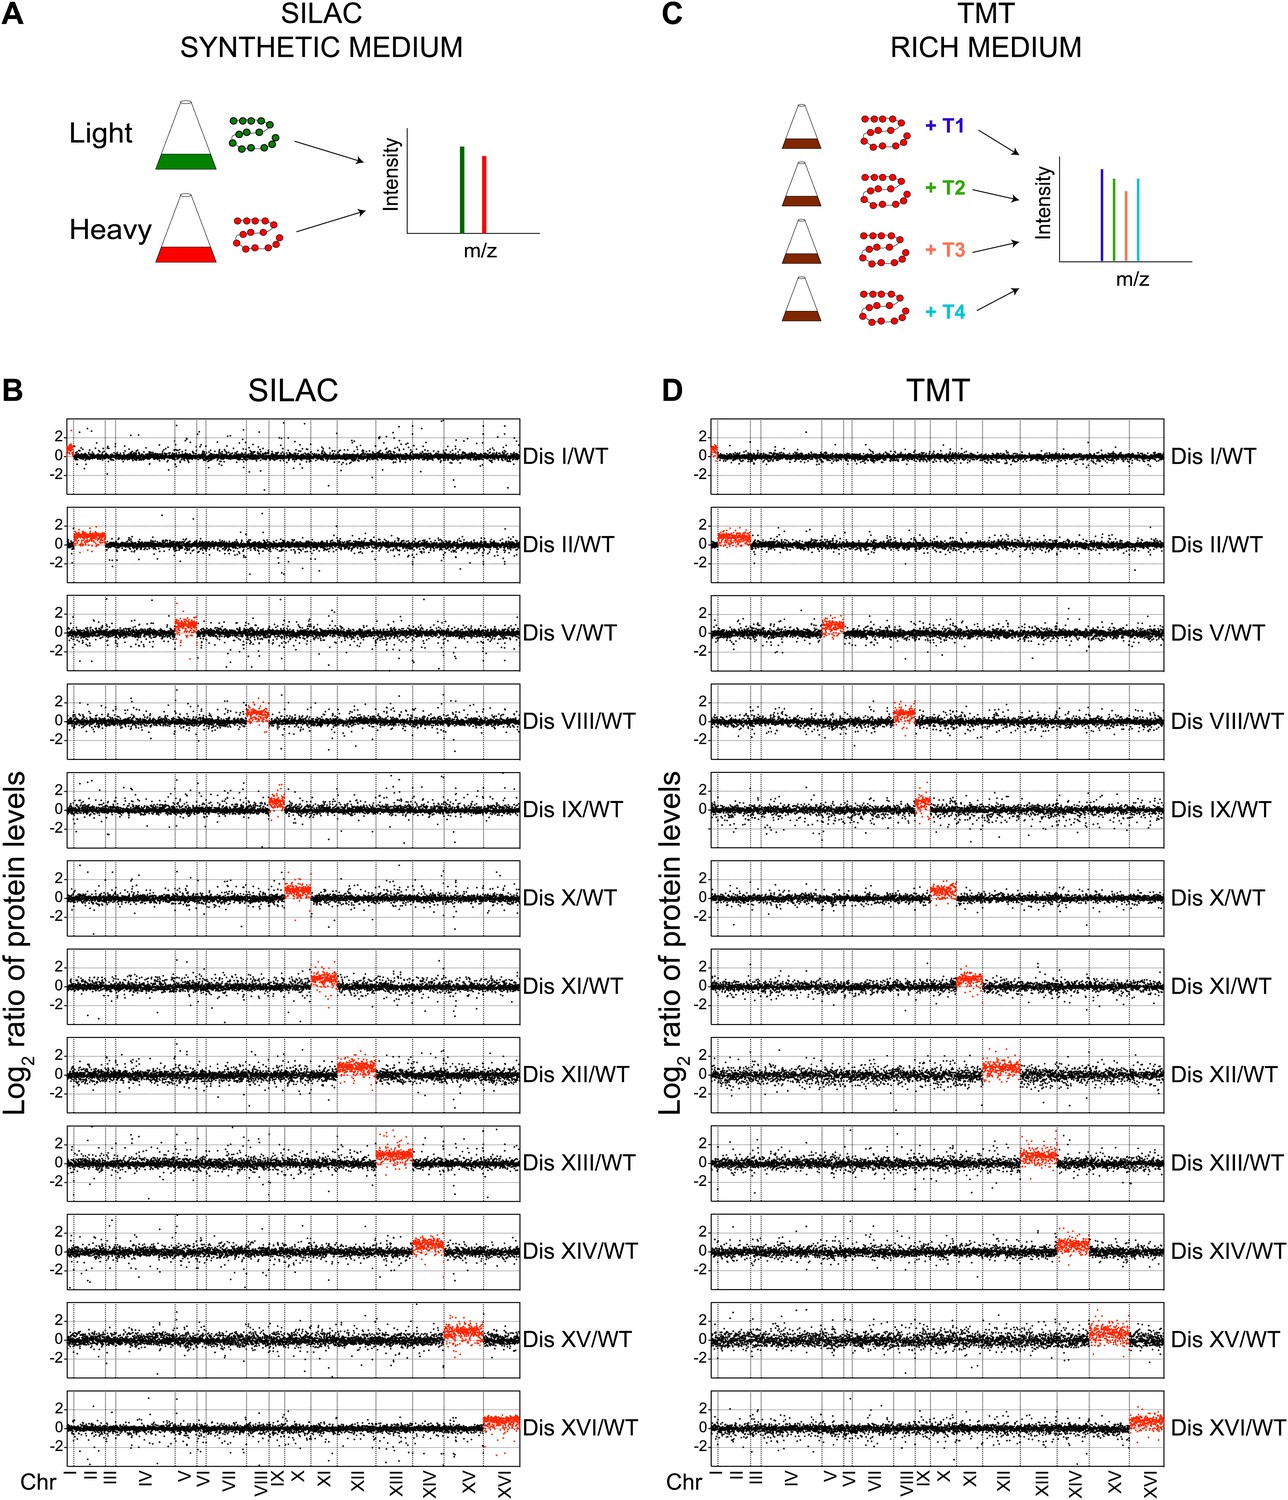
Proteome quantification of aneuploid yeast strains.
(A) Schematic of the approach utilized in stable isotope labeling of amino acids in cell culture (SILAC) and liquid chromatography—mass spectrometry. (B) The plots show the log2 ratio of the relative protein abundance of disomes compared to wild-type cells grown in synthetic medium. Protein levels are shown in the order of the chromosomal location of their encoding genes. Protein levels of duplicated chromosomes are shown in red. (C) Schematic of the approach utilized in isobaric tandem mass tag (TMT)-based quantitative mass spectrometry. (D) The plots show the log2 ratio of the relative protein abundance of disomes compared to wild-type cells grown in rich medium (YEPD). Protein levels are shown in the order of the chromosomal location of their encoding genes. Protein levels of duplicated chromosomes are shown in red.
-
Figure 1—source data 1
TMT and SILAC data.
- https://doi.org/10.7554/eLife.03023.004
Figure 1—figure supplement 1
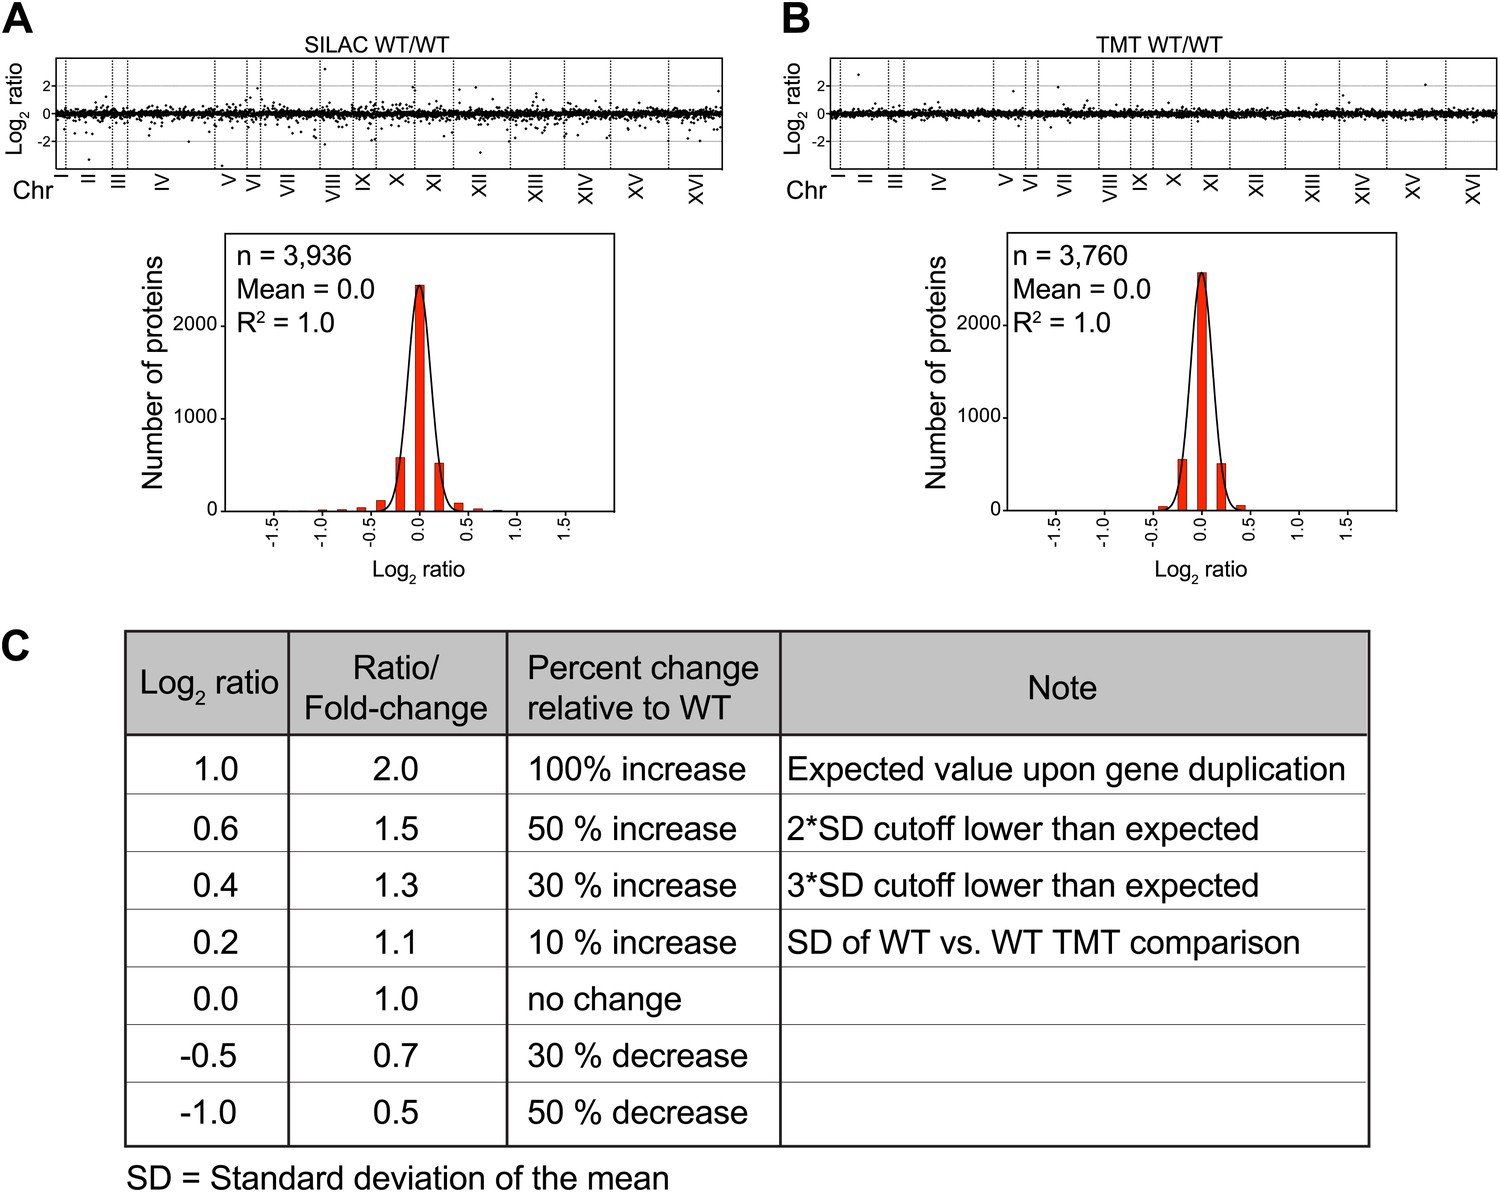
SILAC and TMT mass spectrometry of wild-type vs wild-type cells.
(A) The plots show the log2 ratio of the relative protein abundance of wild-type/wild-type cells grown in synthetic medium (upper panel). Protein levels are shown in the order of the chromosomal location of their encoding genes. Histogram of the log2 ratios of the protein levels of wild-type/wild-type cells (lower panel). Fit to a normal distribution is shown (black line). (B) The plots show the log2 ratio of the relative protein abundance of wild-type/wild-type cells grown in YEPD medium (upper panel). Protein levels are shown in the order of the chromosomal location of their encoding genes. Histogram of the log2 ratios of the protein levels of wild-type/wild-type cells (lower panel). Fit to a normal distribution is shown (black line). (C) Chart of conversion of log2 ratios to fold changes.
Figure 1—figure supplement 2
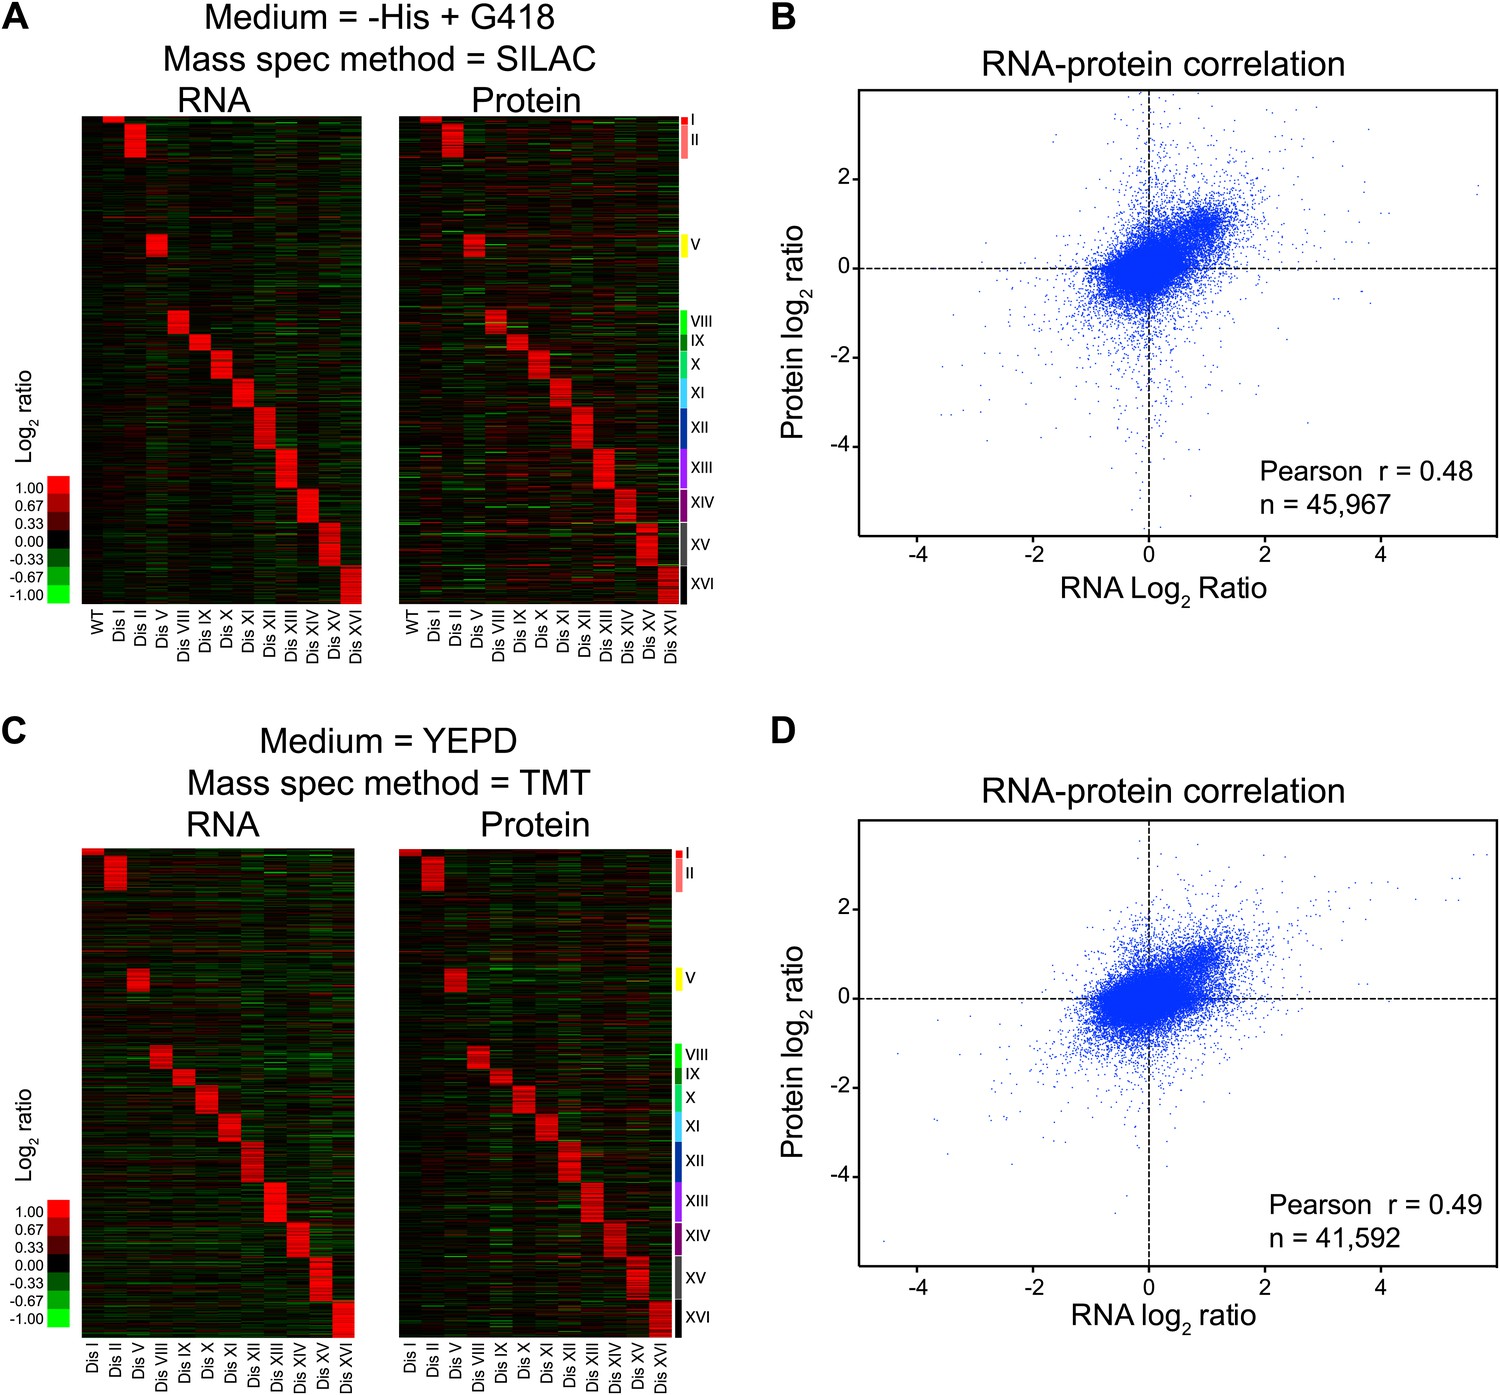
Transcriptome and proteome quantification of aneuploid yeast strains.
(A) Gene expression and protein levels of wild-type and aneuploid strains grown in synthetic medium, ordered by chromosome position. Experiments (columns) are ordered by the number of the chromosome that is present in two copies. (B) Comparison of the mRNA vs protein levels in aneuploid strains grown synthetic medium. Pairwise comparison show a Pearson correlation coefficient (r) = 0.48. (C) Gene expression and protein levels of aneuploid strains relative to wild-type cells grown in YEPD medium, ordered by chromosome position. Experiments (columns) are ordered by the number of the chromosome that is present in two copies. (D) Comparison of the mRNA vs protein levels in aneuploid strains grown YEPD medium. Pairwise comparison show a Pearson correlation coefficient (r) = 0.49.
Figure 2 with 2 supplements
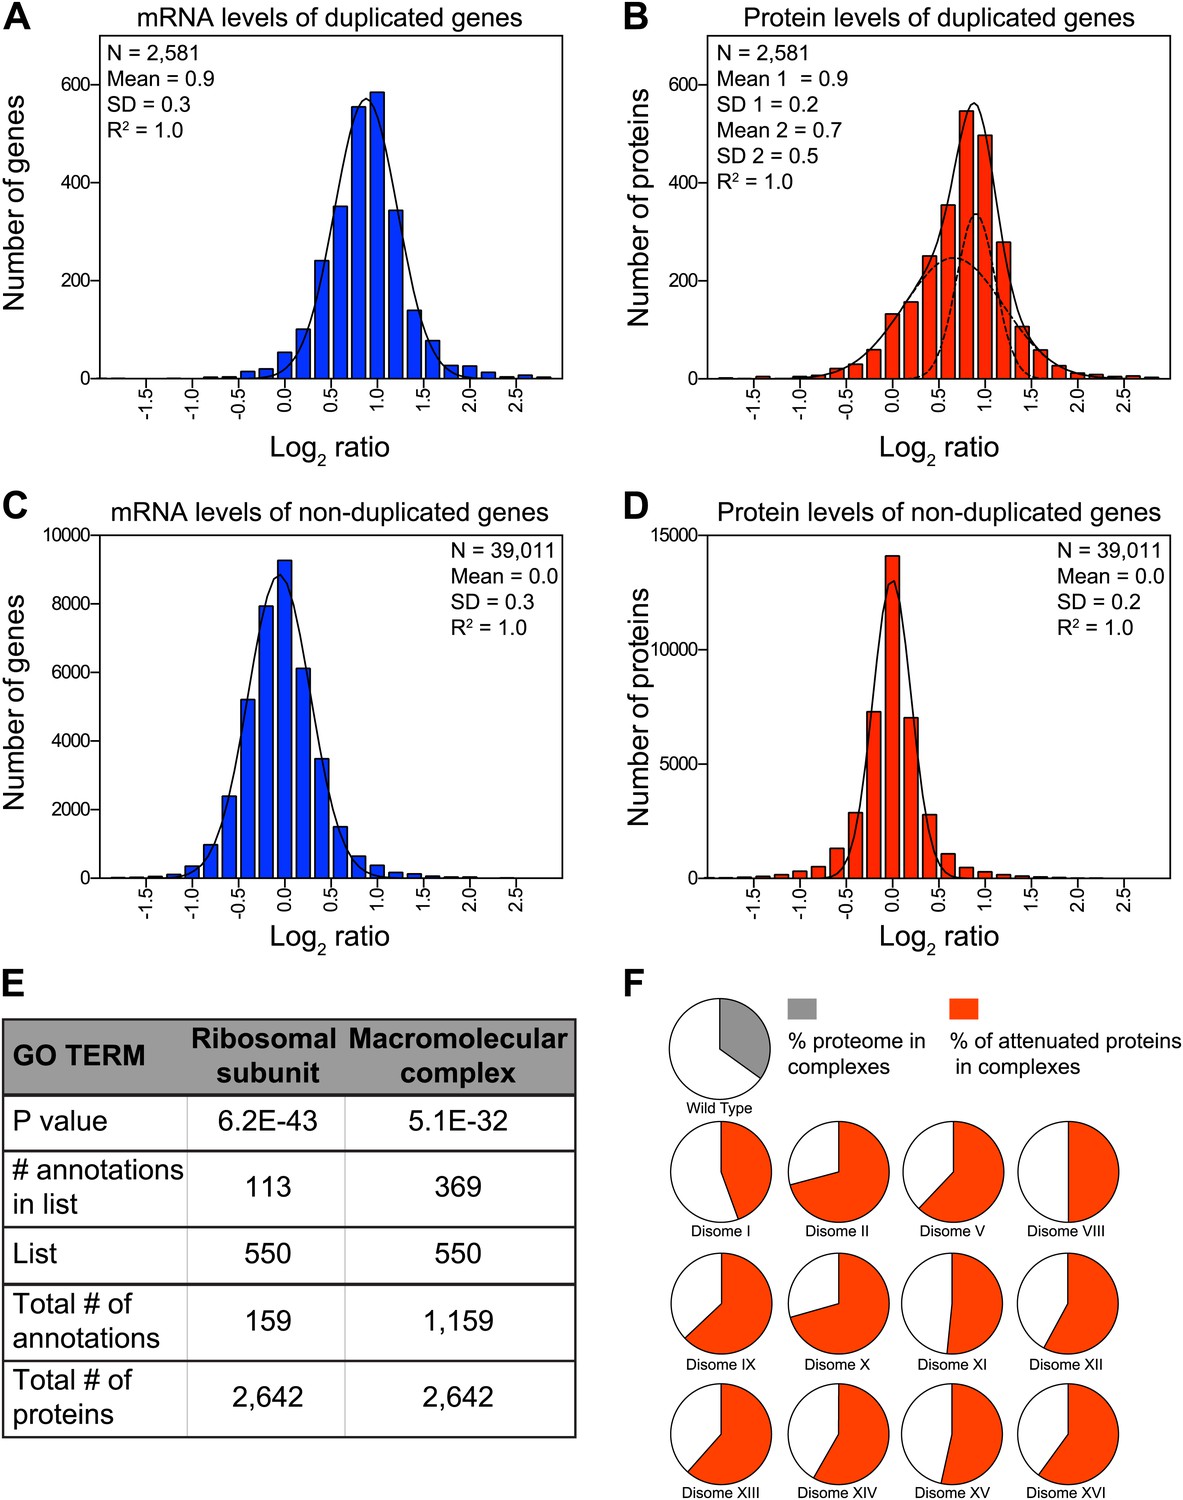
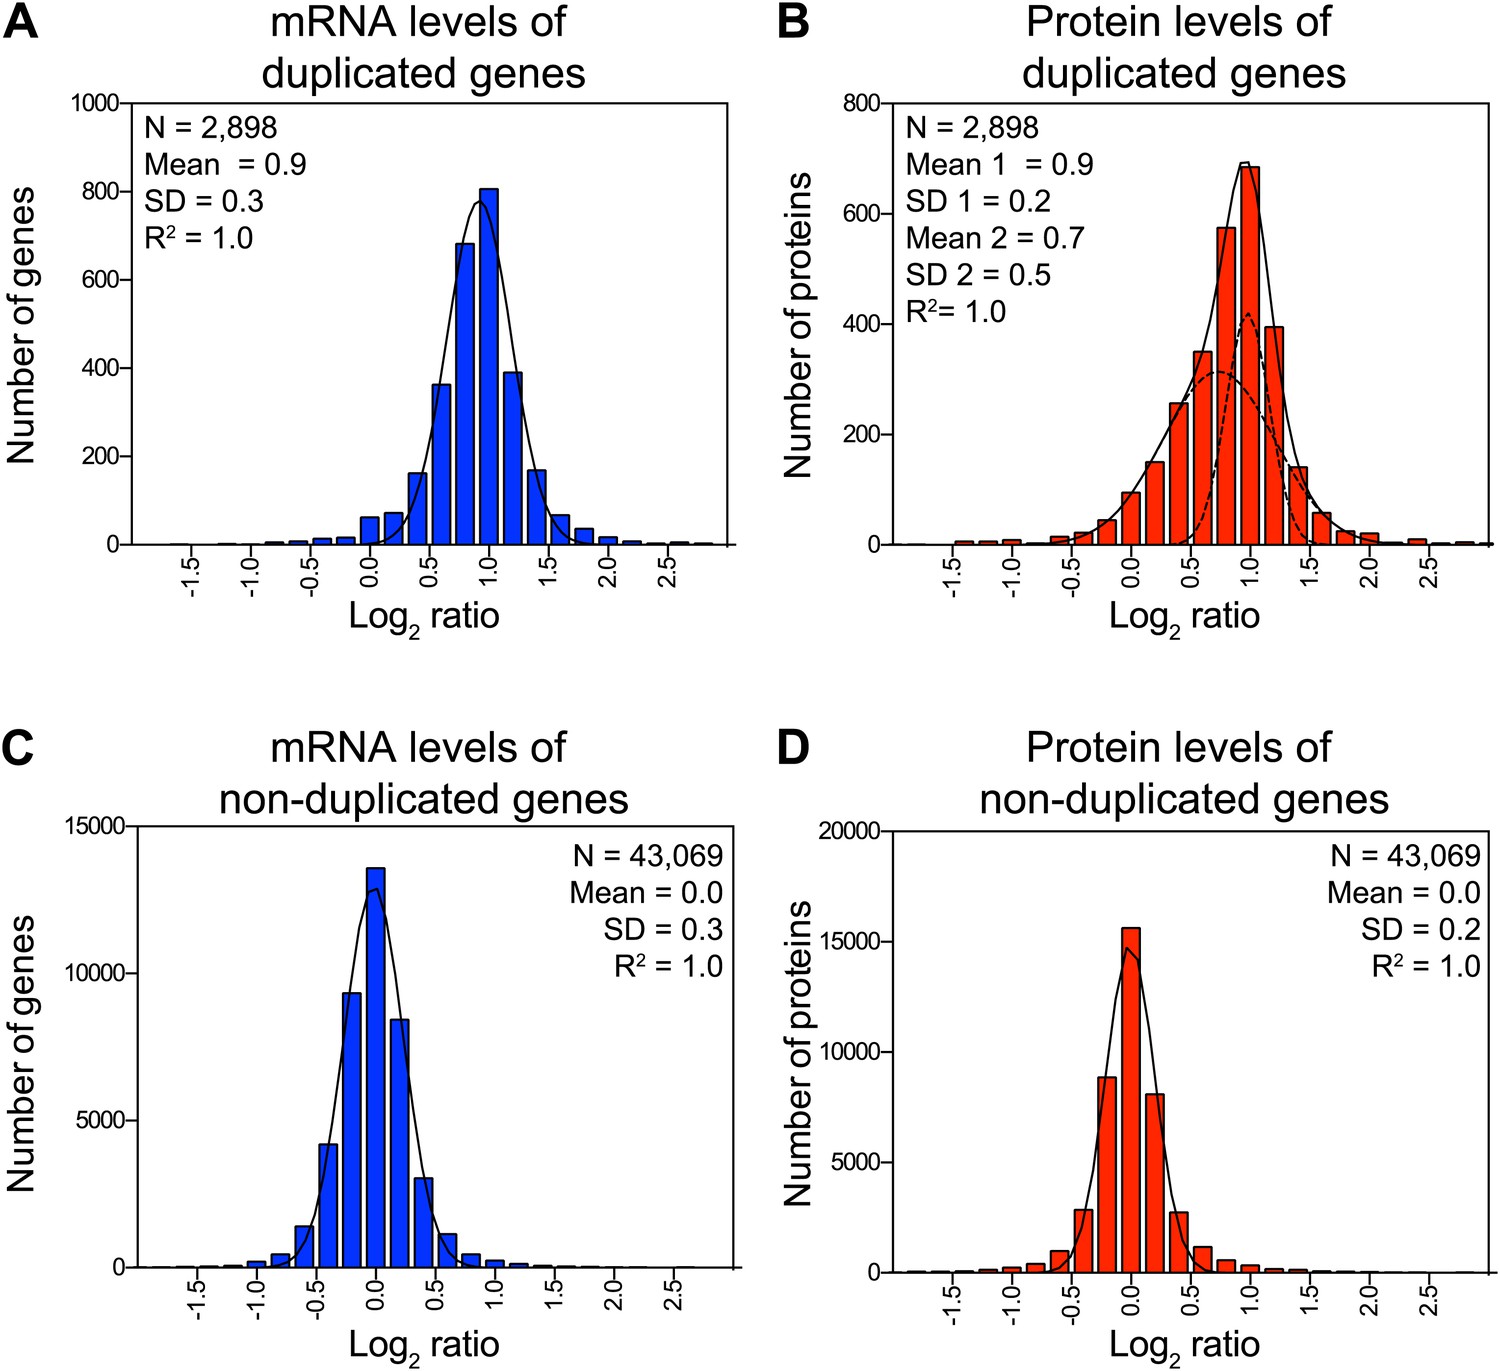
Attenuation of proteins encoded on duplicated chromosomes.
(A) Histogram of the log2 ratios of the relative mRNA levels of duplicated genes of 12 disomes relative to wild-type grown in YEPD medium. Fit to a normal distribution is shown (black line). (B) Histogram of the log2 ratios of the relative protein levels of duplicated genes of 12 disomes relative to wild-type. Fit to the sum of two normal distributions is shown (black line). Fit of individual distributions are shown in dashed-line. (C) Histogram of the log2 ratios of the relative mRNA levels of non-duplicated genes of 12 disomes relative to wild-type grown in YEPD medium. Fit to a normal distribution is shown (black line). (D) Histogram of the log2 ratios of the relative protein levels of non-duplicated genes of 12 disomes relative to wild-type grown in YEPD medium. Fit to a normal distribution is shown (black line). (E) Gene Ontology enrichment analysis of 550 proteins encoded on duplicated genes that are significantly attenuated (log2 ratios ≤ 0.4). (F) Pie chart representation of the relative number of all proteins predicted to form part of complexes in the yeast genome is shown in gray (33%). Pie chart representation of the relative number of proteins that are significantly attenuated and are part of macromolecular complexes in every disome are shown in red.
-
Figure 2—source data 1
Gene expression data.
- https://doi.org/10.7554/eLife.03023.008
-
Figure 2—source data 2
GO enrichment analysis.
- https://doi.org/10.7554/eLife.03023.009
Figure 2—figure supplement 1
Attenuation of proteins encoded on duplicated chromosomes.
(A) Histogram of the log2 ratios of the relative mRNA levels of duplicated genes of 12 disomes relative to wild-type grown in synthetic medium. Fit to a normal distribution is shown (black line). (B) Histogram of the log2 ratios of the relative protein levels of duplicated genes of 12 disomes relative to wild-type grown in synthetic medium. Fit to the sum of two normal distributions is shown (black line). Fit of individual distributions are shown in dashed-line. (C) Histogram of the log2 ratios of the relative mRNA levels of non-duplicated genes of 12 disomes relative to wild-type grown in grown in synthetic medium. Fit to a normal distribution is shown (black line). (D) Histogram of the log2 ratios of the relative protein levels of non-duplicated genes of 12 disomes relative to wild-type grown in synthetic medium. Fit to a normal distribution is shown (black line).
Figure 2—figure supplement 2

Gene ontology analysis of attenuated proteins.
(A) Gene Ontology enrichment analysis of 486 proteins encoded on duplicated genes that are significantly attenuated (log2 ratios ≤ 0.4). (B) Overlap between attenuated protein in disomes grown in YEPD vs synthetic medium.
Figure 3 with 2 supplements

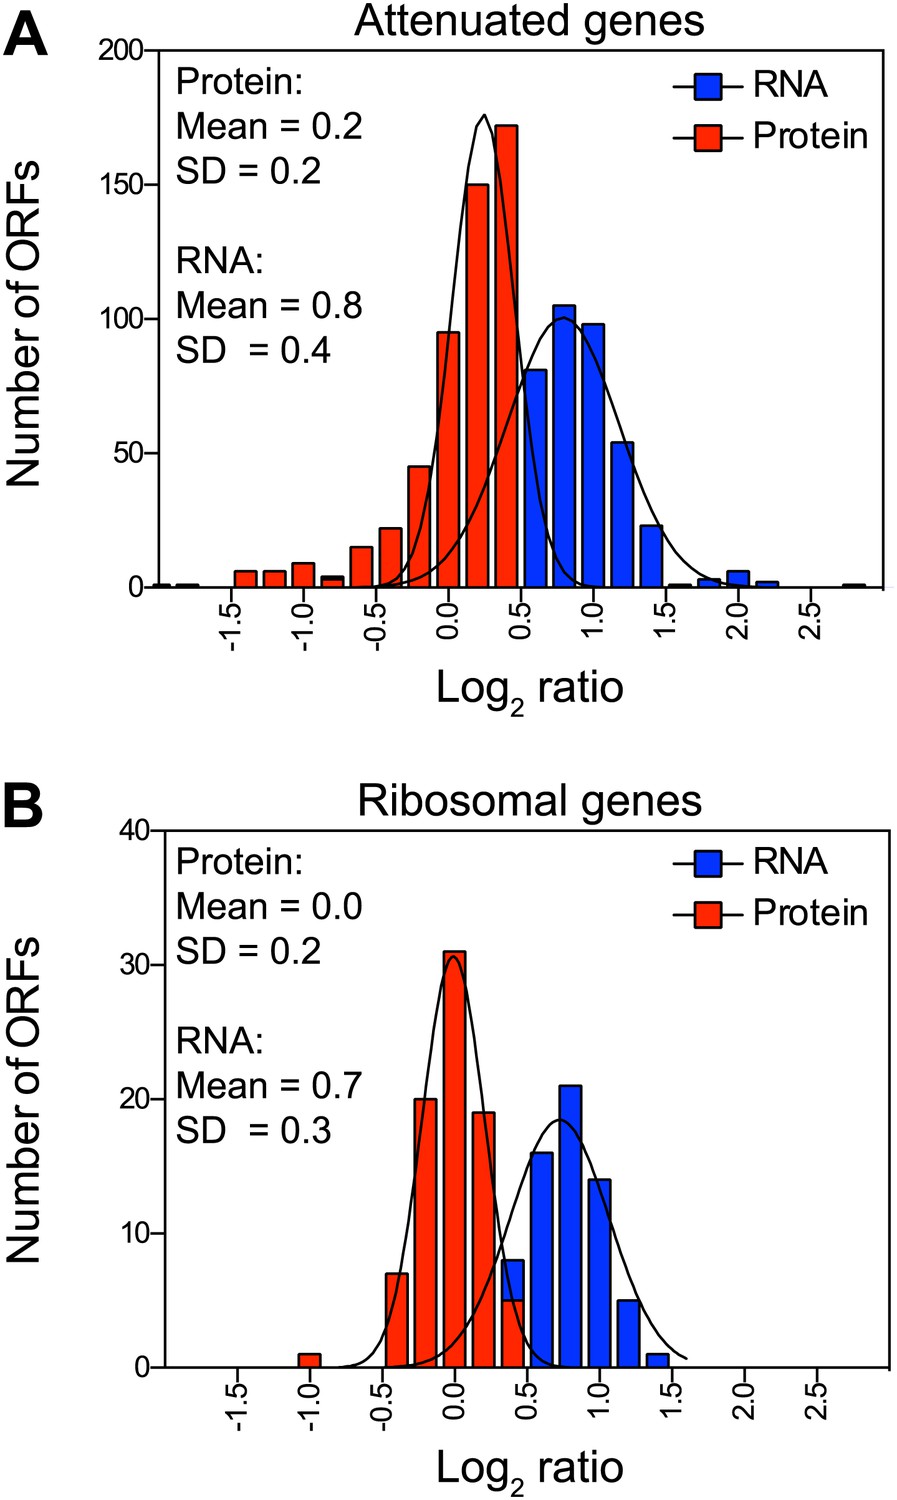
Attenuation takes place posttranslationally.
(A) Histograms of the log2 ratios of the relative mRNA (blue) and protein levels (red) of the 550 attenuated proteins from disomic cells grown in YEPD medium compared to wild-type. Fits to a normal distribution are shown (black lines). (B) Histograms of the log2 ratios of the relative mRNA (blue) and protein levels (red) of 88 ribosomal protein genes. Fits to a normal distribution are shown (black lines). (C) The plots show the log2 ratio of the relative mRNA levels, mRNA footprints and protein abundance of disomes V and XVI compared to wild-type cells. mRNA levels, mRNA footprints and protein levels are shown in the order of the chromosomal location of their encoding genes. Log2 ratios of the duplicated chromosomes are shown in red. (D) Histograms of the log2 ratios of the relative mRNA footprints (blue) and protein levels (red) of attenuated genes of disomes V and XVI compared to wild-type cells (top). Histograms of the log2 ratios of the relative mRNA footprints (blue) and protein levels (red) of non-attenuated genes of disomes V and XVI compared to wild-type cells (bottom).
-
Figure 3—source data 1
RNA-Seq and ribosome footprints of disome V.
- https://doi.org/10.7554/eLife.03023.013
Figure 3—figure supplement 1
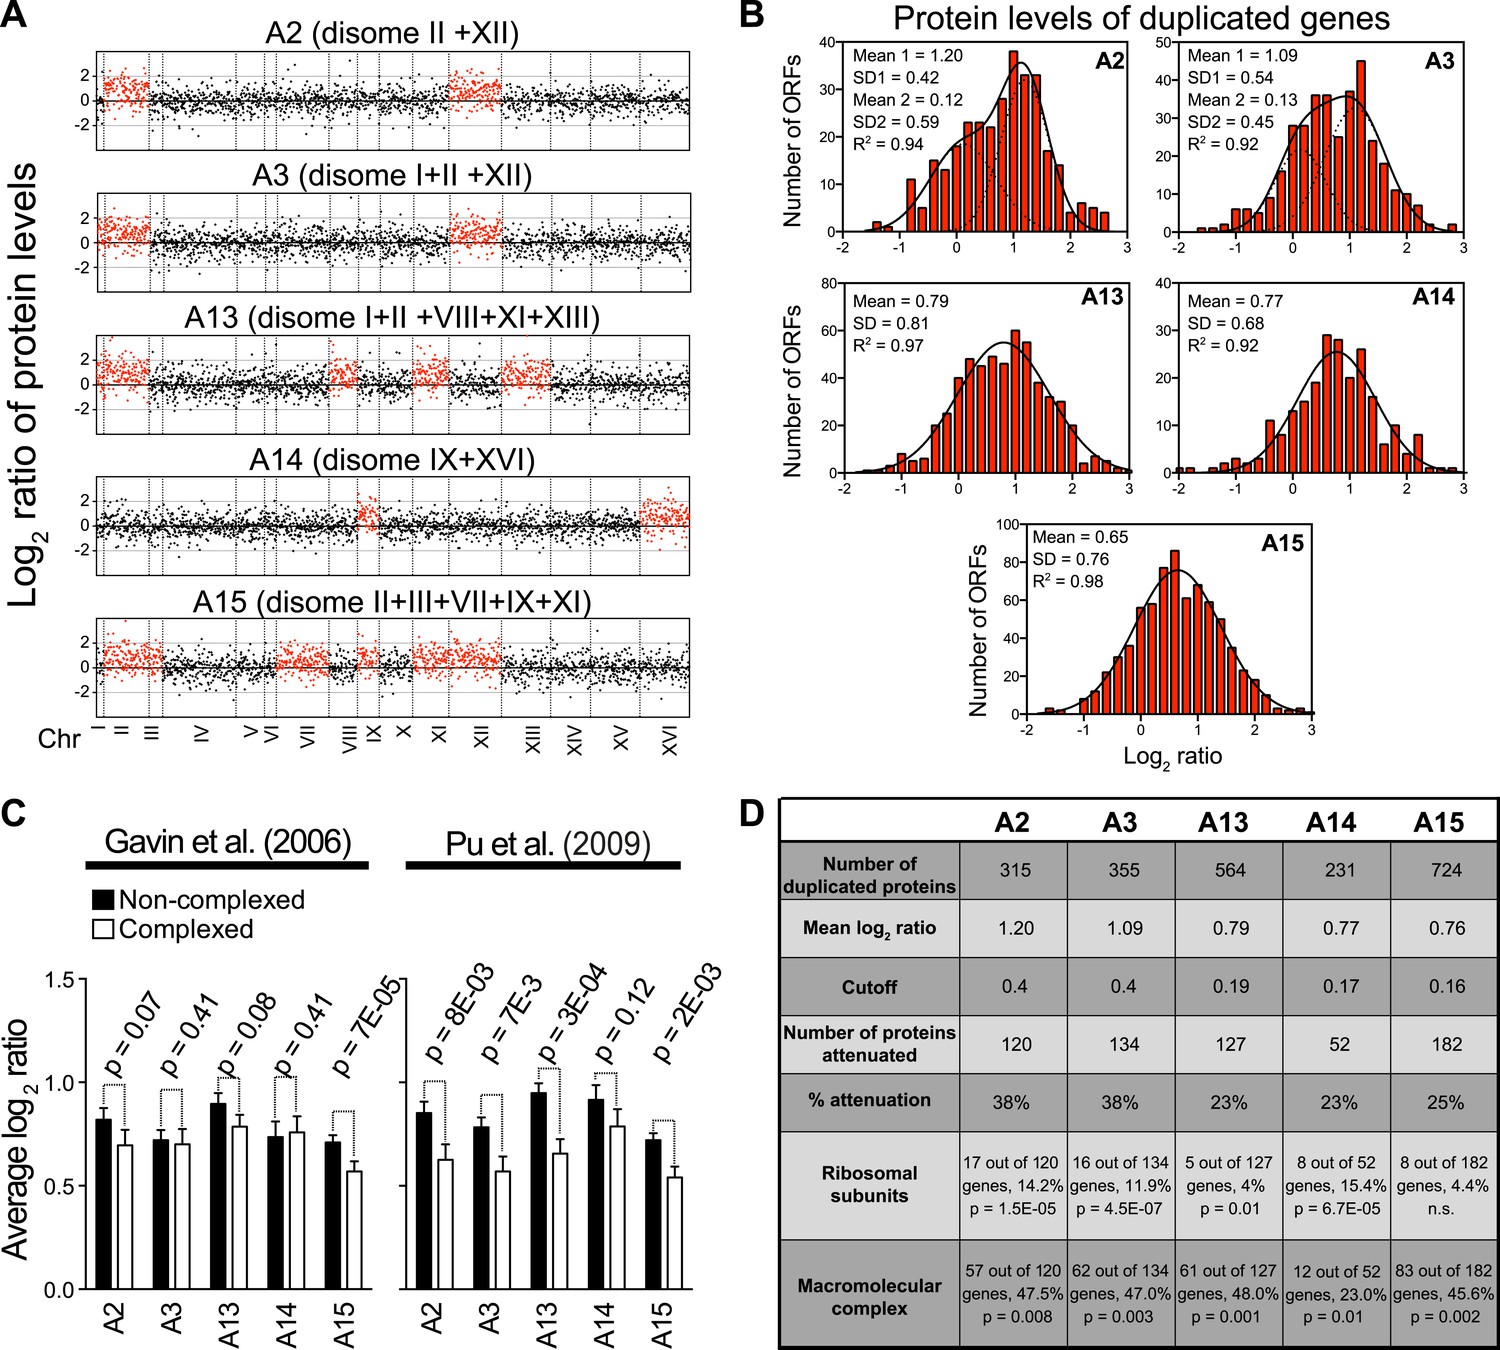
Analysis of proteome changes of meiotically generated aneuploid strains.
(A) The plots show the log2 ratio of the relative protein abundance of five meiotically generated aneuploid strains compared to wild-type cells as reported in Pavelka et al. (2010). The duplicated chromosomes are indicated. Protein levels are shown in the order of the chromosomal location of their encoding genes. (B) Histogram of the log2 ratios of the relative protein levels of duplicated genes relative to wild-type genes from Pavelka et al. (2010). In each plot, a fit to a normal distribution or the sum of two normal distributions is shown (black line). Fit of individual distributions are shown in dashed-line. (C) Attenuation of proteins encoded on duplicated chromosomes of meiotically generated aneuploid strains. For each of the five meiotically generated aneuploid strains, the mean log2 ratio to wild-type cells for all duplicated genes is plotted separately for proteins annotated as protein complex members and those that are not. The left plot uses the set of Core Complex proteins defined in Gavin et al. (2006). The right plot uses a set of manually curated protein complexes from Pu et al. (2009). p-values were calculated using Welch's t test. (D) Attenuation of duplicated proteins in the meiotically generated set of aneuploid yeast strains. p-values were calculated using Welch's t test.
Figure 3—figure supplement 2
Attenuation takes place posttranslationally in cells grown in selective medium.
(A) Histograms of the log2 ratios of the relative mRNA (blue) and protein levels (red) of the 486 attenuated proteins from disomic cells grown in synthetic medium compared to wild-type. Fits to a normal distribution are shown (black lines). (B) Histograms of the log2 ratios of the relative mRNA (blue) and protein levels (red) of 83 ribosomal protein genes. Fits to a normal distribution are shown (black lines).
Figure 4 with 1 supplement
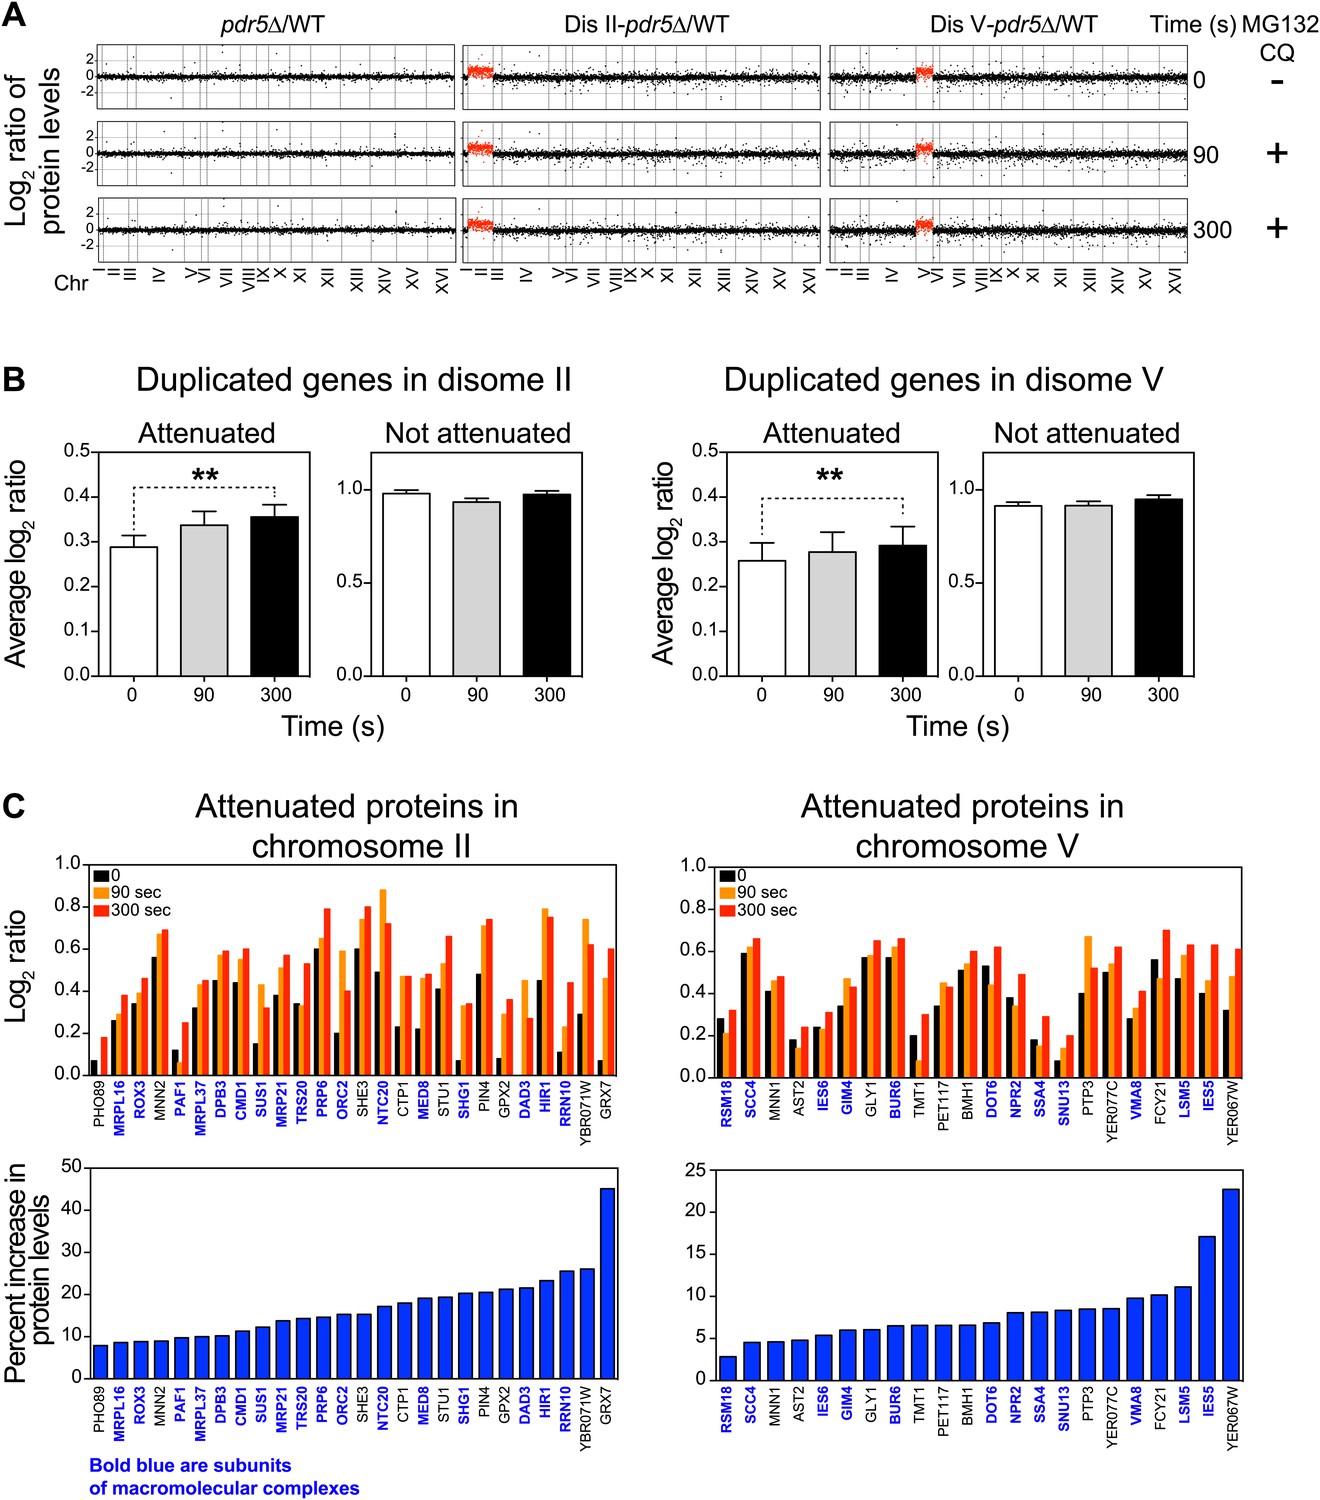
Inhibition of protein degradation leads to increases in levels of attenuated proteins.
(A) The plots show the log2 ratio of the relative protein abundance of disomes compared to wild-type cells and disomes II and V harboring the PDR5 deletion compared to wild-type cells at 0, 90 and 300 s with 100 µM MG132 and 10 mM chloroquine. Protein levels are shown in the order of the chromosomal location of their encoding genes. Protein levels of duplicated chromosomes are shown in red. (B) Average log2 ratios of attenuated and not attenuated products of duplicated genes in disome II (left) and disome V (right) upon inhibition of protein turnover for 0, 90 and 300 s (** denotes p values < 1E-3). (C) Examples of duplicated genes that are attenuated in disome II (left) and disome V (right) that show significant increases upon inhibition of protein degradation. Percent increases are shown below.
-
Figure 4—source data 1
TMT proteome of WT, disome II and disome V after inhibition of protein turnover.
- https://doi.org/10.7554/eLife.03023.017
Figure 4—figure supplement 1

Inhibition of protein degradation leads to increases in protein levels of duplicated genes.
(A) Scatter plots of the log2 ratios of protein levels at time 0 vs 300 s after inhibition of protein turnover in disome II (left) and disome V (right). (B) Average change calculated from the slope of the log2 ratios at 0, 90 and 300 averaged per chromosome are shown. Pair-wise t test was performed.
Figure 5 with 2 supplements
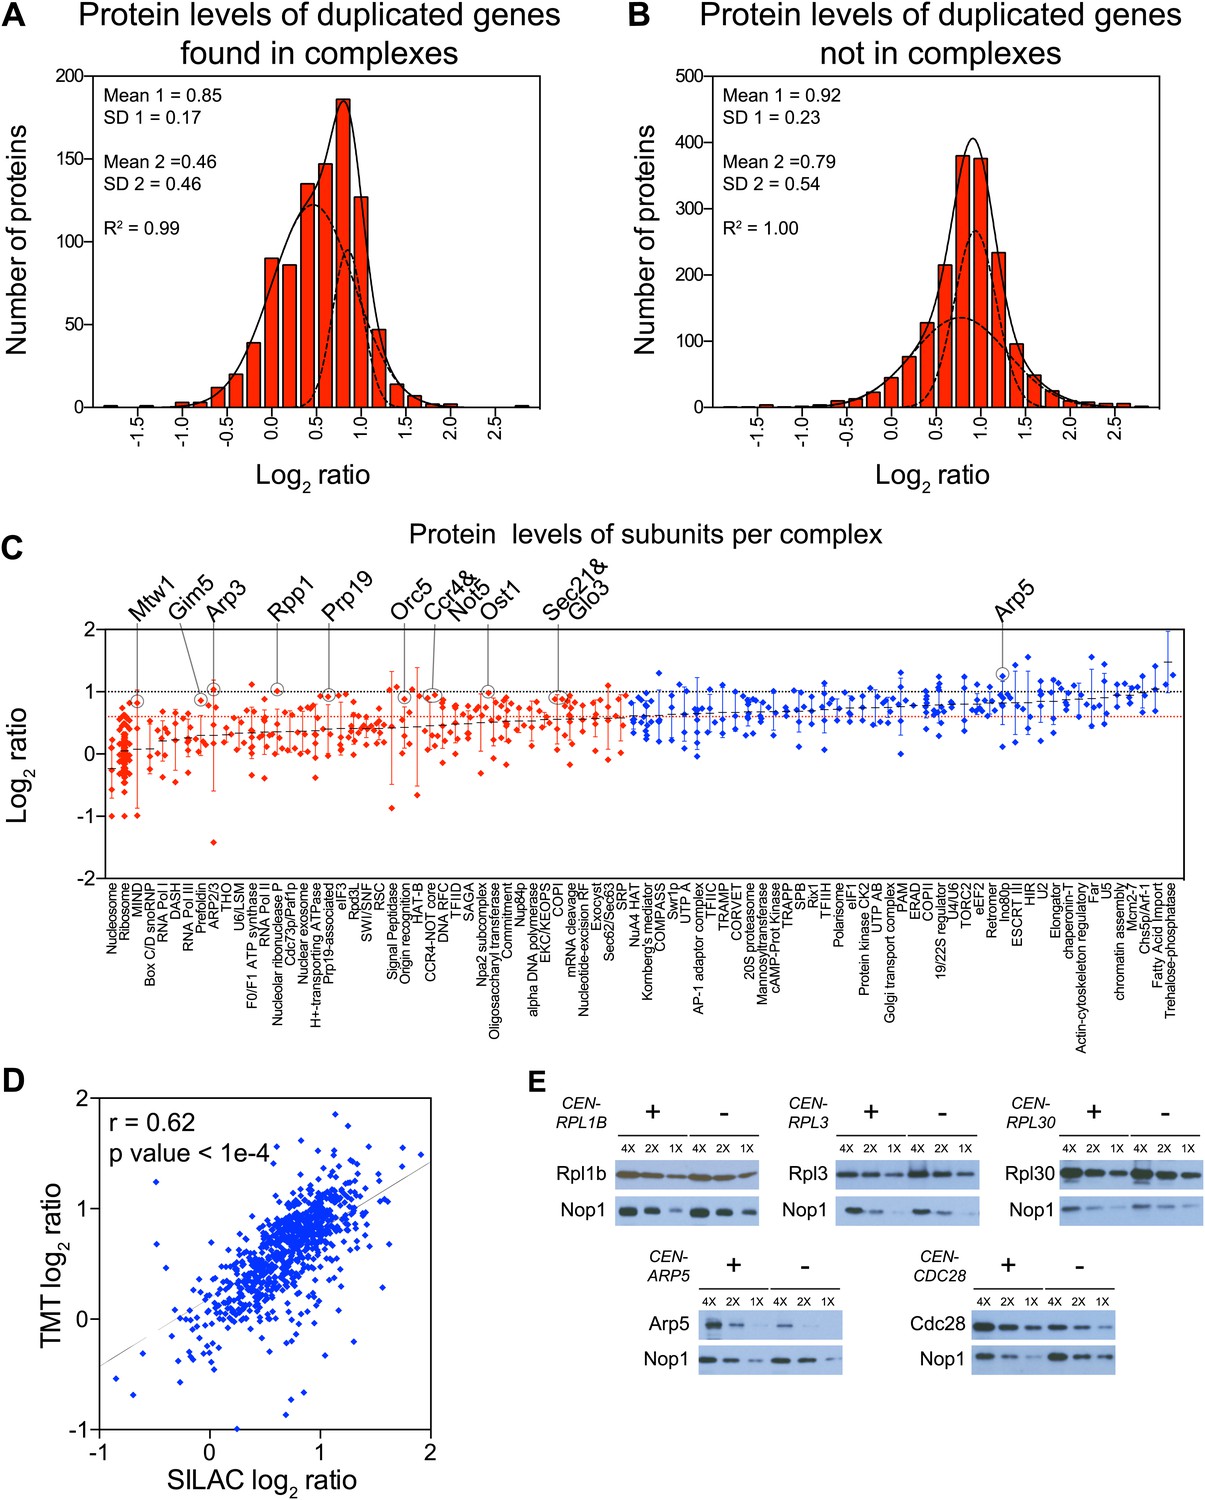
Subunits of macromolecular complexes accounts for most of the attenuation.
(A) Histograms of the log2 ratios of the relative protein levels of 923 duplicated genes found in complexes from disomic cells grown in YEPD medium compared to wild-type. Fits to a sum of two normal distributions are shown (black lines). (B) Histograms of the log2 ratios of the relative protein levels of 1,658 duplicated genes not part of complexes from disomic cell grown in YEPD medium compared to wild-type. Fits to a sum of two normal distributions are shown (black lines). (C) Log2 ratios of subunits of complexes when encoded in a duplicated chromosome relative to wild-type. Complexes that show significant attenuation mean of their subunits < 0.6 (dashed red line) are shown in red. (D) Comparison of the protein levels of subunits of complexes when present in a duplicated chromosome in disomic cells grown in YEPD vs synthetic medium. Pairwise comparison show a Pearson correlation coefficient (r) = 0.62. (E) Protein levels in wild-type cells or cells harboring a CEN plasmid containing a single copy of RPL1B, RPL3, RPL30, ARP5 or CDC28.
-
Figure 5—source data 1
List of complexes analyzed.
- https://doi.org/10.7554/eLife.03023.020
Figure 5—figure supplement 1
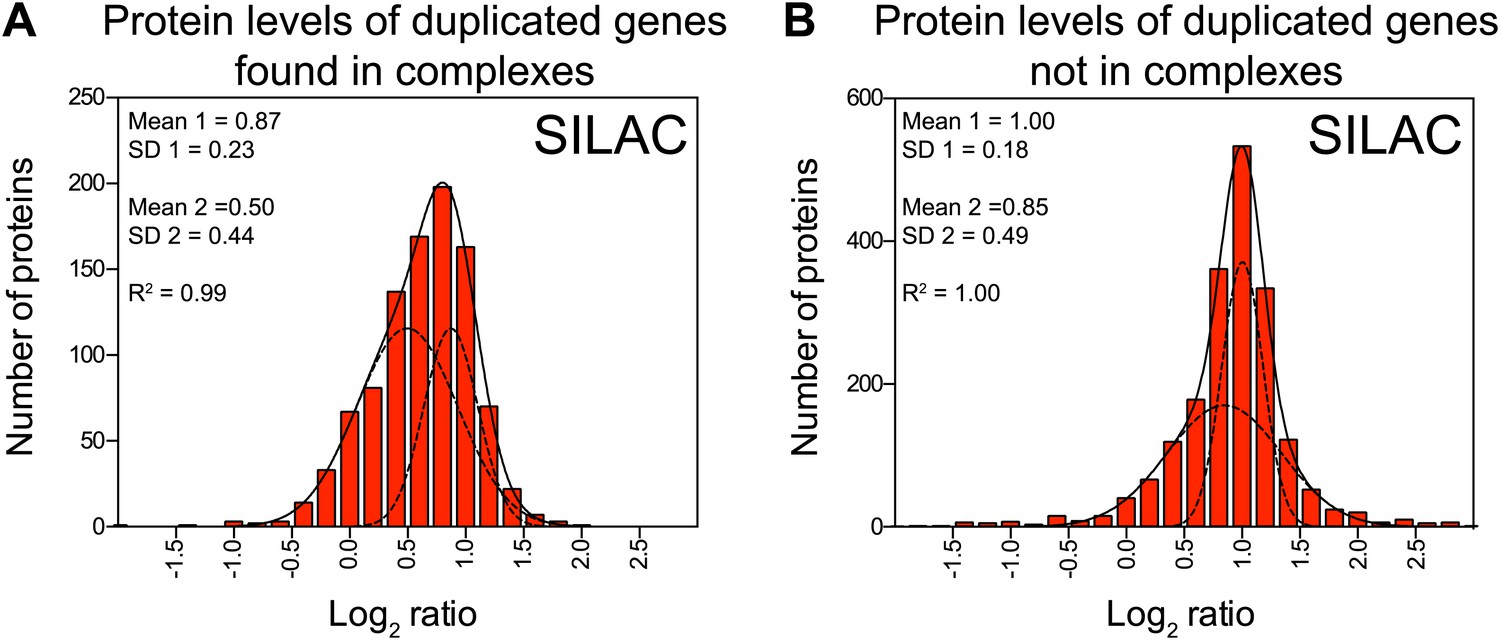
Subunits of macromolecular complexes accounts for most of the attenuation.
(A) Histograms of the log2 ratios of the relative protein levels of 977 duplicated genes found in complexes from disomic cells grown in synthetic medium compared to wild-type. Fits to a sum of two normal distributions are shown (black lines). (B) Histograms of the log2 ratios of the relative protein levels of 1,950 duplicated genes not part of complexes from disomic cell grown in synthetic medium compared to wild-type. Fits to a sum of two normal distributions are shown (black lines).
Figure 5—figure supplement 2
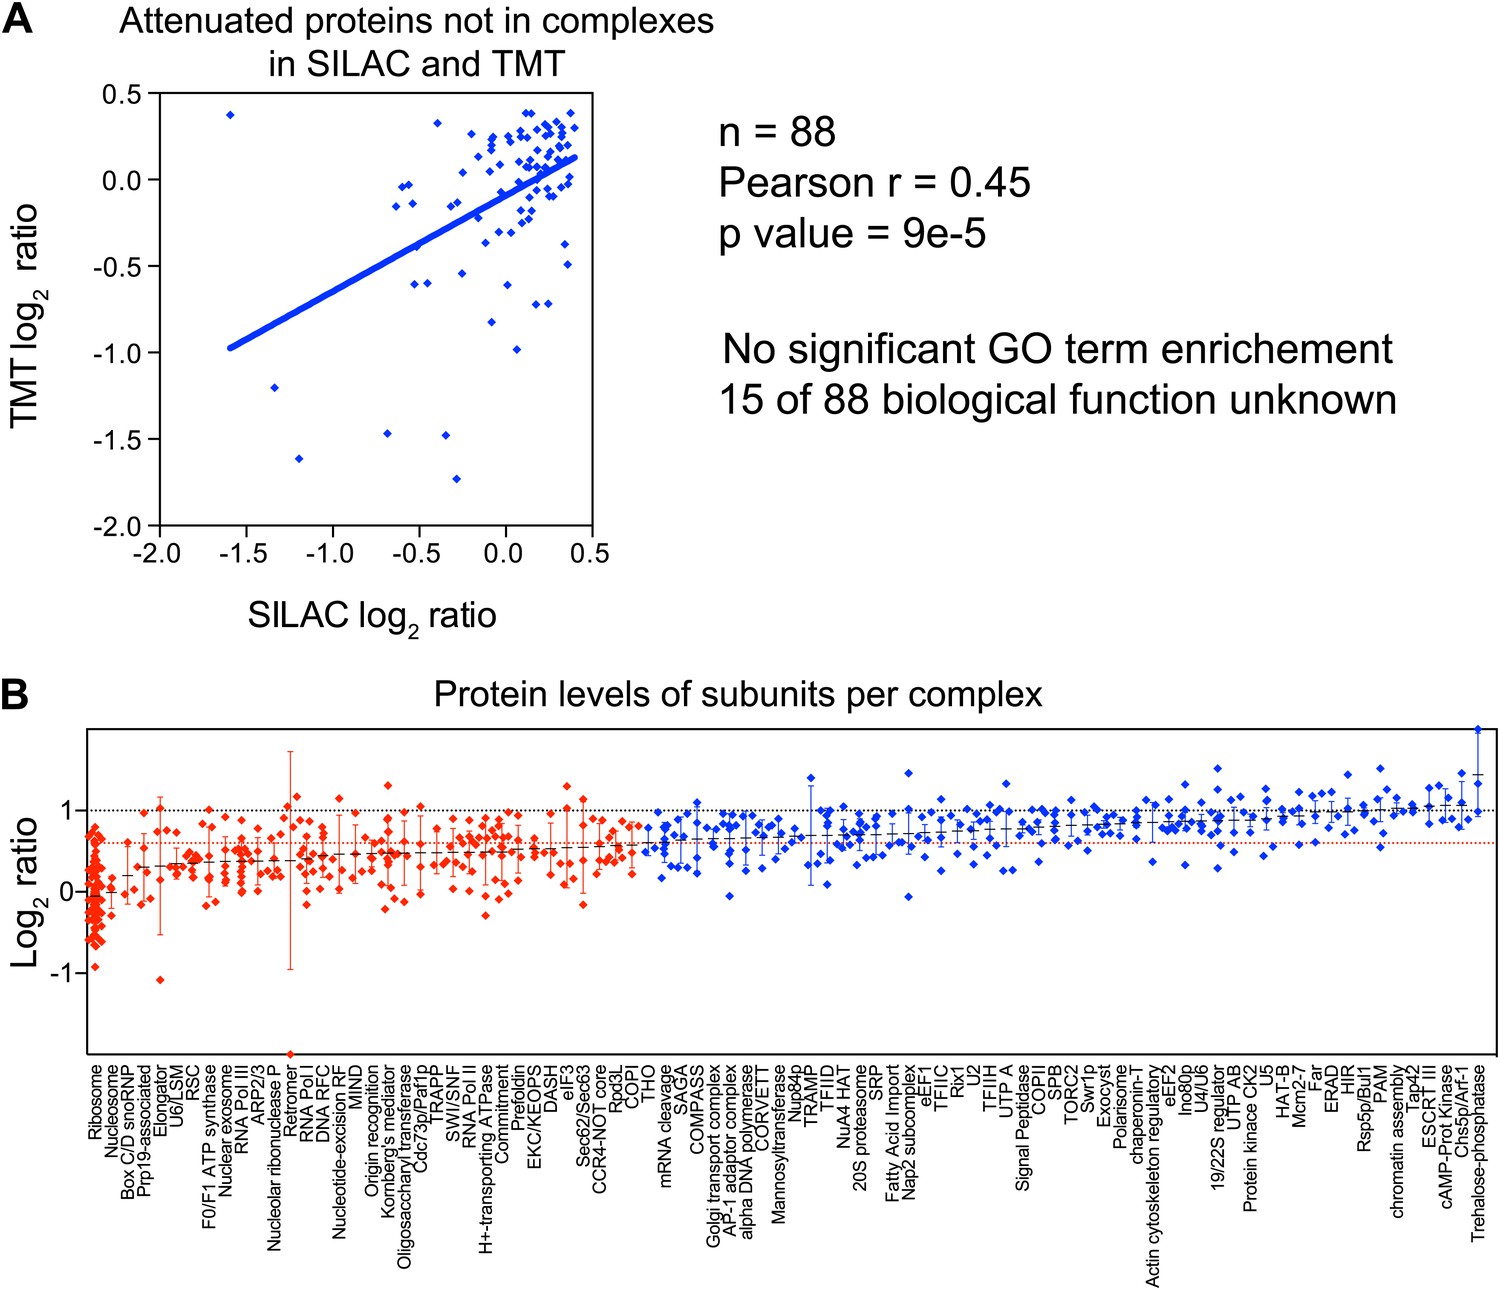
GO term analysis of attenuated proteins not found in complexes.
(A) Comparison of the protein levels of attenuated proteins, not known to be part of complexes, when present in a duplicated chromosome in disomic cells grown in YEPD vs synthetic medium. Pairwise comparison show a Pearson correlation coefficient (r) = 0.45. (B) Log2 ratios of subunits of complexes when encoded in a duplicated chromosome relative to wild-type. Complexes that show significant attenuation (mean of their subunits < 0.6, dashed red line) are shown in red.
Figure 6 with 4 supplements
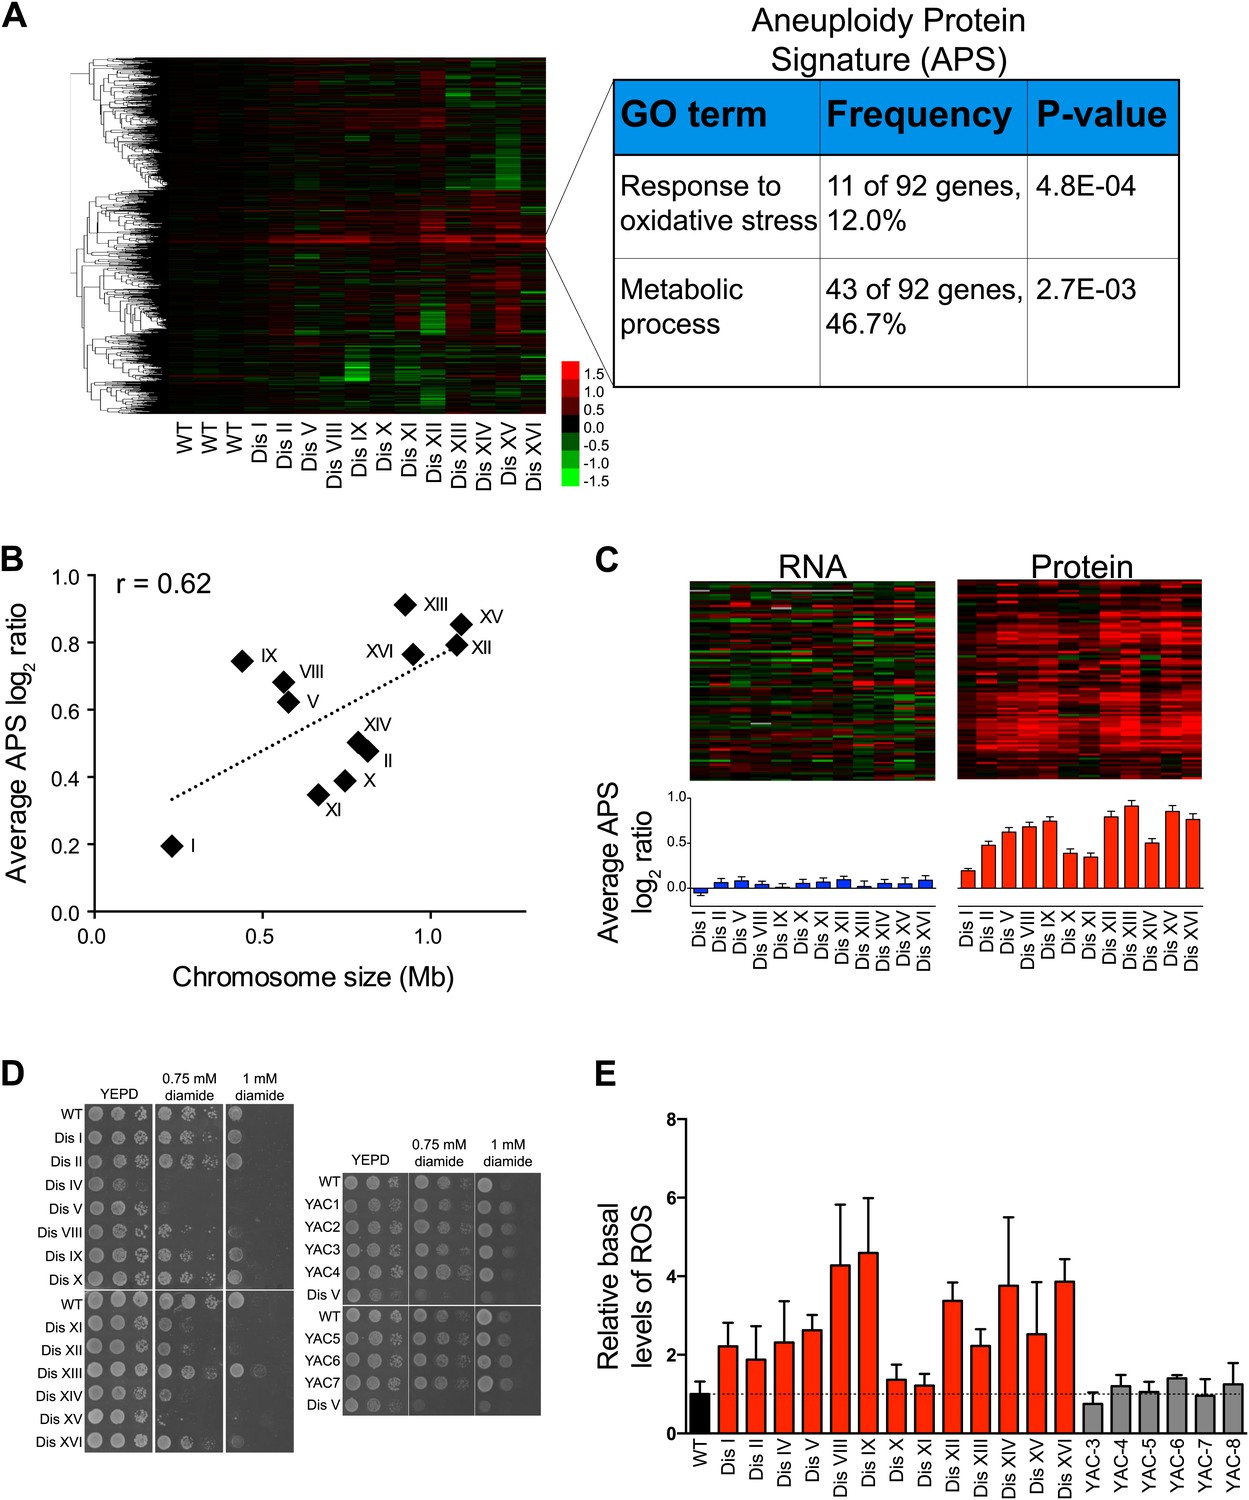
Identification of protein signature associated with aneuploidy.
(A) Hierarchically clustered protein levels from strains grown in YEPD. Proteins encoded on duplicated chromosomes were down-weighted and all data were clustered using the program WCluster. Gene Ontology enrichment analysis of 92 proteins that are significantly upregulated in all 12 disomic strains is shown. We refer to this signature the aneuploidy-specific signature or APS. (B) Correlation of the average APS and chromosome size in the disomes. Linear fit is shown in dashed line. (C) Comparison of transcript (left) and protein levels (right) of the APS. Averaged gene (blue bars) or protein (red bars) expression of the APS of each disomic strain are shown below. Error bars represent SEM. (D) Proliferation capabilities of WT, disomes and cells harboring YACs on YEPD medium alone or in the presence of 0.75 or 1 mM diamide. (E) Relative ROS levels of the disomes grown in YEPD relative to wild-type cell. Error bars represent SD (n = 3).
-
Figure 6—source data 1
List of the Aneuploidy-associated protein signature.
- https://doi.org/10.7554/eLife.03023.024
Figure 6—figure supplement 1
Protein signatures associated with aneuploidy.
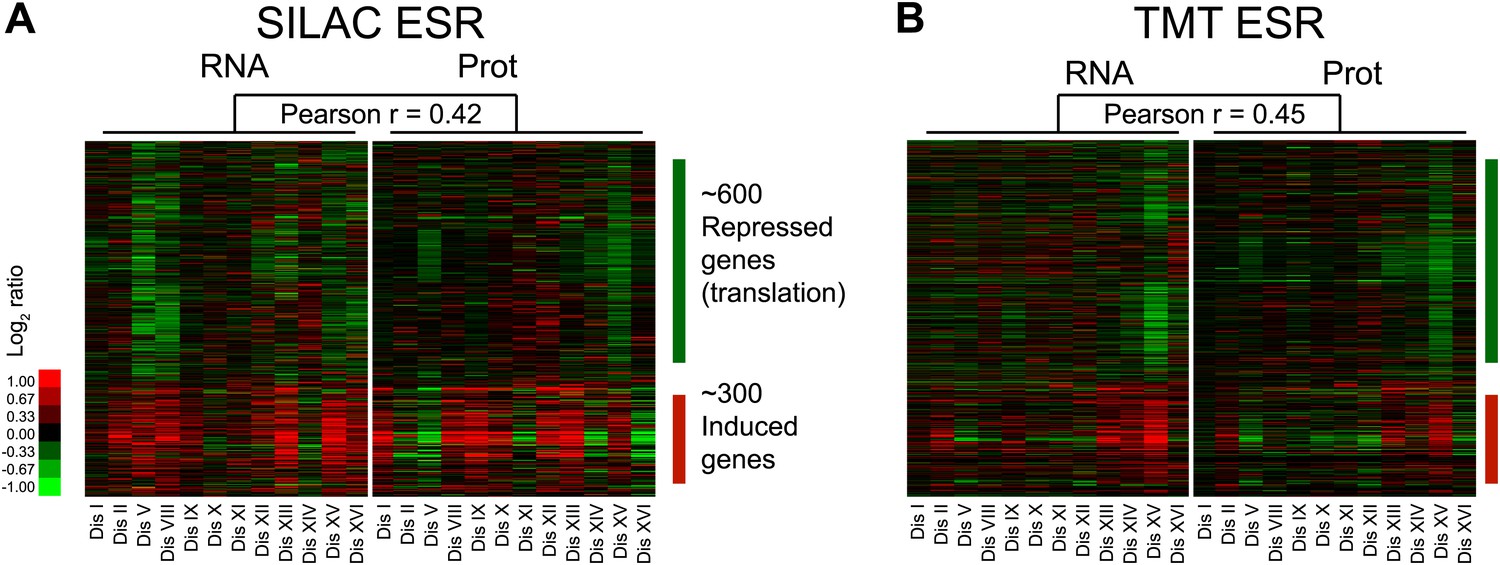
(A) Comparison of transcript (left) and protein levels (right) of the ESR in disomes relative to wild-type cells grown in synthetic medium. Down and upregulated genes defined as in Gasch et al. (2000). (B) Comparison of transcript (left) and protein levels (right) of the ESR of disomes relative to wild-type cells grown in YEPD medium. Down and upregulated genes defined as in Gasch et al. (2000).
Figure 6—figure supplement 2

APS in the meiotically generated aneuploid strains.
(A) Comparison of protein levels of the APS in five aneuploidy strains from Pavelka et al. (2010). Averaged protein (red bars) expression of the APS of each aneuploid strain are shown below. Error bars represent SEM. (B) Correlation of the average APS and chromosome size in five aneuploidy strains from Pavelka et al. (2010). Linear fit is shown in dashed line.
Figure 6—figure supplement 3
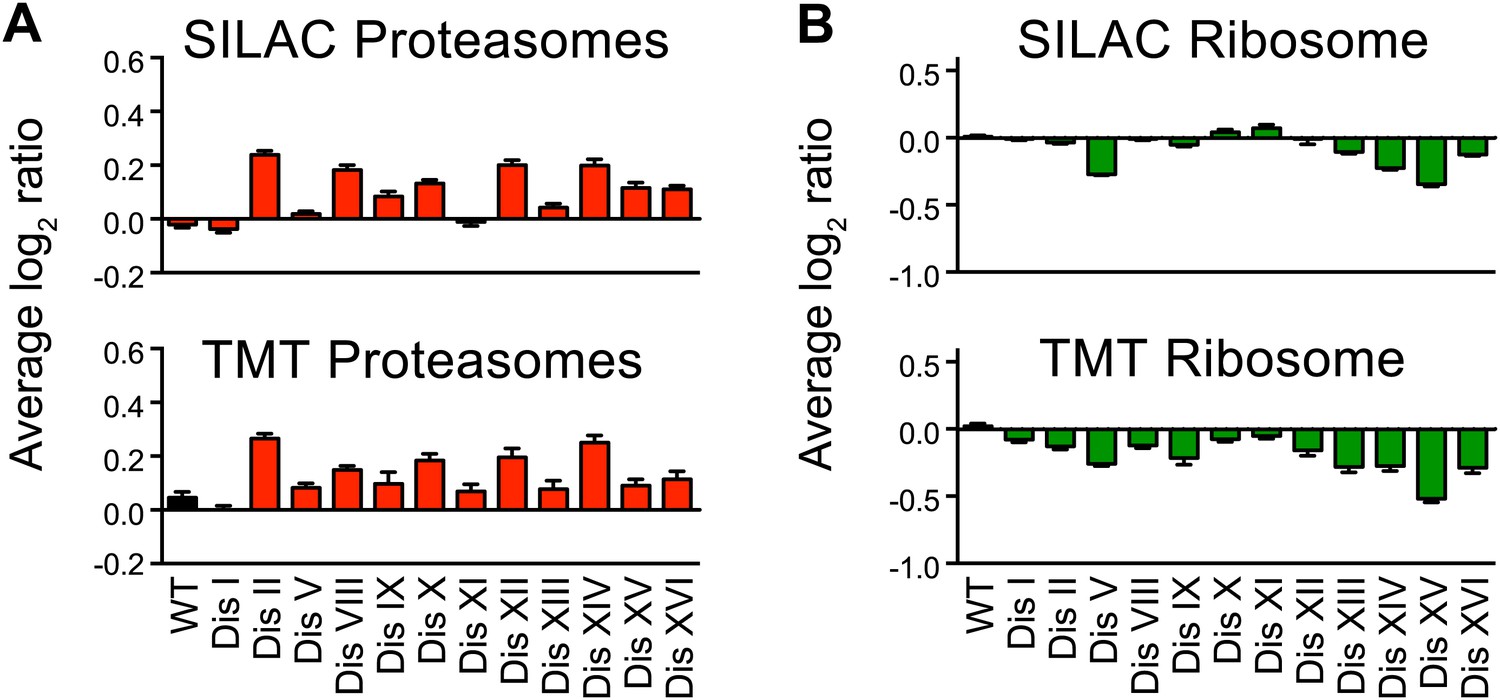
Ribosome and proteasome levels in aneuploid cells.
(A) Averaged protein levels of proteasome subunits of each disomic strain relative to wild-type cells grown in synthetic (top) or YEPD (bottom) medium. Error bars represent SEM. (B) Averaged protein levels of ribosome subunits of each disomic strain relative to wild-type cells grown in synthetic (top) or YEPD (bottom) medium. Error bars represent SEM.
Figure 6—figure supplement 4
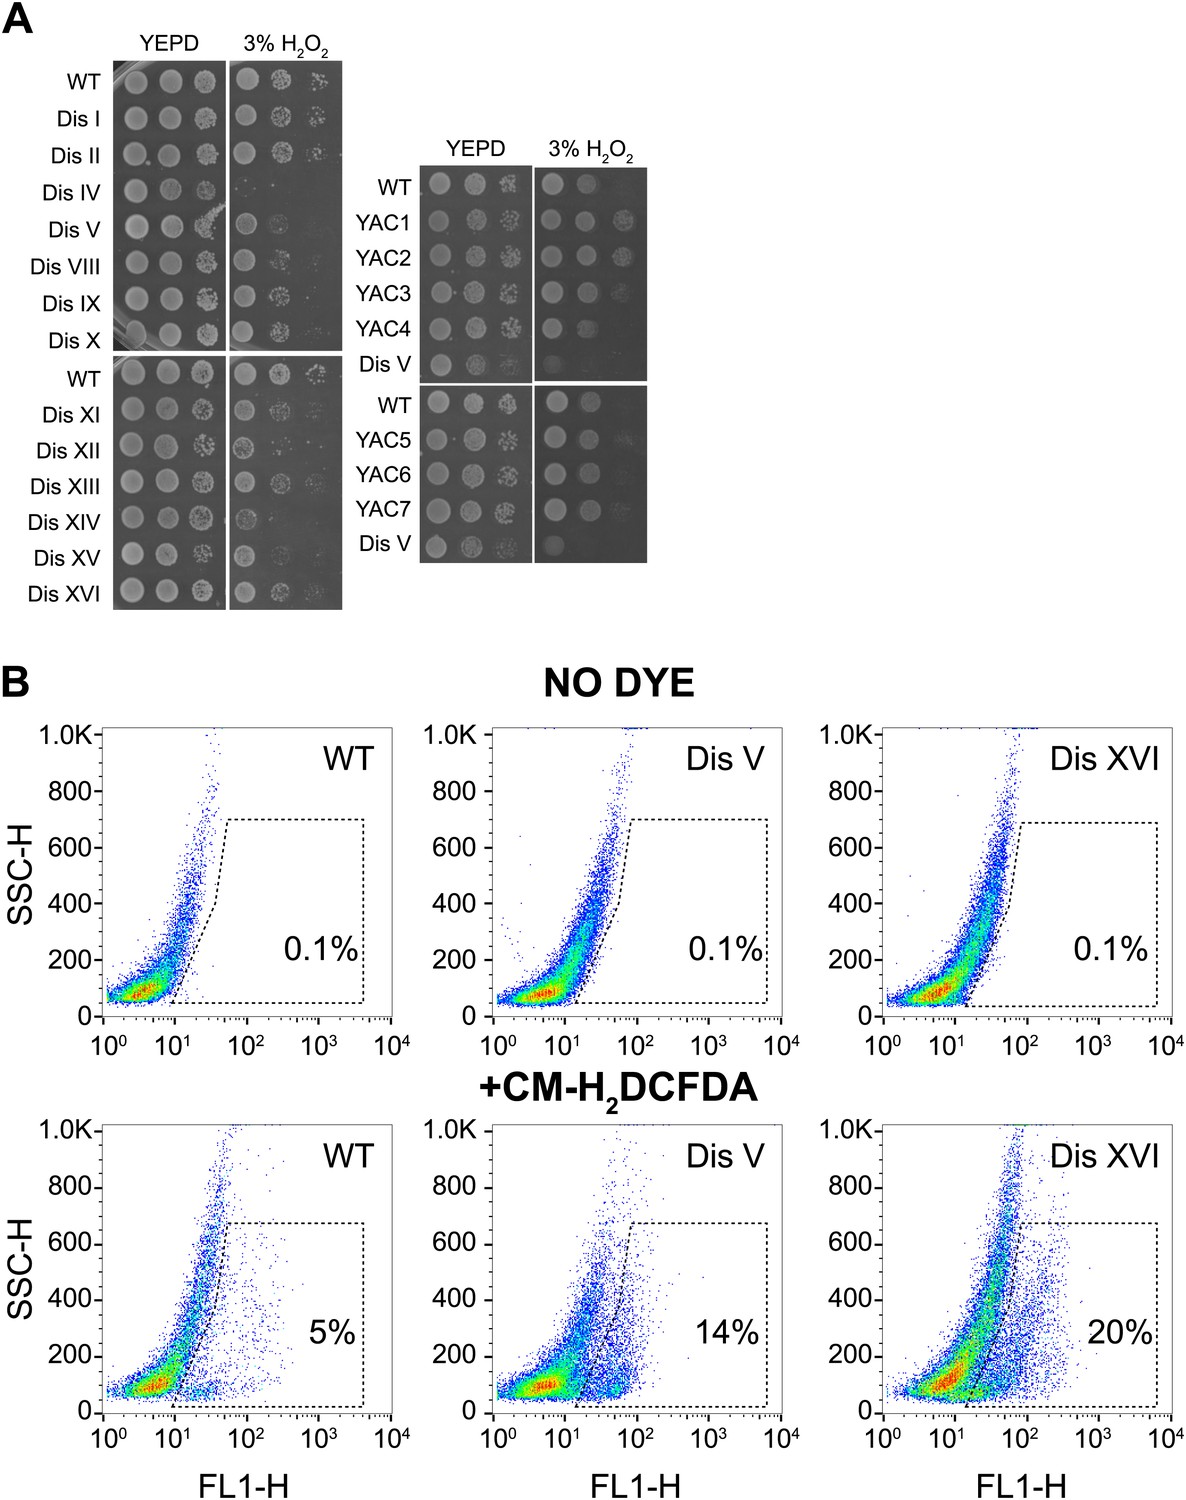
Proliferation capabilities of aneuploid cells in the presence of 3% H2O2.
(A) Proliferation capabilities of WT, disomes and cells harboring YACs on YEPD medium alone or in the presence of 3% H2O2. (B) FACS analysis of cells grown in YEPD medium stained CM-H2DCFDA.
Figure 7 with 2 supplements
Loss of UBP6 function preferentially affects proteins overproduced in disome V and disome XIII cells relative to wild-type.
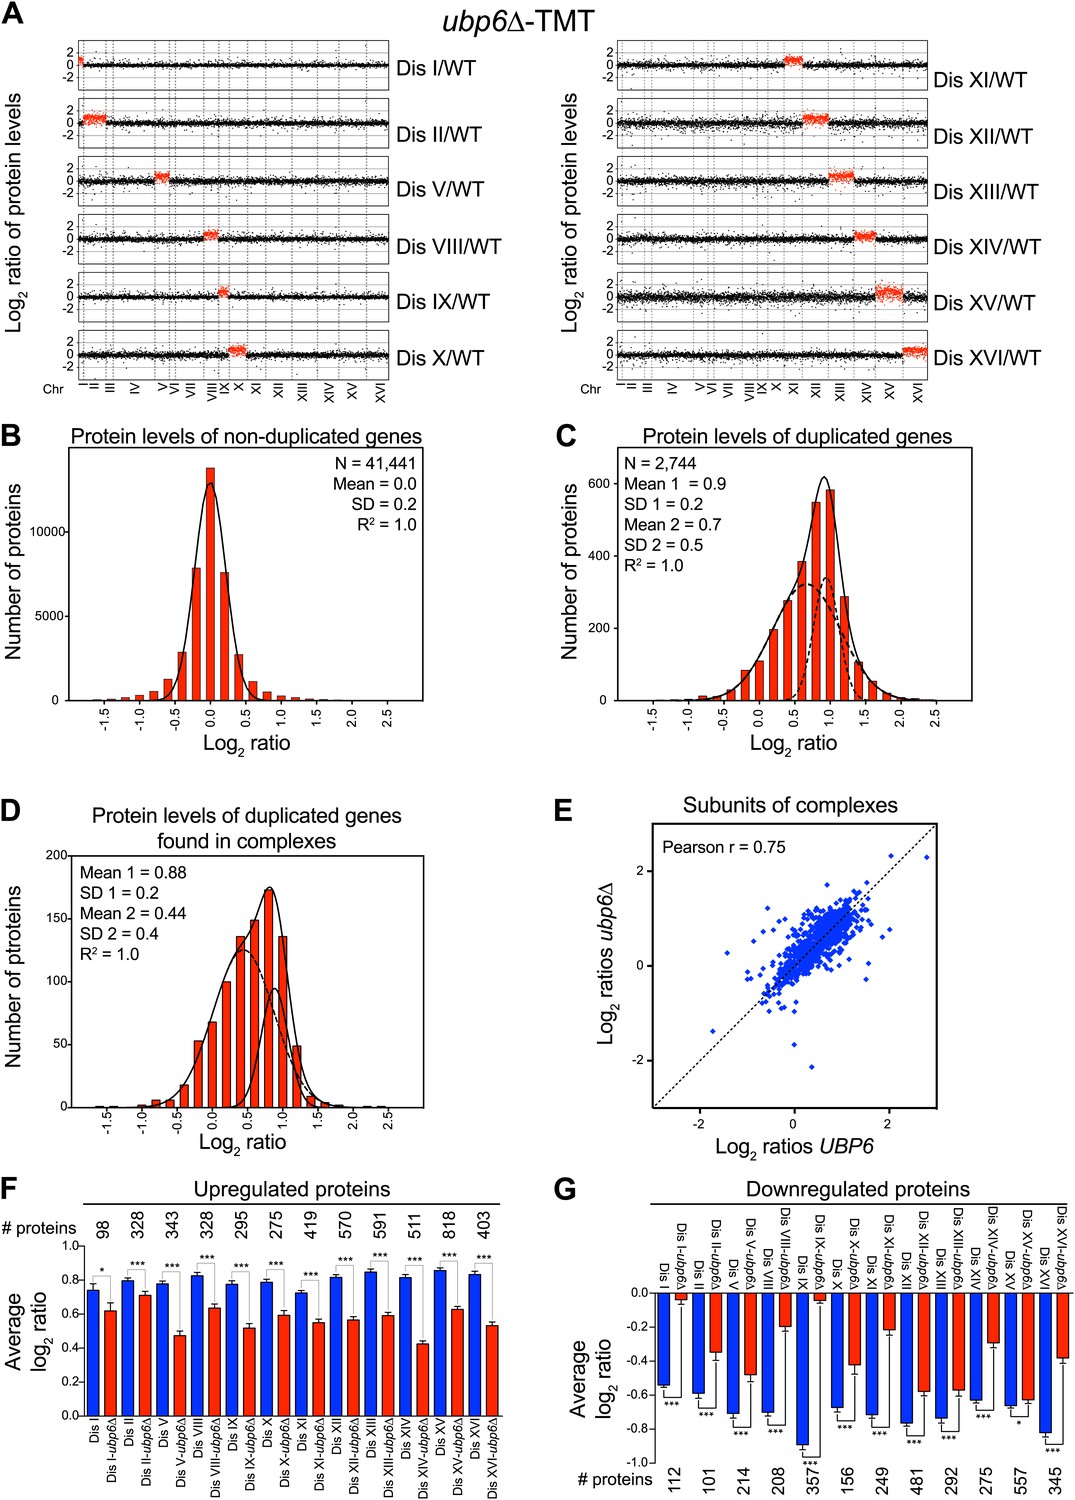
(A) The plots show the log2 ratio of the relative protein abundance of disomes harboring the UBP6 deletion compared to wild-type cells grown in YEPD. Protein levels are shown in the order of the chromosomal location of their encoding genes. Protein levels of duplicated chromosomes are shown in red. (B) Histogram of the log2 ratios of the relative protein levels of non-duplicated genes of 12 disomes harboring the UBP6 deletion relative to wild-type grown in YEPD medium. Fit to a normal distribution is shown (black line). (C) Histogram of the log2 ratios of the relative protein levels of duplicated genes of 12 disomes harboring the ubp6Δ relative to wild-type grown in YEPD medium. Fit to a sum of two normal distributions is shown (black line). (D) Histograms of the log2 ratios of the relative protein levels of duplicated genes found in complexes from disomic cells harboring the UBP6 deletion grown in YEPD medium compared to wild-type. Fits to a sum of two normal distributions are shown (black lines). (E) Comparison of the protein levels of subunits of complexes when present in a duplicated chromosome in disomic cells vs disomes harboring the UBP6 deletion grown in YEPD. Pairwise comparison show a Pearson correlation coefficient (r) = 0.75. (F) Average relative levels of the most upregulated proteins, log2 ratios ≥ 0.4, in disomes-UBP6 (blue) and disomes-ubp6Δ (red) compared to wild-type cells. Pair-wise t test was performed between disomes, * refers to p value = 0.01 and *** refers to p value < 1E-4. (G) Average relative levels of the most downregulated proteins, log2 ratios ≤ −0.4, in disomes-UBP6 (blue) and disomes-ubp6Δ (red) compared to wild-type cells. Pair-wise t test was performed between disomes, * refers to p value = 0.01 and *** refers to p value < 1E-4.
-
Figure 7—source data 1
Gene expression and proteome data of disomes-ubp6Δ.
- https://doi.org/10.7554/eLife.03023.030
Figure 7—figure supplement 1
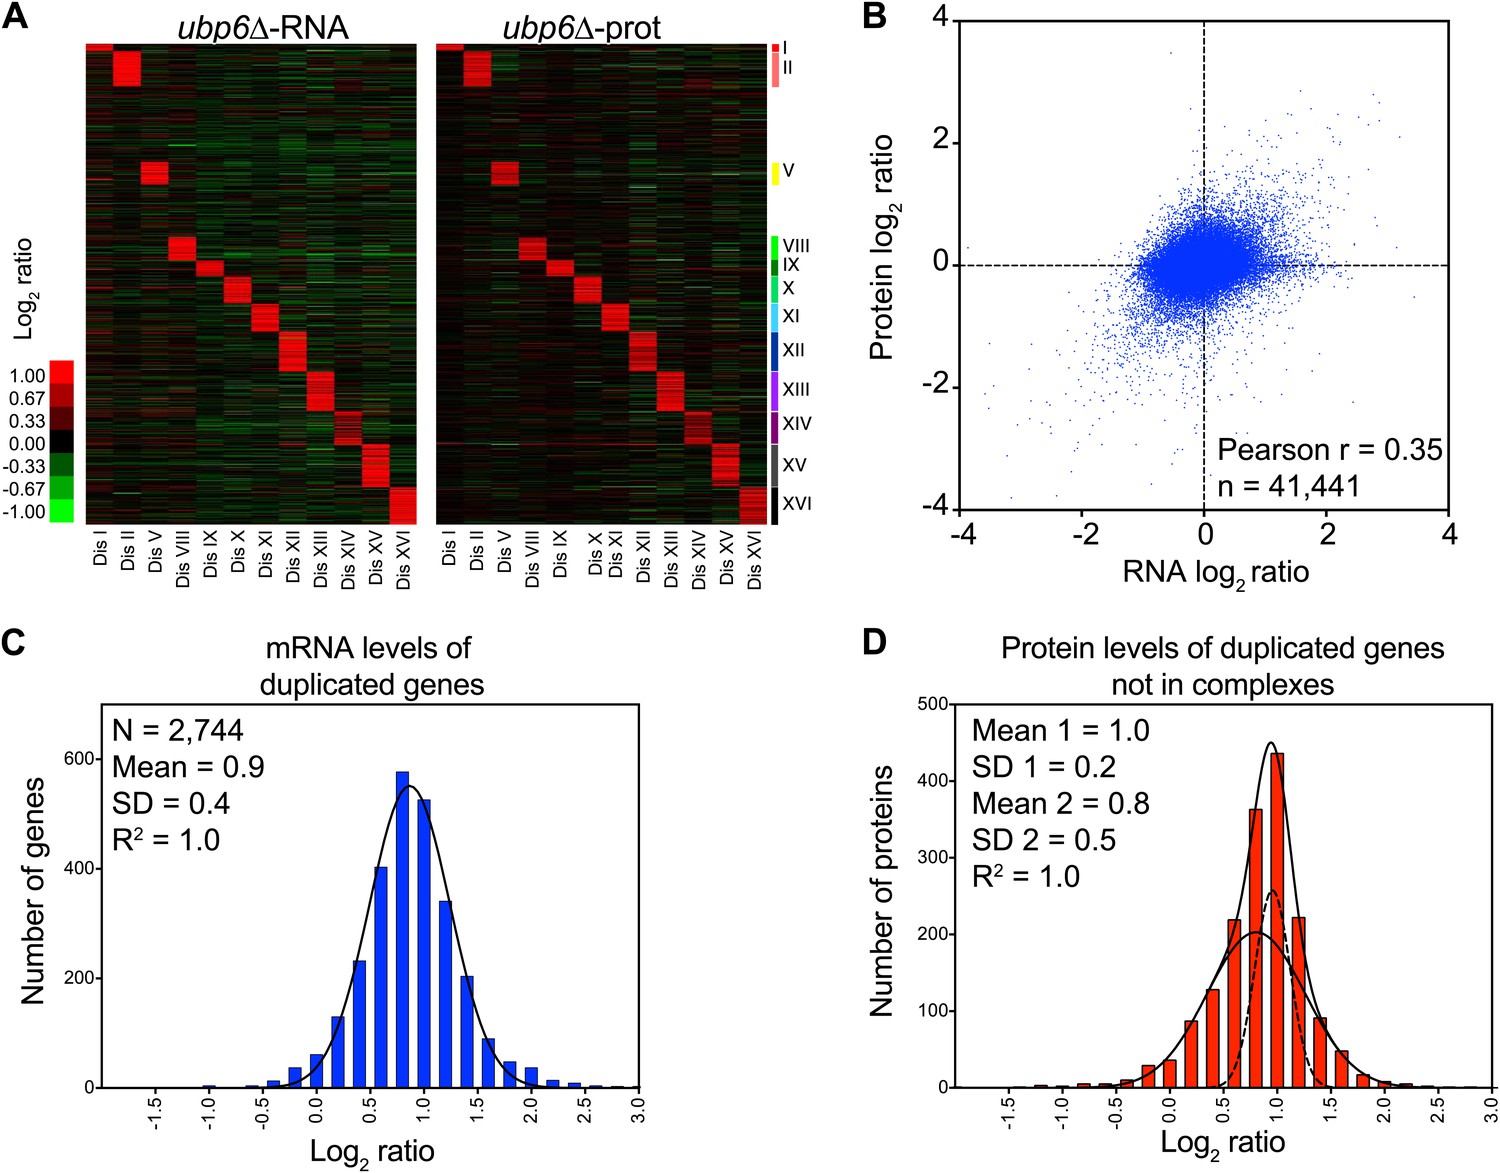
Analysis of mRNA and protein changes in disomes upon loss of UBP6.
(A) Gene expression and protein levels of aneuploid strains harboring the ubp6Δ relative to wild-type cells grown in YEPD medium, ordered by chromosome position. Experiments (columns) are ordered by the number of the chromosome that is present in two copies. (B) Pairwise comparison of the mRNA vs protein levels in disomes-ubp6Δ grown in YEPD medium. Pearson correlation coefficient (r) = 0.35. (C) Histogram of the log2 ratios of the relative mRNA levels of duplicated genes of 12 disomes harboring the ubp6Δ relative to wild-type grown in YEPD medium. Fit to a normal distribution is shown (black line). (D) Histogram of the log2 ratios of the relative protein levels of duplicated genes not known to be part of complexes of 12 disomes harboring the ubp6Δ relative to wild-type grown in YEPD medium. Fit to a sum of two normal distributions is shown (black line).
Figure 7—figure supplement 2
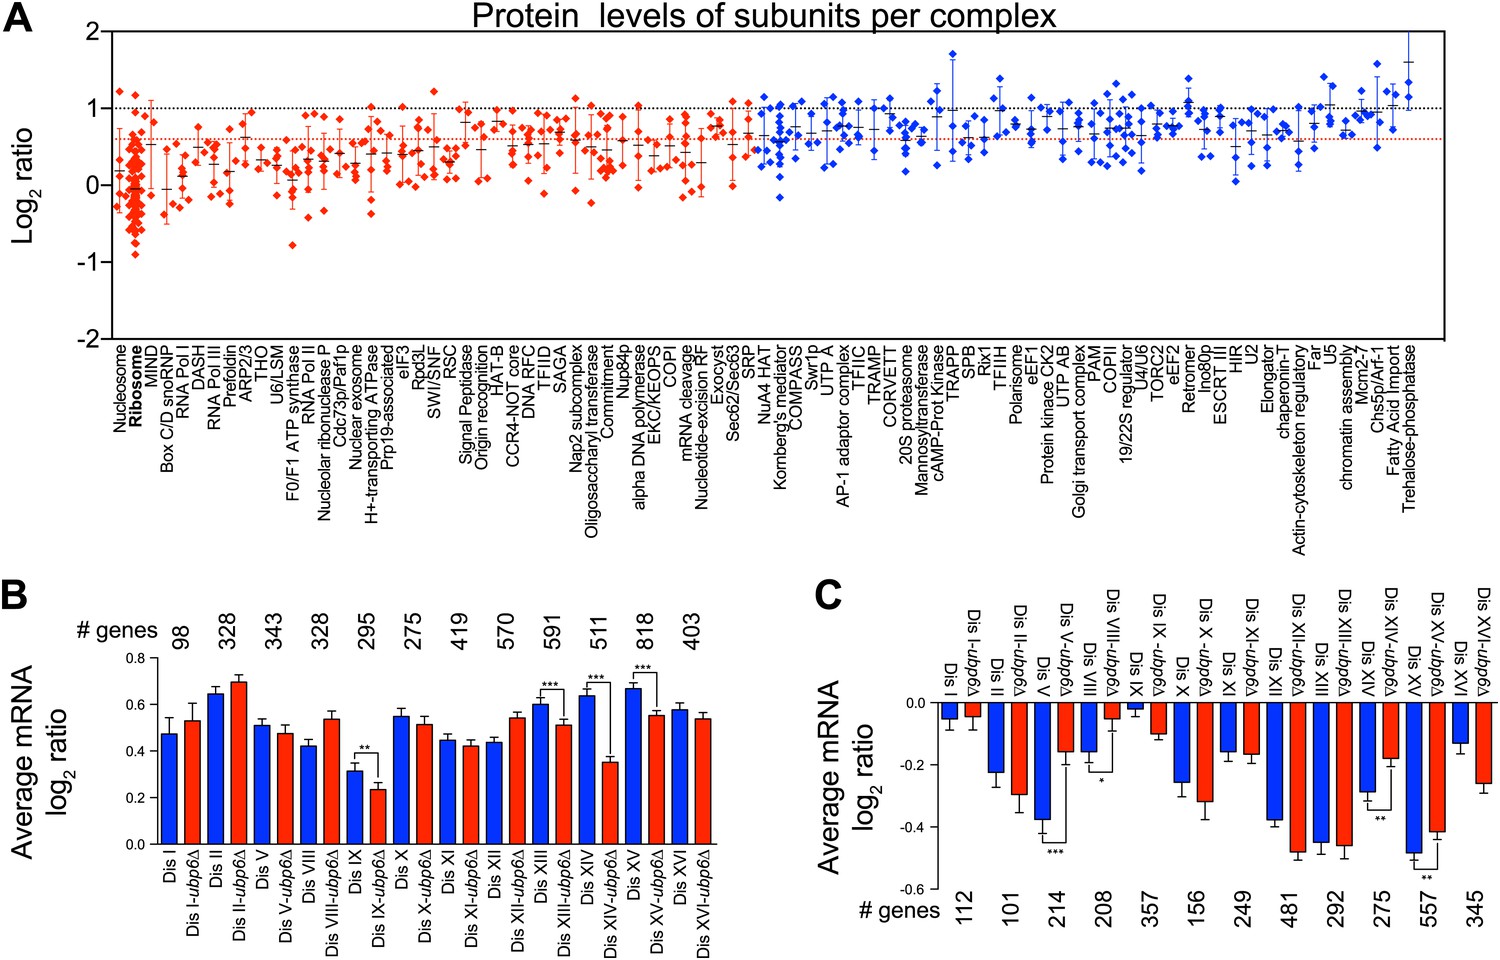
Protein levels of subunits of complexes and gene expression changes of the most up and downregulated genes in disomes-ubp6Δ.
(A) Log2 ratios of subunits of complexes when encoded in a duplicated chromosome relative to wild-type. Complexes that show significant attenuation (mean of their subunits < 0.6 (dashed red line) are shown in red. (B) Average gene expression levels of the most upregulated proteins, log2 ratios ≥ 0.4, in disomes (blue) and disomes-ubp6Δ (red) compared to wild-type cells. Pairwise t test was performed between disomes, * refers to p value = 0.01 and *** refers to p value < 1E-4. (C) Average gene expression levels of the most downregulated proteins, log2 ratios ≤ 0.4, in disomes (blue) and disomes-ubp6Δ (red) compared to wild-type cells. Pair-wise t test was performed between disomes, * refers to p value = 0.01 and *** refers to p value < 1E-4.
Figure 8 with 2 supplements

Loss of UBP6 attenuates cellular responses to aneuploidy.
(A) Comparison of transcript (left) and protein levels (right) of the APS in disomes-ubp6Δ. Averaged gene (blue bars) or protein (red bars) expression of the APS of each disomic strain are shown below. Error bars represent SEM. For comparison, dashed lines show the corresponding averages in disomes-UBP6. (B) Relative ROS levels of disomes-ubp6Δ grown in YEPD at 30°C. Error bars represent SD (n = 3). For comparison, dashed lines show the corresponding ROS levels in disomes-UBP6. (C) Doubling times of cells at 37°C. * refers to p-value < 0.05 (t test).
-
Figure 8—source data 1
List of strains utilized.
- https://doi.org/10.7554/eLife.03023.034
Figure 8—figure supplement 1
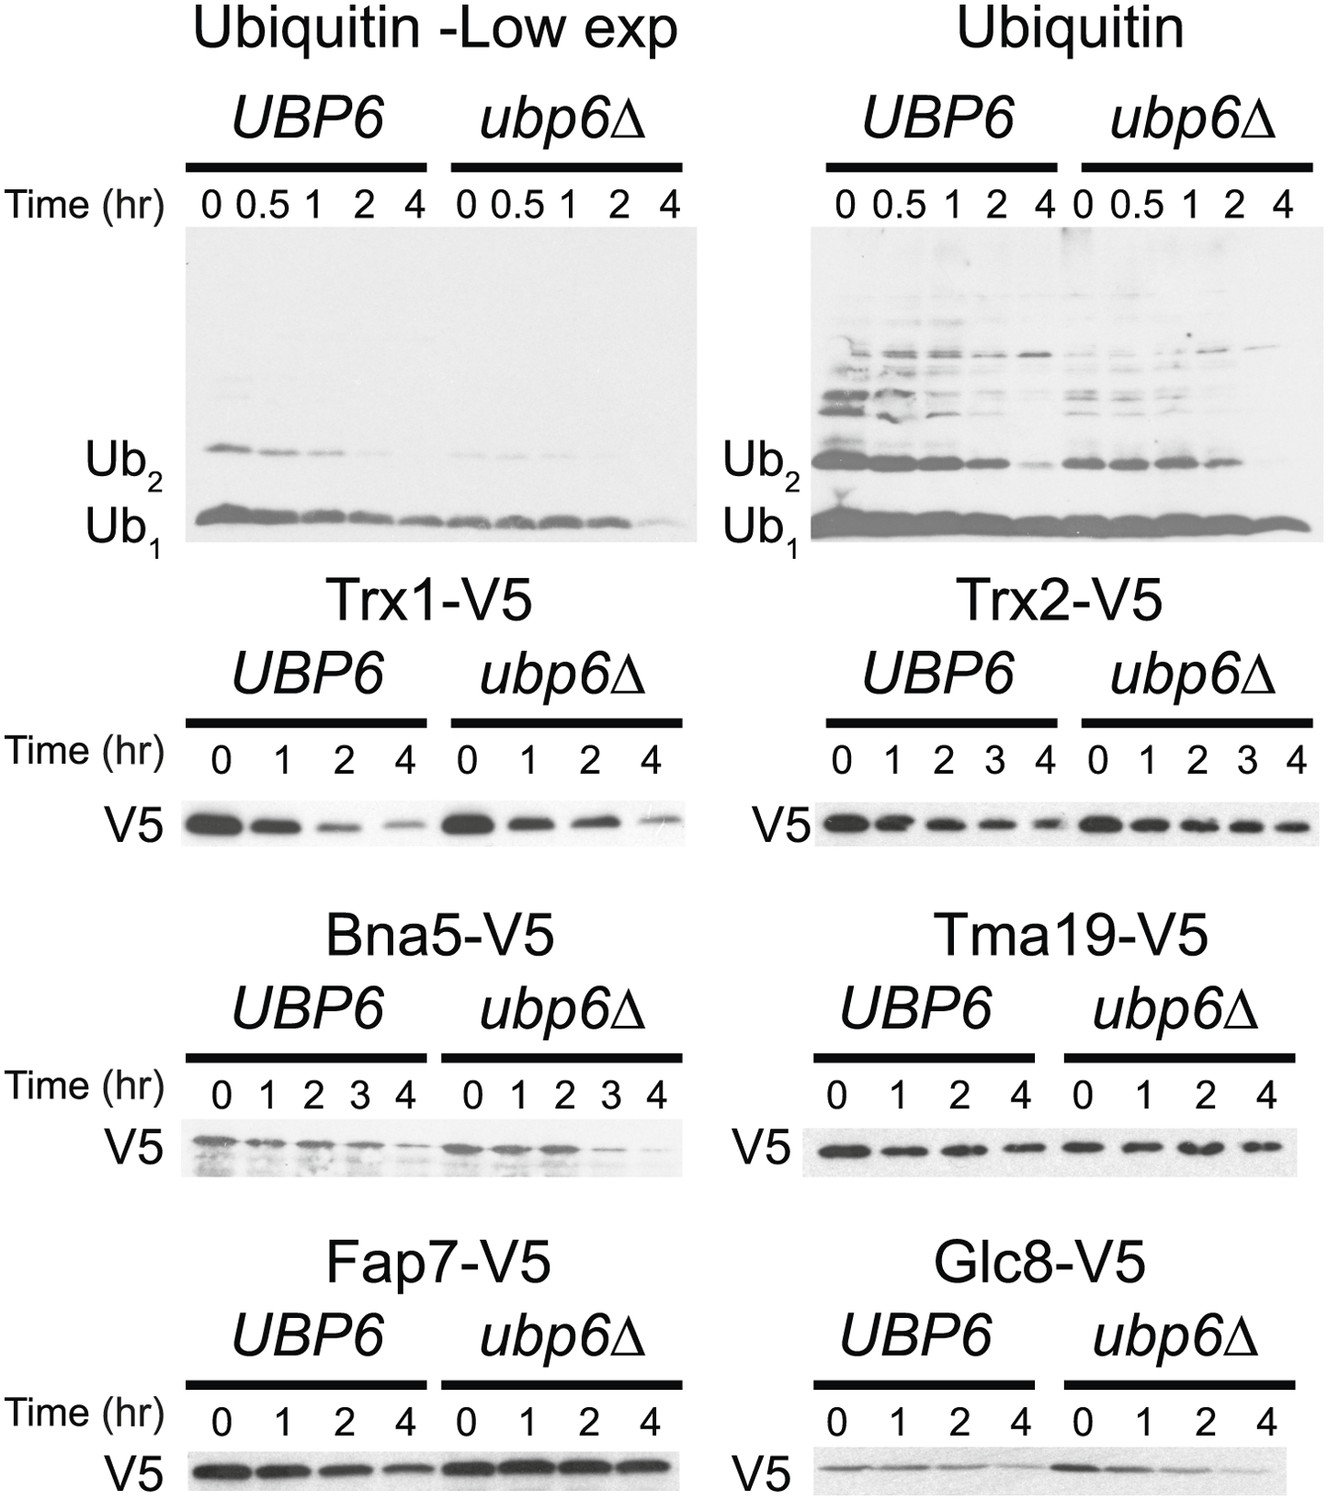
Cyclohexidime chases of Ubiquitin, Trx1, Trx2, Bna5, Tma19, Fap7 and Glc8 in wild-type cells or cells harboring the ubp6Δ.
https://doi.org/10.7554/eLife.03023.035
Figure 8—figure supplement 2
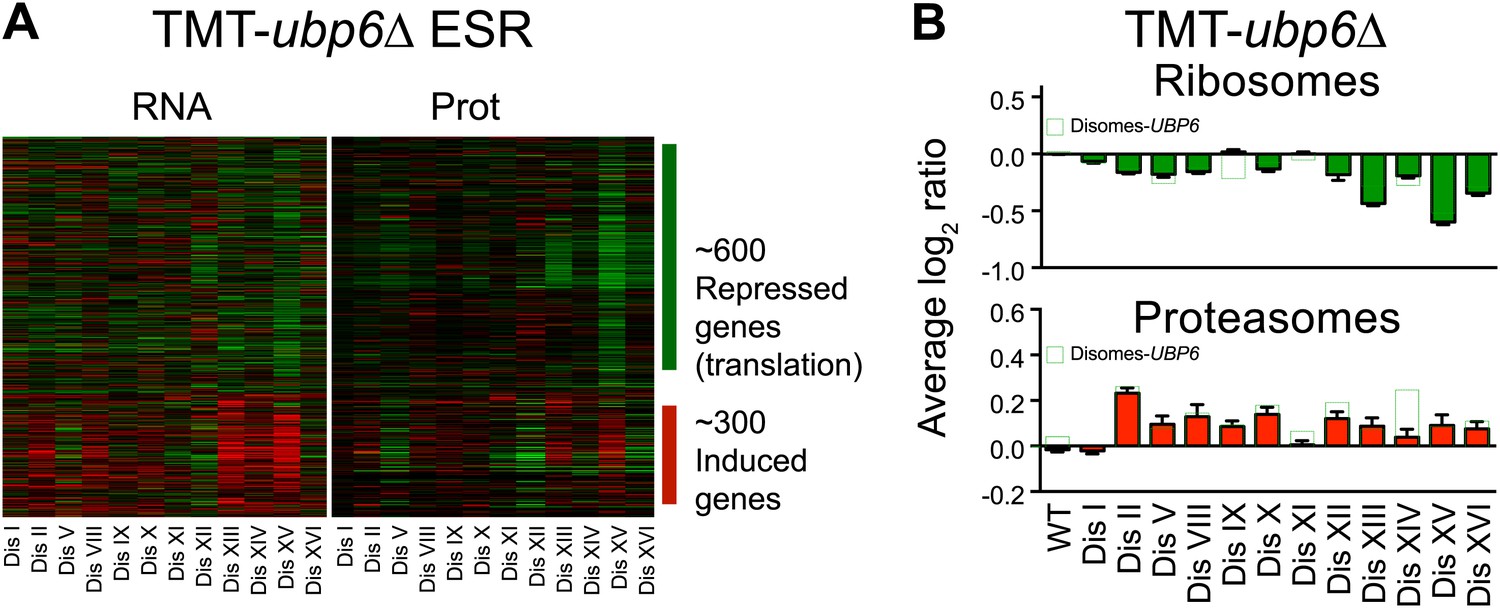
ESR, ribosome and proteasome levels in disomes-ubp6Δ.
(A) Comparison of transcript (left) and protein levels (right) of the ESR of disomes-ubp6Δ relative to wild-type cells grown in YEPD medium. Down and upregulated genes are defined as in Gasch et al. (2000). (B) Averaged protein levels of ribosome (top) and proteasome subunits (bottom) of each disome-ubp6Δ relative to wild-type cells grown in YEPD medium. Error bars represent SEM.
Download links
A two-part list of links to download the article, or parts of the article, in various formats.
Downloads (link to download the article as PDF)
Open citations (links to open the citations from this article in various online reference manager services)
Cite this article (links to download the citations from this article in formats compatible with various reference manager tools)
Quantitative proteomic analysis reveals posttranslational responses to aneuploidy in yeast
eLife 3:e03023.
https://doi.org/10.7554/eLife.03023


