A distinct tethering step is vital for vacuole membrane fusion
- Geisel School of Medicine at Dartmouth, United States
Figures
Figure 1 with 2 supplements

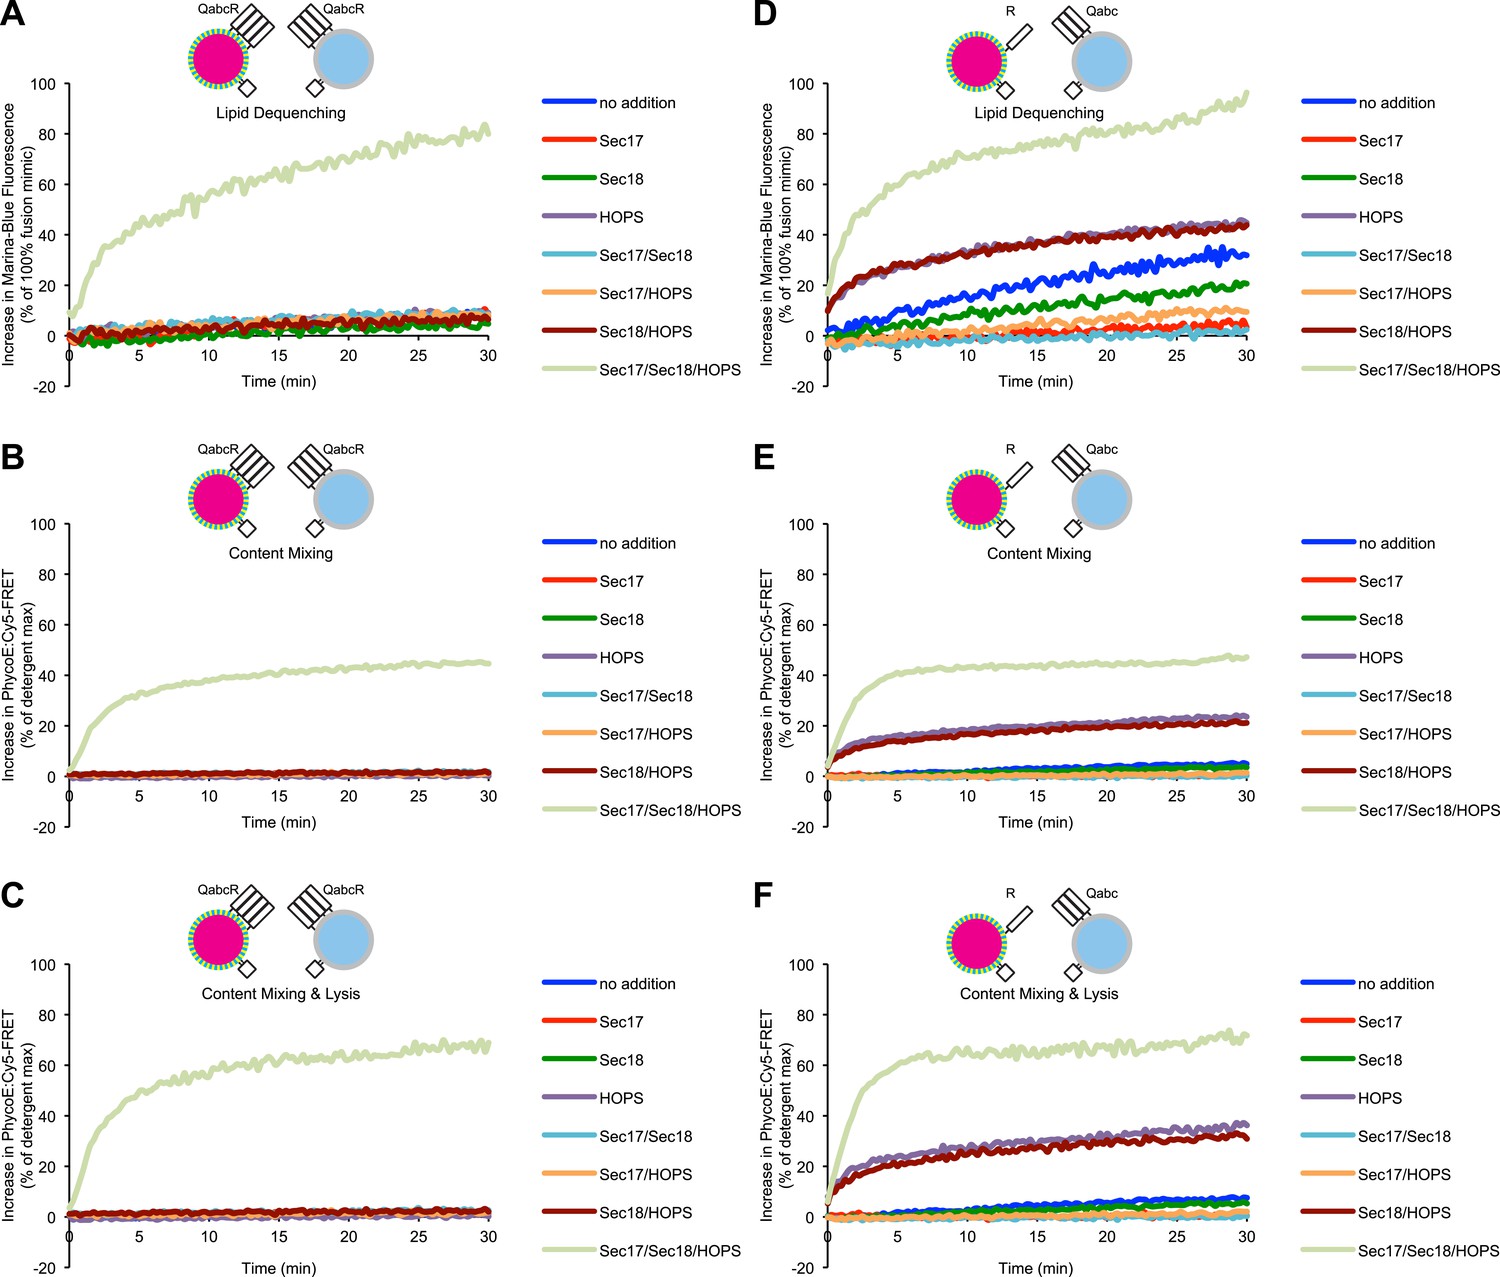
Comparison of lipid mixing and content mixing assays.
(A) Assays used to study membrane fusion in vitro and possible outcomes. (B) Description of proteoliposomes as used in the following figures. (C–E) Two populations of 4SNARE-RPLs (with 1.5 mol% Marina-Blue-phosphatidylethanolamine [PE] and NBD-PE containing biotinylated R-phycoerythrin, or with no fluorescent lipids containing Cy5-labeled streptavidin; 250 µM lipid each) were incubated at 27°C with combinations of Sec17p, Sec18p, and HOPS, and assayed for 10 min for: lipid dequenching (C), lumenal content mixing protected from 5 µM external streptavidin (D), and mixing of lumenal content markers in the absence of external streptavidin, thus measuring both fusion and lysis (E). (F–H) Incubations were as in (C–E), but with RPLs bearing either the R-SNARE Nyv1p or the 3Q-SNAREs Vam3p, Vti1p, and Vam7p. Final concentrations of proteins were: Sec17p (600 nM), Sec18p (200 nM), and HOPS (100 nM). The mean and standard deviations of three experiments are shown.
Figure 1—figure supplement 1
Representative kinetic data for panels C–H in figure 1.
https://doi.org/10.7554/eLife.03251.004
Figure 1—figure supplement 2
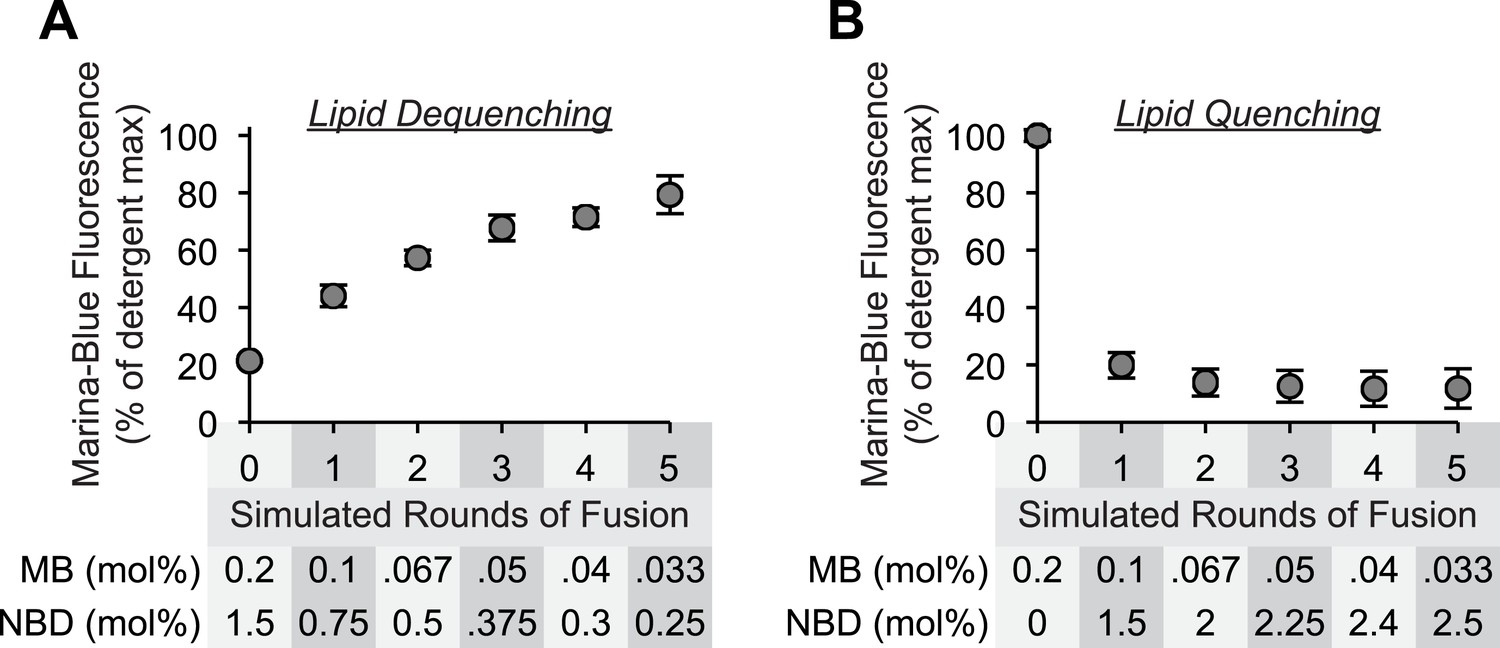
Sensitivity of lipid dequenching and lipid quenching assays to simulated rounds of fusion.
(A) Mixed micellar solutions of DLPC and β-octylglucoside, containing the fluorescently labeled lipids Marina-Blue-phosphatidylethanolamine (PE) (0.2 mol%) and NBD-PE (1.5 mol%), were mixed with unlabeled mixed micellar solutions prior to liposome formation. To simulate 0, 1, 2, 3, 4, or 5 rounds of fusion, 1 part of labeled lipid solution was mixed with 0, 1, 2, 3, 4, or 5 parts of unlabeled lipid solution. After liposome formation by dialysis, the fluorescence intensity of these liposomes (250 µM lipid) was determined in the presence or absence of detergent (0.1% [wt/vol] Thesit). The intensity measured in the absence of detergent is expressed as percentage of the signal intensity measured in the presence of detergent. (B) As described in (A), but 1 part of Marina-Blue-PE (0.2 mol%) mixed micellar solution was mixed with 0–5 parts of NBD-PE (3 mol%) mixed micellar solution prior to liposome formation.
Figure 2 with 1 supplement
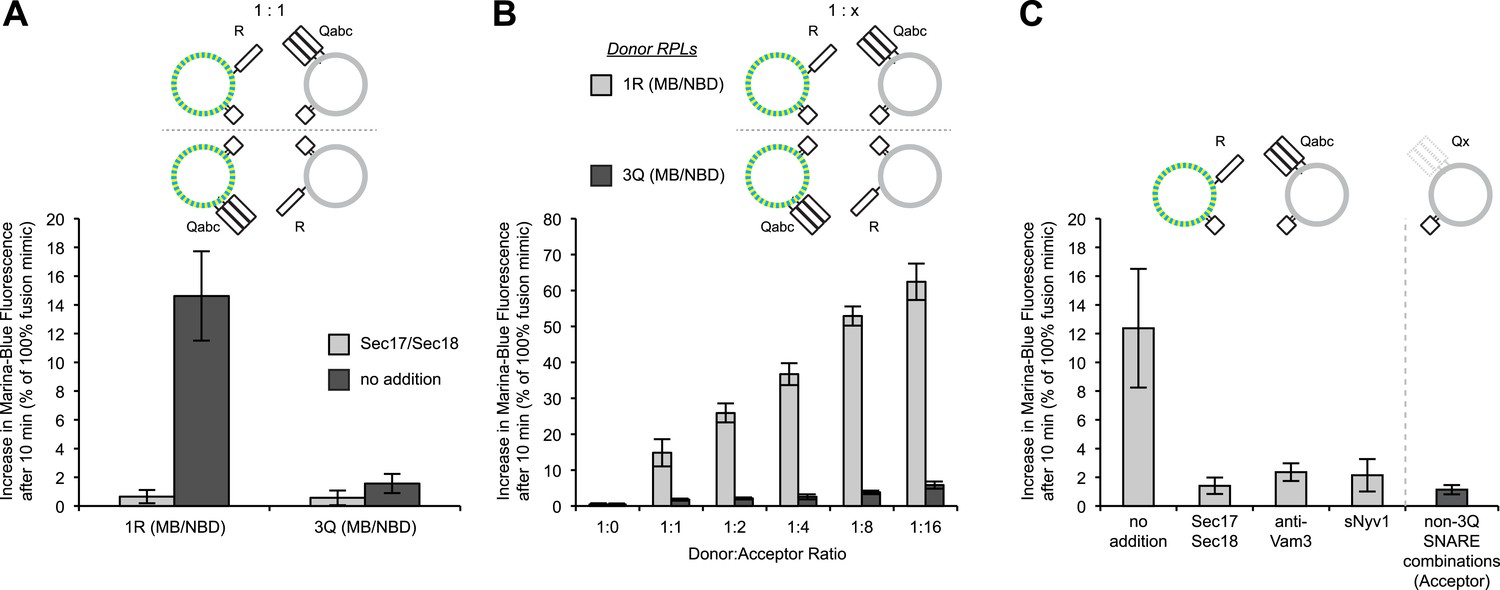
Asymmetric lipid dequenching.
(A) Lipid dequenching reactions of 1R- and 3Q-RPLs (250 µM lipid each), with both fluorescent lipids (Marina-Blue-phosphatidylethanolamine [MB-PE] and NBD-PE, 1.5 mol% each) on either the 1R-RPLs or the 3Q-RPLs. Incubations contained either Sec17p (600 nM) and Sec18p (200 nM) (light gray) or no additional proteins (dark gray). (B) Lipid dequenching reactions of MB/NBD-labeled 1R- (light gray) or 3Q-RPLs (dark gray) with increasing amounts of non-labeled complementary RPLs (3Q or 1R; 1:1 corresponds to 50 µM lipid of each). No additional proteins were added. (C) Sensitivity of lipid dequenching reactions of 1R(MB/NBD)-RPLs and 3Q-RPLs to various inhibitors that might prevent trans-SNARE complex formation. Incubations received: (1) no addition, (2) Sec17p/Sec18p (400 nM each), (3) antibodies directed against Vam3p (1 µM), or (4) soluble Nyv1p(1-231) (1 µM). Column 5: 1R(MB/NBD)-RPLs were incubated with non-fluorescent RPLs bearing various combinations of SNAREs other than 3Q: QabcR, QbcR, QacR, QabR, QcR, QbR, Qbc, QaR, Qac, Qab, R, Qc, Qb, Qa. The extent of these reactions was comparably low for all conditions, and is shown as average for these 14 conditions with standard deviations.
Figure 2—figure supplement 1
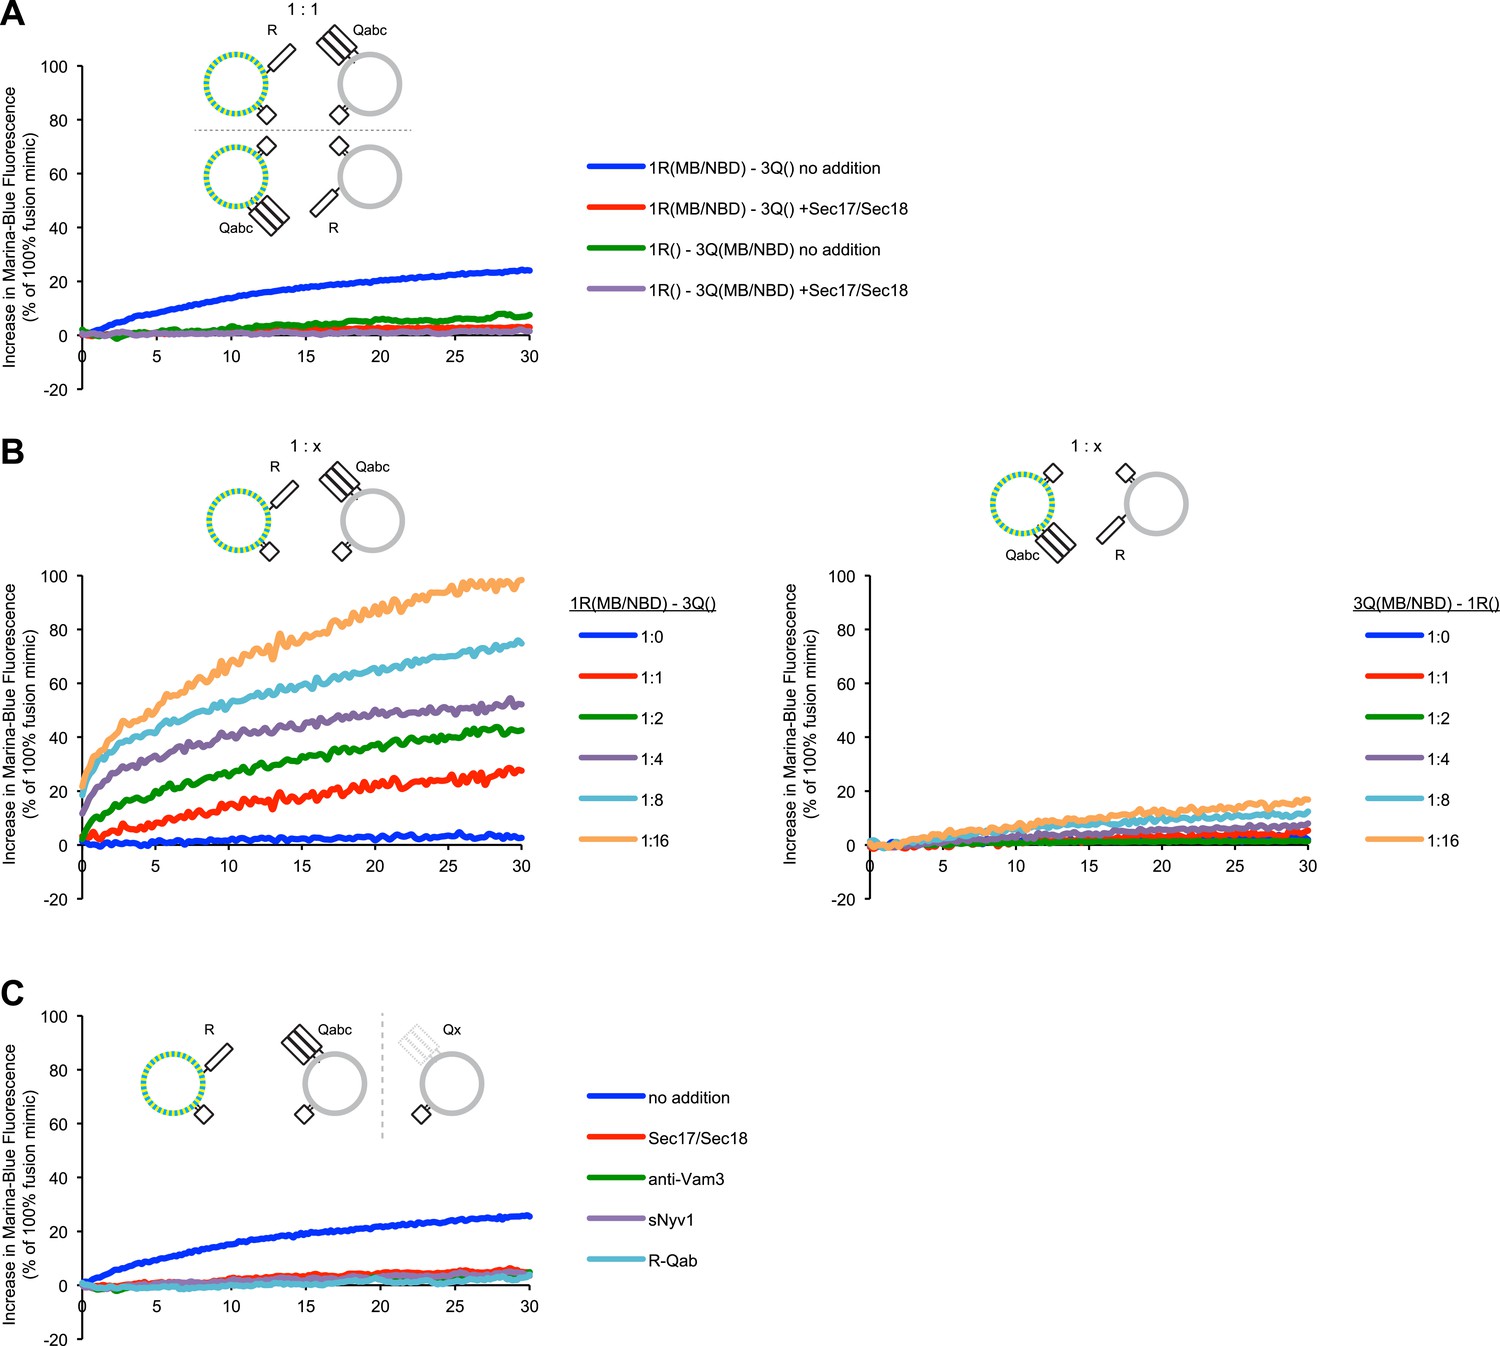
Representative kinetic data for panels A–C in figure 2.
https://doi.org/10.7554/eLife.03251.007
Figure 3 with 3 supplements
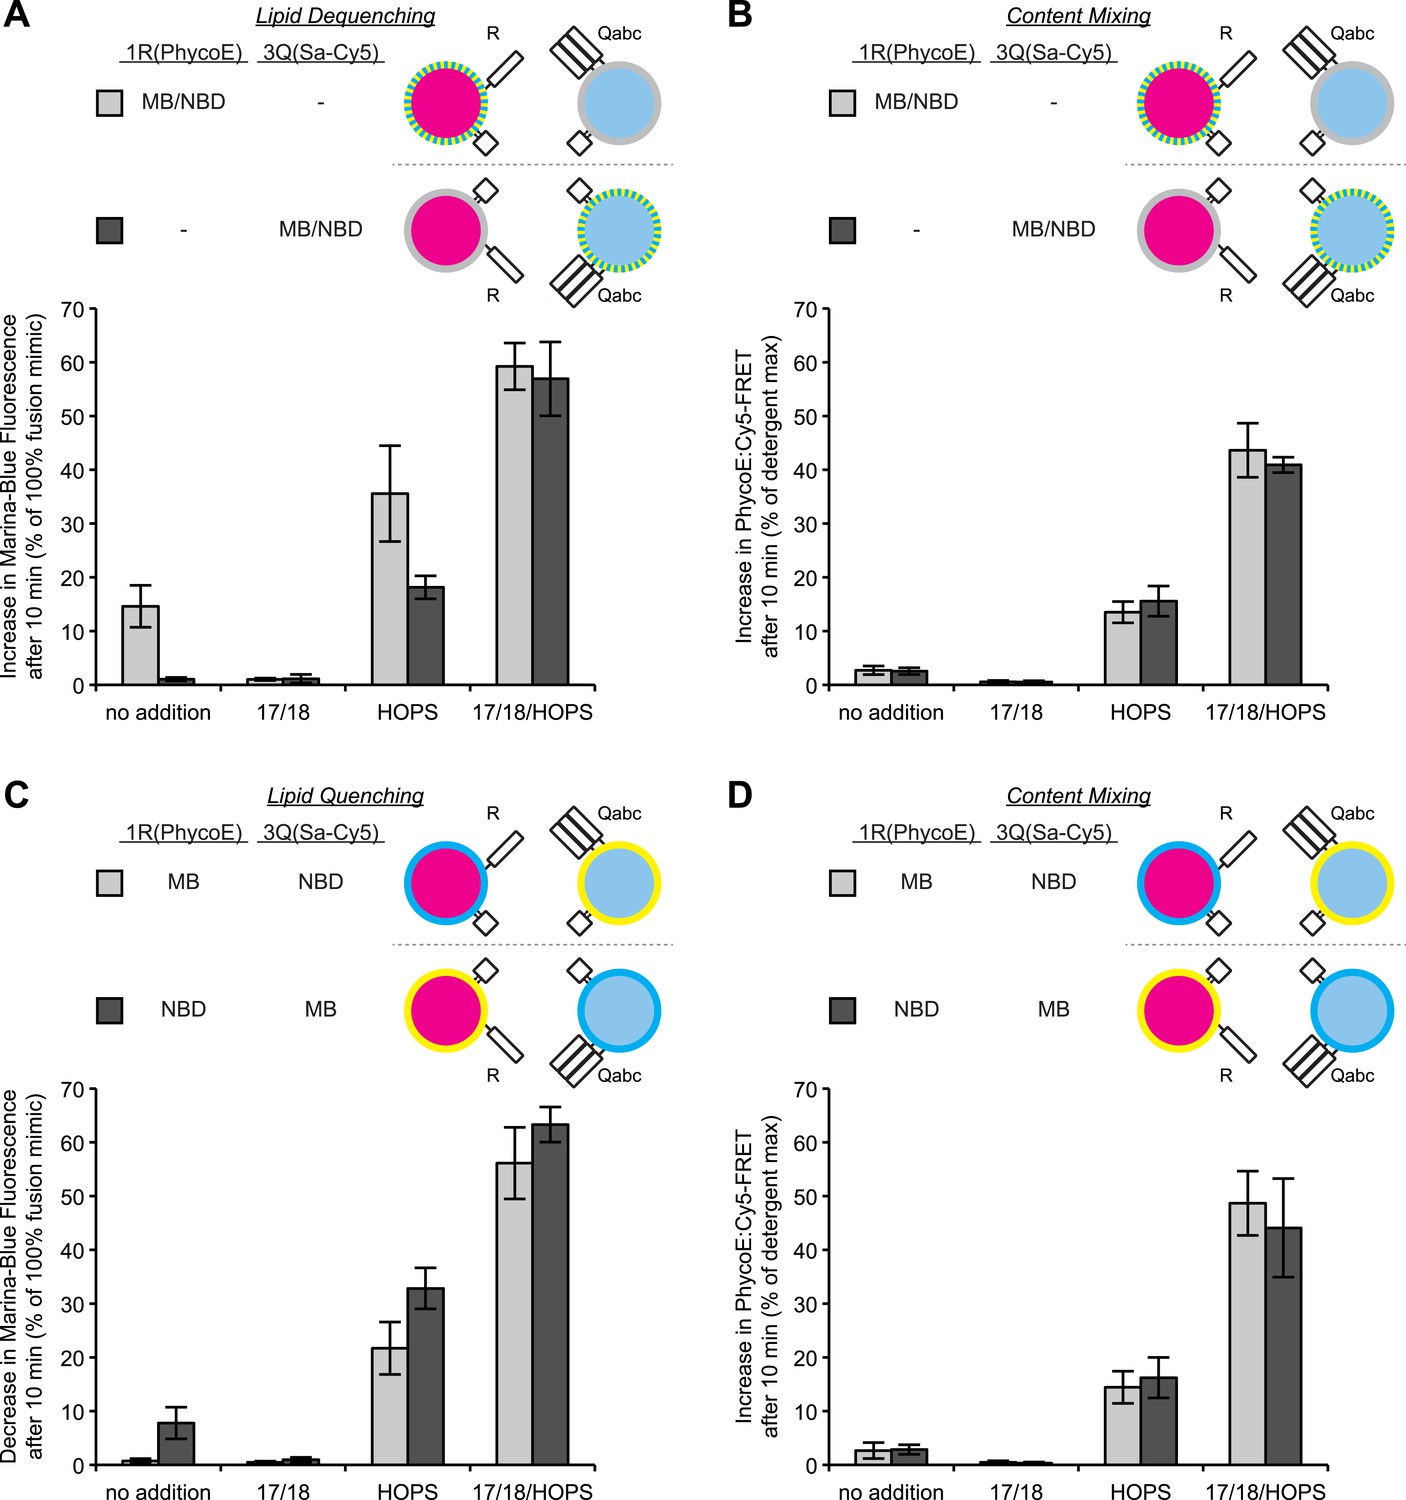
Discrepancies between lipid mixing and content mixing assays in 1R-3Q RPL fusion reactions.
Incubations contained Sec17p (600 nM), Sec18p (200 nM), and HOPS (100 nM), as indicated. (A and B) Incubations contained 1R-RPLs (containing Biotin-PhycoE) and 3Q-RPLs (containing Streptavidin-Cy5) (250 µM lipid each), with the two fluorescent lipids Marina-Blue-phosphatidylethanolamine (MB-PE) and NBD-PE (1.5 mol% each) being together on either the 1R-RPLs or the 3Q-RPLs. Lipid dequenching (A) and protected lumenal content mixing (B) were recorded from the same reactions. (C and D) Incubations bore 1R-RPLs (containing Biotin-PhycoE) and 3Q-RPLs (containing Streptavidin-Cy5) (250 µM lipid each), with each RPL bearing a single fluorescent lipid, either Marina-Blue-phosphatidylethanolamine (MB-PE) (1 mol%) or NBD-PE (3 mol%). Lipid quenching (C) and protected lumenal content mixing (D) were recorded from the same reactions.
Figure 3—figure supplement 1
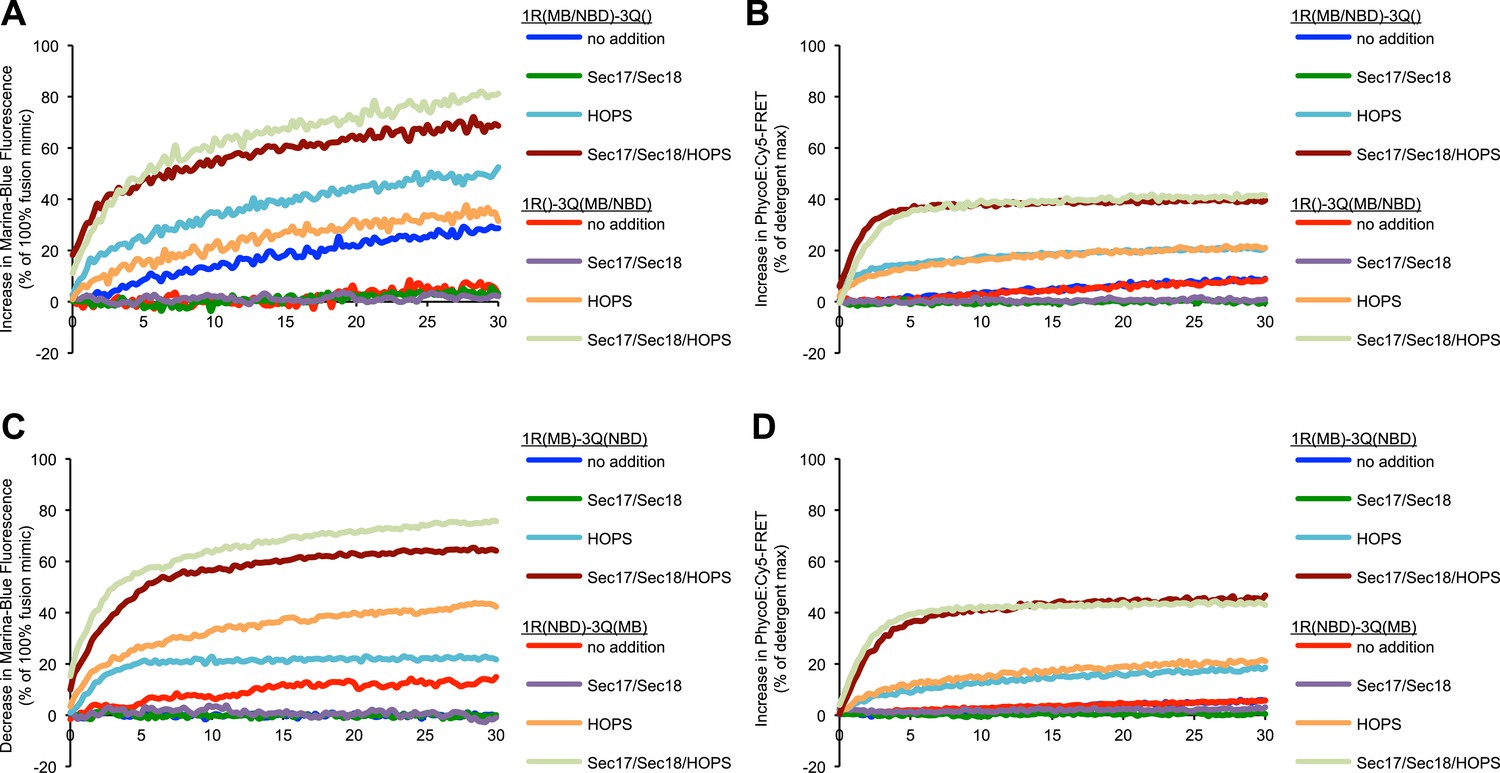
Representative kinetic data for panels A–D in figure 3.
https://doi.org/10.7554/eLife.03251.009
Figure 3—figure supplement 2
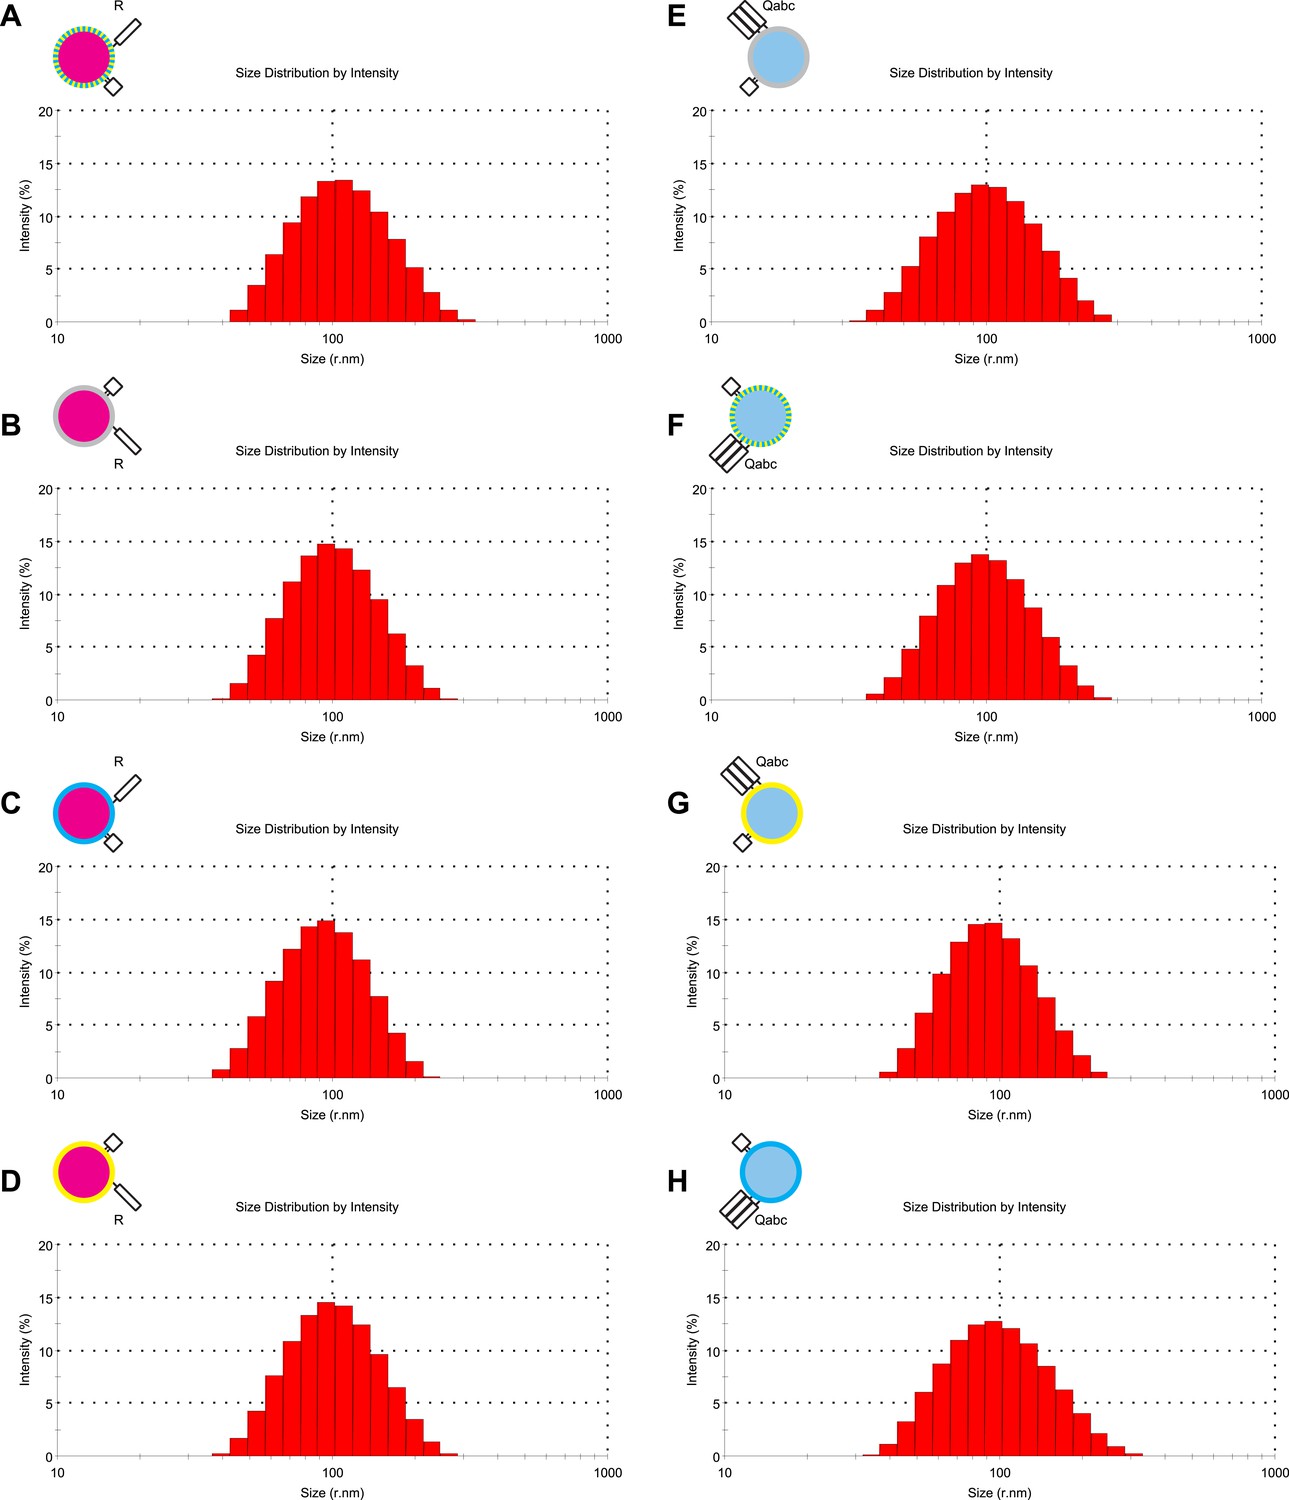
Characterization of liposome size by dynamic light scattering.
(A–H) The size distribution of various proteoliposome preparations was analyzed by dynamic light scattering with a Zetasizer nano ZS (Malvern Instruments, Westborough, MA) through non-invasive back-scatter at 173°. Samples of 400 μl at a lipid concentration of 20 μM were measured in low volume disposable sizing cuvettes at 25°C. The Z averages (r.nm) were: 101.5 for 1R(MB/NBD) (A), 90.63 for 1R() (B), 99.18 for 1R(MB) (C), 91.07 for 1R(NBD) (D), 89.78 for 3Q() (E), 95.36 for 3Q(MB/NBD) (F), 86.93 for 3Q(NBD) (G), and 89.40 for 3Q(MB) (H).
Figure 3—figure supplement 3
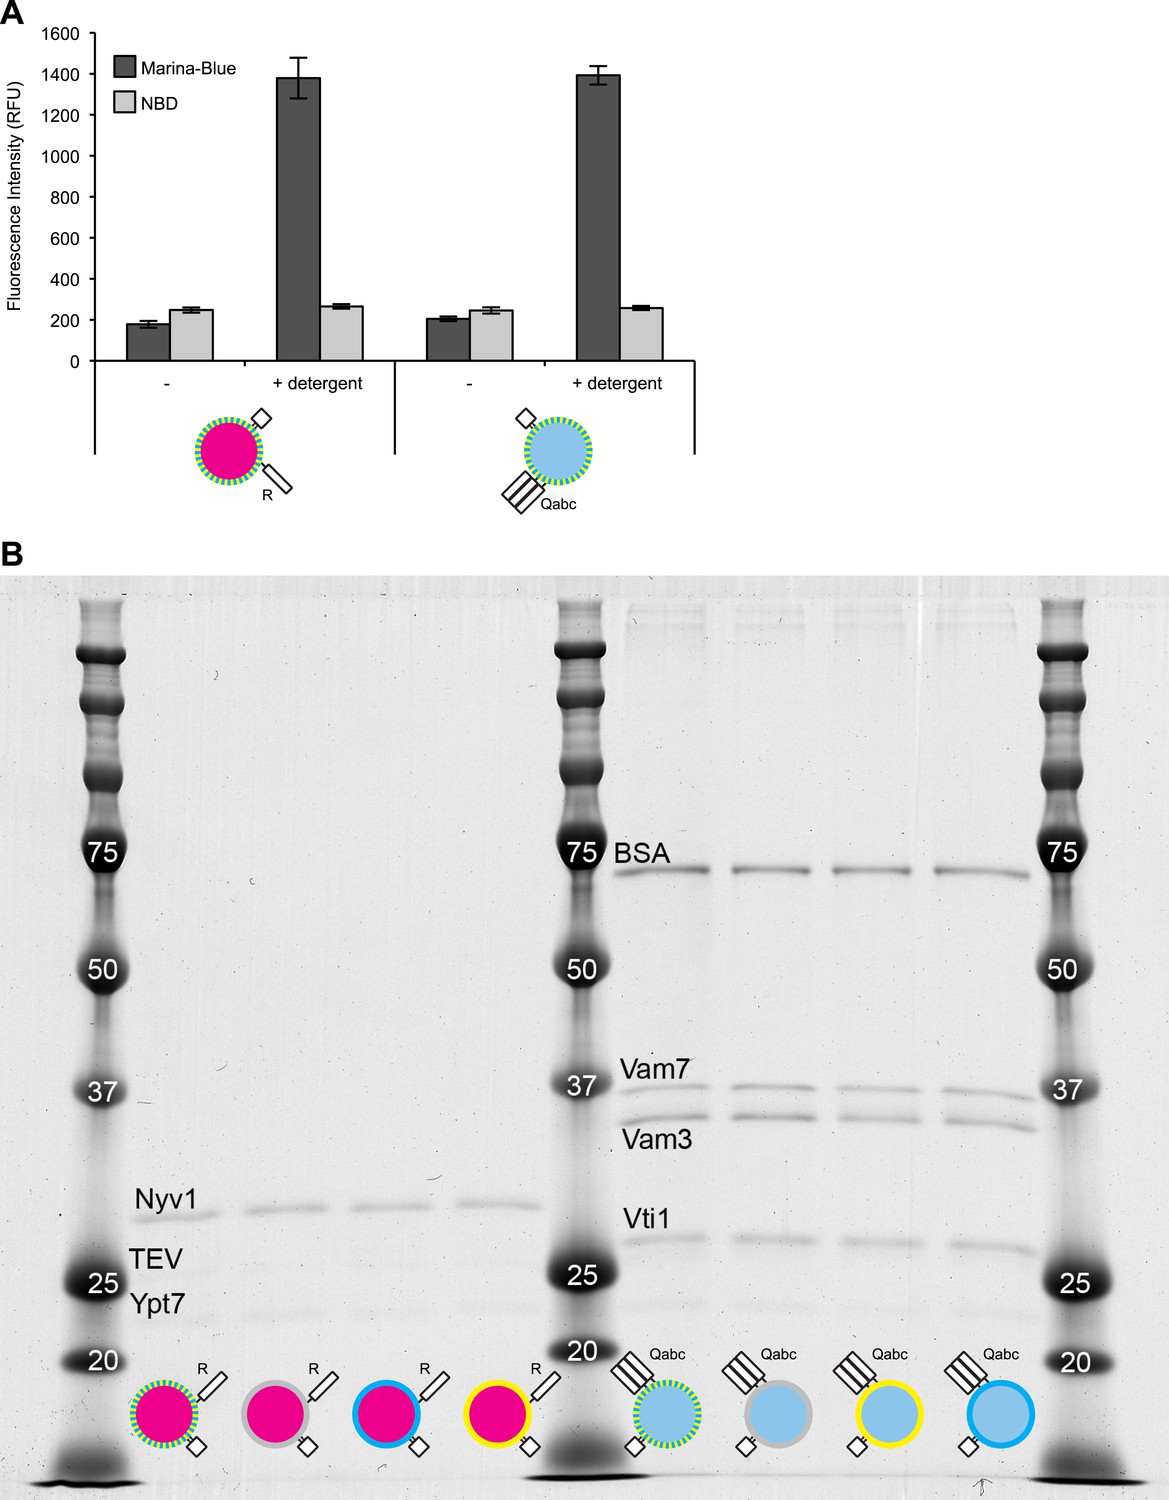
Characterization of dye and protein incorporation.
(A) Samples (20 µl) of 1R(MB/NBD) and 3Q(MB/NBD) RPLs (25 µM lipid) were incubated for 30 min at 27°C in the presence or absence of Thesit (0.2% [wt/vol]) in 384-well plates in a SpectraMax Gemini XPS, and the fluorescence of Marina-Blue (Ex: 370 nm, Em: 465 nm, cutoff: 420 nm) and NBD (Ex: 460 nm, Em: 538 nm, cutoff: 515 nm) was recorded. The average of three repeats ± standard deviations is shown. (B) RPLs of various composition were analyzed for their protein composition by SDS-PAGE and Colloidal Coomassie staining.
Figure 4 with 1 supplement
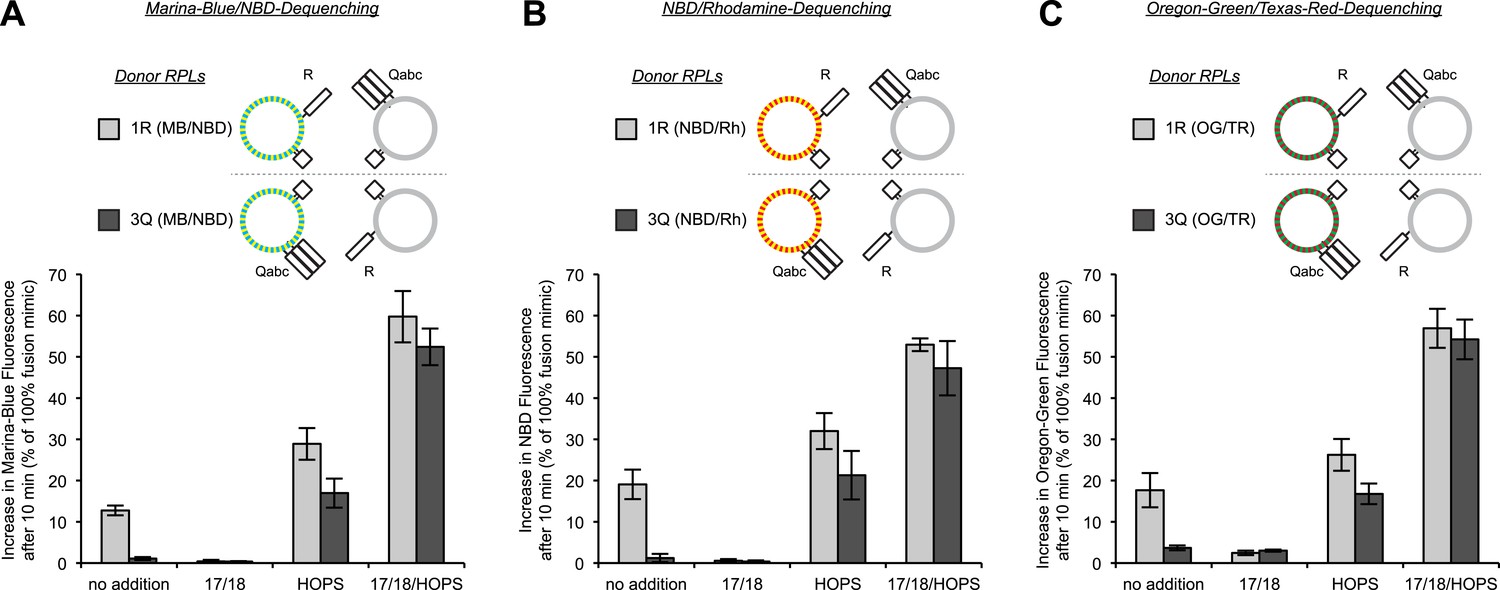
Asymmetric lipid dequenching is seen with different pairs of fluorescent lipidic markers.
(A–C) Lipid dequenching reactions of 1R- and 3Q-RPLs (250 µM lipid each) had combinations of Sec17p (600 nM), Sec18p (200 nM), and HOPS (100 nM), as indicated. Either the 1R-RPLs (light gray) or the 3Q-RPLs (dark gray) bore pairs of fluorescently labeled lipids (1.5 mol% each): Marina-Blue (MB) and NBD (A), NBD and rhodamine (Rh) (B), or Oregon-Green (OG) and Texas-Red (TR) (C).
Figure 4—figure supplement 1
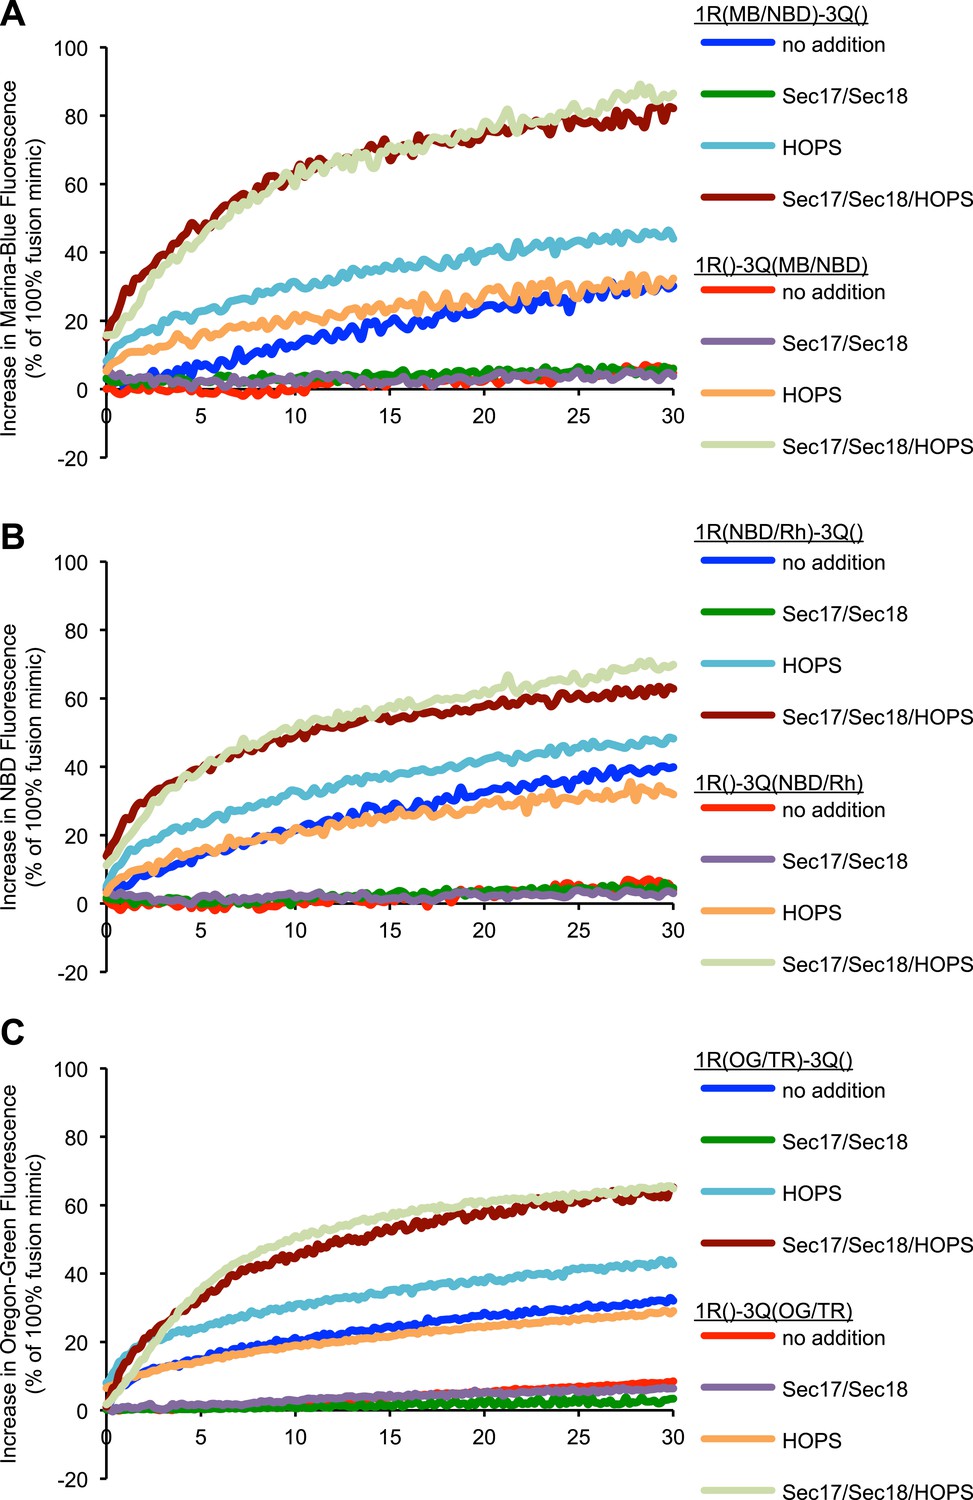
Representative kinetic data for panels A–C in figure 4.
https://doi.org/10.7554/eLife.03251.013
Figure 5 with 2 supplements

Modulation of fusion activity through asymmetric distribution of PI(3)P.
(A) 1R-RPLs (with 0.5 mol% Marina-Blue-phosphatidylethanolamine [PE], containing biotinylated R-phycoerythrin) and 3Q-RPLs (with 3 mol% NBD-PE, containing Cy5-labeled streptavidin), bearing PI(3)P as indicated, were assayed for protected lumenal compartment mixing. Where indicated (columns 17–20), 3Q-RPLs bore a truncated version of the Qc-SNARE Vam7p that lacks the PI(3)P binding PX domain (Xu and Wickner, 2012). Reactions contained Sec17p (600 nM), Sec18p (200 nM), and HOPS (100 nM), as indicated. The lower panel provides a magnified view of the bottom 5% of the data (indicated by dotted box). (B) Kinetics of 1R-3Q content mixing assays with RPLs not bearing PI(3)P. Reactions contained HOPS (100 nM; red curve), Sec17p and Sec18p (600 and 200 nM; gray curve), or no added proteins (blue curve). The averages of five experiments are shown. The reactions containing Sec17p/Sec18p were normalized to zero, and these values were subtracted from all other conditions. Light-colored areas indicate standard deviations.
Figure 5—figure supplement 1
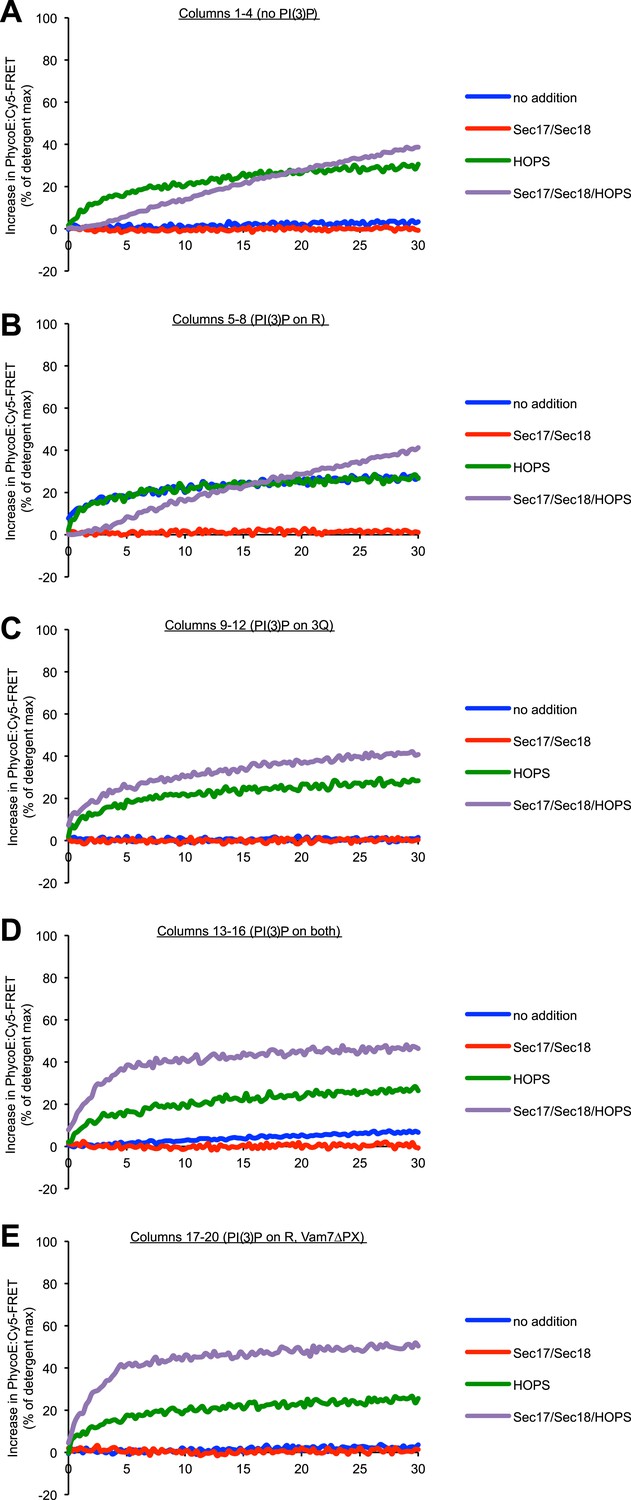
Representative kinetic data for panel A in figure 5.
https://doi.org/10.7554/eLife.03251.015
Figure 5—figure supplement 2
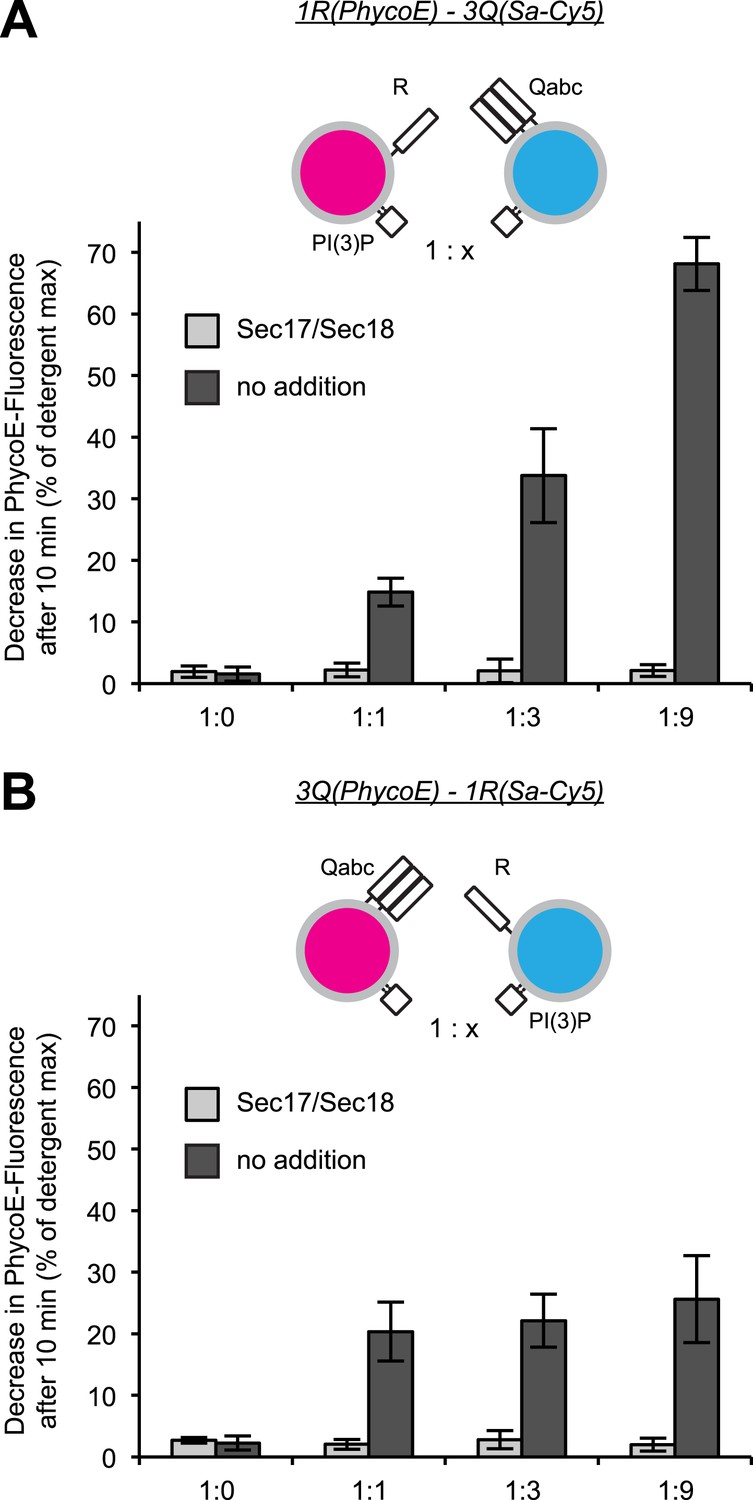
Effect of varying the ratio of 1R to 3Q RPLs.
Protected lumenal compartment mixing was measured as the decrease in fluorescence intensity of Biotin-PhycoE when it binds to Streptavidin-Cy5. Incubations either contained Sec17p (600 nM) and Sec18p (200 nM) (light gray) or no additional proteins (dark gray). All 1R-RPLs contained PI(3)P (1 mol%), while all 3Q-RPLs did not. (A) Content mixing reactions of 1R-RPLs (50 µM lipid; containing the lumenal marker Biotin-PhycoE) and 3Q-RPLs (0, 50, 150, or 450 µM lipid; containing the lumenal marker Streptavidin-Cy5). (B) Content mixing reactions of 3Q-RPLs (50 µM lipid; containing the lumenal marker Biotin-PhycoE) and 1R-RPLs (0, 50, 150, or 450 µM lipid; containing the lumenal marker Streptavidin-Cy5).
Figure 6 with 3 supplements
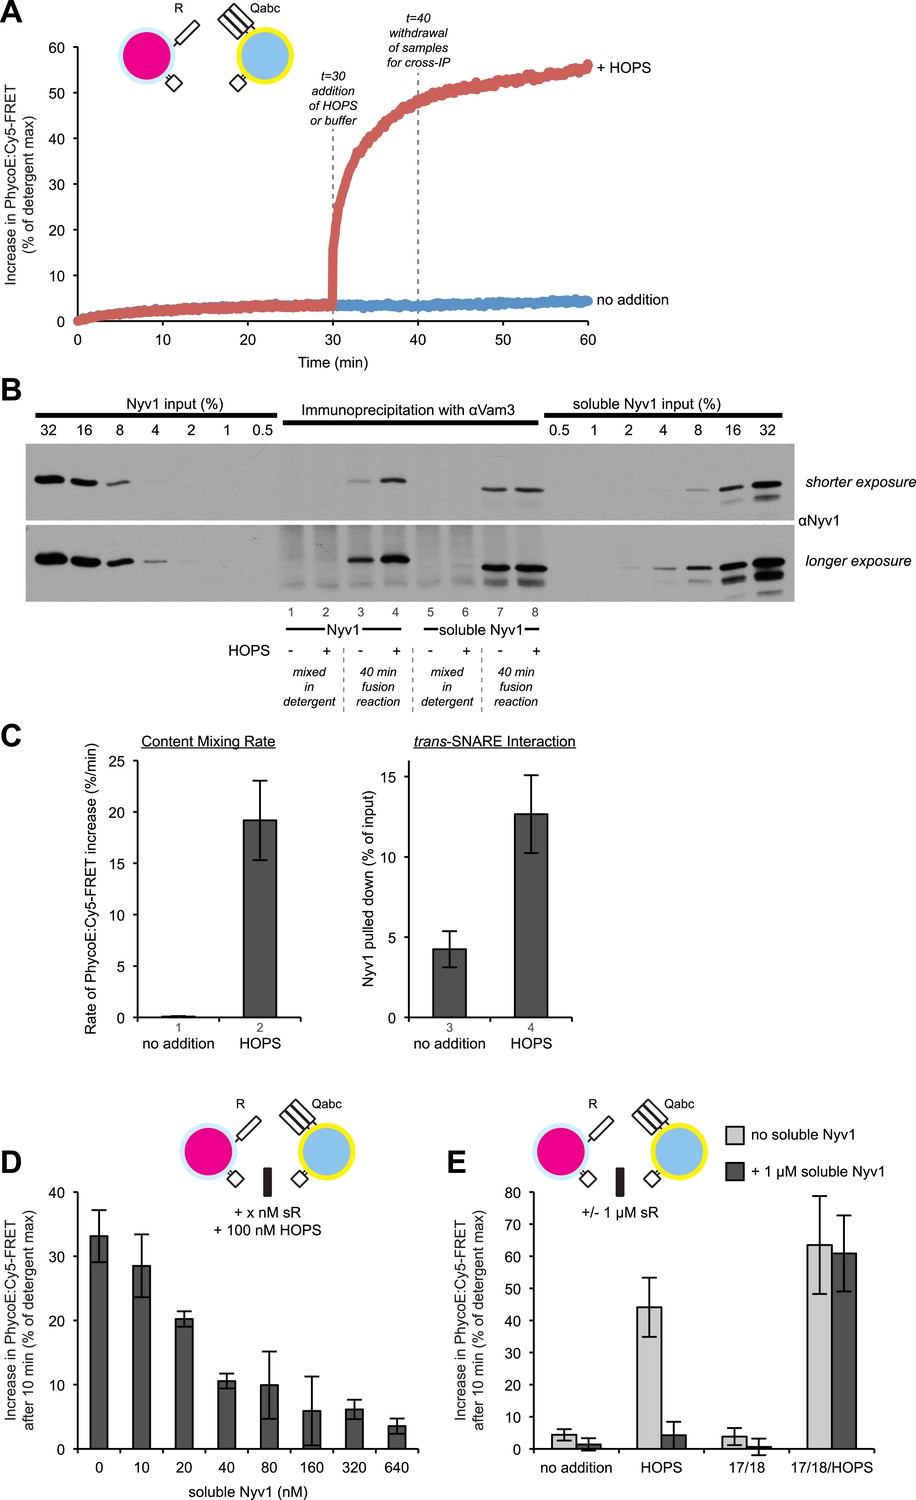
HOPS increases the rate of content mixing substantially more than the formation of trans-SNARE associations.
(A) Kinetics of 1R-3Q content mixing assays. RPLs (reconstituted with a protein:lipid ratio of 1:2500 for SNAREs) were incubated for 30 min at 27°C before and after the addition of HOPS (100 nM) or its buffer. (B) Additional 40 µl reactions that were performed in parallel were analyzed for trans-SNARE association by co-immunoprecipitation of Nyv1p (R-SNARE) with Vam3p (Qa-SNARE). Lanes 3 and 4 correspond to the conditions as shown in (A). Lanes 7 and 8 are from equivalent reactions, but containing soluble Nyv1p instead of R-RPLs. For lanes 1, 2, 5, and 6, the components were mixed directly in detergent solution without prior incubation. (C) Quantification of content mixing and trans-SNARE association (as seen in panels A and B) from three independent repeat experiments. The rate of fusion was determined as the slope for the first minute of the content mixing reaction after addition of HOPS or its buffer (between minutes 30 and 31). Trans-SNARE interactions were quantified as the amount of Nyv1p that co-precipitated with Vam3p (lanes 3 and 4 in panel B) using UN-SCAN-IT gel 5.3 software (Silk Scientific, Orem, UT). (D) 1R- and 3Q-RPLs were mixed with increasing concentrations of soluble Nyv1p (sR), and incubated for 30 min at 27°C. HOPS (100 nM) was added, and the reactions were assayed for protected lumenal compartment mixing. (E) A mixture of 1R- and 3Q-RPLs was pre-incubated with or without 1 µM soluble Nyv1p for 30 min at 27°C. Sec17p (600 nM), Sec18p (200 nM), and HOPS (100 nM) or their respective buffers were added as indicated, and the reactions were assayed for protected lumenal compartment mixing.
Figure 6—figure supplement 1
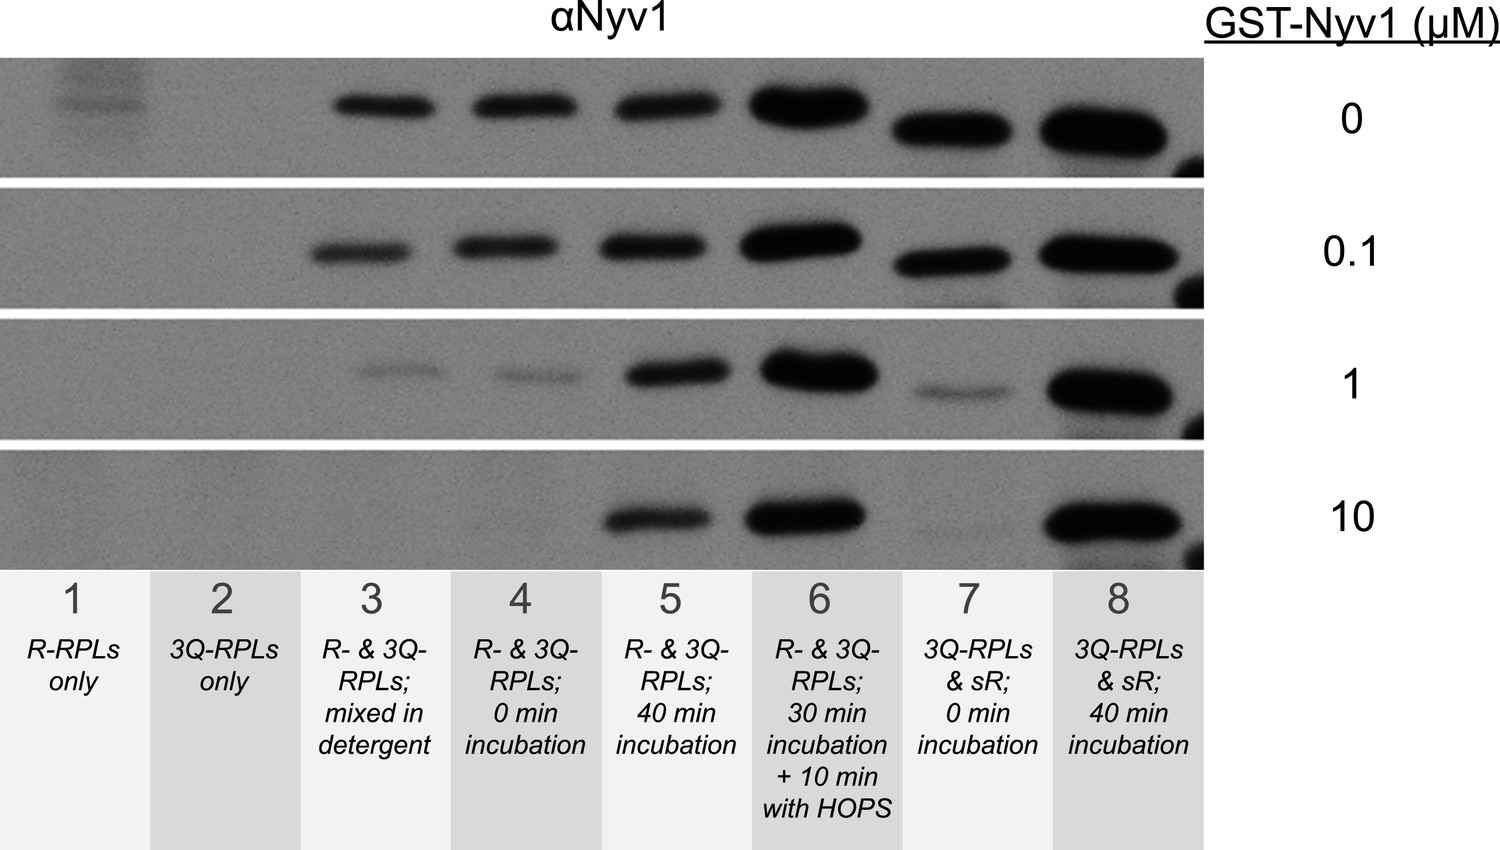
Suppression of the formation of 1R-3Q SNARE complexes in detergent by increasing concentrations of GST-tagged Nyv1p.
The 40 µl fusion reactions were incubated at 27°C as indicated, and analyzed for trans-SNARE association by co-immunoprecipitation of Nyv1p (R-SNARE) with Vam3p (Qa-SNARE). The co-immunoprecipitation was carried out in the presence of increasing concentrations of GST-Nyv1p. Lanes 1 and 2 contained only R- or 3Q-RPLs. Lanes 3-6 contained R- and 3Q-RPLs. Lanes 7 and 8 contained 3Q-RPLs and soluble Nyv1p.
Figure 6—figure supplement 2
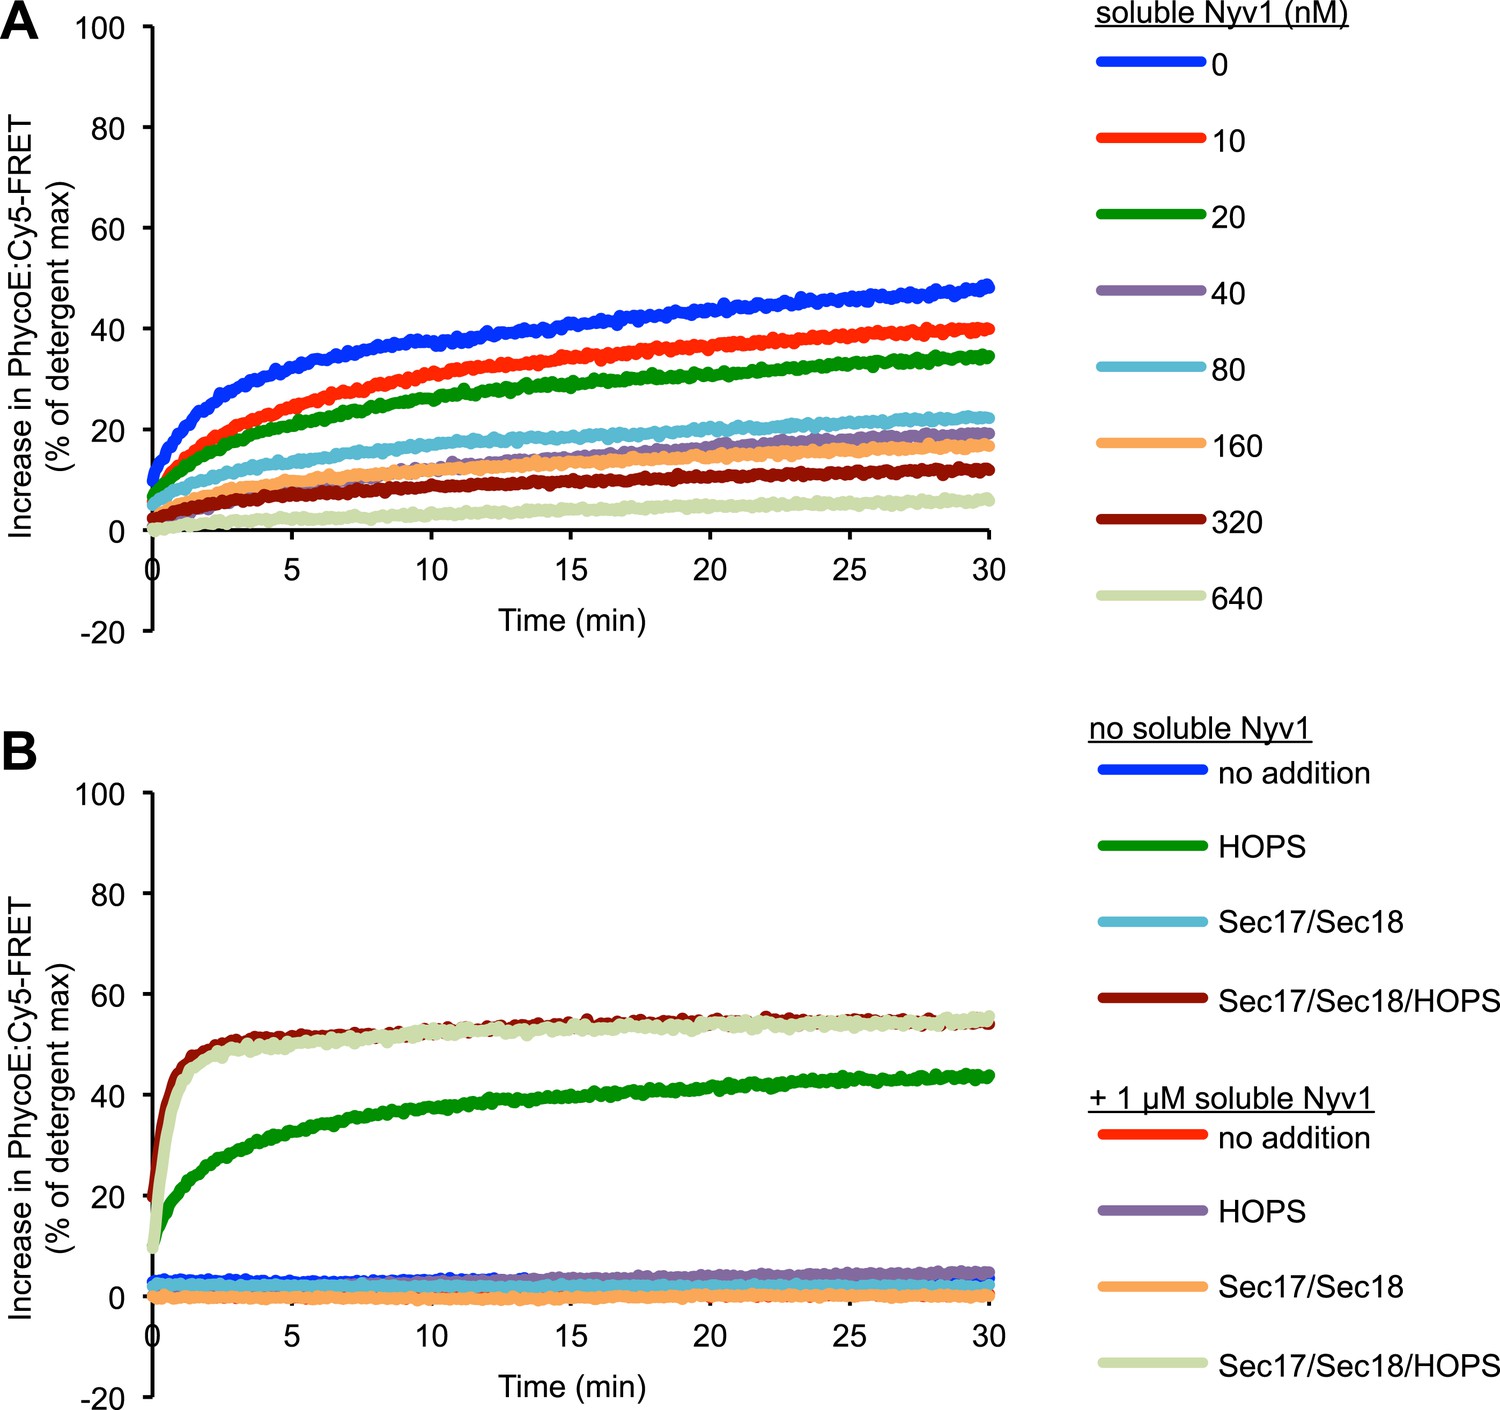
Representative kinetic data for panels D–E in figure 6.
https://doi.org/10.7554/eLife.03251.019
Figure 6—figure supplement 3
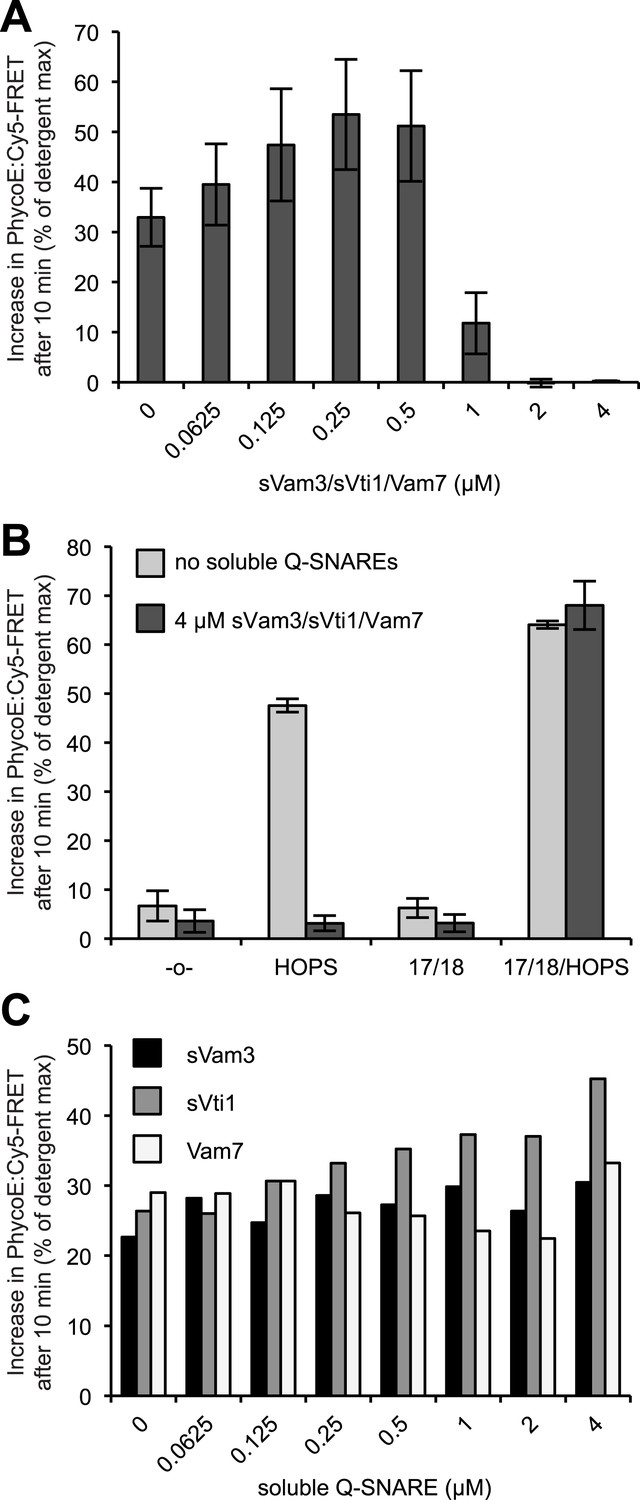
Reversible inhibition by soluble Q-SNAREs.
(A) 1R- and 3Q-RPLs were mixed with increasing concentrations of soluble Vam3p, Vti1p, and Vam7p, and incubated for 30 min at 27°C. HOPS (100 nM) was added, and the reactions were assayed for protected lumenal compartment mixing. (B) A mixture of 1R- and 3Q-RPLs was pre-incubated with or without 4 µM soluble Vam3p, Vti1p, and Vam7p for 30 min at 27°C. Sec17p (600 nM), Sec18p (200 nM), and HOPS (100 nM) or their respective buffers were added as indicated, and the reactions were assayed for protected lumenal compartment mixing. (C) Reactions as in (A), but with increasing concentrations of either soluble Vam3p, or soluble Vti1p, or Vam7p individually.
Figure 7

High cooperativity does not explain the disproportion between trans-SNARE interaction and fusion rate resulting from HOPS addition.
(A) Kinetics of content mixing reactions of 3Q-RPLs (reconstituted with a protein:lipid ratio of 1:2000 for Vam3p, Vti1p, and Vam7p) and 1R-RPLs (reconstituted with a protein:lipid ratio of either 1:2000 [blue], 1:4000 [red], 1:8000 [green], or 1:16,000 [purple] for Nyv1p). RPLs were incubated for 30 min at 27°C before and HOPS (100 nM) or its buffer were then added. (B) Equivalent 40 µl reactions were analyzed for trans-SNARE association by co-immunoprecipitation of Nyv1p (R-SNARE) with Vam3p (Qa-SNARE). Lanes 1–8 correspond to the conditions as shown in (A) with odd numbers representing conditions with no addition and even numbers representing conditions with HOPS (100 nM). For lanes a, b, c, and d, the components were mixed directly in detergent solution without prior incubation. (C) Quantification of content mixing (as seen in panel A) from three independent repeat experiments. The rate of fusion was determined as the slope for the first 10 min of the content mixing reaction (between minutes 0 and 10) for samples that did not receive HOPS or as the slope for the first minute of the content mixing reaction after addition of HOPS (between minutes 30 and 31). (D) Quantification of trans-SNARE association (as seen in panel B). Trans-SNARE interactions were quantified as the amount of Nyv1p that co-precipitated with Vam3p (lanes 1–8 in panel B) using UN-SCAN-IT gel 5.3 software (Silk Scientific, Orem, UT), and are represented as percentage of the amount of Nyv1p that co-precipitated in the reaction that contained HOPS and R-RPLs with a SNARE:lipid ratio of 1:2000 (lane 8 in panel B).
Download links
A two-part list of links to download the article, or parts of the article, in various formats.
Downloads (link to download the article as PDF)
Open citations (links to open the citations from this article in various online reference manager services)
Cite this article (links to download the citations from this article in formats compatible with various reference manager tools)
A distinct tethering step is vital for vacuole membrane fusion
eLife 3:e03251.
https://doi.org/10.7554/eLife.03251


