Prediction and characterization of enzymatic activities guided by sequence similarity and genome neighborhood networks
- University of California, San Francisco, United States
- University of Illinois at Urbana-Champaign, United States
- Albert Einstein College of Medicine, United States
Figures
Figure 1
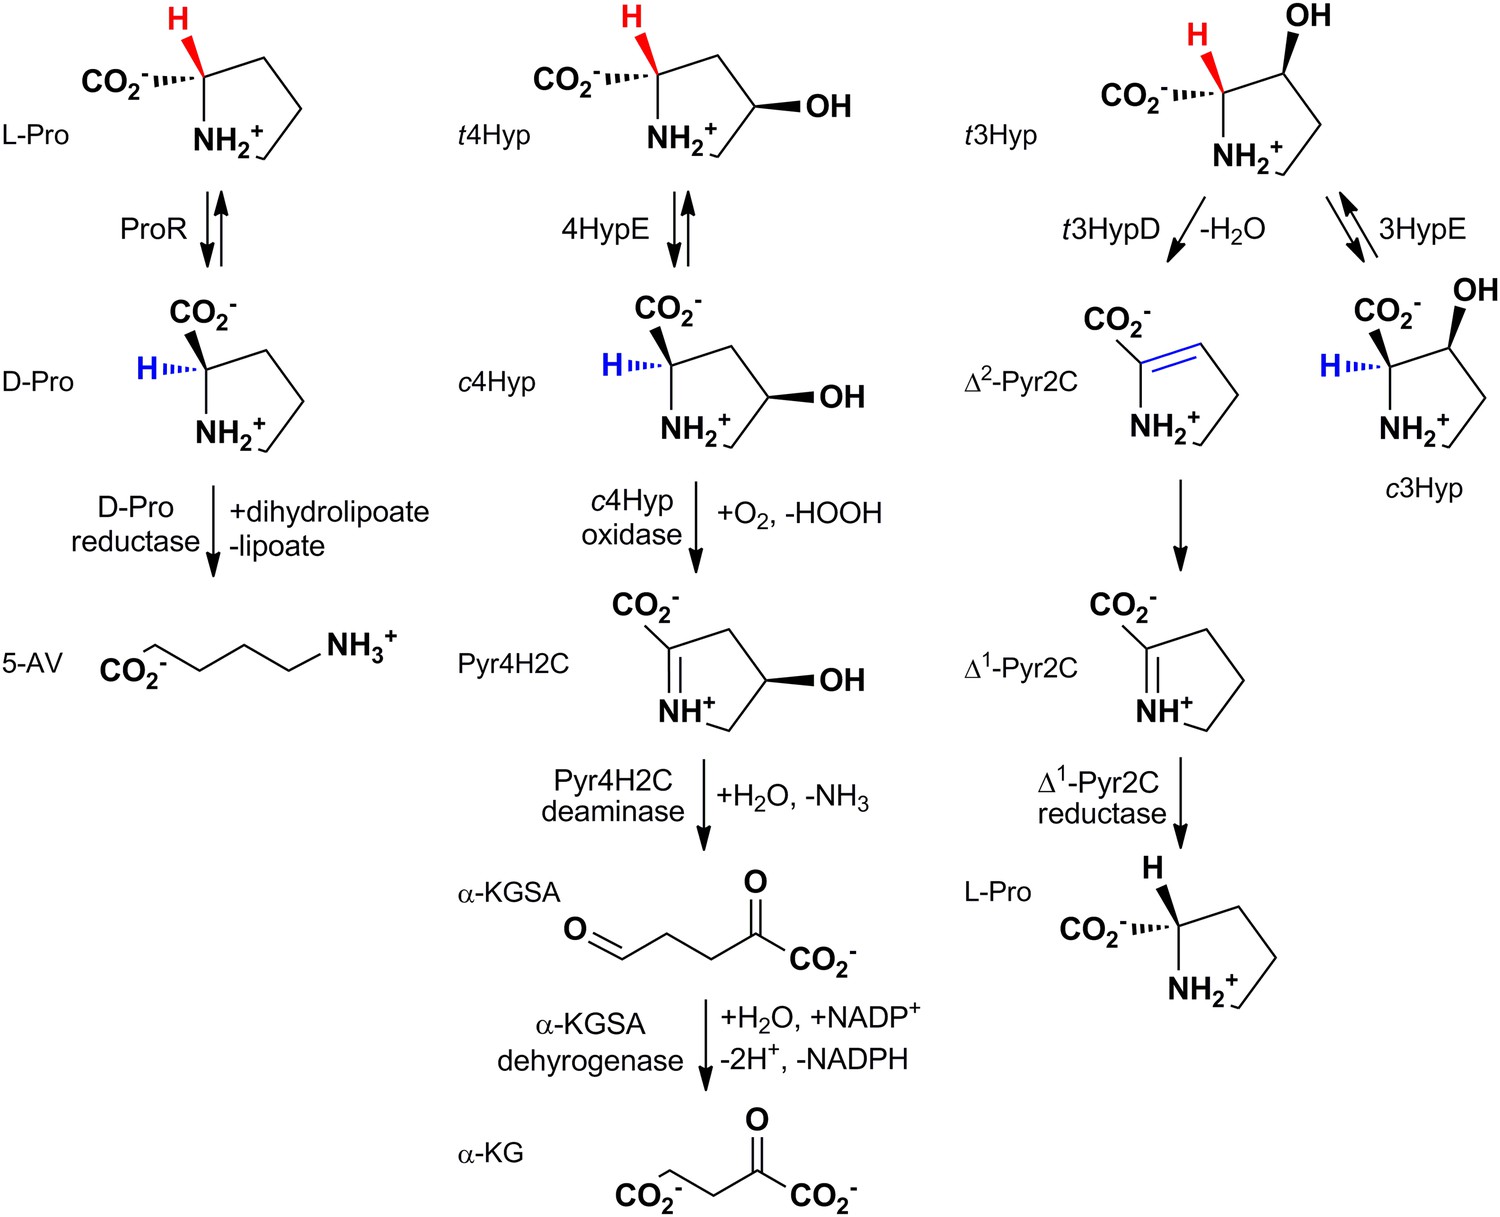
The reactions catalyzed by proline racemase (ProR), 4R-hydroxyproline 2-epimerase (4HypE), and trans-3-hydroxy-L-proline dehydratase (t3HypD) and the metabolic pathways in which they participate.
cHyp oxidase, Pyr4H2C deaminase, a-KGSA dehydrogenase, and ?1-Pyr2C reductase belong to the D-amino acid oxidase (DAAO), dihydrodipicolinate synthase (DHDPS), aldehyde dehydrogenase, and ornithine cyclodeaminase (OCD) (or malate/L-lactate dehydrogenase 2 [MLD2]) superfamilies, respectively. Abbreviations: L-Pro: L-proline; D-Pro: D-proline; 5-AV: 5-aminovalerate; t4Hyp: trans-4-hydroxy-L-proline; c4Hyp: cis-4-hydroxy-D-proline; Pyr4H2C: ?1-pyrroline 4-hydroxy 2-carboxylate; a-KGSA: a-ketoglutarate semialdehyde; a-KG: a-ketoglutarate; t3Hyp: trans-3-hyroxy-L-proline; ?2-Pyr2C: ?2-pyrroline 2-carboxylate; ?1-Pyr2C: ?1-pyrroline 2-carboxylate.
Figure 2

Sequence similarity networks (SSNs) for the PRS.
(A) The SSN displayed with an e-value threshold of 10-55 (~35% sequence identity). (B) The SSN displayed with an e-value threshold of 10-110 (~60% sequence identity).
Figure 3
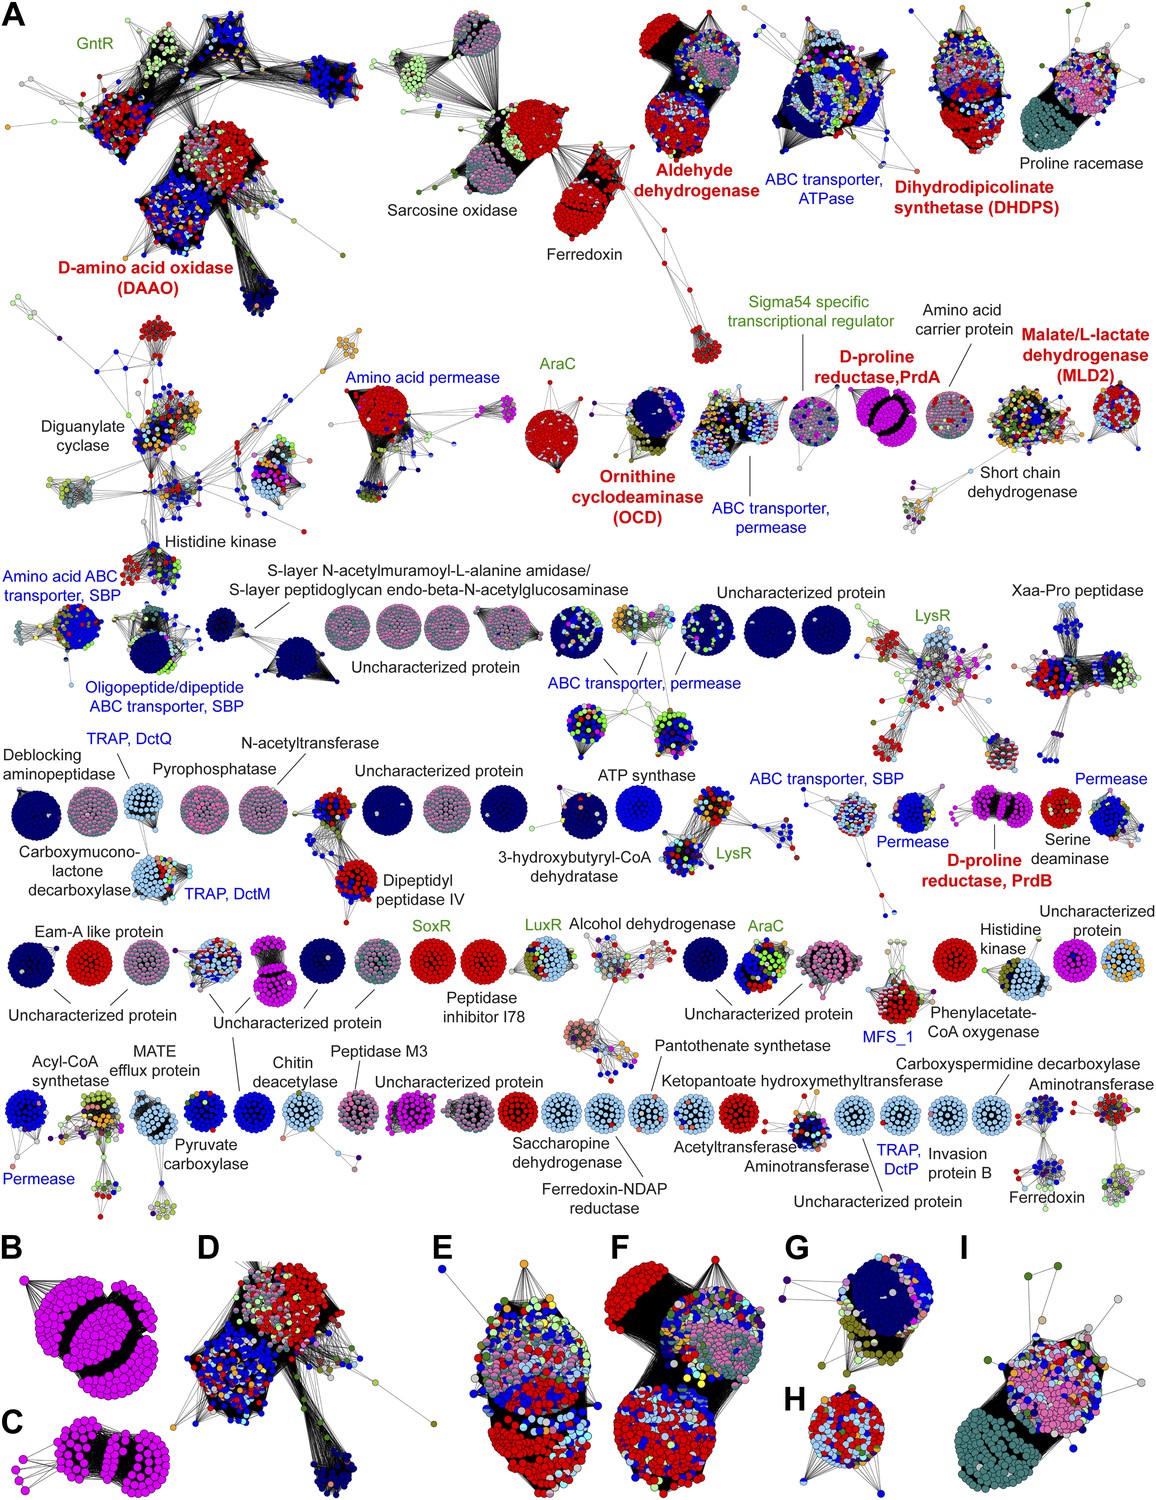
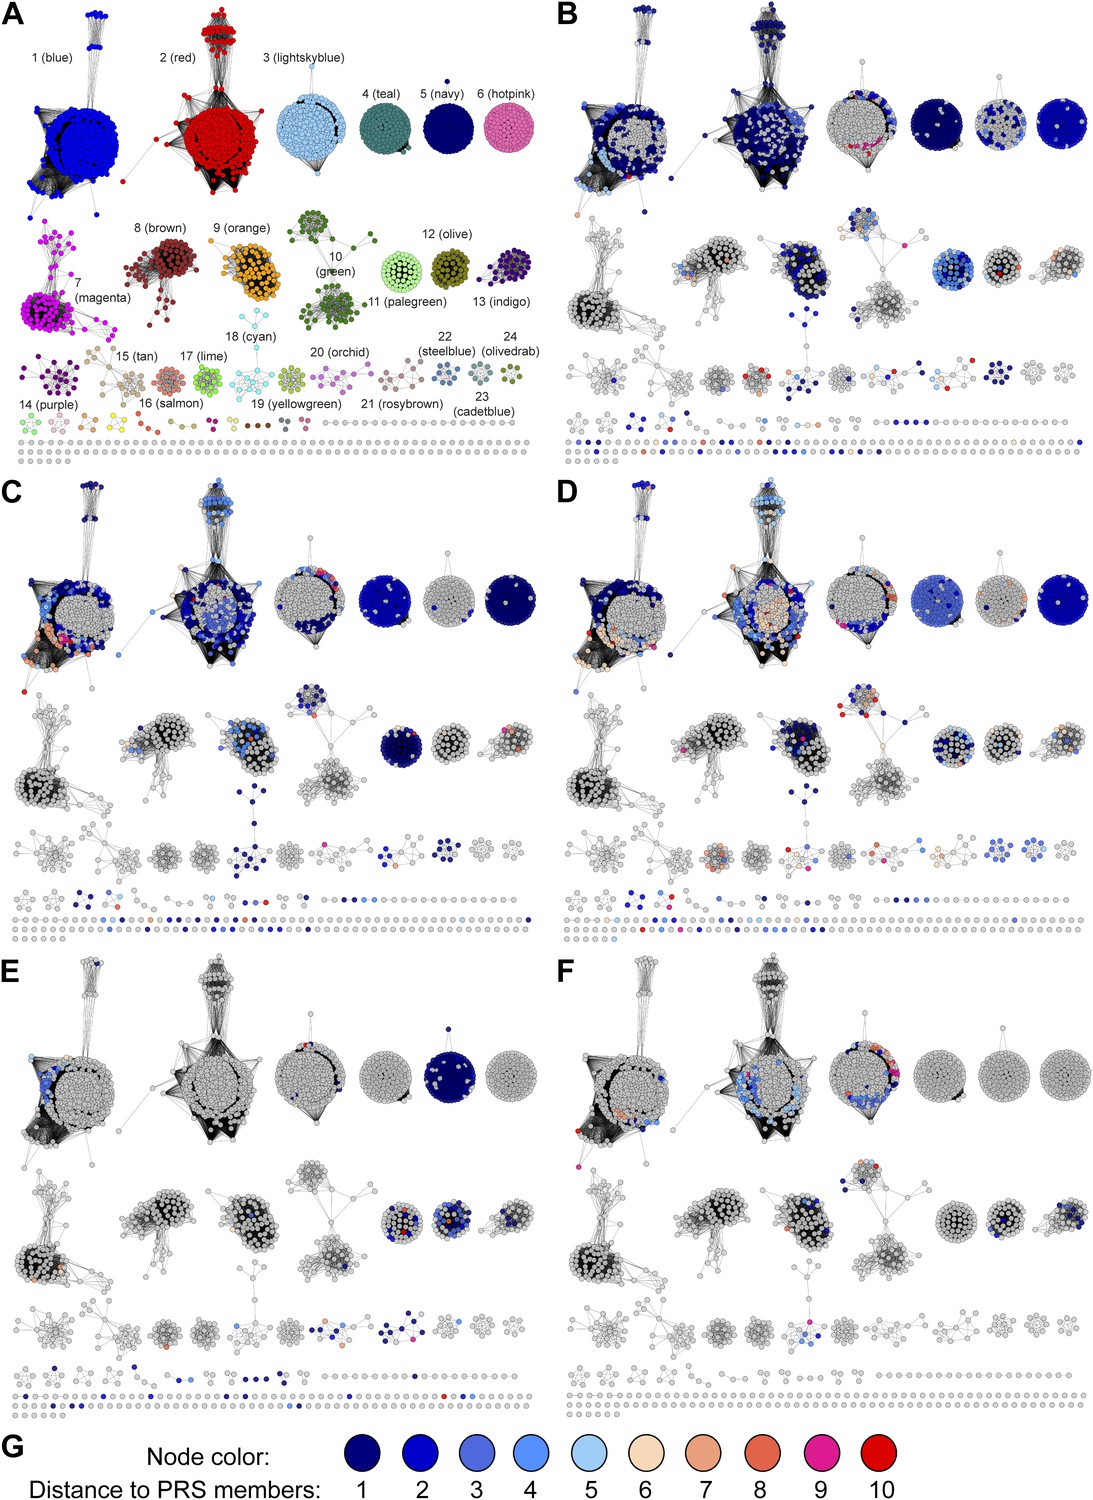
The genome neighborhood network (GGN) for the PRS.
(A) The GNN displayed with an e-value threshold of 10-20. The nodes are colored by the color of query nodes in the SSN (Figure 2A). The clusters are labeled with the UniProtKB/TrEMBL annotations. (B–I) Selected superfamily clusters from the GNN showing node colors. (B) D-proline reductase PrdA. (C) D-proline reductase, PrdB. (D) D-amino acid oxidase (DAAO). (E) Dihydrodipicolinate synthase (DHDPS). (F) Aldehyde dehydrogenase. (G) Ornithine cyclodeaminase (OCD). (H) Malate/L-lactate dehydrogenase 2 (MLD2). (I) Proline racemase.
Figure 4
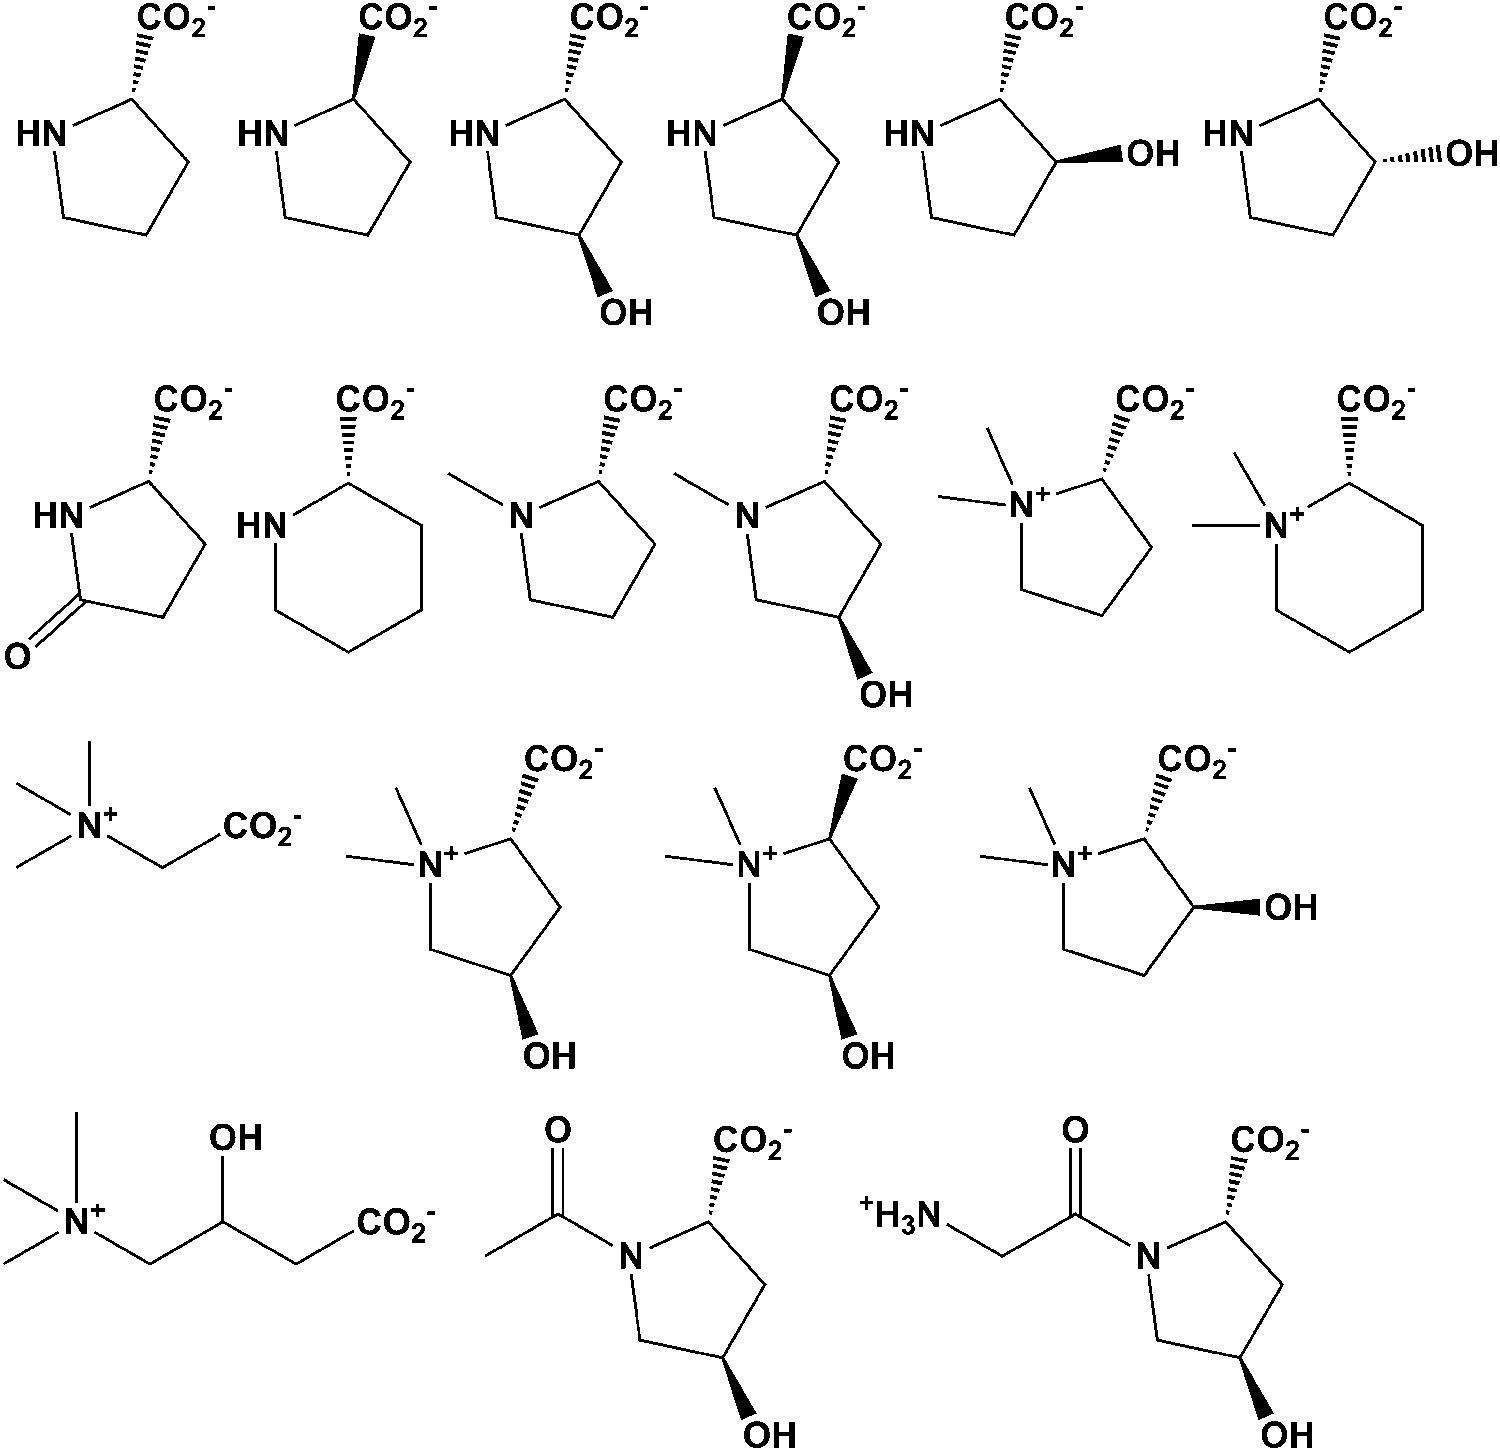
Library of proline and proline betaine derivatives tested for ESI-MS screening.
These substrates were divided into four groups to avoid mass duplication.
Figure 5
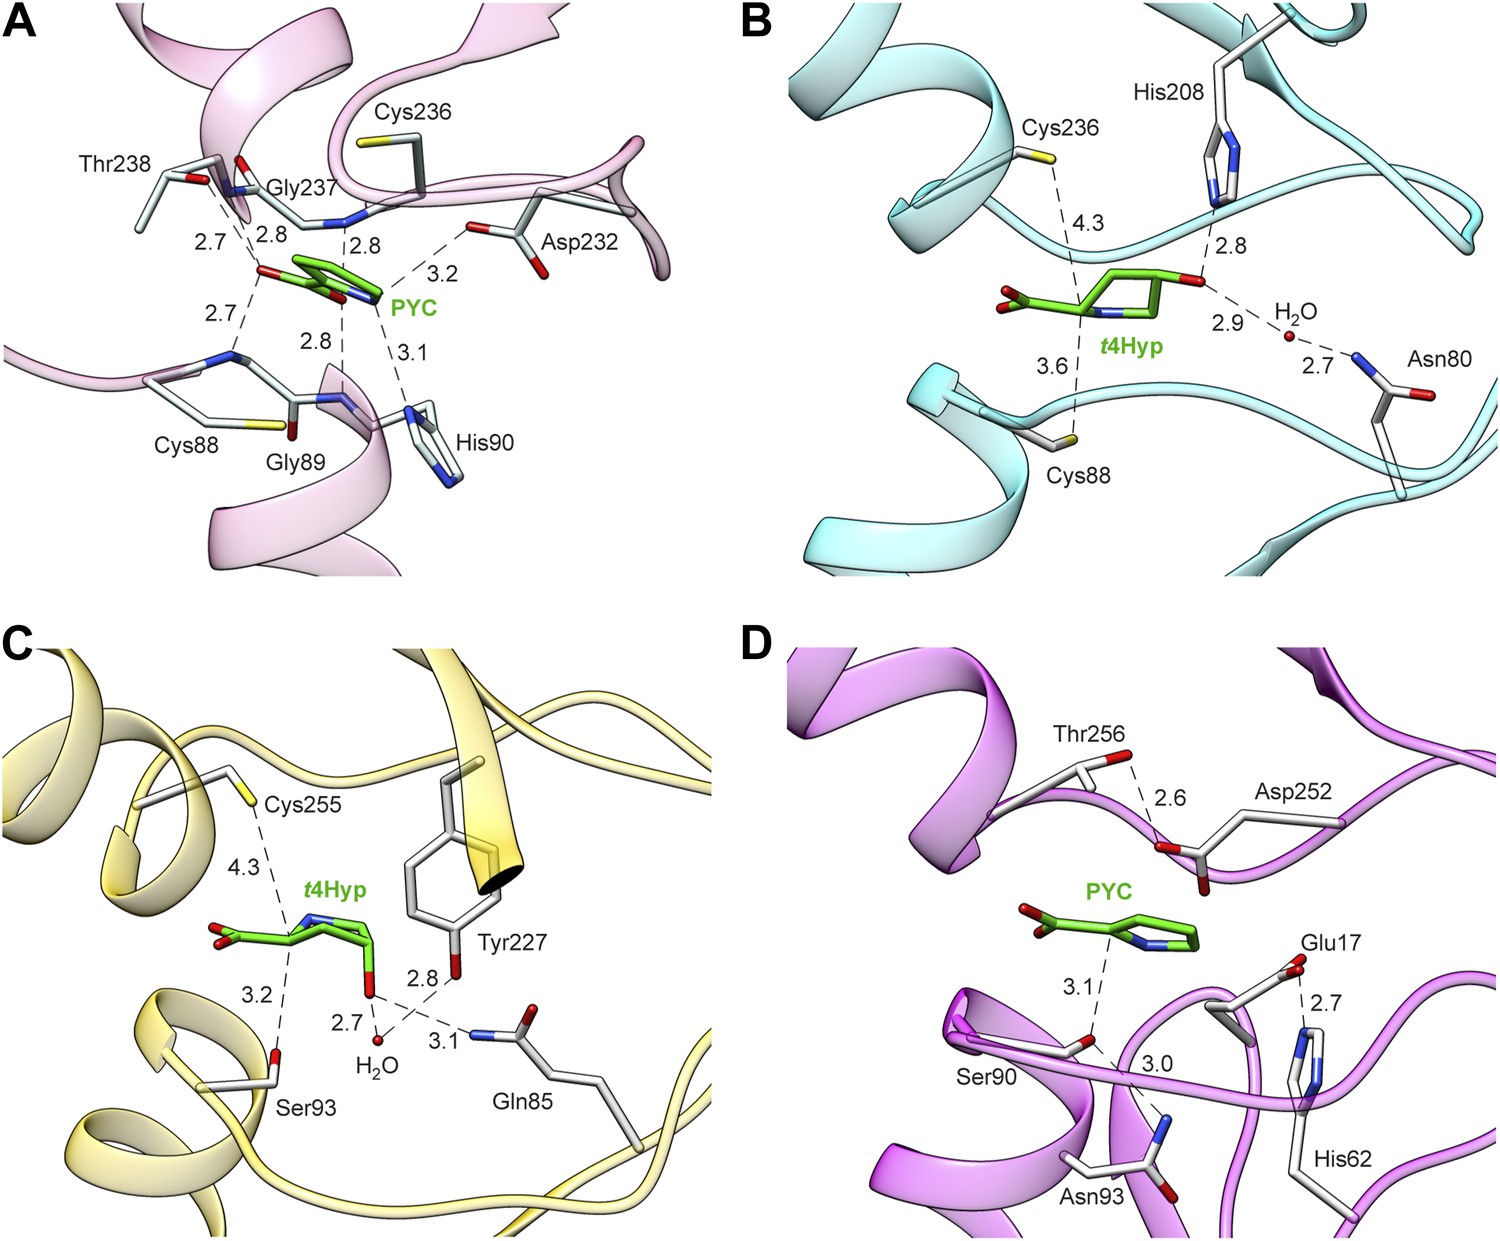
Structures of members of the PRS.
(A) Structure of Q4KGU2 (locus tag: PFL_1412; cluster 2) with PYC illustrating the utilization of the carboxyl group to bridge the N-terminal amide backbone groups of two opposing a-helices. While In B9K4G4 (D) and B9JQV3 (C) the relative positions of residues that coordinate the prolyl nitrogen (Asp 232, His 90) are conserved His 90 is replaced by a Ser. (B) Structure of Q4KGU2 with t4Hyp illustrating the interactions Q4KGU2 with the 4-hydroxyl group and the relative positions of the two catalytic cysteine residues. (C) Structure of B9JQV3 (locus tag: Avi_0518, cluster 9) with t4Hyp illustrating the interactions of B9JQV3 with the 4-hydroxyl group of t4Hyp and the relative positions of the catalytic Ser (Ser 93, trans?cis) and Cys (Cys 236, cis?trans). (D) Structure of B9K4G4 (Avi_7022, cluster 3) with PYC illustrating the position of the catalytic Ser (Ser 90, dehydration), and the non-catalytic orientation of Thr 256 which replaces the Cys observed in Cys/Cys containing PRS members. In addition, the catalytic Ser (Ser 90) is positioned by hydrogen bonding interactions between the side chain of Asn 93 (shown) and the backbone nitrogen of Asn 93 (not shown). Based on this work, all ProR family members with a catalytic Ser at this position (including B9JQV3, determined here) are proposed to have this motif.
Figure 6

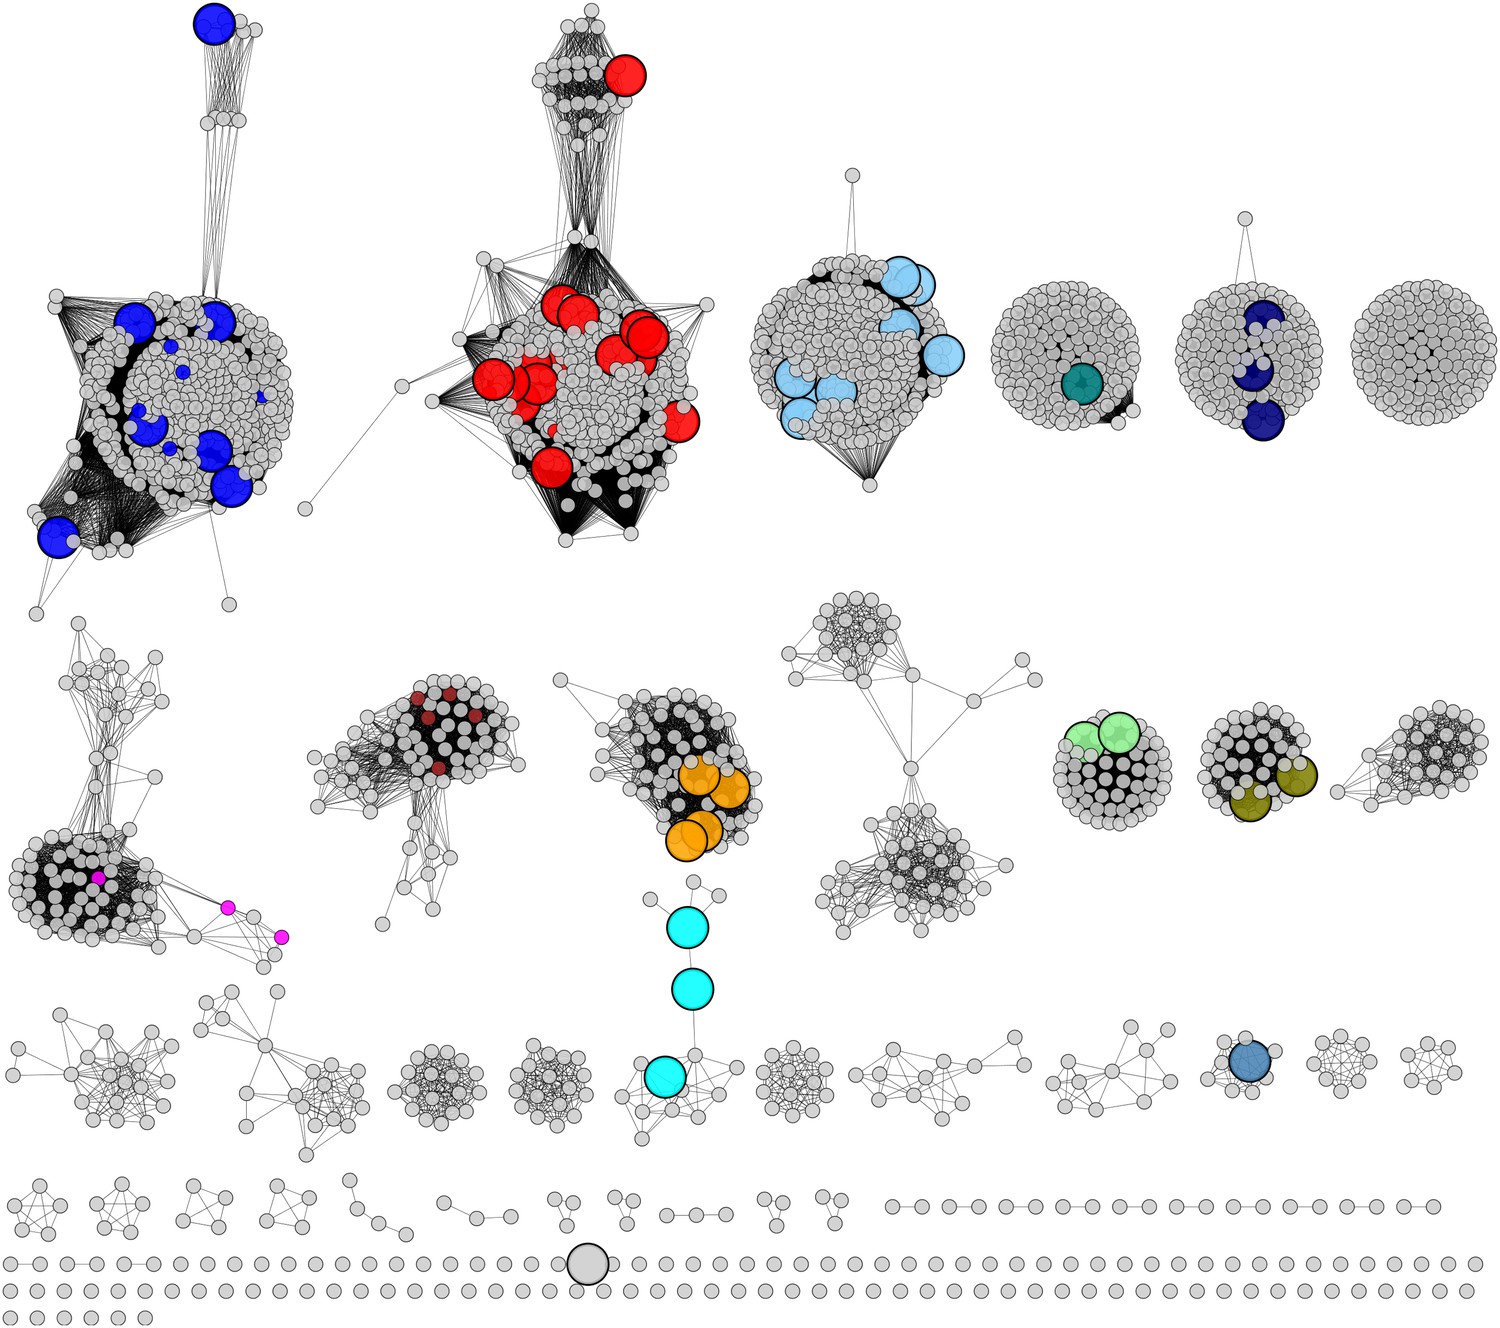
Sequence divergent members of the ornithine cyclodeaminase superfamily (OCDS) have been the assigned novel pyrroline-2-carboxylate reductase (Pyr2C reductase) function in this work.
(A) The OCDS SSN displayed at the e-value cutoff 10-45 (~35% sequence identity). The Pyr2C reductase function is located in four clusters; these proteins are shown in large colored circles, labeled from 1 to 16, and color-coded by the colors of the PRS query sequences shown in Figure 2B. Proteins representing several previously characterized functions in the OCDS are shown by large diamonds, with borders in hotpink (L-alanine dehydrogenase [Schröder et al., 2004]), brown (ornithine cyclodeaminase [Goodman et al., 2004]), magenta (lysine cyclodeaminase [Gatto et al., 2006]), red (ketamine reductase [Hallen et al., 2011]), green (L-arginine dehydrogenase [Li and Lu, 2009]) and palegreen (tauropine dehydrogenase [Kan-No et al., 2005; Plese et al., 2008]), respectively. Their annotations are shown in italics. The diamonds with blue and olive borders are Pyr2C reductases recently characterized by Watanabe et al. (2014). (B) Kinetics data for the Pyr2C reductase activity for the 16 members of the OCDS shown in panel A using NADPH as the cosubstrate.
Figure 7
Mapping members of GNN clusters back to the SSN for the PRS.
(A) SSN for the PRS with cluster numbers. (B) D-amino acid oxidase (DAAO). (C) Dihydrodipicolinate synthase (DHDPS). (D) Aldehyde dehydrogenase. (E) Ornithine cyclodeaminase (OCD). (F) Malate/L-lactate dehydrogenase 2 (MLD2). (G) The color scheme for B–F.
Figure 8
Experimentally characterized enzymes reported by Swiss-Prot (small colored circles) and newly characterized in this work (large colored circles).
Colors match the color scheme in Figure 2B.
Figure 9

Demonstration of the 4HypE, 3HypE, and t3HypD reactions by 1H NMR.
(A) 1H NMR spectra of the 4Hyp substrate mixture in 25 mM Na+-phosphate buffer, pD 8, in D2O (top) and 4Hyp mixture with A3QFI1 (cluster 1, blue) showing 4Hyp epimerization (bottom). The red arrow indicates the proton at C2 for epimerization. The enzyme was stored in glycerol, so the spectra show resonances for glycerol between 3.4 and 3.7 ppm. (B) 1H NMR spectra of the t3Hyp substrate mixture in 25 mM Na+-phosphate buffer, pD 8, in D2O (top), t3Hyp mixture with D0B556 (cluster 3, light sky blue) showing 3Hyp epimerization (middle), and t3Hyp mixture with B9K4G4 (cluster 3, light sky blue) showing t3Hyp dehydration (bottom). The red arrow indicates the proton at C2 for epimerization; the green arrow indicates the proton at C3 for dehydration.
Figure 10
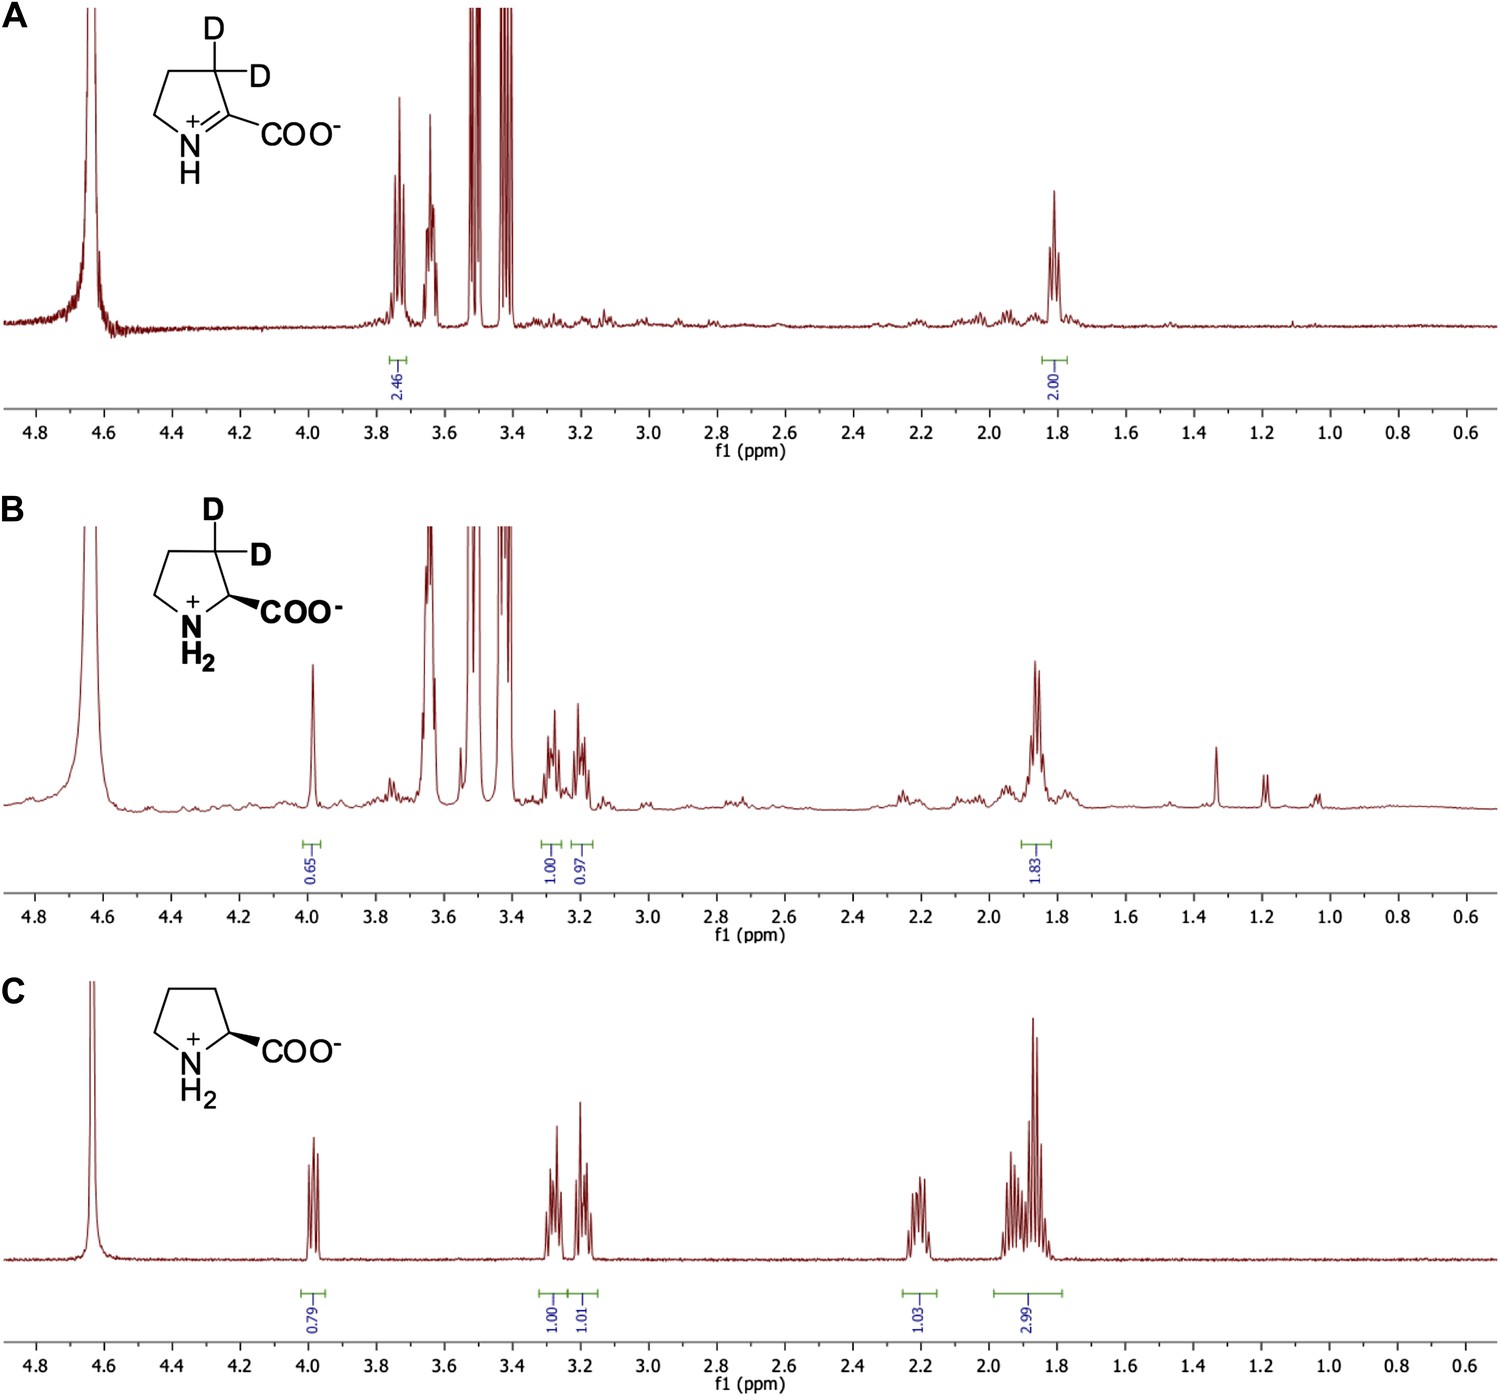
Representative 1H NMR spectra for ?1-pyrroline-2-carboxylate (?1-Pyr2C) reductase activity.
(A) 1H NMR spectrum of ?1-Pyr2C substrate in sodium phosphate, pD 8.0, in D2O. (B) 1H NMR spectrum of Q7CVK1 (locus tag: Atu4676) incubated with ?1-Pyr2C, NADPH, and the cofactor regeneration system of alcohol dehydrogenase (NADP+-dependent) and isopropanol in sodium phosphate, pD 8.0 in D2O. (C) 1H NMR spectrum of L-proline in 25 mM sodium phosphate, pD 8.0, in D2O.
Tables
Table 1
Mass spectroscopy screening results in D2O. Hits were observed by mass shift for racemization/epimerization (+1) and dehydration (-17) for reactions performed
| Locus tag | UniProt | L-Pro | D-Pro | t4Hyp | c4Hyp | t3Hyp | cis-3-OH-L-Pro |
|---|---|---|---|---|---|---|---|
| Cluster 1: blue | |||||||
| Pden_4859 | A3QFI1 | 0 | 0 | +1 | +1 | 0 | 0 |
| Shew_2363 | A9AQW9 | 0 | 0 | +1 | +1 | 0 | 0 |
| Bmul_5265 | A6WXX7 | 0 | 0 | +1 | +1 | +1 | +1 |
| Oant_1111 | D2QN44 | 0 | 0 | +1 | +1 | +1 | +1 |
| Slin_1478 | B9JHU6 | 0 | 0 | +1 | +1 | +1 | +1 |
| Arad_8151 | Q8FYS0 | 0 | 0 | +1 | +1 | 0 | 0 |
| BR1792 | A1BBM5 | 0 | 0 | + 1 | +1 | +1 | +1 |
| Cluster 2: red | |||||||
| A1S_1325 | A3M4A9 | 0 | 0 | +1 | +1 | +1 | +1 |
| Bamb_3550 | Q0B9R9 | 0 | 0 | +1 | +1 | +1 | +1 |
| BceJ2315_47180 | B4EHE6 | 0 | 0 | +1 | +1 | +1 | +1 |
| BMULJ_04062 | B3D6W2 | 0 | 0 | +1 | +1 | +1 | +1 |
| BTH_II2067 | Q2T3J4 | 0 | 0 | +1 | +1 | -17 | 0 |
| CV_2826 | Q7NU77 | 0 | 0 | +1 | +1 | +1 | +1 |
| Csal_2705 | Q1QU06 | 0 | 0 | +1 | +1 | 0 | 0 |
| PFL_1412 | A5VZY6 | 0 | 0 | +1 | +1 | +1 | +1 |
| Pput_1285 | Q1QBF3 | +1 | +1 | +1 | +1 | +1 | +1 |
| Pcryo_1219 | A3M4A9 | 0 | 0 | +1 | +1 | +1 | +1 |
| XCC2415 | Q8P833 | 0 | 0 | +1 | +1 | +1 | +1 |
| Bmul_4447 | A9AL52 | 0 | 0 | +1 | +1 | +1 | +1 |
| ABAYE2385 | B0VB44 | 0 | 0 | +1 | +1 | +1 | +1 |
| BURPS1106B_1521 | C5ZMD2 | +1 | +1 | +1 | +1 | +1 | +1 |
| BURPS1710b_A1887 | Q3JHA9 | 0 | 0 | +1 | +1 | +1 | +1 |
| PA1268 | Q9I476 | 0 | 0 | +1 | +1 | 0 | 0 |
| Cluster 3: ligthskyblue | |||||||
| Pden_1184 | A1B195 | 0 | 0 | 0 | 0 | -17 | 0 |
| SIAM614_28502 | A0NXQ9 | 0 | 0 | 0 | 0 | -17 | 0 |
| Atu4684 | A9CH01 | 0 | 0 | +1 | +1 | -17 | 0 |
| Avi_7022 | B9K4G4 | 0 | 0 | 0 | 0 | -17 | 0 |
| Oant_0439 | A6WW16 | 0 | 0 | +1 | +1 | 0 | 0 |
| SM_b20270 | Q92WR9 | 0 | 0 | +1 | +1 | -17 | 0 |
| BMEI1586 | Q8YFD6 | 0 | 0 | +1 | +1 | +1 | +1 |
| BR0337 | Q8G2I3 | 0 | 0 | 0 | 0 | -17 | 0 |
| Cluster 5: navy | |||||||
| BC_0905 | Q81HB1 | 0 | 0 | +1 | +1 | -17 | 0 |
| BCE_0994 | Q73CS0 | 0 | 0 | +1 | +1 | -17 | 0 |
| BT9727_0799 | Q6HMS9 | 0 | 0 | +1 | +1 | -17 | 0 |
| Cluster 9: orange | |||||||
| Avi_0518 | B9JQV3 | 0 | 0 | +1 | +1 | +1 | +1 |
| Atu0398 | A9CKB4 | 0 | 0 | +1 | +1 | +1 | +1 |
| RHE_CH00452 | Q2KD13 | 0 | 0 | +1 | +1 | +1 | +1 |
| Arad_0731 | B9J8G8 | 0 | 0 | +1 | +1 | +1 | +1 |
| Cluster 11: palegreen | |||||||
| Sros_6004 | D2AV87 | 0 | 0 | +1 | +1 | 0 | 0 |
| Cluster 12: olive | |||||||
| Bamb_3769 | Q0B950 | 0 | 0 | 0 | 0 | -17 | 0 |
| Bmul_4260 | A9AKG8 | 0 | 0 | +1 | +1 | +1 | +1 |
| Cluster 16: salmon | |||||||
| Csal_2339 | Q1QV19 | 0 | 0 | +1 | +1 | 0 | 0 |
| Maqu_2141 | A1U2K1 | 0 | 0 | 0 | 0 | 0 | 0 |
| Cluster 17: lime | |||||||
| Rsph17029_3164 | A3PPJ8 | 0 | 0 | +1 | +1 | 0 | 0 |
| RSP_3519 | Q3IWG2 | 0 | 0 | +1 | +1 | 0 | 0 |
| Cluster 18: cyan | |||||||
| SIAM614_28492 | A0NXQ7 | 0 | 0 | +1 | +1 | 0 | 0 |
| SADFL11_2813 | B9R4E3 | 0 | 0 | +1 | +1 | 0 | 0 |
| SPOA0266 | Q5LKW3 | 0 | 0 | +1 | +1 | +1 | +1 |
| Cluster 22: steelblue | |||||||
| Spea_1705 | A8H392 | 0 | 0 | 0 | 0 | -17 | 0 |
| Swoo_2821 | B1KJ76 | 0 | 0 | +1 | +1 | -17 | 0 |
| Cluster 61: | |||||||
| Plim_2713 | D5SQS4 | 0 | 0 | +1 | +1 | +1 | +1 |
Table 2
Kinetic constants for 3/4HypE and t3HypD activities of the screened PRS targets
| Cluster | Locus tag | UniProt | Function | kcat [s-1] | Km [mM] | kcat/KM[M-1s-1] |
|---|---|---|---|---|---|---|
| 1 | Pden_4859 | A1BBM5 | 4HypE | 16 ± 2 | 25 ± 5 | 630 |
| Shew_2363 | A3QFI1 | 4HypE | 50 ± 6 | 12 ± 3 | 4000 | |
| Bmul_5265 | A9AQW9 | 3HypE | 0.34 ± 0.03 | - a | - a | |
| 4HypE | 5.6 ± 0.5 | 11 ± 2 | 530 | |||
| Oant_1111 | A6WXX7 | 3HypE | 2.4 ± 0.2 | 31 ± 7 | 77 | |
| 4HypE | 89 ± 2 | 7.1 ± 0.6 | 13000 | |||
| 2 | BTH_II2067 | Q2T3J4 | t3HypD | 17 ± 3 | 26 ± 9 | 660 |
| 4HypE | 40 ± 4 | 1.4 ± 0.4 | 28000 | |||
| CV_2826 | Q7NU77 | 3HypE | 30 ± 0.6 | 57 ± 4 | 520 | |
| 4HypE | 70 ± 7 | 6.8 ± 3 | 10000 | |||
| Pput_1285 | A5VZY6 | 3HypE | 4.8 ± 0.6 | 19 ± 5 | 250 | |
| 4HypE | 26 ± 0.7 | 0.54 ± 0.08 | 48000 | |||
| ProR | 2.8 ± 0.1 | 200 ± 20 | 14 | |||
| XCC2415 | Q8P833 | 4HypE | 28 ± 0.4 | 0.67 ± 0.05 | 42000 | |
| 3HypE | 1.3 ± 0.07 | 15 ± 3 | 86 | |||
| 3 | Pden_1184 | A1B195 | t3HypD | nd b | nd b | nd b |
| SIAM614_28502 | A0NXQ9 | t3HypD | 15 ± 0.9 | 7.8 ± 1 | 1900 | |
| Atu4684 | A9CH01 | t3HypD | 27 ± 1 | 4.2 ± 0.8 | 6300 | |
| 4HypE | 0.40 ± 0.02 | 2.0 ± 0.3 | 200 | |||
| Avi_7022 | B9K4G4 | t3HypD | 4.3 ± 0.4 | 15 ± 3 | 280 | |
| Oant_0439 | A6WW16 | 4HypE | 0.064 ± 0.002 | 1.3 ± 0.2 | 49 | |
| SM_b20270 | Q92WR9 | t3HypD | 7.9 ± 0.2 | 3.8 ± 0.4 | 2100 | |
| 4HypE | 0.089 ± 0.01 | 6.3 ± 2 | 14 | |||
| BMEI1586 | D0B556 | 3HypE | 0.085 ± 0.003 | 2.6 ± 0.4 | 33 | |
| 4HypE | 0.082 ± 0.005 | 4.5 ± 1 | 18 | |||
| BR0337 | Q8G2I3 | t3HypD | 17 ± 2 | 5.1 ± 2 | 3300 | |
| 5 | BCE_0994 | Q73CS0 | t3HypD | nd b | nd b | nd b |
| 4HypE | 1.2 ± 0.03 | 3.2 ± 0.3 | 370 | |||
| BT9727_0799 | Q6HMS9 | t3HypD | 23 ± 5 | 7.5 ± 3 | 3100 | |
| 4HypE | 0.16 | - a | - a | |||
| 9 | Avi_0518 | B9JQV3 | 3HypE | 0.75 ± 0.04 | 4.8 ± 0.9 | 160 |
| 4HypE | 1.3 ± 0.07 | 5.6 ± 0.5 | 230 | |||
| Atu0398 | A9CKB4 | 3HypE | 4.0 ± 0.6 | 25 ± 7 | 160 | |
| 4HypE | 0.86 ± 0.1 | 4.6 ± 2 | 190 | |||
| RHE_CH00452 | Q2KD13 | 3HypE | 0.94 ± 0.06 | 2.1 ± 0.7 | 450 | |
| 4HypE | 1.9 ± 0.08 | 2.1 ± 0.3 | 880 | |||
| 11 | Sros_6004 | D2AV87 | 4HypE | 14 ± 0.8 | 7.8 ± 1 | 1800 |
| 12 | Bamb_3769 | Q0B950 | t3HypD | 43 ± 4 | 13 ± 3 | 3400 |
| Bmul_4260 | A9AKG8 | 3HypE | 30 ± 1 | 18 ± 2 | 1700 | |
| 4HypE | 1.3 ± 0.04 | 2.7 ± 0.3 | 470 | |||
| 16 | Csal_2339 | Q1QV19 | 4HypE | 0.070 ± 0.005 | 2.5 ± 0.7 | 28 |
| 17 | RSP_3519 | Q3IWG2 | 4HypE | nd b | nd b | nd b |
| Rsph17029_3164 | A3PPJ8 | 4HypE | nd b | nd b | nd b | |
| 18 | SIAM614_28492 | A0NXQ7 | 4HypE | 55 ± 3 | 3.2 ± 0.5 | 17000 |
| SADFL11_2813 | B9R4E3 | 4HypE | 67 ± 5 | 4.1 ± 0.8 | 16000 | |
| 22 | Spea_1705 | A8H392 | t3HypD | 0.15 ± 0.03 | - b | - b |
| Swoo_2821 | B1KJ76 | t3HypD | 4.1 ± 0.4 | 6.7 ± 2 | 600 |
-
a
The reaction is to slow to measure Km.
-
b
The reaction is slow to measure kinetic parameters.
Table 3
Growth phenotypes of bacterial strains when grown on the indicated carbon sources
| Organism | t4Hyp | c4Hyp | t3Hyp | cis-3-OH-L-proline | L-Pro | D-glucose |
|---|---|---|---|---|---|---|
| Agrobacterium tumefaciens C58 | ++ | ++ | + | - | +++ | +++ |
| Sinorhizobium meliloti 1021 | ++ | ++ | + | - | +++ | +++ |
| Labrenzia aggregate IAM12614 | + | + | + | + | +++ | +++ |
| Pseudomonas aeruginosa PAO1 | ++ | ++ | + | - | +++ | +++ |
| Paracoccus denitrificans PD1222 | +++ | +++ | + | + | +++ | +++ |
| Rhodobacter sphaeroides 2.4.1 | + | + | - | - | +++ | +++ |
| Rhodobacter sphaeroides 2.4.1?RSP3519 | - | + | - | - | +++ | +++ |
| Bacillus cereus ATCC14579 | ++ | ++ | + | + | +++ | +++ |
| Roseovarius nubinhibens ISM | ++ | ++ | + | - | +++ | +++ |
| Escherichia coli MG1655 | - | - | - | - | +++ | +++ |
| Streptomyces lividans TK24 | +++ | ++ | + | ND | +++ | +++ |
-
‘+++’ represents robust growth (like growth on D-glucose); ++/+ represents slow growth phenotype; ‘--’ represents growth-deficient phenotype; ‘ND’, not determined
Table 4
Transcriptional analysis of PRS members
| Organism/Locus Tag | t4Hyp | t3Hyp |
|---|---|---|
| Agrobacterium tumefaciens C58 | ||
| A9CKB4 | 12 ± 2 | 11 ± 1.5 |
| A9CFV0 | 3 ± 1 | NC |
| A9CH01 | 64 ± 5 | 32 ± 4 |
| Sinorhizobium meliloti 1021 | ||
| Q92WS1 | 5 ± 1 | 3 ± 1 |
| Q92WR9 | 5.5 ± 1.5 | 3.5 ± 1 |
| Labrenzia aggregate IAM12614 | ||
| A0NXQ7 | 22 ± 2 | 5 ± 1 |
| A0NXQ9 | 12 ± 2 | 6 ± 2 |
| Pseudomonas aeruginosa PAO1 | ||
| Q9I489 | 8 ± 2 | 5 ± 1 |
| Q9I476 | 35 ± 3 | 7 ± 2 |
| Paracoccus denitrificans PD1222 | ||
| A1B0W2 | 2.0 ± 0.5 | NC |
| A1B195 | NC | NC |
| A1B7P4 | NC | NC |
| A1BBM5 | 4.5 ± 0.5 | NC |
| Rhodobacter sphaeroides 2.4.1 | ||
| Q3IWG2 | 10 ± 1 | NC |
| Bacillus cereus ATCC14579 | ||
| Q81HB1 | 4 ± 1 | 4.5 ± 1 |
| Q81CD7 | 22 ± 2 | 18 ± 3 |
| Roseovarius nubinhibens ISM | ||
| A3SLP2 | 12 ± 2 | 4+1.5 |
-
Fold change in expression for each gene when grown on the indicated carbon source, relative to growth on D-glucose. The identities of the bacterial species and the protein encoded by each gene are indicated. Fold-changes are the averages of five biological replicates with standard deviation (p value < 0.005). NC, no change.
Table 5
Transcriptional analysis of genome neighborhoods
| Organism/Locus tag | UniProt | Enzyme | Cluster | t4Hyp | t3Hyp | L-Pro |
|---|---|---|---|---|---|---|
| Bacillus cereus ATCC 14579 | ||||||
| Bc_0905 | Q81HB1 | ProR | navy | 121 ± 11 | 87 ± 10 | NC |
| Bc_0906 | Q81HB0 | OCD | 20 ± 3 | 14 ± 2 | NC | |
| Bc_2832 | Q81CE0 | ALDH | 630 ± 39 | 625 ± 57 | 13 ± 2 | |
| Bc_2833 | Q81CD9 | DHDPS | 644 ± 61 | 498 ± 37 | 6 ± 0.7 | |
| Bc_2834 | Q81CD8 | ProR | hot pink | 594 ± 27 | 485 ± 29 | 8 ± 1 |
| Bc_2835 | Q81CD7 | ProR | teal | 408 ± 15 | 567 ± 33 | 5 ± 0.5 |
| Bc_2836 | Q81CD6 | oxidase | 623 ± 37 | 633 ± 42 | 10 ± 0.6 | |
| Streptomyces lividans TK24 | ||||||
| SSPG_01342 | D6EJL0 | DAAO | 81 ± 5 | 20 ± 5 | NC | |
| SSPG_01341 | D6EJK9 | oxidase | 65 ± 9 | 6 ± 0.2 | NC | |
| SSPG_01340 | D6EJK8 | oxidase | 225 ± 22 | 30 ± 3 | 3 ± 0.4 | |
| SSPG_01339 | D6EJK7 | DHDPS | 136 ± 5 | 16 ± 0.2 | NC | |
| SSPG_01338 | D6EJK6 | ProR | palegreen | 171 ± 8 | 23 ± 1 | 3 ± 0.2 |
| Agrobacterium tumefaciens C58 | ||||||
| Atu_0398 | A9CKB4 | ProR | orange | 14 ± 0.4 | 16 ± 0.6 | NC |
| Atu_3947 | Q7CTP1 | DAAO | NC | 4 ± 0.2 | NC | |
| Atu_3948 | Q7CTP2 | AlaR | NC | NC | NC | |
| Atu_3949 | Q7CTP3 | OCD | NC | NC | NC | |
| Atu_3950 | Q7CTP4 | ALDH | NC | NC | NC | |
| Atu_3951 | A9CFU8 | LysR | NC | NC | NC | |
| Atu_3952 | A9CFU9 | DAAO | NC | NC | NC | |
| Atu_3953 | Q7CFV0 | ProR | blue | NC | NC | NC |
| Atu_3958 | Q7CTQ2 | DAAO | NC | NC | NC | |
| Atu_3959 | Q7CTQ3 | ALDH | NC | NC | NC | |
| Atu_3960 | A9CFV4 | DHDPS | NC | NC | NC | |
| Atu_3961 | Q7CTQ5 | GntR | NC | NC | NC | |
| Atu_3985 | A9CFW8 | ProC | NC | NC | NC | |
| Atu_4675 | A9CGZ4 | DHDPS | 148 ± 2 | 87 ± 7 | NC | |
| Atu_4676 | Q7CVK1 | MLD2 | 30 ± 5 | 40 ± 7 | NC | |
| Atu_4678 | A9CGZ5 | SBP | 198 ± 18 | 79 ± 8 | NC | |
| Atu_4682 | A9CGZ9 | DAAO | 294 ± 15 | 14 ± 3 | NC | |
| Atu_4684 | A9CH01 | ProR | light sky blue | 116 ± 14 | 8 ± 1 | NC |
| Atu_4691 | A9CH04 | 2-Hacid_dh | NC | NC | NC | |
-
Fold changes in expression for the indicated gene when grown on the indicated carbon source, relative to growth on Dglucose. Fold changes are the averages of three biological replicates with standard deviation. NC, no change.
Table 6
Data Collection and Refinement Statisticsa
| UNIPROT / CLUSTER / PROTEIN | A5VZY6 / 2 / Pput_1285 | A5VZY6 / 2 / Pput_1285 | Q1QU06 / 2 / Csal_2705 | Q8P833 / 2 / XCC_2415 | B3D6W2 / 2 / BMULJ_04062 | Q4KGU2 / 2 / PFL_1412 | Q4KGU2 / 2 / PFL_1412 | A6WW16 / 3 / Oant_0439 | B9K4G4 / 3 / Avi_7022 | B9JQV3 / 9 / Avi_0518 |
|---|---|---|---|---|---|---|---|---|---|---|
| Organism | Pseudomonas putida F1 | Pseudomonas putida F1 | Chromohalobacter salexigens DSM 3043 | Xanthomonas campestris | Burkholderia multivorans | Pseudomonas fluorescens Pf-5 | Pseudomonas fluorescens Pf-5 | Ochrobacterium anthropi | Agrobacterium vitis S4 | Agrobacterium vitis S4 |
| PDBID | 4JBD | 4JD7 | 4JCI | 4JUU | 4K7X | 4J9W | 4J9X | 4K8L | 4K7G | 4LB0 |
| DIFFRACTION DATA STATISTICS | ||||||||||
| Space Group | I2 | P212121 | P212121 | P212121 | I4122 | P21 | P212121 | I222 | P43212 | P42212 |
| Unit Cell (Å , °) | a=45.2 b=54.2 c=142.7 | a=64.8 b=96.8 c=109.2 | a=48.1 b=54.4 c=253.0 | a=54.9 b=108.8 c=116.2 | a=114.9 b=114.9 c=173.7 | a=56.2 b=74.6 c=87.1 β=105.5 | a=64.8 b=96.8 c=109.2 | a=77.3 b=78.3 c=114.4 | a=54.9 b=108.8 c=116.2 | a=178.0 b=178.0 c=49.7 |
| Resolution (Å) | 1.3 (1.3-1.32) | 1.5 (1.5-1.58) | 1.7 (1.7-1.79) | 1.75 (1.75-1.84) | 1.75 (1.75-1.84) | 1.6 (.6-1.69) | 1.7 (1.7-1.79) | 1.9 (1.9-2.0) | 2.0 (2.0-2.1) | 1.7 (1.7-1.79) |
| Completeness (%) | 99.8 (99.6) | 99.5 (98.9) | 97.0 (94.0) | 99.7 (99.4) | 100.0 (100.0) | 99.3 (99.5) | 99.5 (99.0) | 99.8 (100.0) | 100 (100) | 99.9 (99.9) |
| Redundancy | 3.6 (3.5) | 7.3 (7.1) | 9.3 (7.8) | 7.3 (7.1) | 14.3 (13.5) | 3.6 (3.5) | 6.7 (6.0) | 7.2 (7.3) | 14.1 (13.2) | 10.4 (7.9) |
| Mean(I)/sd(I) | 7.9 (1.4) | 18.0 (1.1) | 17.5 (3.3) | 18.0 (1.1) | 14.1 (1.1) | 6.9 (1.7) | 11.6 (1.5) | 6.0 (1.3) | 11.6 (3.3) | 18.3 (2.7) |
| Rsym | 0.062 (0.735) | 0.067 (0.707) | 0.073 (0.644) | 0.074 (0.725) | 0.130 (0.699) | 0.093 (0.434) | 0.088 (0.531) | 0.09 (0.594) | 0.17 (0.836) | 0.078 (0.745) |
| REFINEMENT STATISTICS | ||||||||||
| Resolution (Å) | 1.3 (1.3-1.31) | 1.5 (1.5-1.52) | 1.7 (1.7-1.72) | 1.75 (1.75-1.77) | 1.75 (1.75-1.78) | 1.6 (1.6-1.62) | 1.7 (1.7-1.72) | 1.9 (1.9-1.97) | 2.0 (2.0-2.02) | 1.7 (1.72-1.70) |
| Unique reflections | 82749 | 109888 | 72128 | 70700 | 58574 | 90740 | 77405 | 27674 | 86628 | 87548 |
| Rcryst (%) | 15.8 (30.4) | 15.9 (22.6) | 17.1 (23.7) | 15.2 (21.5) | 13.8 (19.7) | 19.7 (28.8) | 19.4 (23.5) | 16.8 (17.6) | 13.6 (19.5) | 15.8 (22.9) |
| Rfree (%, 5% of data) | 18.4 (31.1) | 17.5 (25.4) | 20.5 (26.2) | 18.4 (26.4) | 15.6 (18.5) | 23.2 (33.8) | 22.5 (27.5) | 20.7 (21.7) | 16.6 (22.9) | 19.2 (27.3) |
| Residues In Model [Expected] | A1-A308 [1-308] | A(-5)-A308, D(-3)-D308 [1-308] | A(-3)-A169, A171-A309 [1-311] | A(-2)-A312, B(-2)-B312 [1-312] | A(-3)-A310 [1-311] | A1-A310, B1-B310 [1-310] | A1-310, B1-310 [1-310] | A0-A157, A161-A184, A193-A245, A255-280, A289-A332 [1-343] | B5-B342, D(-9)-D342 [1-342] | A1-A323, A326-A344, B0-B346 [1-347] |
| Residues / Waters / Atoms total | 308 / 453 / 3142 | 626 / 752 / 6225 | 620 / 494 / 5780 | 626 / 596 / 5841 | 314 / 463 / 3223 | 620 / 537 / 5301 | 620 / 630 / 5378 | 305 / 191 / 2824 | 690 / 780 / 6761 | 689 / 701 / 6633 |
| Bfactor Protein/Waters/Ligand | 17.3 / 31.2 / 21.7 | 19.3 / 30.5 / 27.9 | 24.8 / 33.6 / - | 23.9 / 35.2 / 37.3 | 15.6 / 34.0 / 30.6 | 21.1 / 32.2 / 12.9 | 22.9 / 34.0 / 16.3 | 31.3 / 37.7 / - | 24.1 / 37.5 / 15.2 | 25.1 / 36.2 / 17.9 |
| Ligand | Citrate | Sulfate | - | Phosphate / UNL | Phosphate | (PYC) Pyrrole 2-carboxylate | (t4Hyp) Trans- 4OH-L-Proline | - | (PYC) Pyrrole 2-carboxylate | (t4Hyp) Trans- 4OH-L-Proline / Acetate |
| RMSD Bond Lengths (Å) / Angles (°) | 0.008 / 1.283 | 0.009 / 1.325 | 0.011 / 1.332 | 0.010 / 1.26 | 0.009 / 1.268 | 0.006 / 1.079 | 0.006 / 1.093 | 0.011 / 1.349 | 0.011 / 1.311 | 0.010 / 1.320 |
| Ramachandran Favored / Outliers (%) | 98.7 / 0.0 | 96.8 / 0.00 | 98.2 / 0.00 | 99.0 / 0.0 | 97.7 / 0.0 | 98.7 / 0.0 | 98.5 / 0.0 | 98.3 / 0.0 | 98.0 / 0.3 | 98.4 / 0.3 |
| Clashscore b | 2.32 (99th pctl) | 3.02 (98th pctl) | 3.74 (97th pctl) | 4.14 (97th pctl) | 3.12 (97th pctl) | 1.59 (99th pctl) | 1.82 (99th pctl) | 6.6 (93rd pctl) | 2.8 (99th pctl) | 2.2 (99th pctl) |
| Overall scoreb | 1.01 (99th pctl) | 1.29 (95th pctl) | 1.16 (99th pctl) | 1.22 (99th pctl) | 1.16 (99th pctl) | 0.97 (100th pctl) | 0.94 (100th pctl) | 1.36 (98th pctl) | 1.08 (100th pctl) | 1.0 (100th pctl) |
-
a
Data in parenthesis is for the highest resolution bin
-
b
Scores are ranked according to structures of similar resolution as formulated in MOLPROBITY
Table 7
Kinetic constants for the proline ketimine reductases (members of the malate/Llactate dehydrogenase 2 [MLD2] and ornithine cyclodeaminase [OCD] superfamilies) that are in the genome neighborhoods of members of the PRS
| Cluster | UniProt | Locus tag | Cofactor | kcat [s-1] | Km [mM] | kcat/KM[M-1s-1] |
|---|---|---|---|---|---|---|
| MLD2_PRS_light skyblue (3) | Q7CVK1 | Atu4676 | NADPH | 32 ± 1 | 0.33 ± 0.04 | 99000 |
| Q9I492 | PA1252 | NADPH | 1.6 ± 0.05 | 0.41 ± 0.06 | 3900 | |
| MLD2_PRS_Red (2) | Q4KGT8 | PFL_1416 | NADPH | 20 ± 0.8 | 1.1 ± 0.2 | 18000 |
| Q0B9S2 | Bamb_3547 | NADPH | 54 ± 13 | 9.4 ± 4 | 5700 | |
| A9ALD3 | Bmul_4451 | NADPH | 33 ± 2 | 7.4 ± 1 | 4400 | |
| MLD2_PRS_indigo (13) | Q4KAT3 | PFL_3547a | NADPH | - | - | 2300b |
| OCD_PRS_light skyblue (3) | A1B196 | Pden_1185 | NADPH | 260 ± 20 | 3.1 ± 0.7 | 85000 |
| NADH | 81 ± 20 | 16 ± 6 | 5100 | |||
| A3S939 | EE36_06353a | NADPH | 6.8 ± 0.7 | 1.0 ± 0.3 | 6700 | |
| A3SU01 | NAS141_11281a | NADPH | 39 ± 4 | 1.2 ± 0.4 | 32000 | |
| NADH | 8.2 ± 4 | 73 ± 50 | 110 | |||
| Q16D96 | RD1_0323a | NADPH | 15 ± 1 | 0.27 ± 0.07 | 56000 | |
| NADH | 3.7 ± 0.4 | 11 ± 3 | 320 | |||
| Q5LLV0 | SPO3821a | NADPH | 130 ± 20 | 3.0 ± 0.9 | 43000 | |
| NADH | - | - | 840b | |||
| Q3IZJ8 | RSP_0854a | NADPH | 66 ± 4 | 0.43 ± 0.09 | 150000 | |
| NADH | 12c | - | - | |||
| OCD_PRS_navy (5) | Q81HB0 | BC_0906 | NADPH | 15 ± 1 | 0.47 ± 0.1 | 31000 |
| NADH | 19 ± 1 | 11 ± 2 | 1800 | |||
| Q73CR9 | BCE_0995 | NADPH | 15 ± 1 | 1.1 ± 0.3 | 13000 | |
| NADH | 2.1 ± 0.3 | 7.6 ± 3 | 270 | |||
| Q6HMS8 | BT9727_0800 | NADPH | 11 ± 1 | 3.4 ± 0.9 | 3100 | |
| NADH | 2.1 ± 0.4 | 18 ± 6 | 120 | |||
| Q63FA5 | BCE33L0803 | NADPH | 5.8c | - | - | |
| NADH | 0.87 ± 0.1 | 4.9 ± 2 | 180 | |||
| OCD_PRS_olive (12) | Q0B953 | Bamb_3766 | NADPH | 106 ± 4 | 1.6 ± 0.2 | 64000 |
| NADH | 41 ± 6 | 7.3 ± 3 | 5700 | |||
| Q2T596 | BTH_II1457a | NADPH | 73 ± 2 | 0.39 ± 0.05 | 190000 | |
| NADH | 203 ± 23 | 32 ± 7 | 6400 | |||
| Q3JFG0 | BURPS1710b_A2543a | NADPH | 7.8 ± 0.5 | 0.64 ± 0.1 | 12000 | |
| NADH | 6.0 ± 1 | 31 ± 13 | 190 | |||
| A9AKH1 | Bmul_4263 | NADPH | 25 ± 6 | 4 ± 2 | 6400 | |
| OCD_PRS_blue (1) | Q485R8 | CPS_1455 | NADPH | 35 ± 0.8 | 1.8 ± 0.2 | 20000 |
| NADH | - | - | 170b | |||
| A3QH73 | Shew_2955a | NADPH | 6.7 ± 0.7 | 1.6 ± 0.6 | 4300 | |
| NADH | 0.37 ± 0.1 | 26 ± 10 | 14 |
-
a
Highly homologous to MLD2 or OCD which are in the gene context of proline racemase.
-
b
The enzyme didn’t saturate.
-
c
KM is too small (< 0.03mM).
Table 8
Strains used in this study
| Organism |
|---|
| Agrobacterium tumefaciens C58 |
| Sinorhizobium meliloti 1021 |
| Labrenzia aggregata IAM12614 |
| Pseudomonas aeruginosa PAO1 |
| Paracoccus denitrificans PD1222 |
| Rhodobacter sphaeroides 2.4.1 |
| Rhodobacter sphaeroides 2.4.1?RSP3519 |
| Bacillus cereus ATCC14579 |
| Roseovarius nubinhibens ISM |
| Escherichia coli MG1655 |
| Streptomyces lividans TK24 |
Table 9
Oligonucleotide primers used for construction of the RS3519 knock-out in Rhodobacter sphaeroides 2.4.1
| Oligo | Sequence (5'–3') |
|---|---|
| RS3519F.KO | CATATGATGCGCGTTCAGGACGTGTATAACG |
| RS3519R.KO | GCTGAGCTCAGAGGACGAGGAAGCCCGCGTCC |
Table 10
qRT-PCR primers for transcriptional analysis of individual proline racemase superfamily members
| Oligo | Sequence (5'–3') |
|---|---|
| Atu16s-F | GACACGGCCCAAACTCCTAC |
| Atu16s-R | GGGCTTCTTCTCCGACTACC |
| Atu0398-F | TCACCATTGAGAAGGCCAAT |
| Atu0398-R | GGTTGACGAGGTCCTTCAGA |
| Atu3953-F | CAGCTTCAGTGGCATCAGG |
| Atu3953-R | GTGTTGTGCCCAATGATCC |
| Atu4684-F | GAAGAGGCGCATGAGATTG |
| Atu4684-R | CGAAACCCAAAGCCTTGTT |
| Bc16s-F | CTCGTGTCGTGAGATGTTGG |
| Bc16s-R | TGTGTAGCCCAGGTCATAAGG |
| Bc0905-F | CTTCGCTGACGGACAAGTAGA |
| Bc0905-R | TGTACCGCTGTTACGGACAA |
| Bc2835-F | AACAGACCCGTGTCATCCTG |
| Bc2835-R | ACTAAGCCAGCCGGTGTATCT |
| La16s-F | TGGTGGGGTAAAGGCCTAC |
| La16s-R | TGGCTGATCATCCTCTCAGAC |
| La28492-F | TGTTGAAGACGAGGCCAAG |
| La28492-R | AAAAGCCGAGCTGTTCGTT |
| La28502-F | CGCGTAATCGACAGCCATA |
| La28502-R | GGCACAGAAATCGAGATGCT |
| Rs16s-F | ACACTGGGACTGAGACACGG |
| Rs16s-R | TACACTCGGAATTCCACTCA |
| Rs3519-F | AGGACATCGCCTTCGAACT |
| Rs3519-R | CGATGATGCCGAAATAGTTG |
| Pa16s-F | TCACACTGGAACTGAGACACG |
| Pa16s-R | ATCAGGCTTTCGCCCATT |
| Pa1255-F | CCACCCTCTGGGAACAGTC |
| Pa1255-R | TCGTTGAGGACGAAGTTGC |
| Pa1268-F | AACAGTGGCTACCTCGGCA |
| Pa1268-R | TCGCCGACCGGTGTCTCGAT |
| Rn16s-F | ATCTGTGTGGGCGCGATT |
| Rn16s-R | GTGAGCGCATTGGTGGTCT |
| Rn08250-F | TATGGCGGCGACAGTTTC |
| Rn08250-R | GACGGCTCGAGCGTAAAC |
| Pd16s-F | GACTGAGACACGGCCCAGA |
| Pd16s-R | TCACCTCTACACTCGGAAT |
| Pd1045-F | TCGGACTACTATGTGCCGATG |
| Pd1045-R | CCTGATCGAGGCCAAAGAC |
| Pd1184-F | GCAATTTCGTGTTGAACGAG |
| Pd1184-R | CATGATGATCCAGCCCATCT |
| Pd3467-F | CTTCGCAGCCCTGTTCAT |
| Pd3467-R | GACCAGCCCTTCCTCGAT |
| Pd4859-F | GGCAAGGTGGACATCGAATA |
| Pd4859-R | CCTCGGGGTAAAGGAAGC |
| Sm16s-F | CGTGGGGAGCAAACAGGATT |
| Sm16s-R | CTAAGGGCGAGGGTTGCGCTC |
| Sm20268-F | CTGGCAAGGTGGACATCAC |
| Sm20268-R | GTAAGGCGCACTTCCTCAA |
| Sm20270-F | CGCCATGTCAATCTCCTGGT |
| Sm20270-R | GGCAGCATCCACGATCACGA |
Table 11
qRT-PCR primers for transcriptional analysis of genome neighborhoods
| Primer | Sequence (5'–3') |
|---|---|
| Sliv-Sco16srRNA-F | CCGTACAATGAGCTGCGATA |
| Sliv-Sco16srRNA-R | GAACTGAGACCGGCTTTTTG |
| Sliv-Sco6289-F | GACCCTGAAGGTCGTCGTC |
| Sliv-Sco6289-R | GGTGACCGTGACGTCCAT |
| Sliv-Sco6290-F | GTCTTCTGCGGCATCGG |
| Sliv-Sco6290-R | AGTCATCGTCGTCCTCCA |
| Sliv-Sco6291-F | GCCGACCTCGACGAAGA |
| Sliv-Sco6291-R | TTGTCGGTTTCACTGCTGTC |
| Sliv-Sco6292-F | CATCGACACCAAGGTGGAC |
| Sliv-Sco6292-R | TGACCCCGACGATGTACC |
| Sliv-Sco6293-F | GACTACGGCGTGCTCTTCAT |
| Sliv-Sco6293-R | CTCGGTGACCTCGACCAT |
| Bc0905-F | CTTCGCTGACGGACAAGTAGA |
| Bc0905-R | TGTACCGCTGTTACGGACAA |
| Bc0906-F | ACTACGAACGCAACCACACC |
| Bc0906-R | CGGAACTTGAAGGTCTCCTGT |
| Bc2832-F | TACCAGGCTTTGGTCCTGAA |
| Bc2832-R | ATTTGCCGCCAAGCTCTAAC |
| Bc2833-F | GGATGGGTTTCAGTAGCAGGA |
| Bc2833-R | CCTAGTCTTGGATAGCGAGAAGG |
| Bc2834-F | AGGTGCGTATTCGCCAGAAA |
| Bc2834-R | CCTGGCGAACGTACGATAAA |
| Bc2835-F | AACAGACCCGTGTCATCCTG |
| Bc2835-R | ACTAAGCCAGCCGGTGTATCT |
| Bc2836-F | CCTTGCATTCTCGCTTCTGT |
| Bc2836-R | AATCTTAGGAGCCCACACACC |
| Atu3947-F | TCCGGCCAAGTATGTGAAAG |
| Atu3947-R | CTATAGCCGTTCGCAGCAAG |
| Atu3948-F | ATTTCGCCCGTGATCTGTC |
| Atu3948-R | CGGCATCCACAATAATCCAG |
| Atu3949-F | GCGAACAGGCTGAAGAGATG |
| Atu3949-R | CGGCGGTAATTCCTGTTTG |
| Atu3950-F | GCTGCCGAACATATCAAGGT |
| Atu3950-R | GACCTTCGCGGTTATCTGGT |
| Atu3951-F | TGACGGACTCCAGCCTTATC |
| Atu3951-R | ATGTAACATCGGCGTGGTCT |
| Atu3952-F | GATATCGTCAAGGGCGGTTT |
| Atu3952-R | ACGCAGAGCCTTCATGTGTT |
| Atu3953-F | CAACGTCGCCAGTTACCTTC |
| Atu3953-R | GGCTGAGATCAACGACATCC |
| Atu3958-F | GGCGGCTGATACACATCTTC |
| Atu3958-R | AAAGTTGGTGCTTCGTCAGG |
| Atu3959-F | CATTCCTGACACGATCCACA |
| Atu3959-R | CAGCATCAGCAAAGGGAAGT |
| Atu3960-F | GAATGTCGTCGCCATCAAG |
| Atu3960-R | TCGTAGAGTGCCACATGCTC |
| Atu3961-F | TTCGGCACTTCTTTCTGGTC |
| Atu3961-R | GCTCGCCTGCAGATAAACA |
| Atu4675-F | TTCCTGTTATCGTCGGCACT |
| Atu4675-R | GCCTTGAAGTGAGCCTTCTG |
| Atu4676-F | ACGGCTATCGTGAAGGTCAA |
| Atu4676-R | GAATAGCTCGGGCACATCAC |
| Atu4682-F | TCCTCAGAAAGACCGACACC |
| Atu4682-R | GTGAATGTGCCGCAGGTAA |
| Atu4684-F | CCTCGGCAAACTCAAGGTC |
| Atu4684-R | GCGAAGAGGCAGAAGGAAA |
| Atu4691-F | AAGGGCGATATGGGTCTTTC |
| Atu4691-R | GAGCTCTTCGATGCTGTCGT |
Download links
A two-part list of links to download the article, or parts of the article, in various formats.
Downloads (link to download the article as PDF)
Open citations (links to open the citations from this article in various online reference manager services)
Cite this article (links to download the citations from this article in formats compatible with various reference manager tools)
Prediction and characterization of enzymatic activities guided by sequence similarity and genome neighborhood networks
eLife 3:e03275.
https://doi.org/10.7554/eLife.03275


