Post-transcriptional regulation of satellite cell quiescence by TTP-mediated mRNA decay
- University of Colorado Boulder, United States
- Swedish Medical Center, United States
- California Polytechnic State University, United States
- National Institute of Environmental Health Sciences, United States
- University of California, San Diego, United States
Figures
Figure 1 with 1 supplement
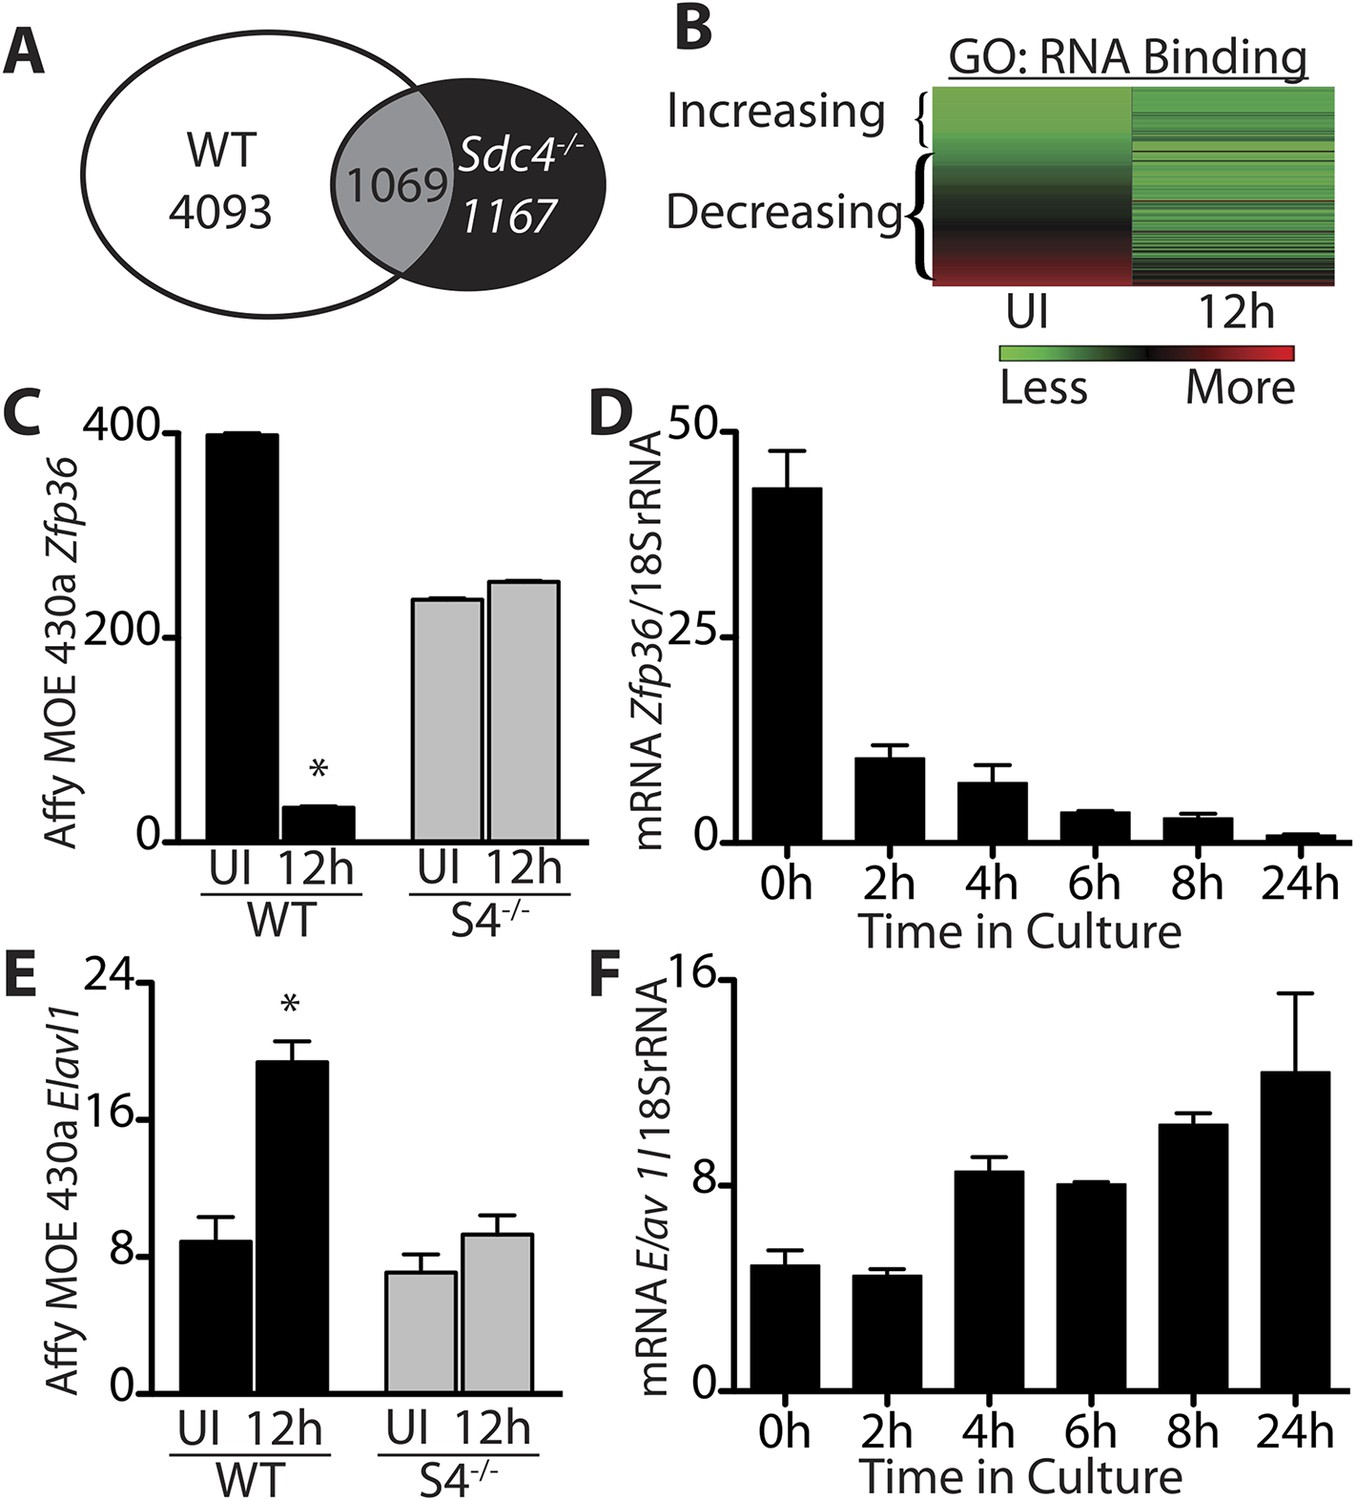
Transcripts encoding RNA binding proteins are differentially regulated during SC activation.
(A) Venn diagram illustrating subtraction strategy used to obtain the WT-S4 gene list. A total of 5162 and 2236 unique genes changed when comparing satellite cells (SCs) isolated from uninjured muscle and muscle 12 hr post-injury in wild type and Syndecan-4 (Sdc4) null SCs, respectively. Genes common to both (1069) were subtracted from the wild type gene list yielding 4093 unique genes that changed after injury in wild type but not in Sdc4−/− SCs. (B) Heat map depicting transcripts filtered from the WT-S4 gene list annotated with the Molecular Function Gene Ontology (GO) term: RNA binding. Transcripts annotated as RNA binding were highly enriched in the WT-S4 gene list (p-value = 8.7e-05) and 70% decreased in wild type SCs but did not change in Sdc4−/− SCs 12 hr post injury. Total RNA binding genes: 152; decreased: 107 (70%). (C) The relative expression of Zfp36 decreased in wild type SCs but not in Sdc4−/− SCs during the first 12 hr post-injury. (D) Zfp36 transcripts decline rapidly following culture of freshly isolated SCs. (E) The relative expression of Elavl1 increased in wild type SCs but did not change in Sdc4−/− SCs during the first 12 hr post-injury. (F) Freshly isolated SCs increase Elavl1 expression upon culture. (C and E values from SCs isolated by FACS and analyzed on Affymetrix MOE430A gene chips; D and F determined by QT-PCR where one representative of two experiments is shown, n = 5 mice; * p-value < 0.01). See also Supplemental file 1A,1B.
Figure 1—figure supplement 1
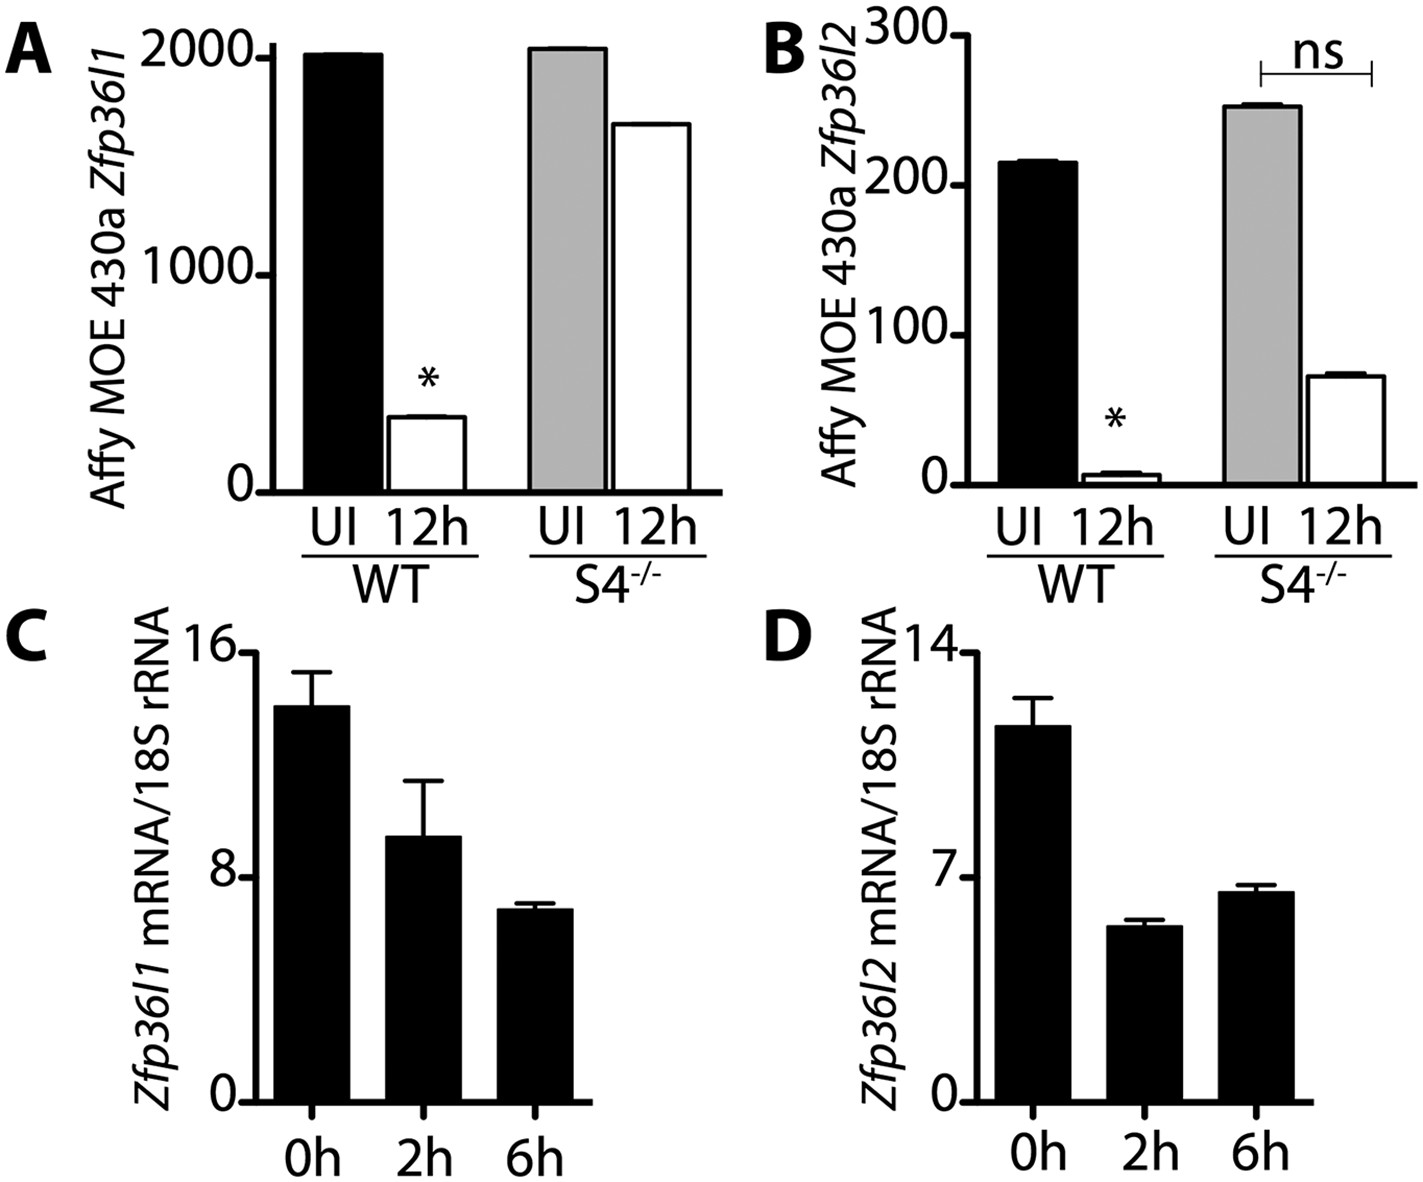
Transcripts encoding the RNA binding proteins Brf1 and Brf2 decrease during satellite cell activation.
(A) and (B) Abundance of Zfp36l1 and Zfp36l2 transcripts, which encode Brf1 and Brf2, respectively, decreased in wild type satellite cells but did not change in Sdc4−/− satellite cells. The level of gene expression as determined by microarray analysis of wild type (WT) and Sdc4−/− satellite cells isolated from uninjured muscle (UI) and muscle 12 hr post-injury (12 hr). (C) and (D) Brf1 and Brf2 mRNA decreased as satellite cells activated in culture as determined by QT-PCR analysis (means from one representative experiment out of two, each experiment contained five mice; Graphs plotted ± standard deviation. *p-value < 0.01).
Figure 2 with 2 supplements
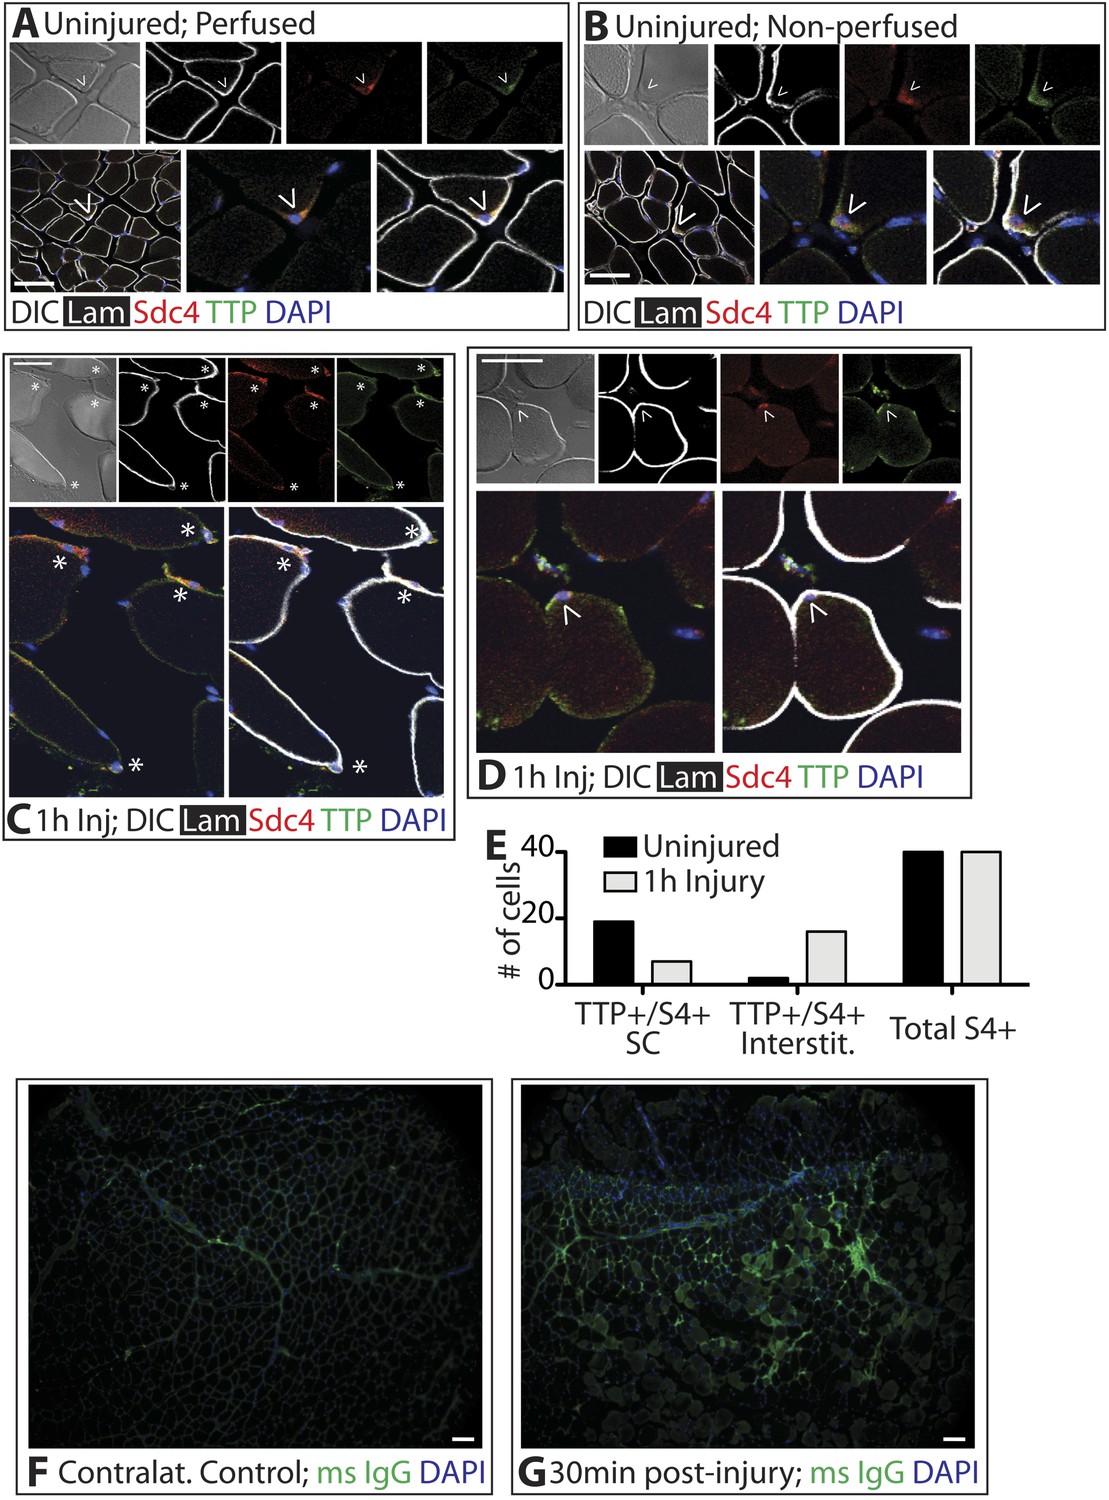
TTP positive SCs decrease 1 hr following muscle injury.
(A) Uninjured perfused TA muscle sections or (B) rapidly dissected uninjured muscle sections were stained for Sdc4 (red) and laminin (white) to identify SCs (carets) and for-TTP (green). (C) and (D) TA muscle sections 1 hr following BaCl2 induced injury were stained as in A and B. (For A–D, F–G, DAPI is blue; * denotes extralaminar Sdc4+/TTP+ cells). (E) The number of Sdc4+ and Sdc4+/TTP+ cells in uninjured TA muscle sections or TA muscle sections 1 hr following BaCl2 induced injury were plotted for two independent experiments. (F, G) TA muscle sections stained for mouse IgG (green) to assess necrotic fibers in (F) uninjured muscle or in (G) muscle 30 min following a BaCl2 induced injury. Scale bars = 50 µm (A–D), 100 µm (F, G).
Figure 2—figure supplement 1
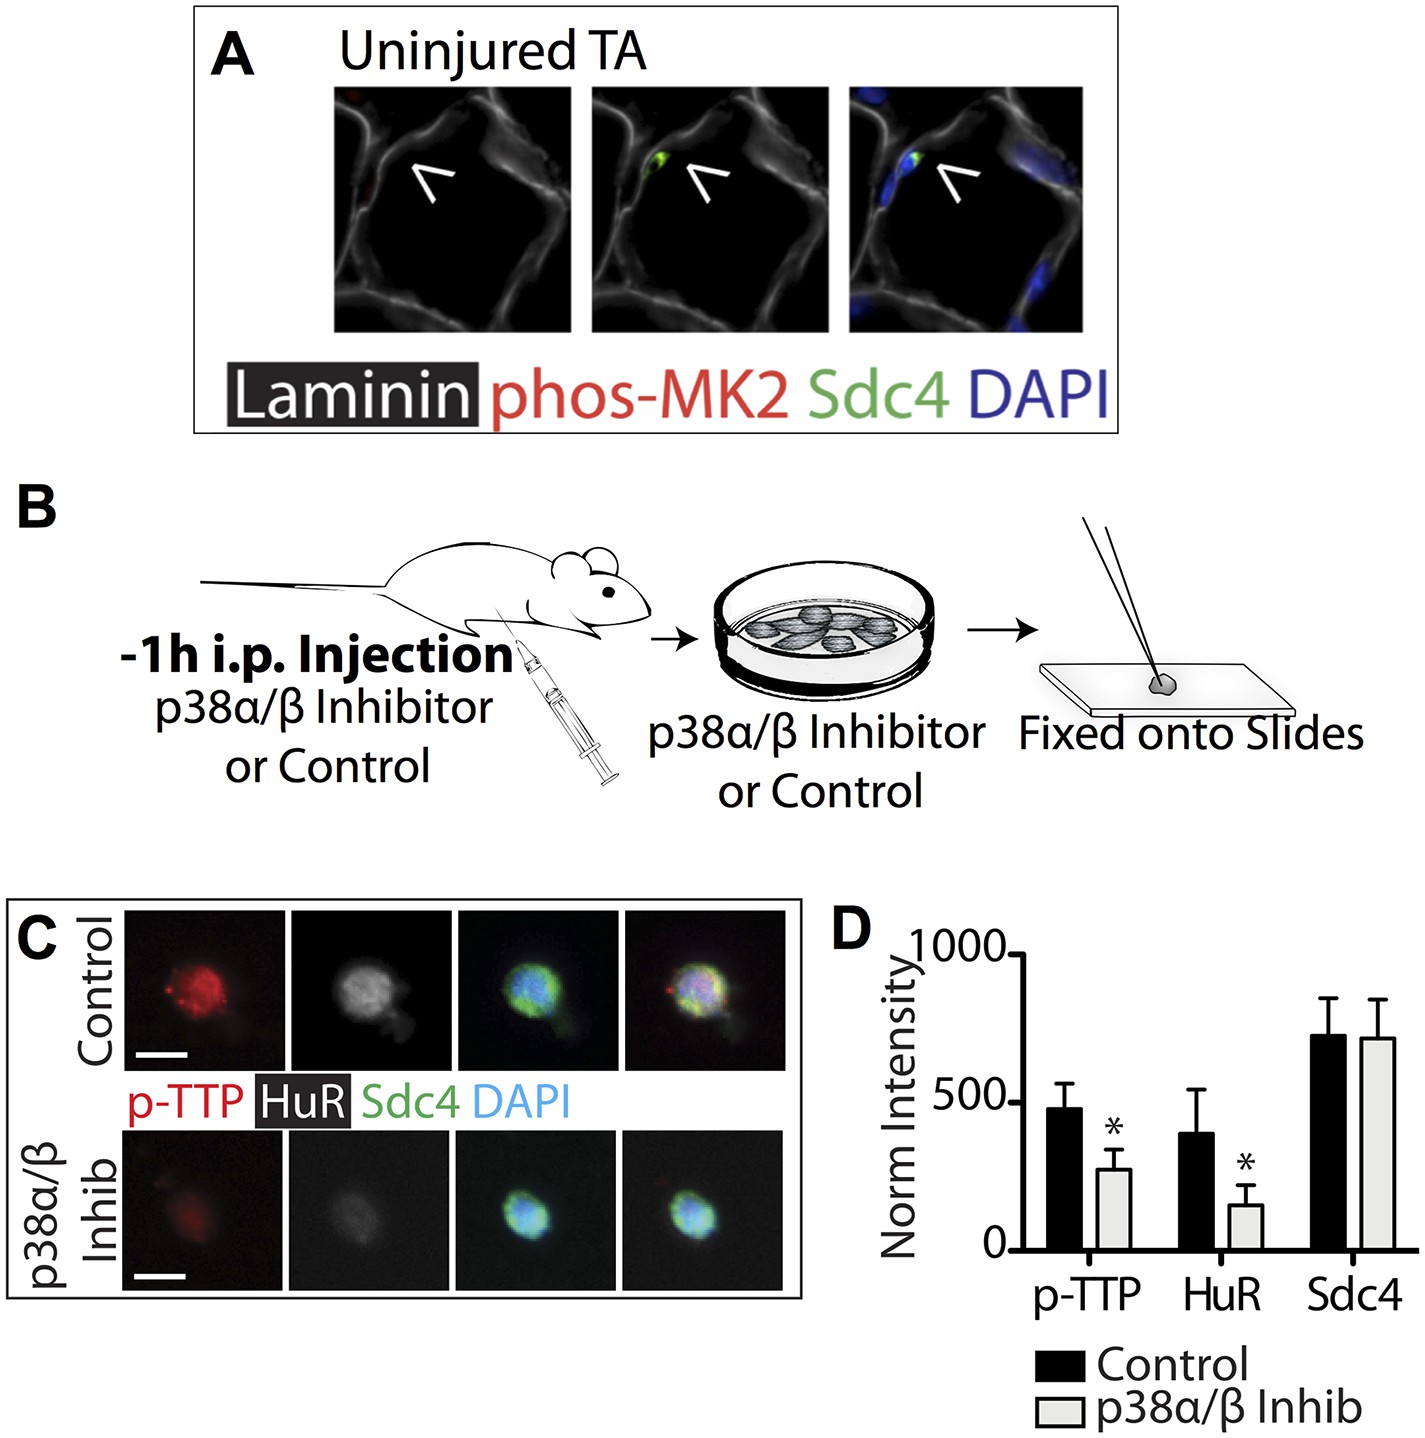
p38α/β MAPK inhibition prevents TTP phosphorylation and reduces HuR protein levels.
(A) Uninjured TA muscle sections harvested and stained as described in Figure 3. Intraperitoneal injection of mice with the p38α/β MAPK inhibitor SB203580 and inclusion of SB203580 during SC isolation reduces TTP phosphorylation and HuR induction. (B) Experimental schematic. (C) SCs isolated from treated and untreated mice stained for phospho-TTP (p-TTP, red), HuR (white), and Sdc4 (green). (D) The normalized intensity averaged and plotted for phospho-TTP, HuR and Sdc4 in isolated SCs (Student's two-tailed t-test: phospho-TTP and HuR; p < 0.001. n = 4 independent experiments).
Figure 2—figure supplement 2
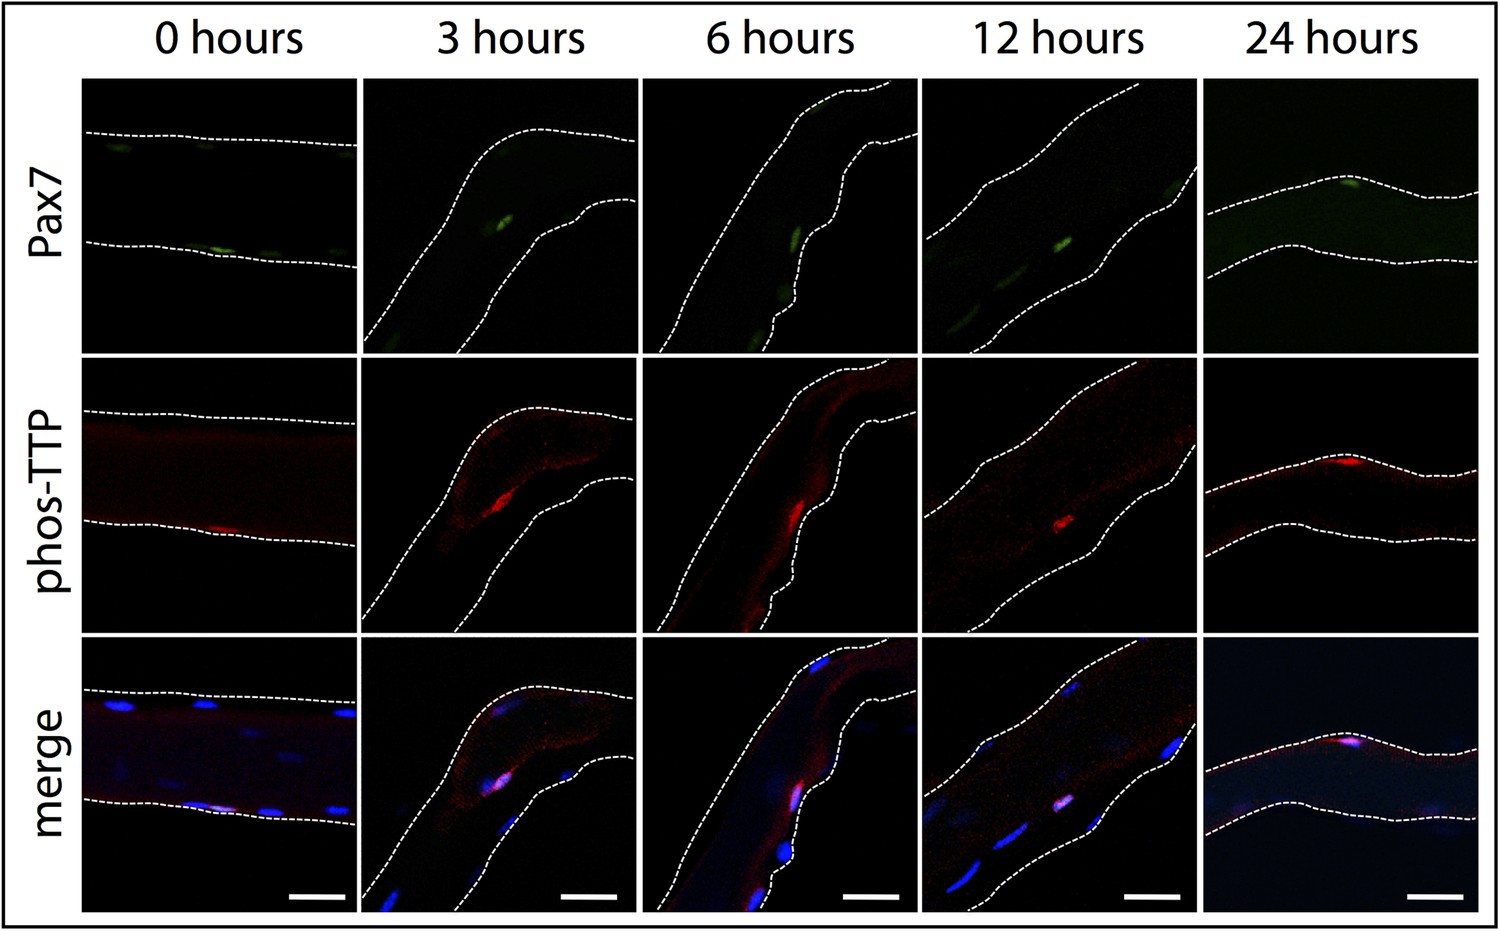
phospho-TTP expression in myofiber-associated satellite cells.
Myofiber-associated SCs isolated from wildtype mice were fixed for immunofluorescence at 0, 3, 6, 12, and 24 hr post isolation. The 0 hr timepoint corresponds to ∼1 hr 50 min post-hindlimb dissection. Myofiber-associated SCs were subsequently stained for Pax7 to mark SCs (green), phospho-TTP (red), and DAPI (blue) to mark nuclei. The white dotted lines highlight the myofiber. Scale bars = 20 µm.
Figure 3 with 1 supplement
TTP is phosphorylated by p38α/β MAPK and regulates MyoD expression in primary SCs.
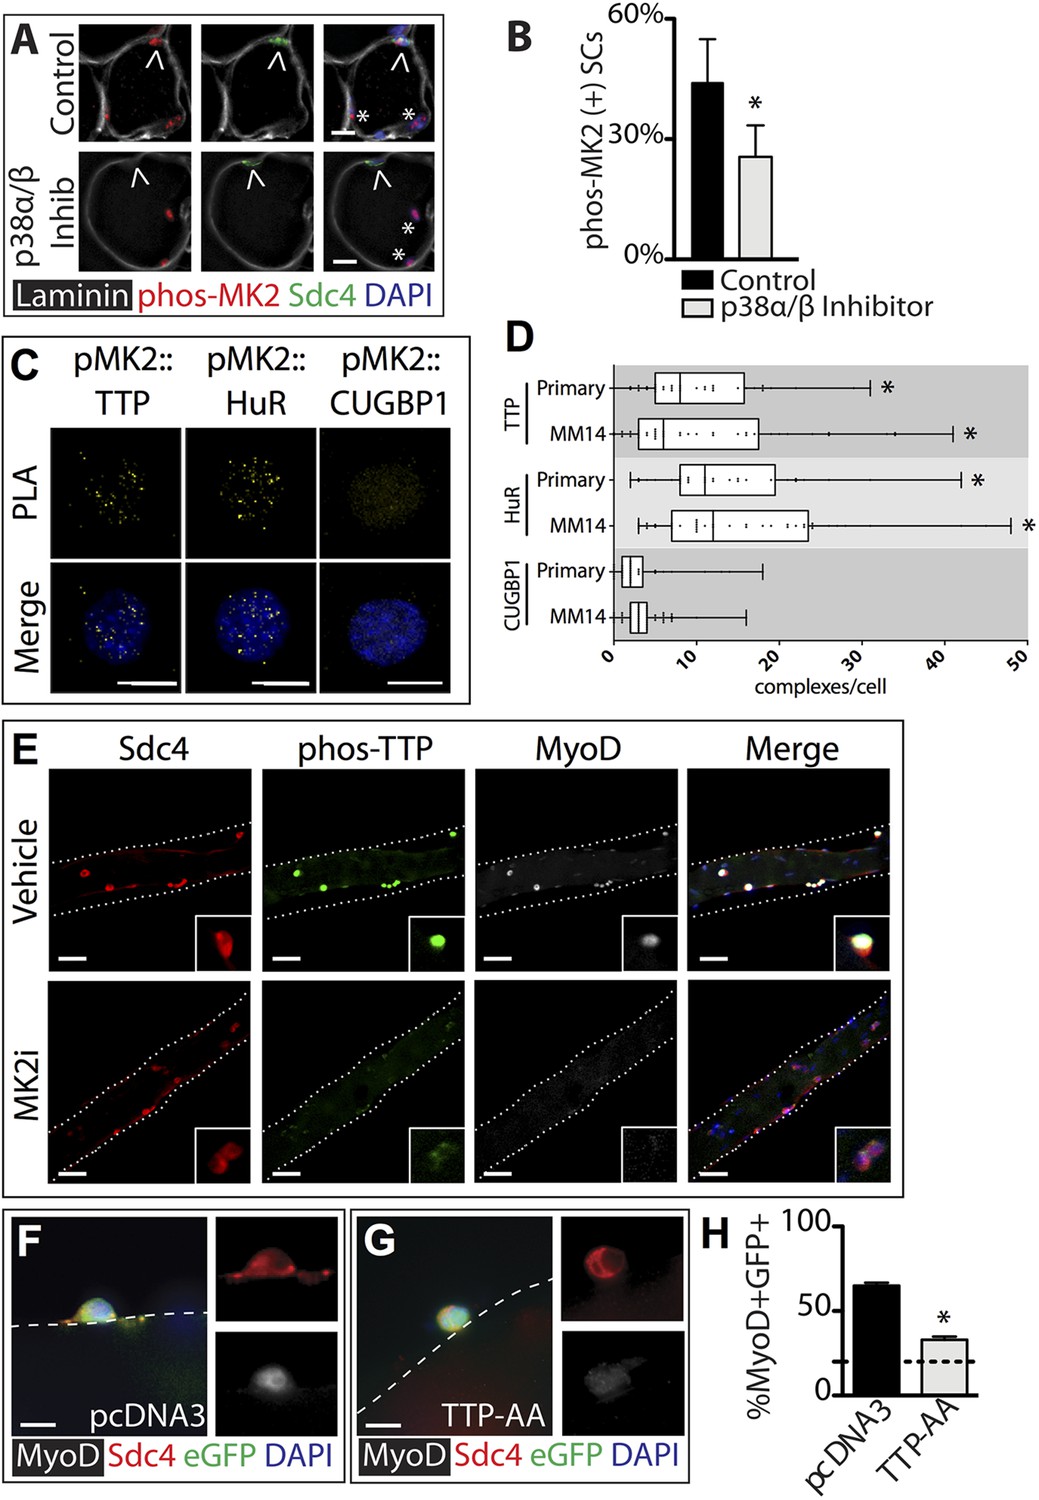
(A) TA muscle sections harvested 30 min following BaCl2 injury from either vehicle injected or SB203580 injected mice were stained with anti-Sdc4 antibodies (green) and anti-Laminin antibodies (white) to identify SCs (carets) and anti-phospho-MK2 antibodies (red; * denotes myonuclei positive for p-MK2). (B) Percentage of phospho-MK2 positive SCs was decreased in the presence of SB203580 following injury. (± SEM * p-value < 0.01 for n = 3). (C) PLA in primary, 24 hr cultured SCs using an anti-phospho-MK2 antibody and either an anti-TTP antibody (left column), an anti-HuR antibody (middle column), or an anti-CUGBP1 antibody (right column). (D) Box-and-whisker plots depicting cumulative PLA results from three independent experiments in primary SCs and in the MM14 myoblast cell line (* p-value < 0.01 compared to CUGBP1). (E) Myofiber-associated SCs were cultured in the presence of 10 μM MK2 inhibitor III (MK2i) or a vehicle control (DMSO) for 24 hr, fixed and stained for Sdc4 to mark SCs (red), phospho-TTP (green), and MyoD (white). (F–H) Myofiber-associated SCs transfected 6 hr post isolation with an eGFP plasmid as a transfection marker and either a control plasmid or a plasmid expressing TTP-AA-myc. Explanted SCs were cultured for an additional 24 hr, fixed and stained for Sdc4 (red), eGFP (green), and MyoD (white). (H) The percentage of transfected SCs scored for MyoD plotted for three independent experiments from a minimum 25 myofibers per condition. Scale bars = 10 µm (A), 4 µm (C), 30 µm (E), and 10 µm (F, G).
Figure 3—figure supplement 1
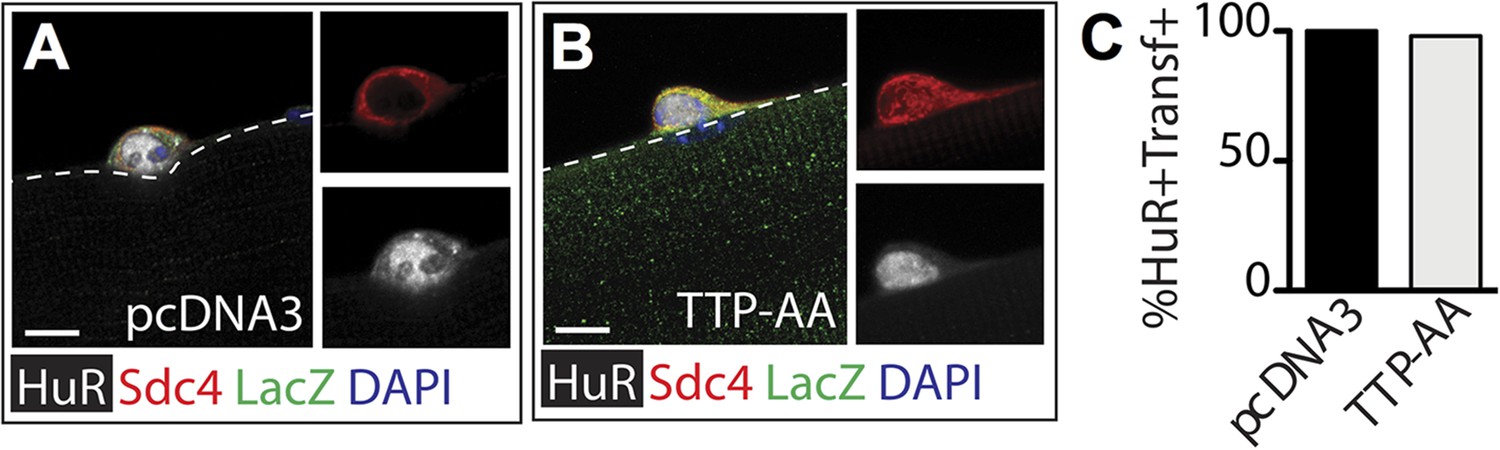
TTP over-expression does not affect HuR protein levels.
Myofiber-associated SCs transfected 6 hr post isolation with a plasmid expressing ß-galactosidase as a transfection marker and either a control plasmid (A) or a plasmid expressing TTP-AA-myc (B) were cultured for an additional 24 hr, fixed and stained for Sdc4 (red), ß-galactosidase (green), and HuR (white). (C) The percentage of transfected SCs scored for HuR plotted for two independent experiments from a minimum of 25 myofibers per condition. Scale bar = 5 µm.
Figure 4 with 1 supplement
TTP binds and regulates the 3′ UTR of MyoD mRNA.
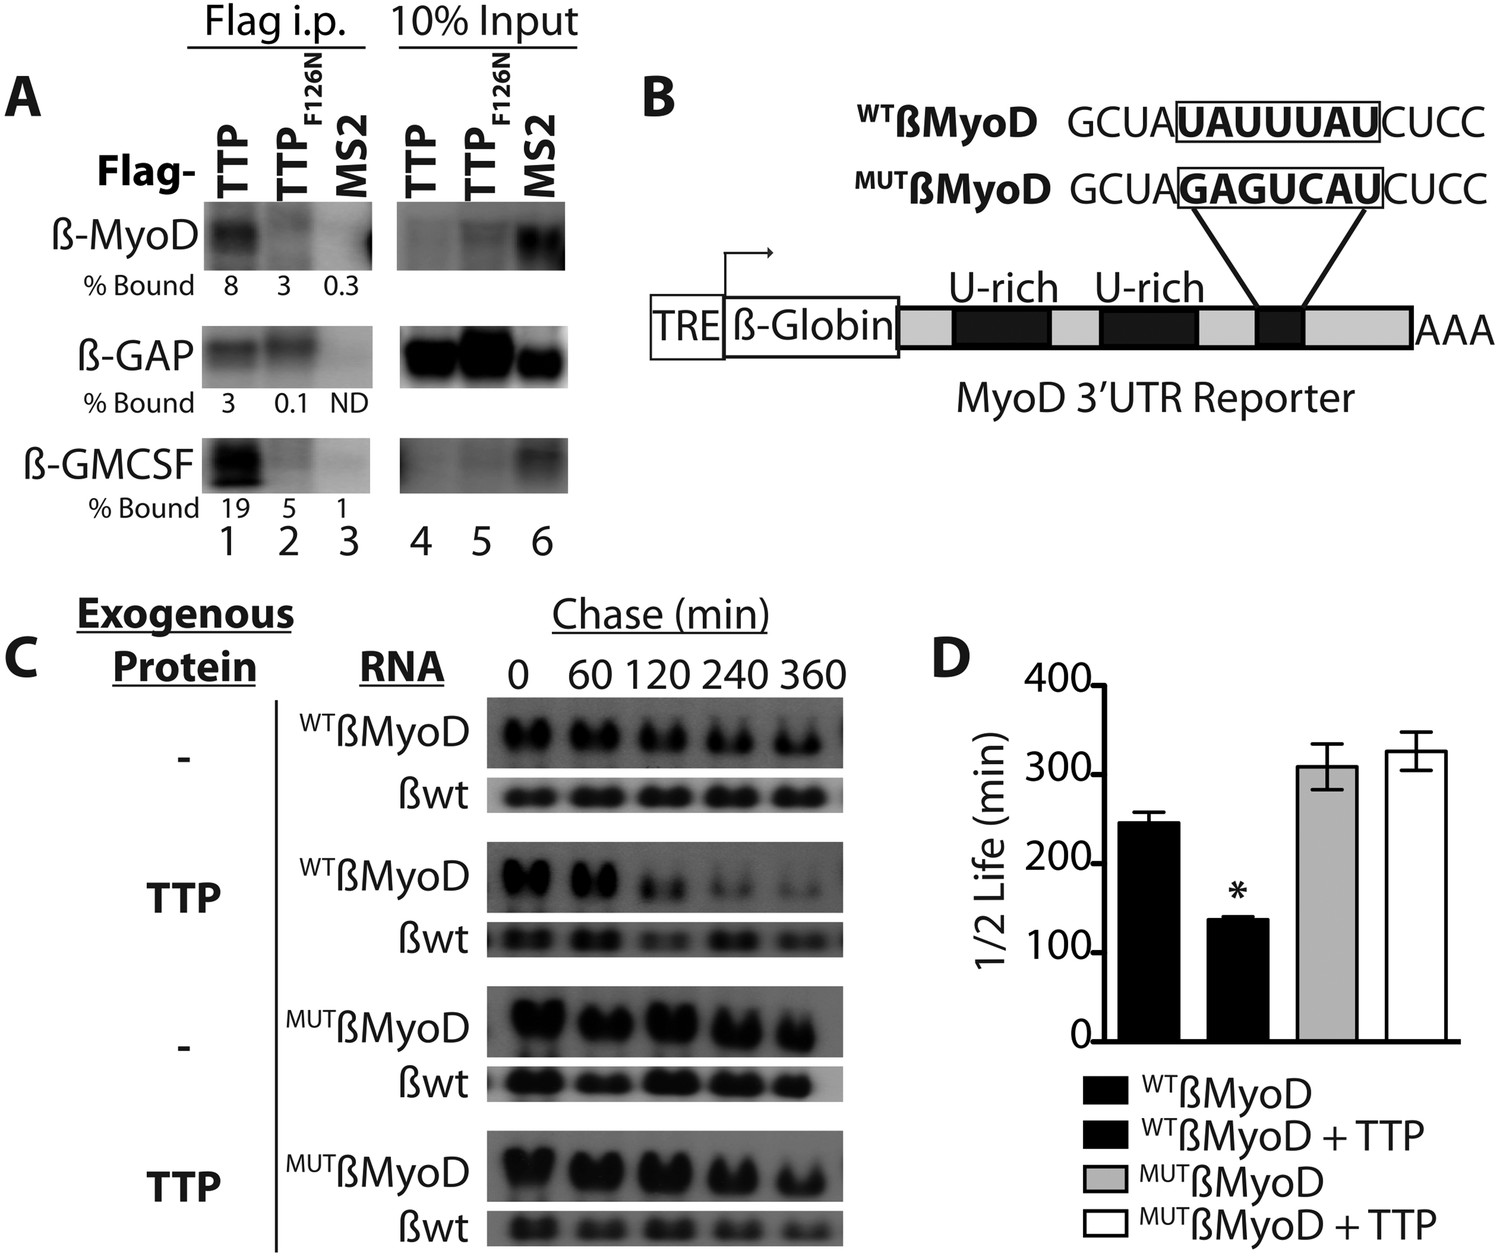
(A) Northern blots of co-immunoprecipitation assays show TTP binding to the MyoD 3′ UTR in HEK293T cells. Assays were performed with cells co-expressing FLAG-tagged wild type TTP (WT, lanes 1 and 4), an RNA binding mutant of TTP (F126N, lanes 2 and 5), or an unrelated non-RNA binding protein, (MS2, lanes 3 and 6) together with the reporter β-globin mRNA containing the MyoD 3′ UTR (β-MyoD) or the GM-CSF 3′ UTR (β-GM-CSF). Cells were extracted, immunoprecipitated with the indicated flag-tagged protein and associated mRNAs detected by Northern Blot with radioactive anti-sense β-globin probes. A β-globin reporter with no putative TTP binding sites served as an internal negative control (β-GAP). Pellet (lanes 1–3) and 10% input (lanes 4–6) fractions were loaded as indicated. Percentage bound normalized to input RNA indicated (ND-not detectable). (B) A schematic of the tetracycline responsive (TRE) β-globin reporter constructs containing the 684 bp MyoD 3′ untranslated region (UTR). Shown are the U-rich HuR binding sites, the putative TTP binding sequence (WTß-MyoD, bold), and the mutated sequence (MUTß-MyoD, bold). (C) TTP reduces the half-life of a WTß-MyoD reporter mRNA. Tet-off Hela cells transfected with either pcTET2-WTß-MyoD or pcTET2-MUTß-MyoD and CMV-β-Globin, a tetracycline unresponsive loading and transfection control, were subjected to pulse-chase mRNA decay assays and extracts separated by Northern blotting and probed with radioactive anti-sense β-globin probes in the presence of an empty vector control (–) or TTP. (D) The calculated β-MyoD mRNA half-life determined from the average ± SEM plotted from at least three independent experiments. Student's two-tailed t-test; * β-MyoD + TTP, p = 0.012.
Figure 4—figure supplement 1
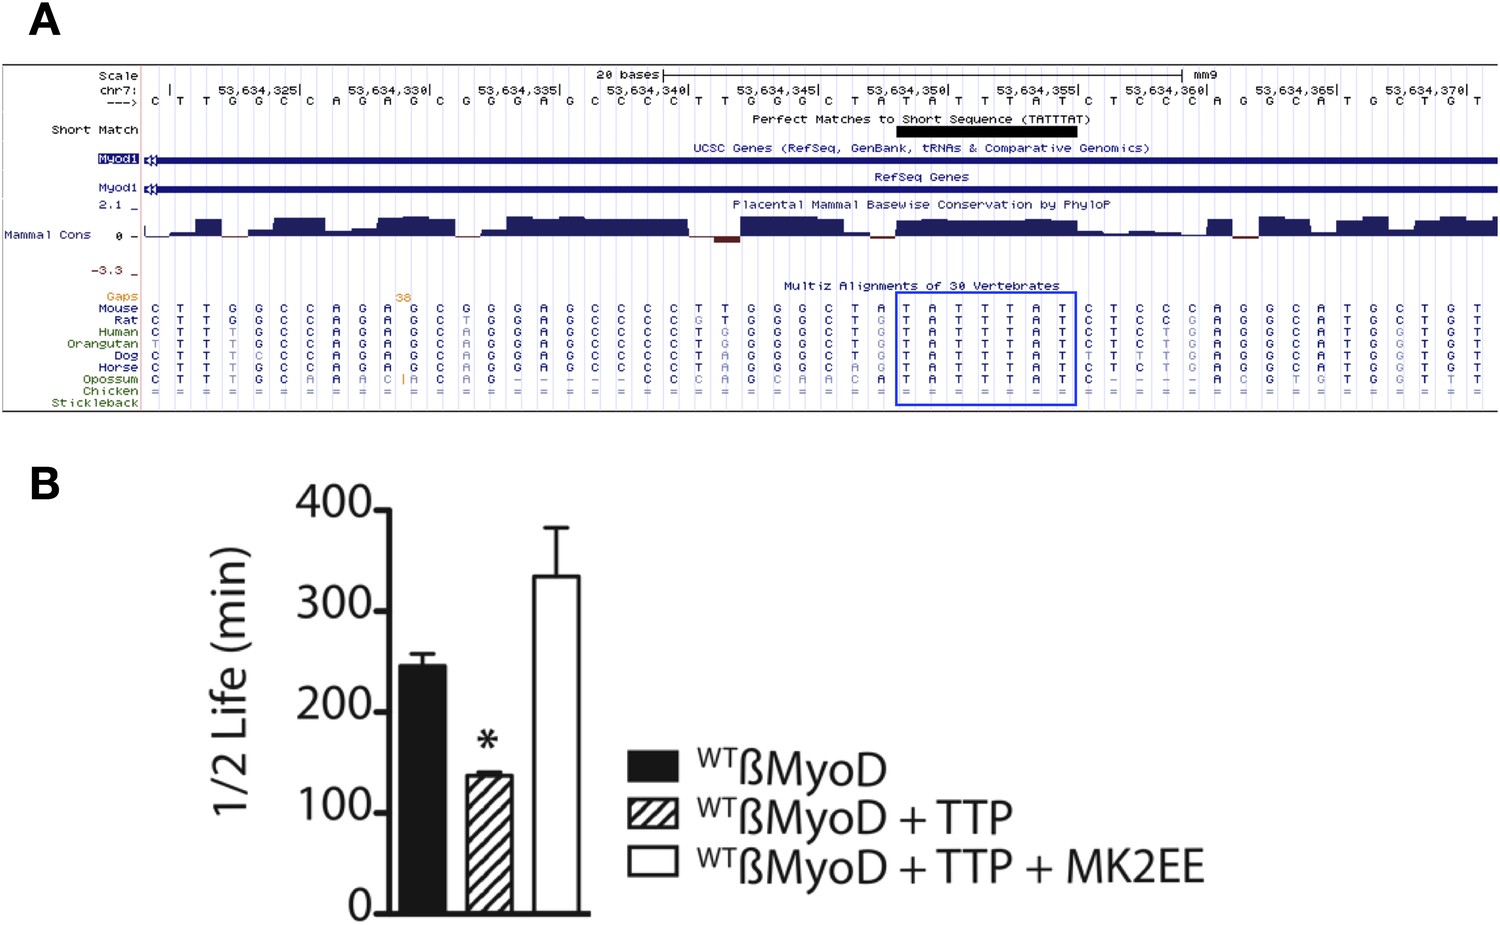
The MyoD 3′ UTR TTP binding site is conserved and stabilized by constitutive MAPKAPK-2 signaling.
(A) The MyoD 3′ UTR TTP binding sequence (TATTTAT) is identical in seven mammals as depicted in the UCSC genome browser. (B) TTP reduces the half-life of a WTß-MyoD reporter mRNA but is stabilized in the presence of constitutively active MAPKAPK-2. Tet-off Hela cells transfected with pcTET2-β-MyoD and CMV-β-Globin, a tetracycline unresponsive loading and transfection control, were subjected to pulse-chase mRNA decay assays and extracts separated by Northern blotting were probed with radioactive anti-sense β-globin probes in the presence of an empty vector control, TTP, or TTP and a constitutively active MK2 (TTP+MK2-EE). The calculated β-MyoD mRNA half-life was determined from the average ± SEM plotted of at least 3 independent experiments. Student's two-tailed t-test; * β-MyoD + TTP, p = 0.012; β-MyoD + TTP + MK2EE compared to empty vector control p < 0.01.
Figure 5 with 2 supplements
TTP loss-of-function promotes promiscuous SC activation.
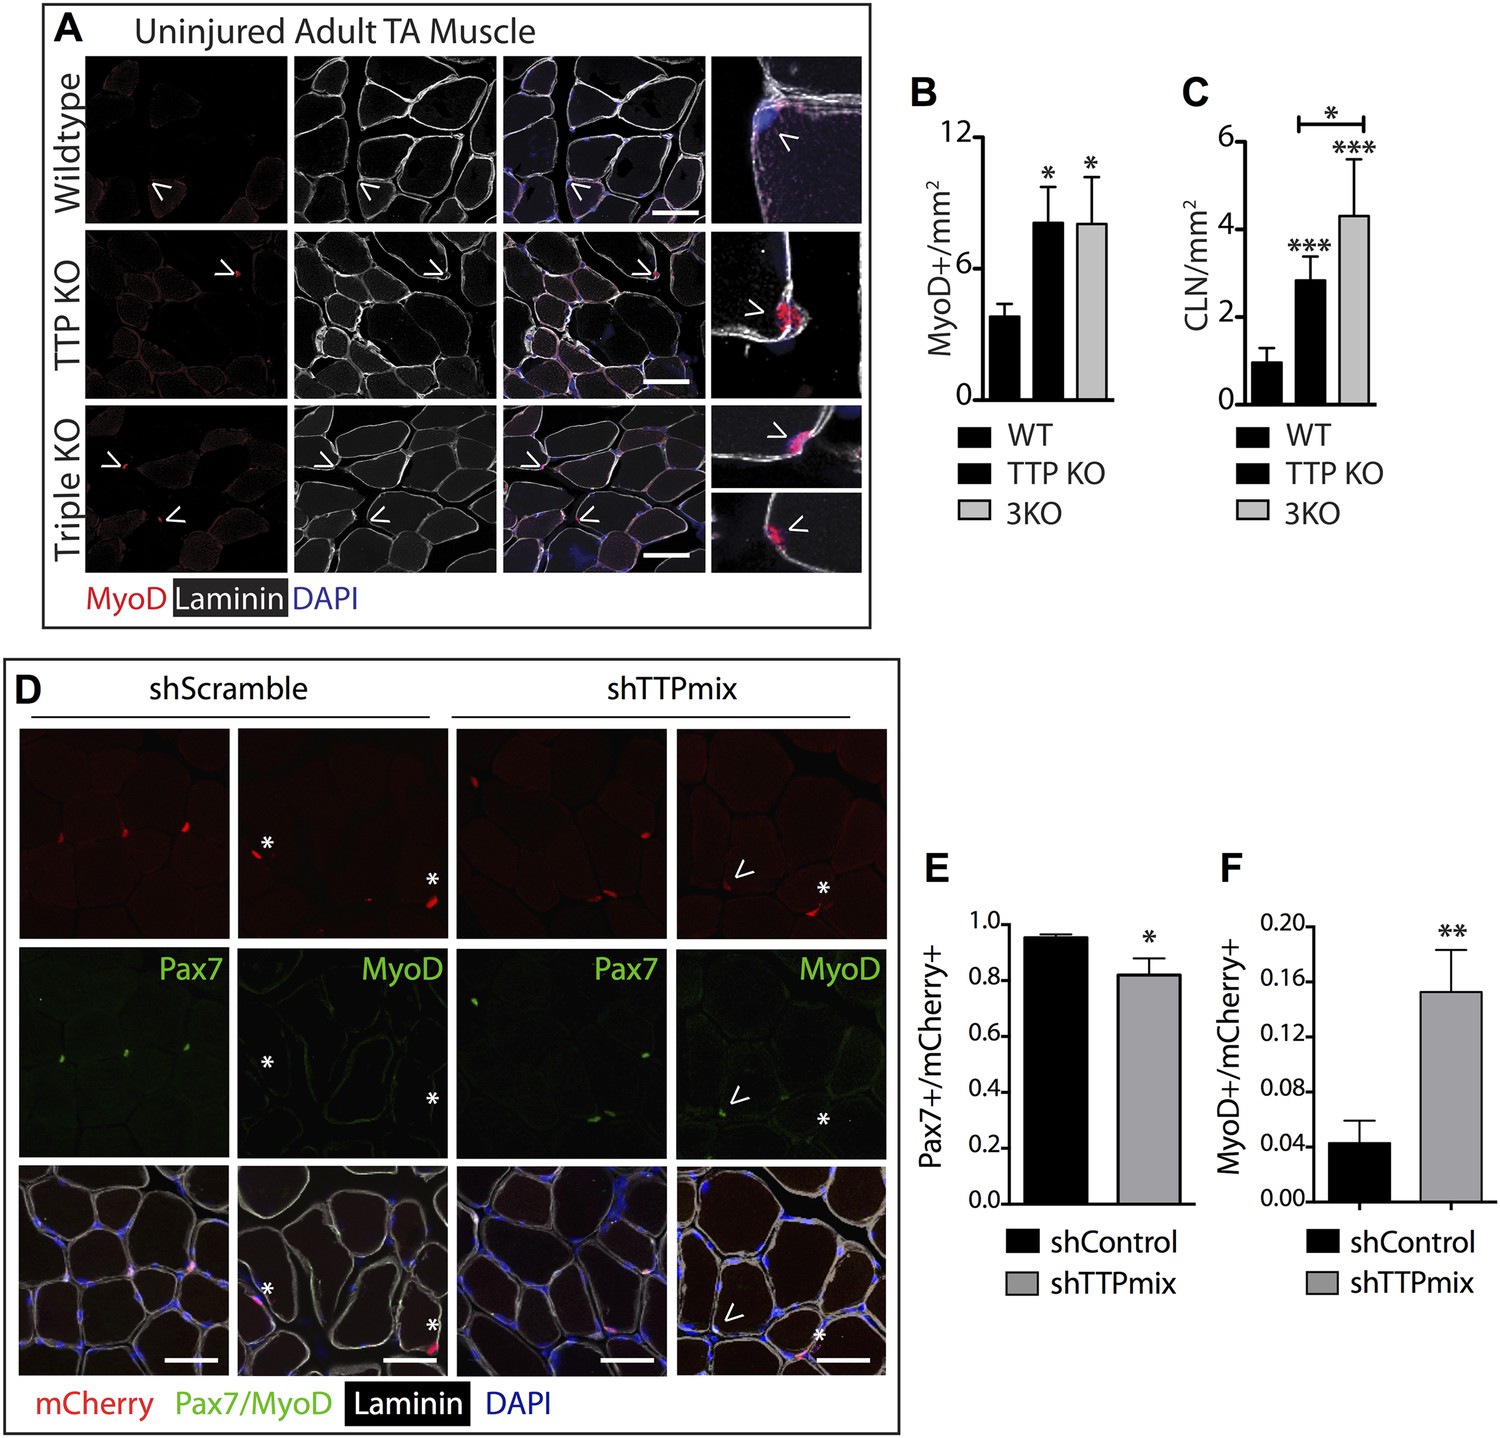
(A–C) Uninjured TA muscle sections from wild type (WT), TTP knockout, and TTP/TNFR1/2 triple knockout mice (3KO) were stained for MyoD (red) to identify cells committed to myogenesis. Loss of TTP or combined loss of TTP/TNFR1/2 in muscle results in significant increases in MyoD+ cells (A, B) and centrally located nuclei (quantified in C), both hallmarks of actively regenerating muscle. (D–F) Pax7+ SCs were infected with mCherry-tagged shRNAs and analyzed 3 weeks post-infection to examine the effect of TTP knockdown on SC activation (Figure 5—figure supplement 2B). TA muscle cross sections were stained with either Pax7 (green) or MyoD (green) and laminin (white) to determine the activation status of infected (mCherry+) SCs. Shown in (E) and (F) are bar graphs quantifying the fraction of mCherry+ cells immunoreactive for Pax7 or MyoD, respectively. N = 3 mice for each experimental condition. For all images, nuclei are labeled blue with DAPI and muscle fibers are depicted in white using an anti-laminin antibody; scale bars = 50 µm. In bar graphs, (*) denotes a p-value < 0.05, (**) p < 0.01, (***) p < 0.001 as determined by student's two tailed t-tests.
Figure 5—figure supplement 1

TTP loss-of-function promotes muscle activation.
Uninjured TA muscle sections from wild type (WT), TTP knockout, and TTP/TNFR1/2 triple knockout mice (3KO) were stained for (A) Pax7 (red) and laminin (white) to identify SCs (carets), and-Ki67 (green) to mark non-quiescent, cycling cells (asterisks). (A–B) When compared to WT muscle sections, the number of Pax7+ SCs were similar in TTP KO and 3KO muscle sections. (C) TTP loss-of-function results in a significant increase in sublaminar Ki67+ cells. Scale bar = 50 µm.
Figure 5—figure supplement 2
SC-specific TTP knockdown breaks quiescence in uninjured muscle.
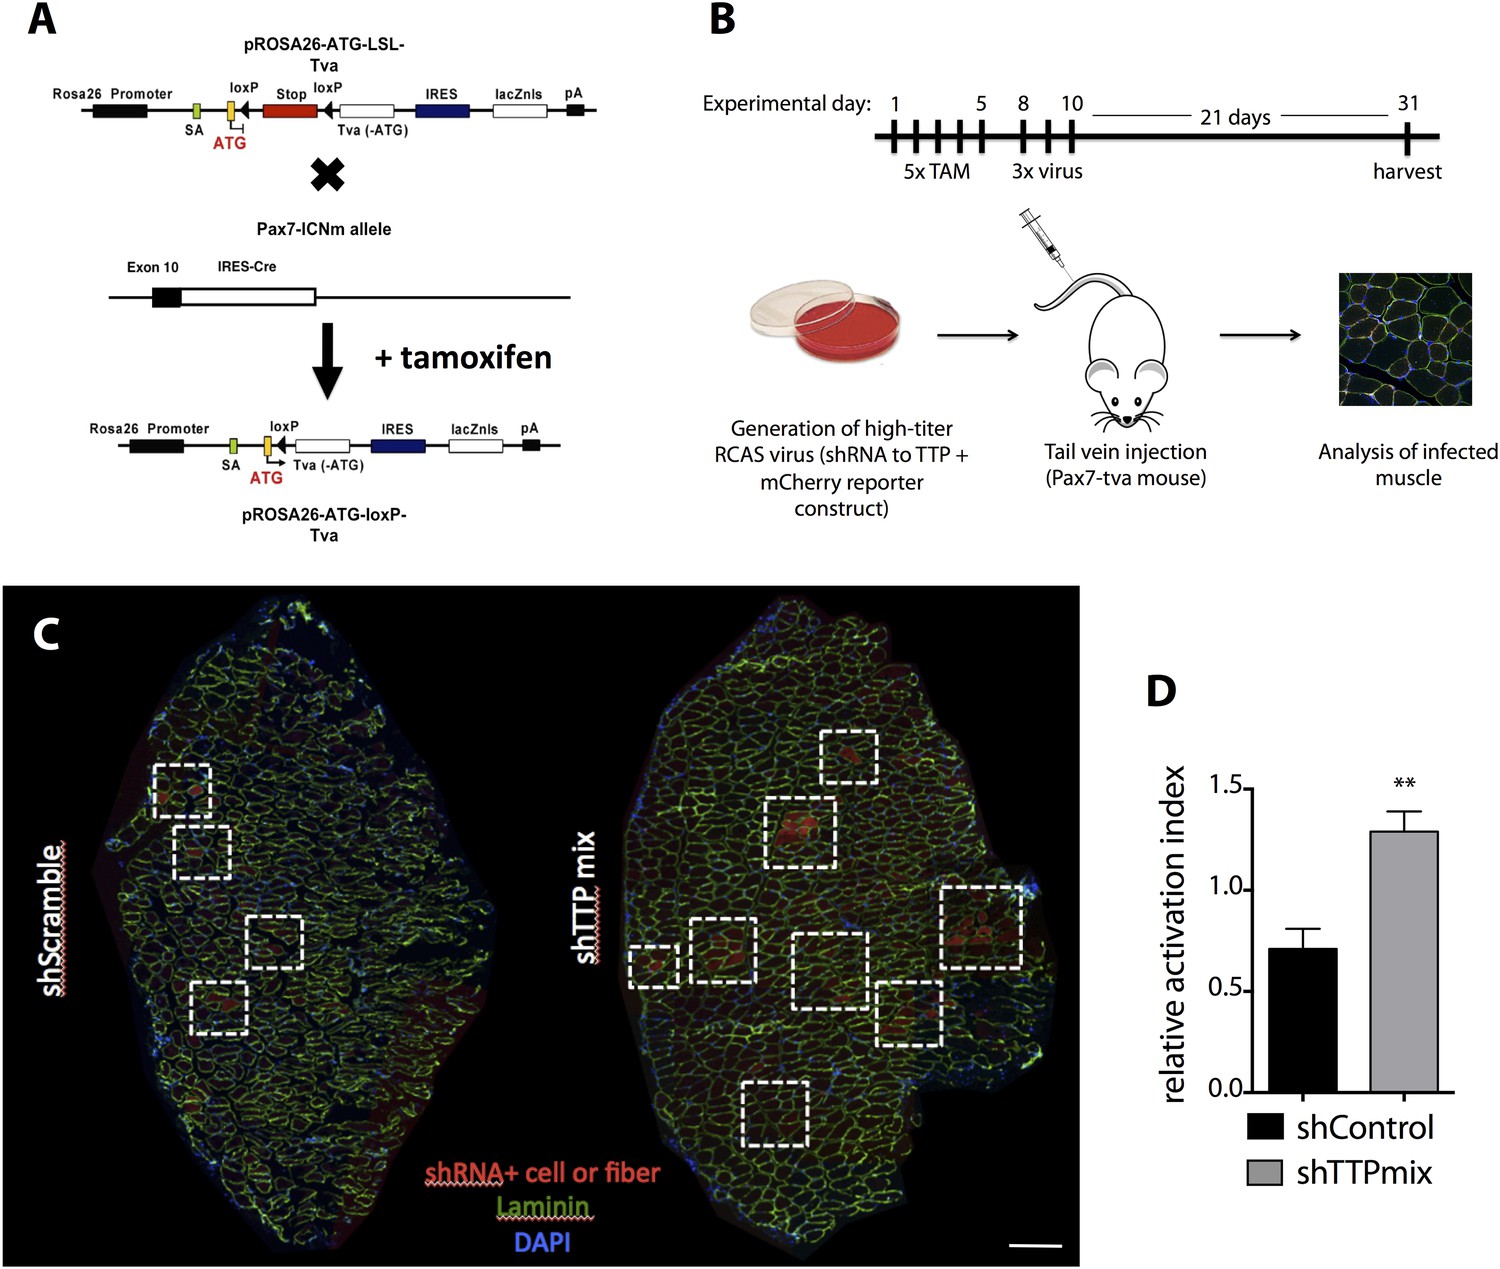
(A) A graphic image depicting the breeding scheme employed to express tva (RCAS receptor) on Pax7+ SCs. (B) Experimental timeline for RCAS-based studies presented in (C–D) and in Figure 5. Briefly, concentrated RCAS was injected via tail vein on 3 consecutive days into recombined Pax7CreERT2;Rosa26LSL-tva-lacZ recipient mice and muscle tissue was harvested for analysis 3 weeks following the final RCAS injection. (C) Representative montage reconstructions of TA muscle cross-sections from mice infected with control (left) or TTP (right) shRNAs. Dashed boxes highlight areas of mCherry+ fibers resulting from activation and eventual fusion of mCherry infected Pax7+ SCs. (D) Bar graph depicting the activation index (mCherry+ fiber/single cell ratio) of control vs TTP knockdown muscle cross-sections 3 weeks post-infection. (**) p < 0.01. N = 3 mice for each experimental condition. Scale bar = 200 µm.
Figure 6
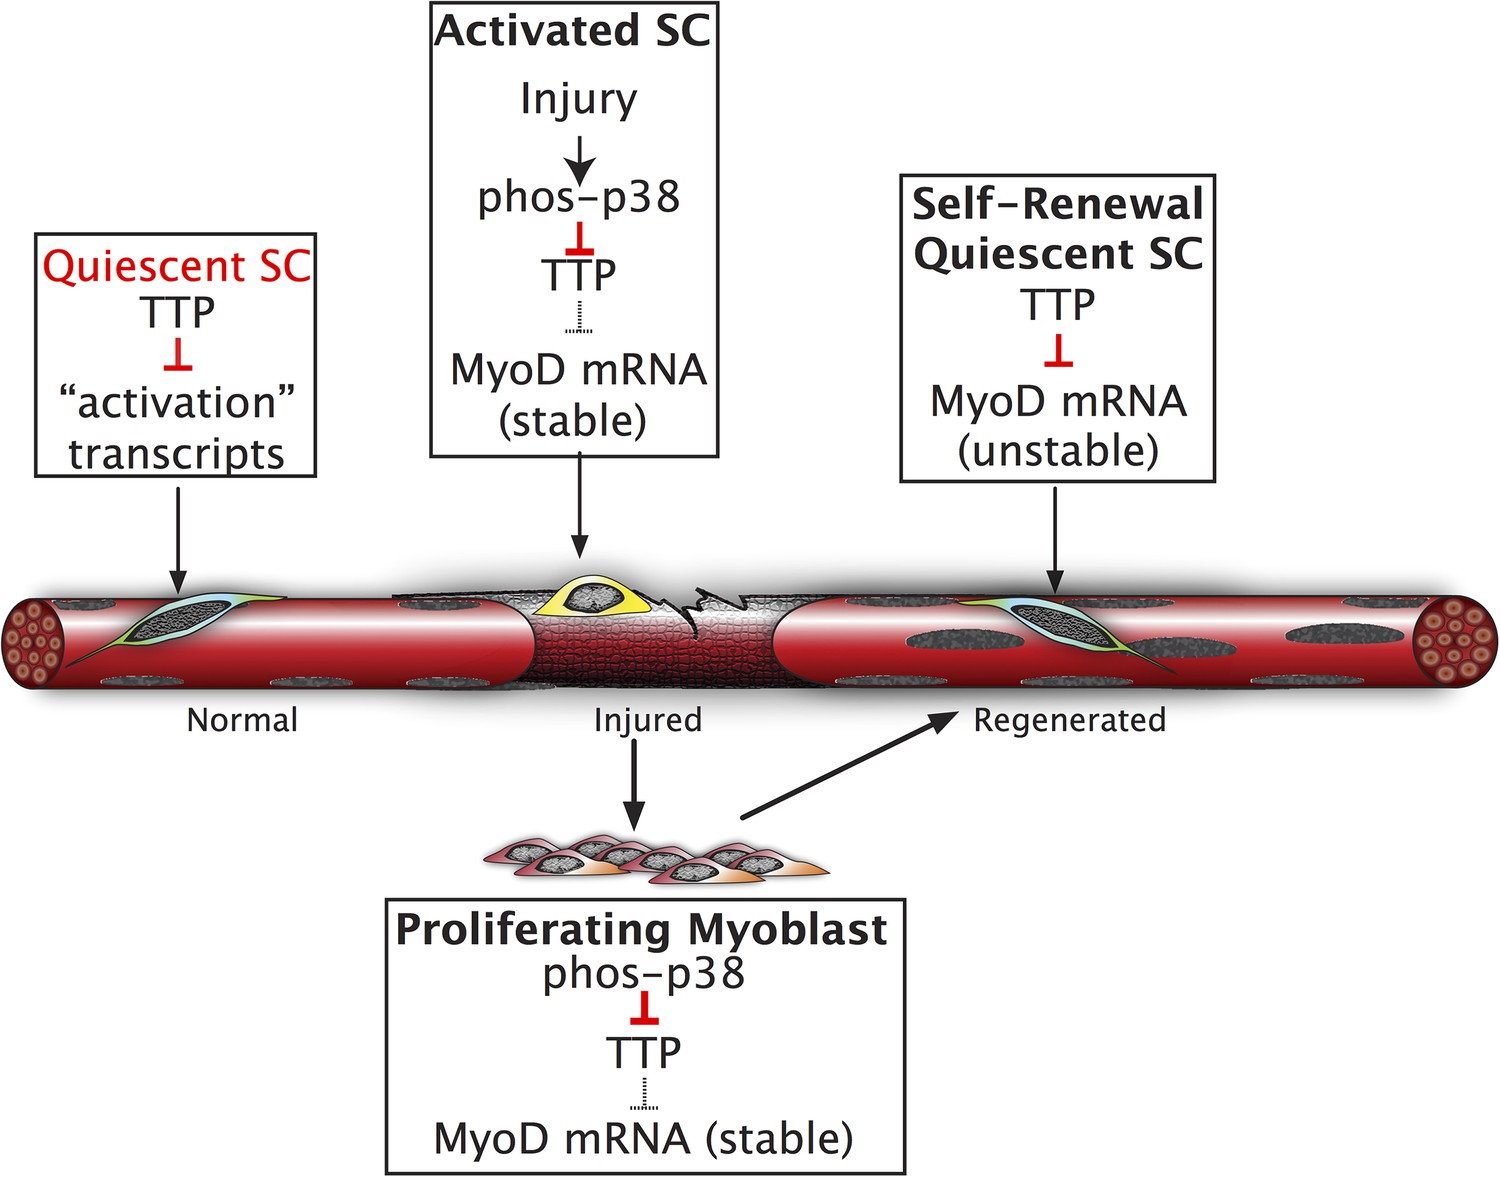
Inhibition of TTP by p38α/β MAPK initiates a feed-forward circuit that commits SCs to the myogenic lineage.
Muscle regeneration requires SCs to rapidly exit from quiescence but to also renew the quiescent SC population upon completion of regeneration. We propose that TTP suppresses transcripts for SC activation as a mechanism for immediate exit from quiescence. Upon muscle injury, p38α/β MAPK is rapidly activated resulting in phosphorylation of TTP. Phospho-TTP no longer suppresses activation-associated transcripts resulting in rapid induction and SC activation. One such activation-associated transcript targeted by TTP is MyoD, which is rapidly induced due to inactivation of TTP by p38α/β MAPK concurrent with increased MyoD mRNA stability mediated by HuR and transcriptional upregulation of the MyoD gene locus. Since MyoD up-regulates its own transcription, muscle injury would trigger a rapid feed-forward loop resulting in MyoD expression driving SCs to commit to myoblasts. Additionally, we propose that TTP may be involved in down regulation of MyoD mRNA and other TTP-target transcripts expressed by myoblasts, during the initial formation of a quiescent SC population or in reacquisition of quiescence following an injury.
Additional files
-
Supplementary file 1
(A) Transcripts up-regulated in the WT-S4 gene list. Probesets on Affymetrix arrays that increased in expression ≥ twofold from uninjured to 12 hr post-injury in wild type satellite cells that did not change expression in Sdc4−/− satellite cells are tabulated and arranged by decreasing fold-change. The fold change represents the increase in transcript abundance between wild type uninjured satellite cells and satellite cells 12 hr post muscle injury and is reported with the associated p-value. (B) Transcripts down-regulated in the WT-S4 gene list. Probesets on Affymetrix arrays that decreased in expression ≥ twofold from uninjured to 12 hr post-injury in wild type satellite cells that did not change expression in Sdc4−/− satellite cells are tabulated and arranged by decreasing fold-change. The fold change represents the decrease in transcript abundance between wild type uninjured satellite cells and satellite cells 12 hr post muscle injury and is reported with the associated p-value. (C) Myogenic mRNA expression in quiescent SCs. Shown are representative myogenic transcript expression levels from a recently published microarray study of adult, quiescent SCs (Bernet et al., 2014). MyoD1 is highlighted in red and other myogenic transcripts are provided as references in black. The entire microarray data set can be accessed using the NCBI Gene Expression Omnibus (GEO) and the unique GEO ID 200047104.
- https://doi.org/10.7554/eLife.03390.016
-
Supplementary file 2
(A) Raw data from TTP, 3KO immunofluorescence quantification. Individual raw data tables (Pax7, Ki67, centrally-located nuclei (CLN), and MyoD) with cell counts per section (40×) for each genotype and biological replicate (WT, TTP KO, 3KO) described in Figure 5A–C. On the right of each raw data table is a summary table listing averages, standard deviation, and range for each genotype. (B) Raw data from RCAS immunofluorescence experiments. A table listing raw data from RCAS infections plotted in Figure 5D–F. For each biological replicate (three shControl and three shTTPmix), the mean, standard deviation, standard error, and confidence interval statistics for mCherry fluorescence, Pax7 immunoreactivity, and MyoD immunoractivity (per 20× section) are provided.
- https://doi.org/10.7554/eLife.03390.017
Download links
A two-part list of links to download the article, or parts of the article, in various formats.
Downloads (link to download the article as PDF)
Open citations (links to open the citations from this article in various online reference manager services)
Cite this article (links to download the citations from this article in formats compatible with various reference manager tools)
Post-transcriptional regulation of satellite cell quiescence by TTP-mediated mRNA decay
eLife 4:e03390.
https://doi.org/10.7554/eLife.03390


