T cell-specific inhibition of multiple apoptotic pathways blocks negative selection and causes autoimmunity
- University of California, Berkeley, United States
Figures
Figure 1
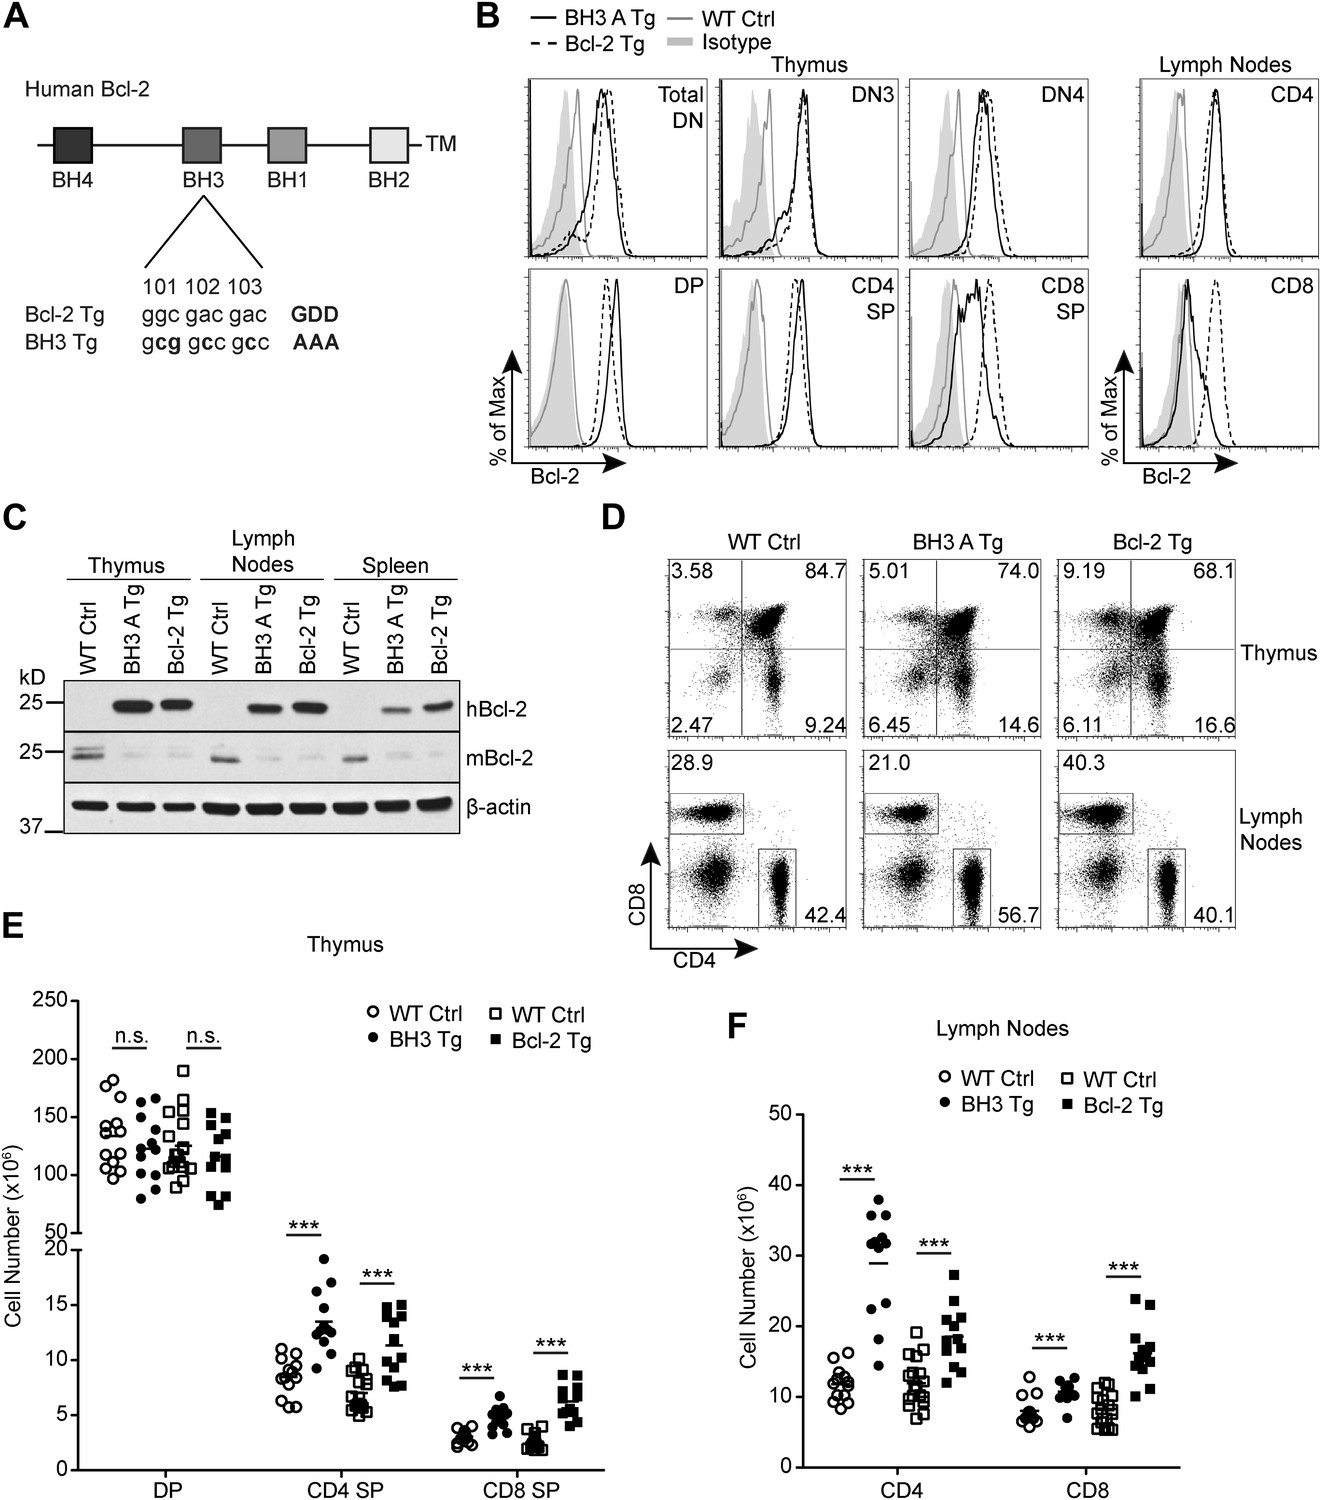
Generation of Bcl2 BH3 domain mutant transgenic mice.
(A) Diagram of the mutation made to the BH3 domain of human Bcl2 to abolish BH3 domain function in the Bcl2 BH3 mutant transgenic (BH3 Tg) mice. Amino acids 101–103 of human Bcl2 were mutated from Glycine-Aspartate-Aspartate to Alanine-Alanine-Alanine to abolish BH3 domain function (Cheng et al., 1997a). (B) Flow cytometric analysis of intracellular Bcl-2 expression in BH3 Tg, line A (BH3 A Tg) vs LckPr-Bcl2 (Bcl-2 Tg) and wild-type (WT) thymocyte and mature T cell populations. DN populations were gated based on CD25 and CD44 expression. (C) Western blot analysis comparing human vs mouse Bcl-2 expression in the thymus, lymph nodes and spleen of BH3 A Tg vs Bcl-2 Tg and WT mice. (D) Flow cytometric analysis of CD4 vs CD8 T cell populations in the thymus and lymph nodes. (E) DP, CD4 SP and CD8 SP thymocyte cell numbers in 6-week-old BH3 Tg and Bcl-2 Tg mice compared to WT littermate controls. (F) Lymph node mature CD4 and CD8 T cell numbers in 6-week-old BH3 Tg and Bcl-2 Tg mice compared to WT littermate controls. The transgenic mice in (B–D) were age-matched within 1 week and compared to a littermate non-transgenic WT control. All mice were between 6 and 10-weeks-old. (B–F) are representative of or compiled from at least three independent experiments. Statistics here and in the following figures were calculated by Student's t-test: ***p < 0.001, **p < 0.01, *p < 0.05, n.s. not significant.
Figure 2
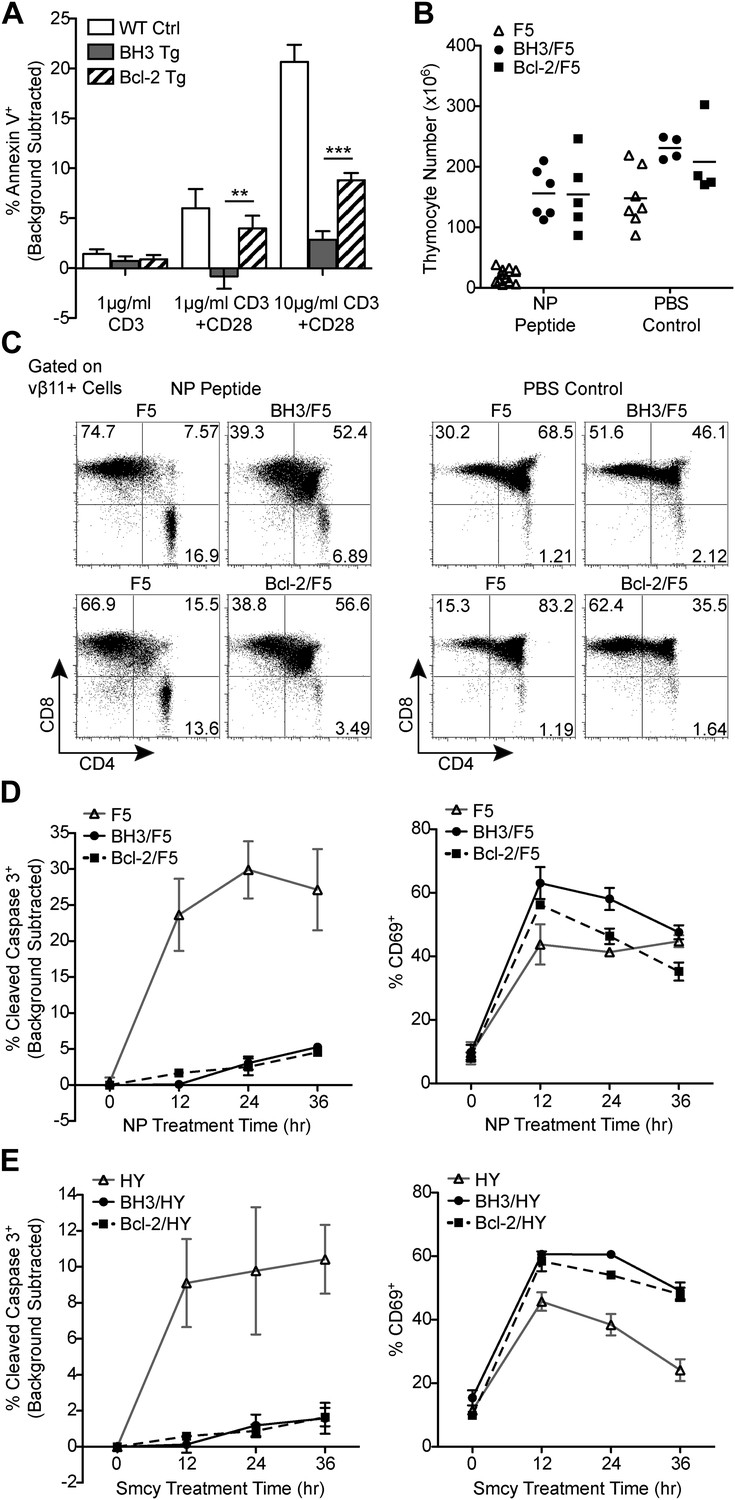
BH3 transgene expression efficiently blocks TCR-mediated thymocyte apoptosis in vitro and in F5 and HY TCR transgenic models of negative selection.
(A) Thymocytes were stimulated for 18 hr with anti-CD3 and anti-CD28 (20 μg/ml) and analyzed for the percentage of Annexin V+ cells by flow cytometry. The percentage of Annexin V+ thymocytes in samples left untreated for 18 hr (i.e. background) was subtracted. (B) Total live thymocyte number in thymii collected 48 hr after injection with the F5 TCR-specific peptide, NP, or PBS. (C) CD4 vs CD8 flow cytometric analysis of F5 TCR+ (vβ11+) thymocytes from mice treated as in (B). Data in (B and C) are representative of or pooled from at least five independent experiments per transgenic genotype. Mice were between 6 and 9-weeks-old and F5 control mice were littermates to BH3/F5 and Bcl-2/F5 mice. (D) Percentage of Cleaved Caspase 3+ thymocytes by flow cytometric analysis treated with 100 ng/ml NP peptide for the indicated times. The percentage of Cleaved Caspase 3+ thymocytes treated with an irrelevant peptide (i.e. background) was subtracted at each time point. Efficient activation of thymocytes by the NP peptide was assessed by flow cytometric analysis of CD69 surface expression. Data are representative of three independent experiments. (E) Percentage of Cleaved Caspase 3+ thymocytes by flow cytometric analysis treated with 100 ng/ml of the HY TCR-specific peptide, Smcy, for the indicated times. Background was subtracted as in (D). Proper thymocyte activation was confirmed by analysis of CD69 expression. Data are representative of two independent experiments.
Figure 3 with 1 supplement
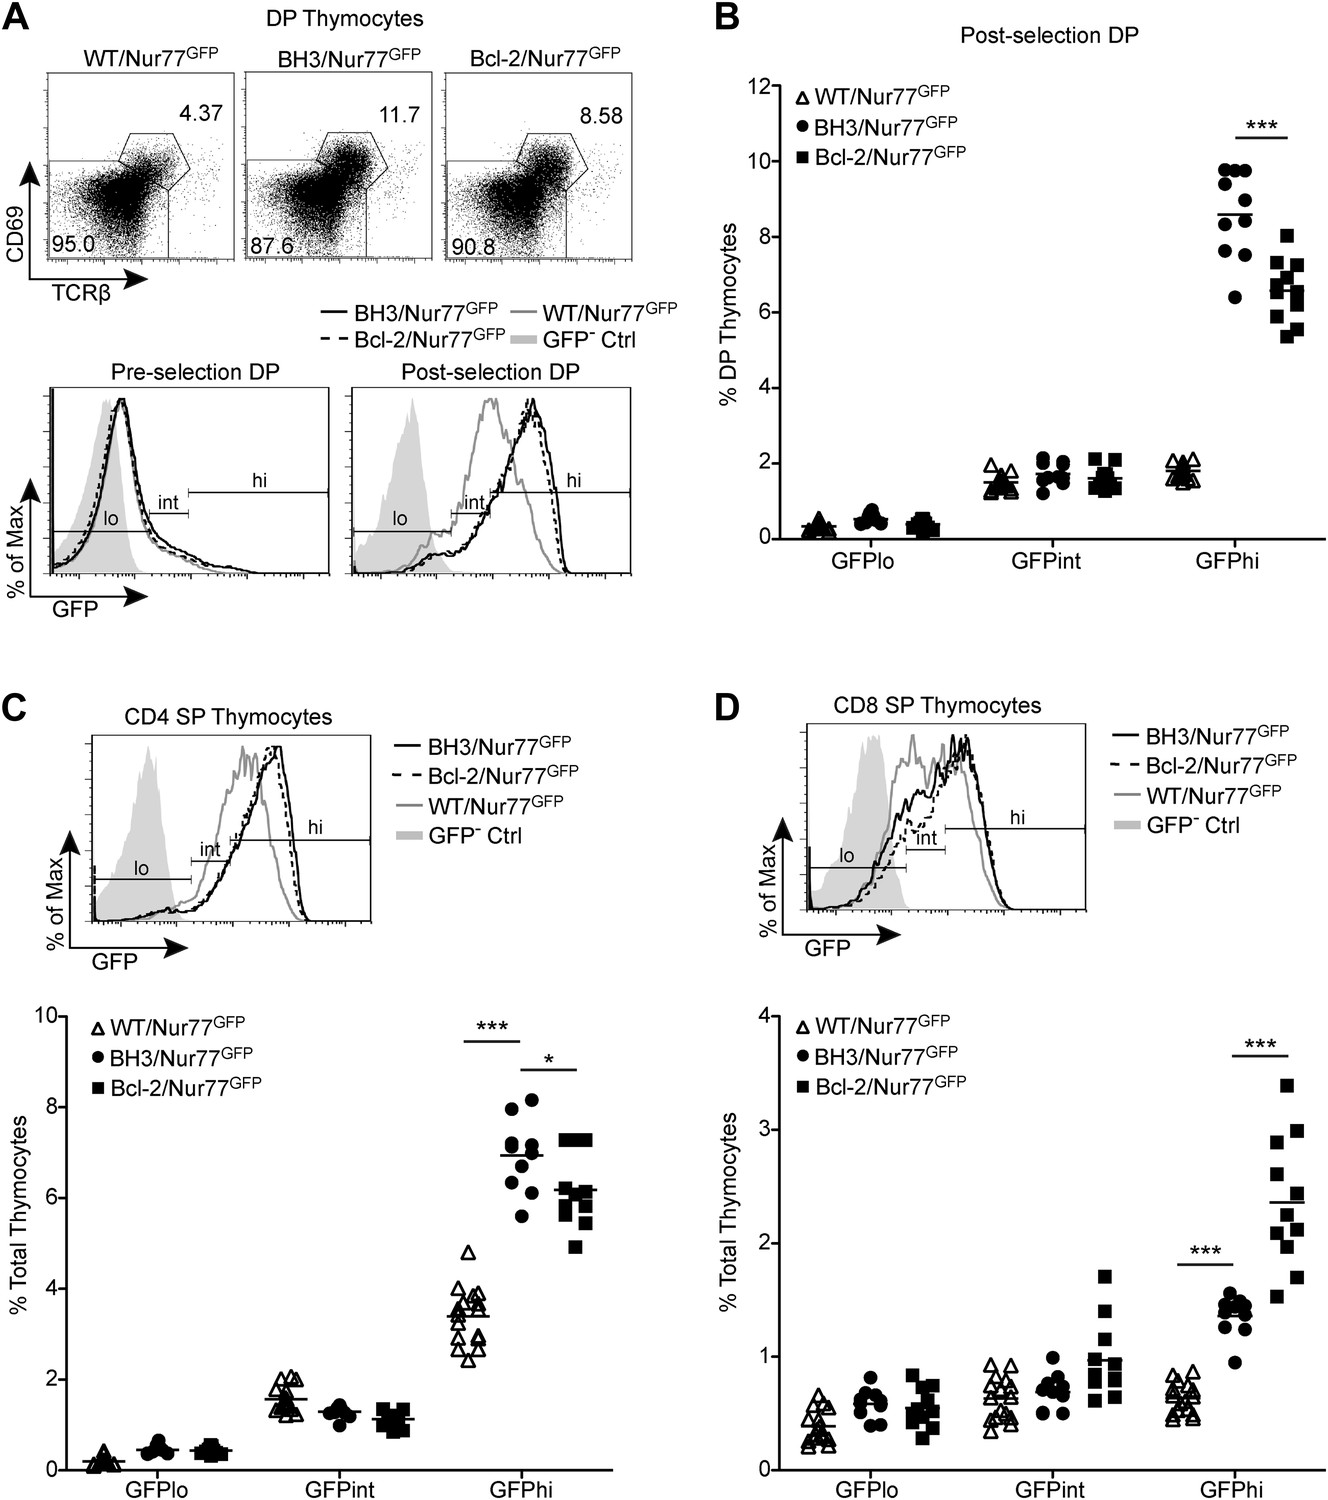
BH3 transgene expression rescues high affinity TCR clones in a polyclonal system.
(A) Flow cytometric analysis of GFP expression in pre-selection (CD69− TCRβ−) vs post-selection (CD69+ TCRβ+) DP thymocytes from Nur77GFP mice expressing the BH3 and Bcl2 transgenes. The WT/Nur77GFP post-selection DP histogram was used to set the GFP low (lo), intermediate (int), and high (hi) gates. The left end of the ‘int’ gate was set at the base of the GFP− Ctrl histogram and right end was set at the mean GFP fluorescence intensity of the WT/Nur77GFP histogram. The ‘lo’ and ‘hi’ gates were extended from the left and right ends of the ‘int’ gate, respectively. (B) Percentage of DP thymocytes that were post-selection and GFP lo, int and hi as defined in (A). (C and D) Flow cytometric analysis of GFP expression in CD4 SP (C) and CD8 SP (D) with the gates from post-selection DP cells in A applied. The GFP lo, int and hi percentages were quantified. All mice were 6-weeks-old and WT/Nur77GFP and GFP− Ctrl mice were littermates to the BH3/Nur77GFP and Bcl-2/Nur77GFP mice. Data were pooled from 10 independent experiments.
Figure 3—figure supplement 1

Nur77 GFP expression in SP thymocytes is regulated by TCR signaling.
Flow cytometric analysis of Nur77 GFP expression over time in CD4 SP and CD8 SP thymocytes removed from MHC by culturing. Histograms are representative of duplicate samples and two independent experiments.
Figure 4
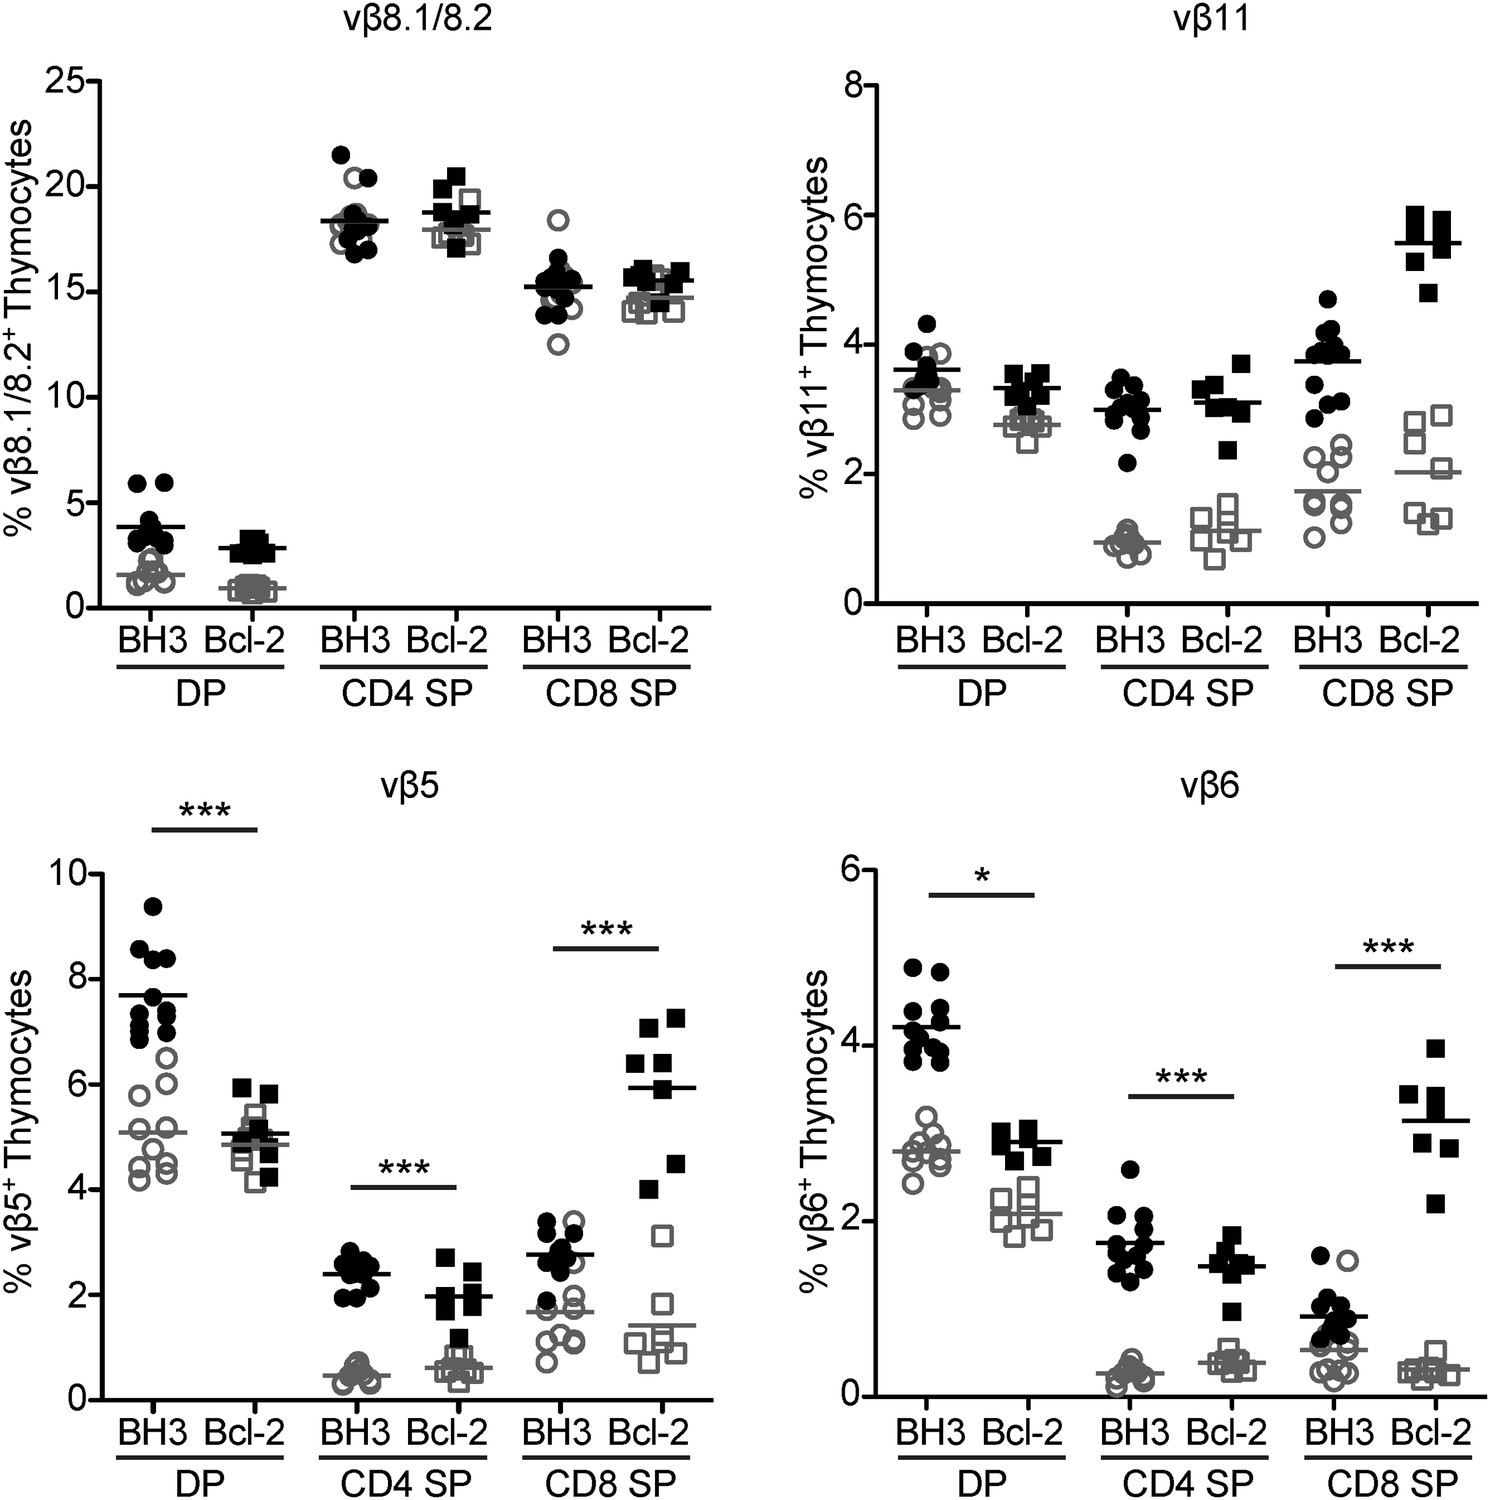
Superantigen negative selection is inhibited in BH3 Tg mice.
Flow cytometric analysis of TCR vβ chain expression in DP, CD4 SP and CD8 SP thymocyte subsets from BH3 Tg and Bcl-2 Tg mice (closed shapes, black) compared to littermate wild-type controls (open shapes, grey) on a C57BL/6 X CBA/J genetic background. All mice were 8-weeks-old.
Figure 5 with 1 supplement

Alternative tolerance mechanisms in BH3 Tg mice.
(A) Flow cytometric analysis of GFP expression by mature CD4 and CD8 lymph node T cells. Quantification indicates the fold change in GFP mean fluorescence intensity (M.F.I.) relative to WT/Nur77GFP CD4 and CD8 samples. GFP M.F.I. was normalized between experiments by subtracting the M.F.I. of a GFP– control. n ≥ 10 per genotype. (B) Comparison of GFP expression by total CD4 SP thymocytes vs Foxp3+ CD4 SP Treg cells. (C) Quantification of flow cytometric analysis of CD25+ vs CD25− Treg cells (CD4+ Foxp3+) in the thymus and lymph nodes. n ≥ 7 per genotype. (D) Comparison of GFP expression levels in CD25+ vs CD25− Treg cells from BH3 Tg mice. (E) Flow cytometric analysis of non-Treg, anergic CD4 T cells in the lymph nodes. Treg cells were gated out by high expression of GITR and CD25. Anergic cells, indicated by the bolded gates, express high levels of CD44, FR4 and CD73. (F) Quantification of anergic CD4 T cells gated as described in (E). Mice were 6-weeks-old in (A–D) and 7-weeks-old in (E–F). All data are representative of or compiled from at least three independent experiments.
Figure 5—figure supplement 1

Nur77 GFP expression in mature T cells is maintained by TCR signaling.
Flow cytometric analysis of Nur77 GFP expression over time in mature T cells removed from MHC by culturing. Histograms are representative of duplicate samples and two independent experiments.
Figure 6
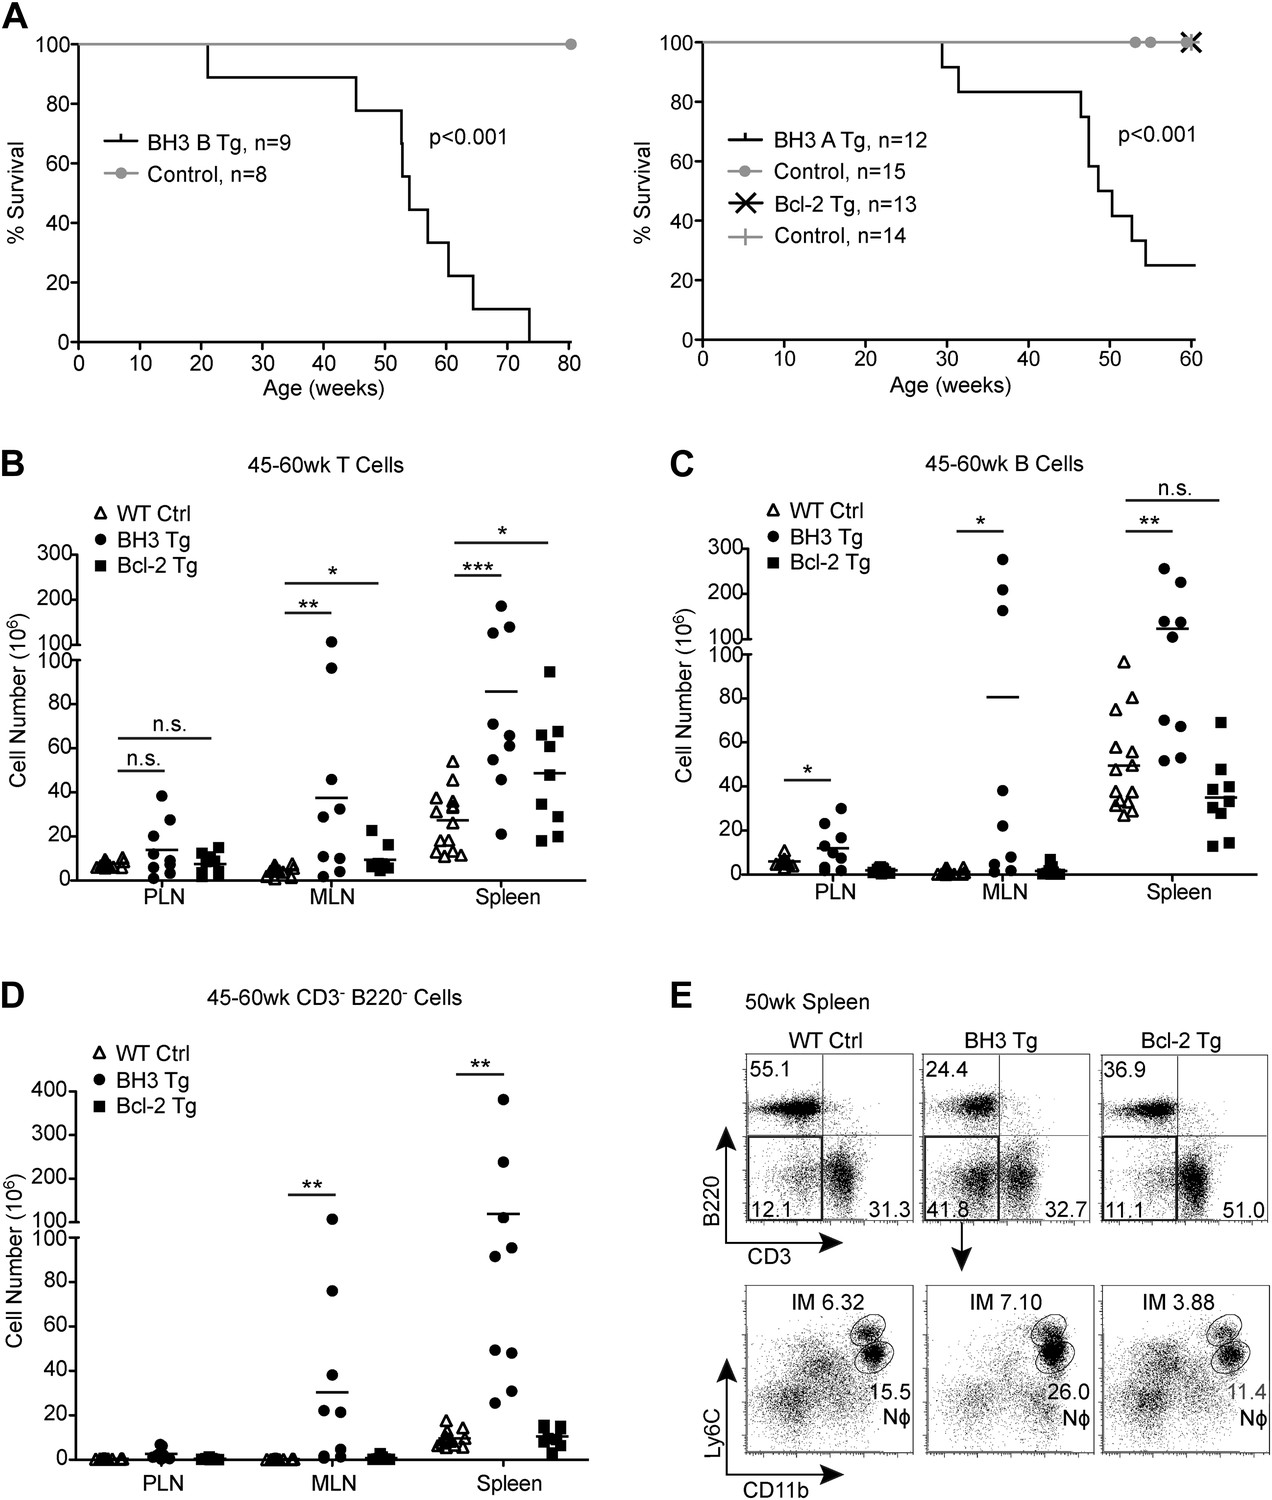
BH3 Tg mice have a shortened lifespan and exhibit lymphoid hyperplasia.
(A) Kaplan-Meier curves for BH3 Tg lines A and B and Bcl-2 Tg mice compared to littermate WT controls. Statistical significance was calculated using the Log-rank test. (B–D) Quantification of CD3+ T cells (B), B220+ B cells (C) and CD3− B220− Myeloid/other cells (D) in the peripheral lymph nodes (PLN), mesenteric lymph nodes (MLN) and spleen of 45 to 60-week-old mice. WT controls were littermates to BH3 Tg and Bcl-2 Tg mice. (E) Flow cytometric analysis of CD11b and Ly6C expression on CD3− B220− splenocytes from 50-week-old mice. Ly6Chi CD11b+ inflammatory monocytes (IM) and Ly6Clo CD11b+ neutrophils (Nϕ, also Ly6G+) are gated. Plots are representative of at least five mice per genotype.
Figure 7
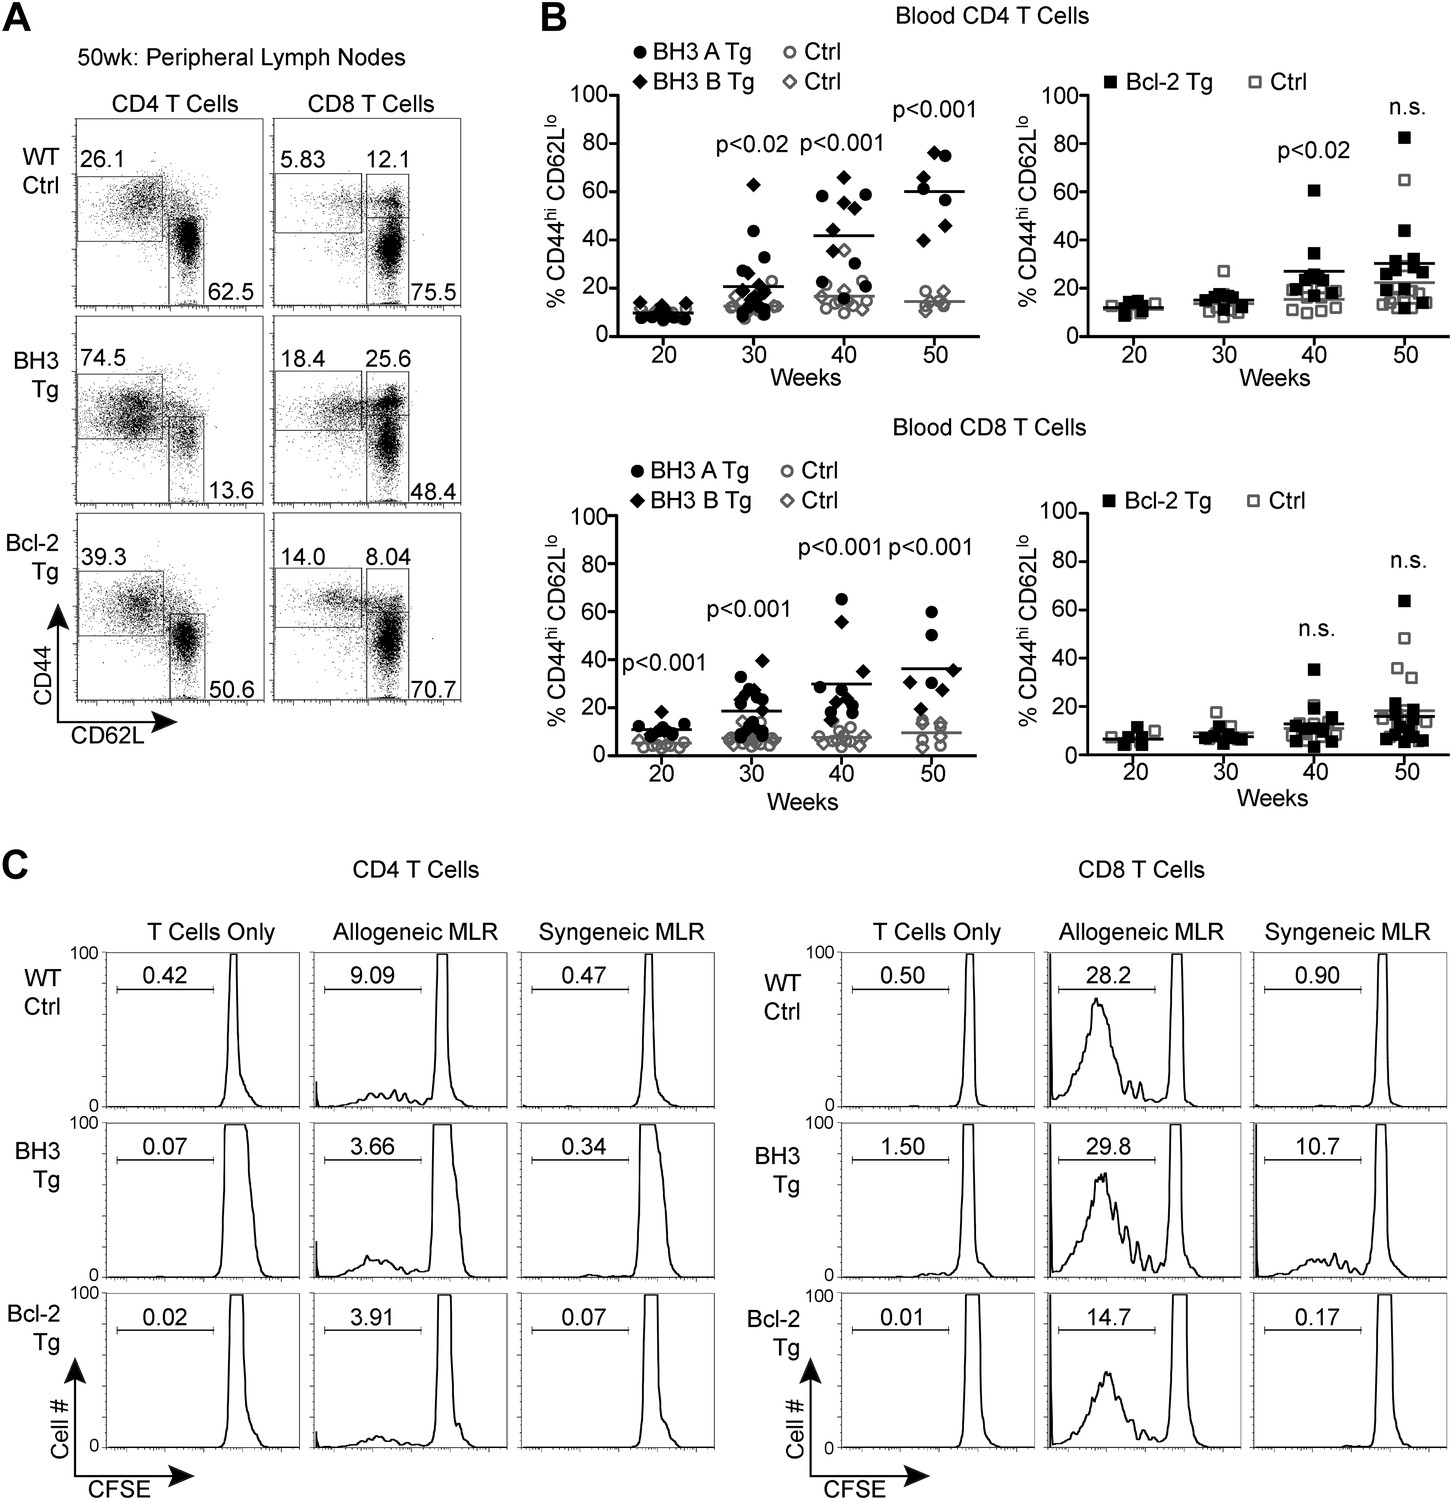
BH3 Tg mice accumulate activated, autoreactive T cells.
(A) Flow cytometric analysis of activated CD4 and CD8 peripheral lymph node T cells by CD44 and CD62L expression in 50-week-old mice. For CD4 T cells, gates indicate activated (CD44hi CD62Llo) and naïve (CD44lo CD62Lhi) populations. For CD8 T cells, activated effector memory (CD44hi CD62Llo) and activated central memory (CD44hi CD62Lhi) vs naïve (CD44lo CD62Lhi) populations are gated. (B) Compiled analyses of the percentage of activated T cells (CD44hi CD62Llo) in the peripheral blood of aged mice. Controls (Ctrl) are littermates to the Tg mice as denoted by data point shape. (C) Mixed lymphocyte reaction: purified T cells from 20-week-old mice were cultured with allogeneic (Balb/c) or syngeneic (C57BL/6) irradiated splenocytes at a 1:1 ratio. Proliferation was measured by CFSE dilution over 4 days. Histograms are representative of triplicate samples and five independent experiments, two with Treg cell-depletion (shown) and three without. Gates indicate the percentage of total cells that have undergone at least one round of proliferation.
Figure 8
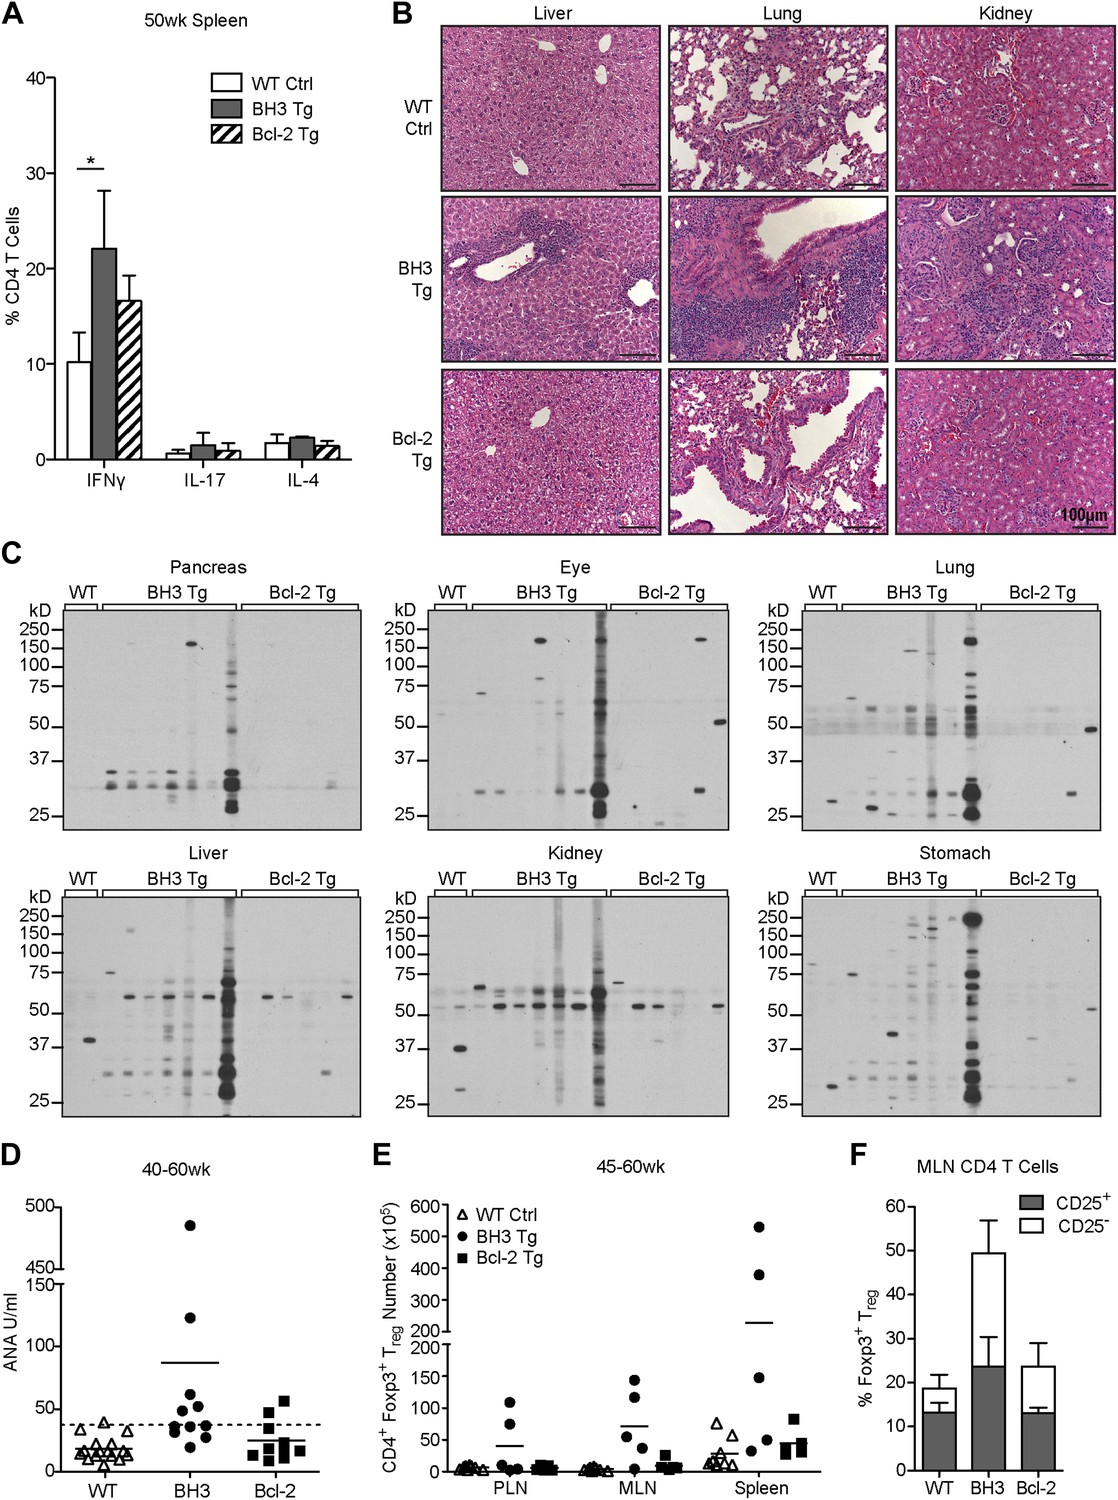
T cell autoimmune pathology is apparent in BH3 Tg mice.
(A) Quantification of flow cytometric analysis of T helper cell cytokine expression. Splenic CD4 T cells from 50-week-old mice were stimulated with PMA and Ionomycin for 4 hr in the presence of brefeldin A to allow cytokine accumulation. n ≥ 3 mice per genotype. (B) Hematoxylin and Eosin staining for lymphocyte infiltrates in liver, lung and kidney sections from 50-week-old mice. Images were captured at 20x magnification. Data are representative of at least three mice per genotype. (C) Sera immunoblots for detection of autoantibodies. Whole tissue extracts were probed with sera from 40 to 50-week-old mice. Each lane corresponds to sera from an individual mouse: WT n = 2, BH3 Tg n = 7, Bcl-2 Tg n = 6. (D) Serum anti-nuclear antibody (ANA) quantification by ELISA. Dashed line represents two standard deviations above the WT mean. Samples above this line are considered positive for ANA. (E) Quantification of CD4+ Foxp3+ Treg cells in the lymphoid organs of aged mice. (F) Percentage of CD4 T cells that are Treg cells (CD25+ vs CD25−) in the mesenteric lymph nodes of 45 to 60-week-old mice. n ≥ 5 mice per genotype.
Download links
A two-part list of links to download the article, or parts of the article, in various formats.
Downloads (link to download the article as PDF)
Open citations (links to open the citations from this article in various online reference manager services)
Cite this article (links to download the citations from this article in formats compatible with various reference manager tools)
T cell-specific inhibition of multiple apoptotic pathways blocks negative selection and causes autoimmunity
eLife 3:e03468.
https://doi.org/10.7554/eLife.03468


