Active RNAP pre-initiation sites are highly mutated by cytidine deaminases in yeast, with AID targeting small RNA genes
- Medical Research Council Laboratory of Molecular Biology, United Kingdom
Figures
Figure 1
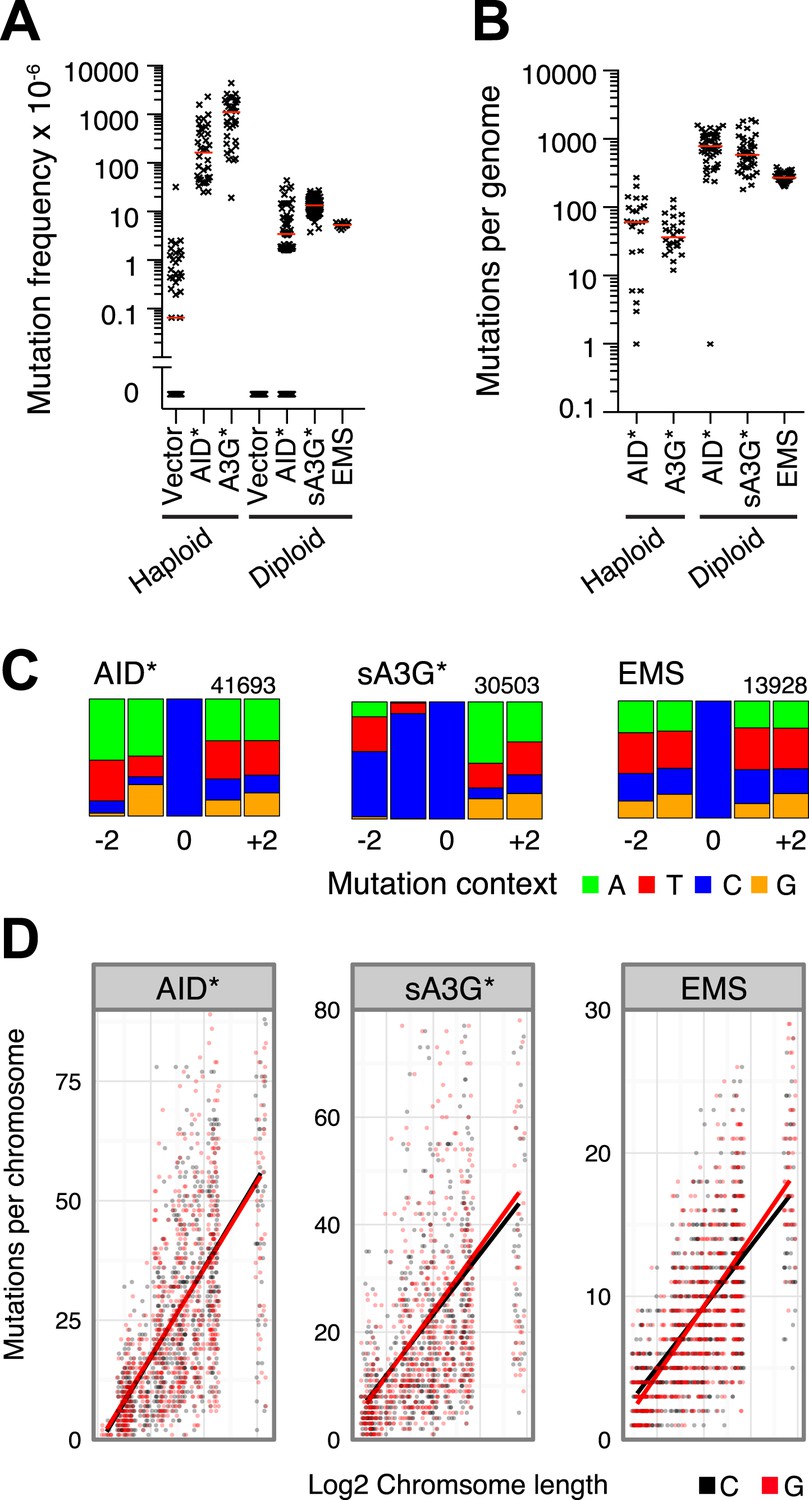
Genome wide distribution and signature of unclustered deaminase induced mutations in ung1Δ diploid yeast.
(A) Mutation frequency (expressed as the number of canavinine resistant colonies per 106 ) at the CAN1 locus in ung1Δ haploid yeast (data in part from Taylor et al., 2013) and ung1Δ/ung1Δ diploid yeast transformants expressing AID/APOBEC proteins or upon treatment with 0.2% EMS. Red bars indicate the median mutation frequency (n = 12–126 colonies). (B) Genome wide SNV number in ung1Δ haploid and ung1Δ/Δ diploid yeast transformants expressing AID/APOBEC proteins or with EMS treatment. Red bars indicate the median mutation per genome (n = 25–50 independent clones). (C) Sequence context of mutations at G•C pairs in diploid yeast genomes (indicated as mutations at cytosines) exposed to AID*, sA3G* or EMS mutagenesis. The numbers indicate total mutations per dataset, with the height of colour bars proportional to the frequency of each base found in the vicinity of a mutation. (D) Distribution of mutations per diploid yeast chromosome expressed as the number of mutations per chromosome in each independent genome against the chromosome length. The bars represent the projected linear trend for mutations at C (in black) or G (in red).
Figure 2 with 2 supplements
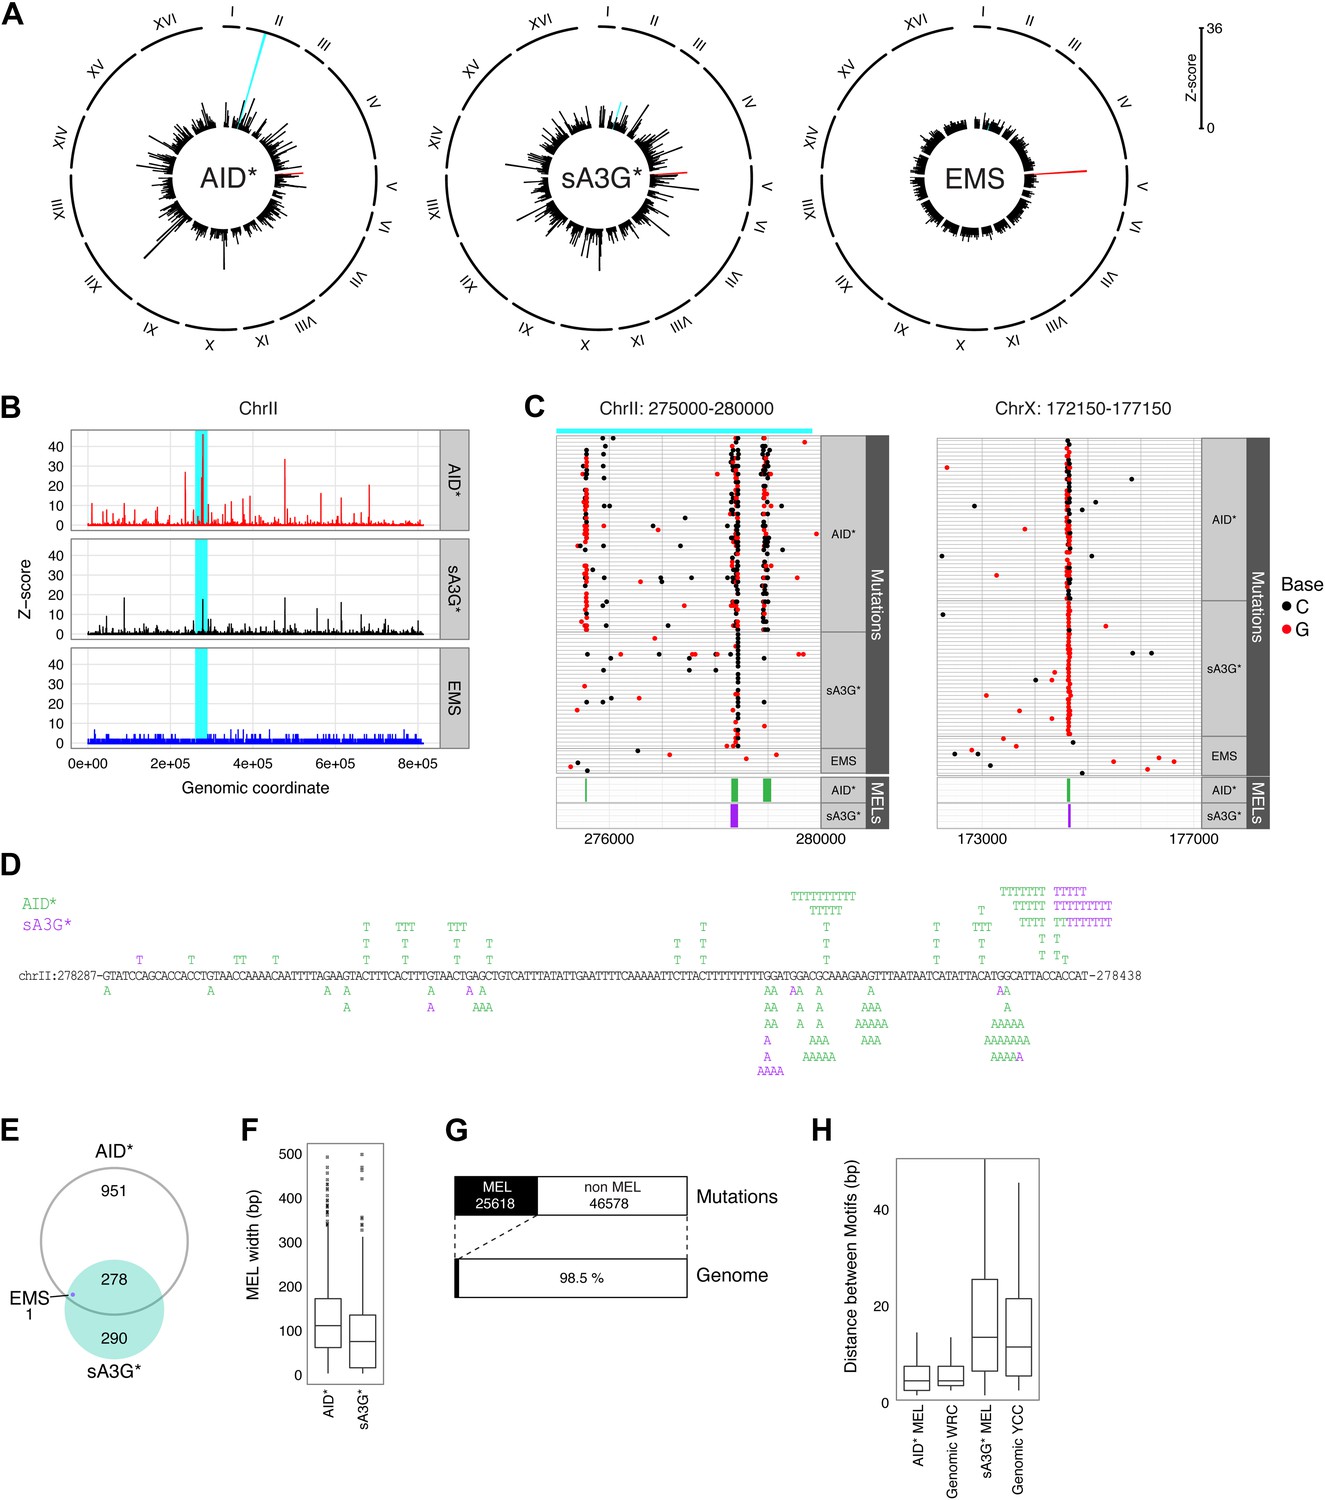
Mutation enriched loci (MELs) identified by focussed deaminase-induced mutation.
(A) Radial histograms depict the density (Z-score) of pooled mutations for each dataset in 2 kb overlapping genomic segments along each chromosome. The CAN1 locus is highlighted in red. The peak highlighted in cyan is further enlarged in panels (B), (C) and (D). (B) Mutation densities along ChrII in AID* (red), sA3G* (black) and EMS (blue) treated genomes, expressed as the Z-score of mutation density per dataset (y-axis) along chromosome II (x-axis; 200 bp bin size). The region shadowed in cyan is magnified in (C). (C) Regions of high mutation density identify narrow mutation enriched regions (MELs), shown as green boxes for AID* and purple boxes for sA3G* in the bottom panel. Horizontal lines represent a single genome with each non-clonal mutation at C or G indicated by a dot (black or red respectively). Regions in Chr II and Chr X containing mutation enriched loci shown at the same scale, with the genomic coordinates indicated. (D) Mutations in the pronounced MEL on ChrII (highlighted cyan in panels (A), (B) and (C) shown in green for AID* and purple for sA3G*. Coordinates are indicated. (E) Overlap of detected MELs in AID*, sA3G* and EMS datasets. (F) Distribution of MELs width with the median indicated for AID* and sA3G* mutated genomes. (G) Fraction of the total deaminase mutations in MELs (black boxes) relative to genomic coverage of MELs. (H) Distribution of distances between AID and A3G mutable motifs within MELs vs genome wide mutable motif distances.
Figure 2—figure supplement 1
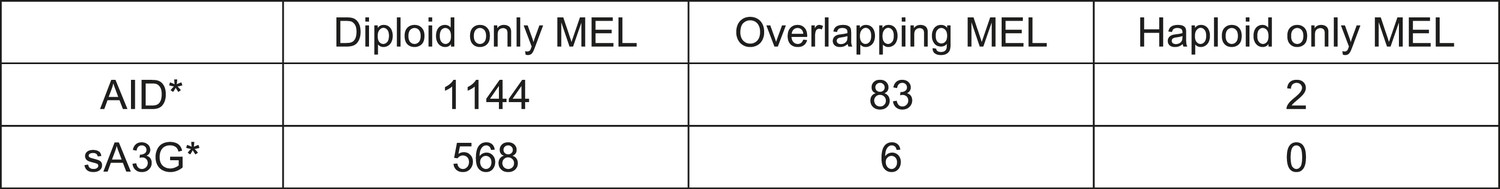
Overlap between Haploid and Diploid MELs.
https://doi.org/10.7554/eLife.03553.005
Figure 2—figure supplement 2
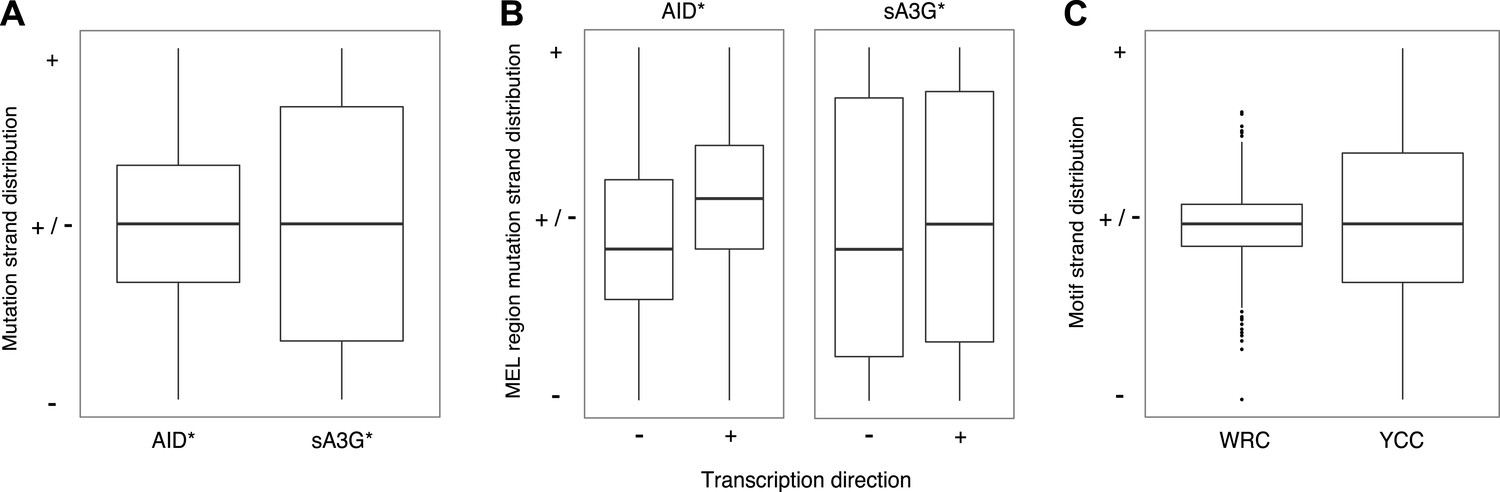
Strand bias in deaminase induced mutations calculated as fraction of mutations at C (+strand) or G (- strand) within each MEL.
(A) Strand distribution of mutations within AID* and sA3G* MEL regions. MELs comprising a single base were excluded. (B) Strand distribution of mutations within MEL regions in relation to the direction of transcription of the associated gene. (C) Strand distribution of WRC and YCC deaminase motifs within MEL regions and their flanking 50 base pairs.
Figure 3 with 4 supplements
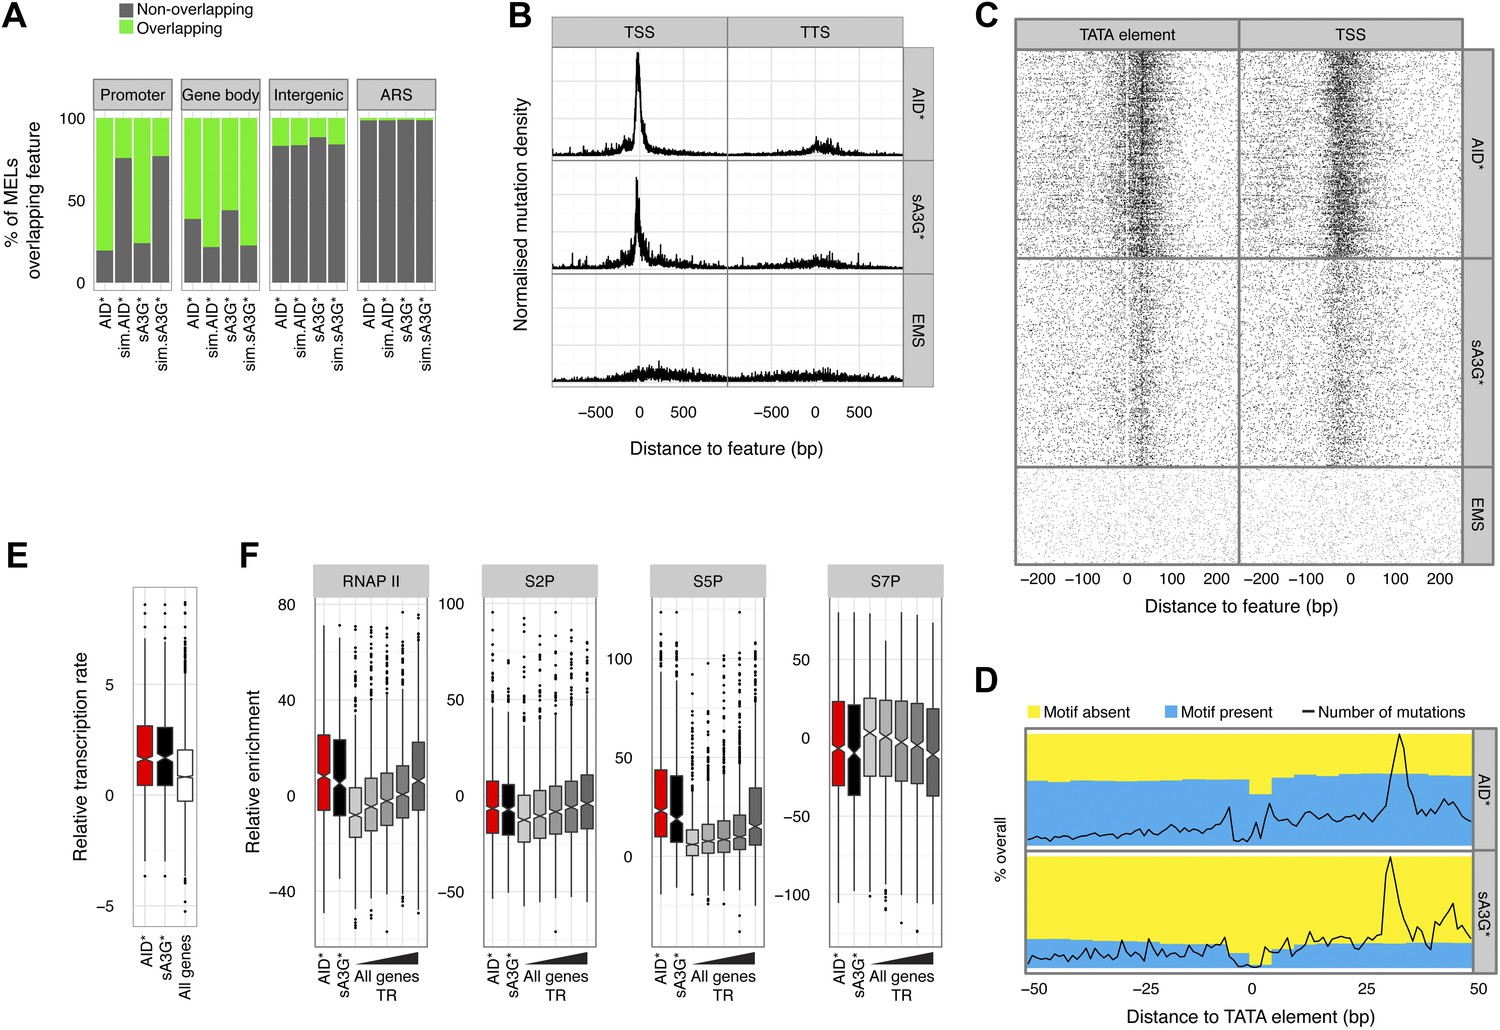
Deaminase mutation footprints are focussed to the pre-initiation complex region of active promoters.
(A) Proportion of promoters, gene bodies, intergenic regions and replication origins (ARS) harbouring a MEL (green) or not (grey) for AID* and sA3G* datasets vs the expected distribution (sim.AID*sA3G*) determined by Monte Carlo simulation of equivalent sized fragments for each MEL dataset distributed randomly across the genome. (B) Density of mutations in relation to their distance to the nearest transcription start site (TSS) of mRNA (RNAP II) transcripts compared to the density relative to transcription termination sites (TTS). Data includes all mutations in addition to MELs. (C) Deaminase mutations relative to the TATA or TATA-like element for each RNAP II promoters (Rhee and Pugh, 2012) compared to the mutation distance distribution aligned to the transcription start site (TSS). (D) Proportion of AID* or sA3G* mutable motifs within RNAP II promoter regions, centred on the TATA-elements (Rhee and Pugh, 2012). Total number of mutations for each dataset is shown at each position (black line). (E) Relative transcription rates (see methods) at RNAP II promoters targeted by MELs compared to relative transcription rates for all RNAP II genes in gal induced conditions (García-Martínez et al., 2004). (F) Relative enrichment of RNAP II and RNAP II CTD phosphorylation (S2P, S5P and S7P) in promoters containing AID* (red) and sA3G* (black) MELs and all RNAP II promoters (grey) ranked according to transcriptional activity (García-Martínez et al., 2004).
Figure 3—figure supplement 1
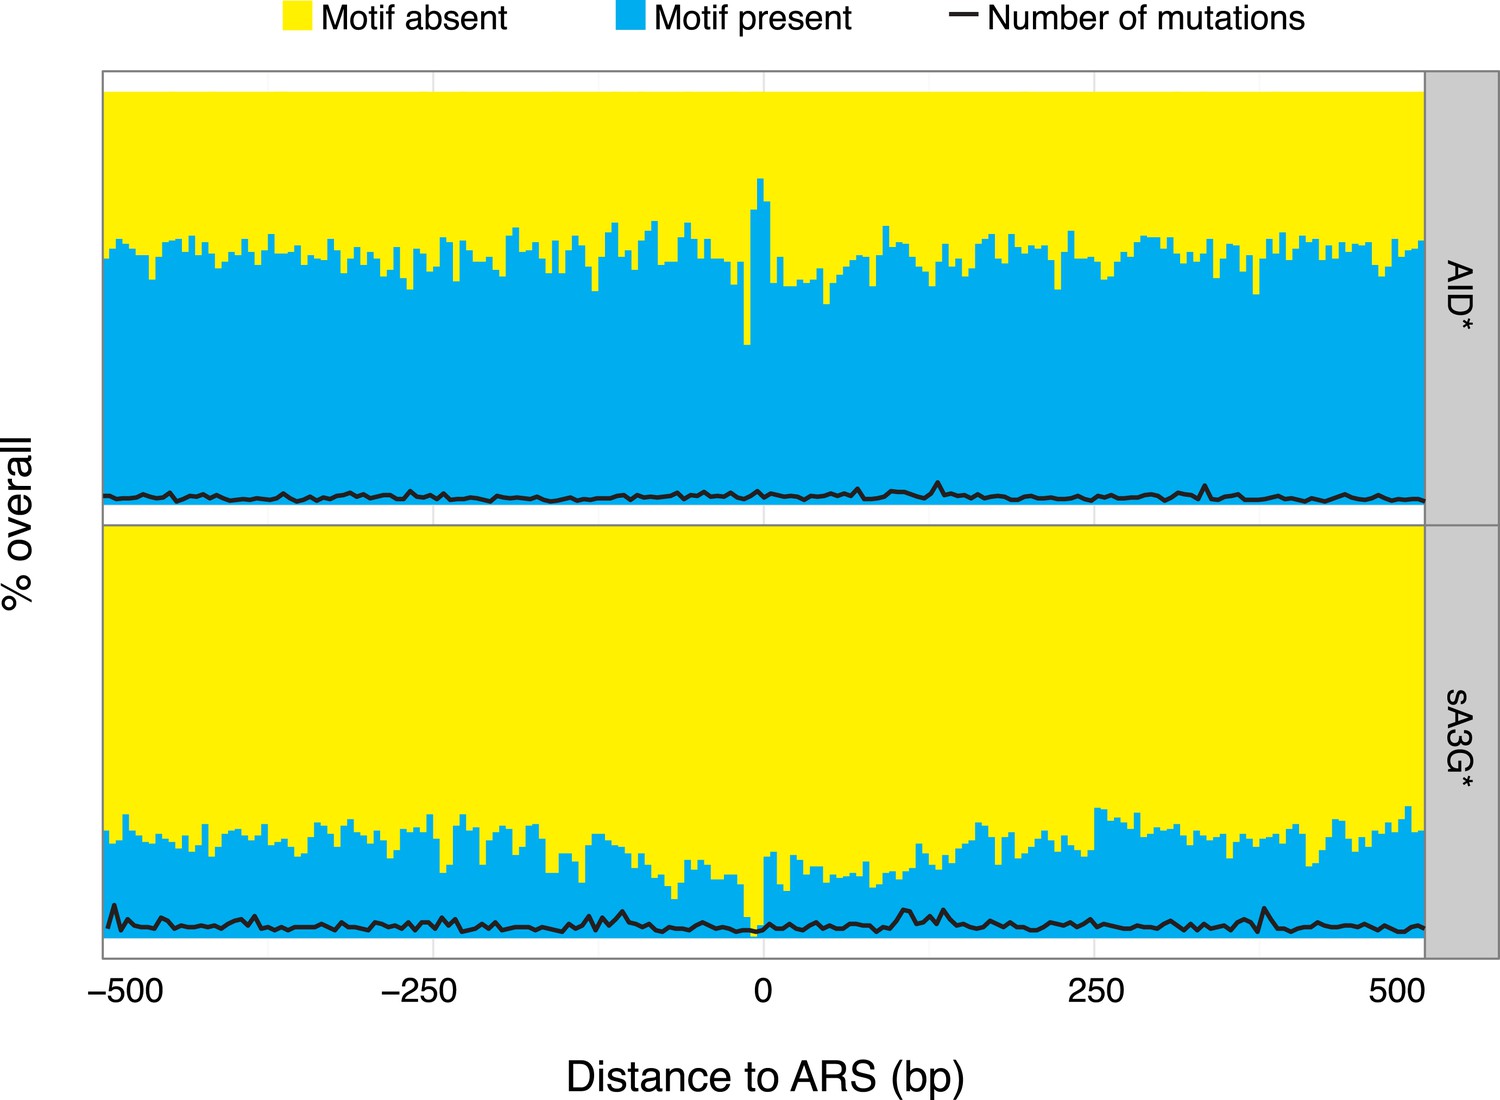
Paucity of deaminase mutations at replication origins is not a consequence of absence of mutable motifs.
Proportion of AID* or sA3G* mutable motifs around replication origins (ARS), depicted as in Figure 3D. Total number of mutations for each dataset is shown for at position (black line, scale as in Figure 3D).
Figure 3—figure supplement 2
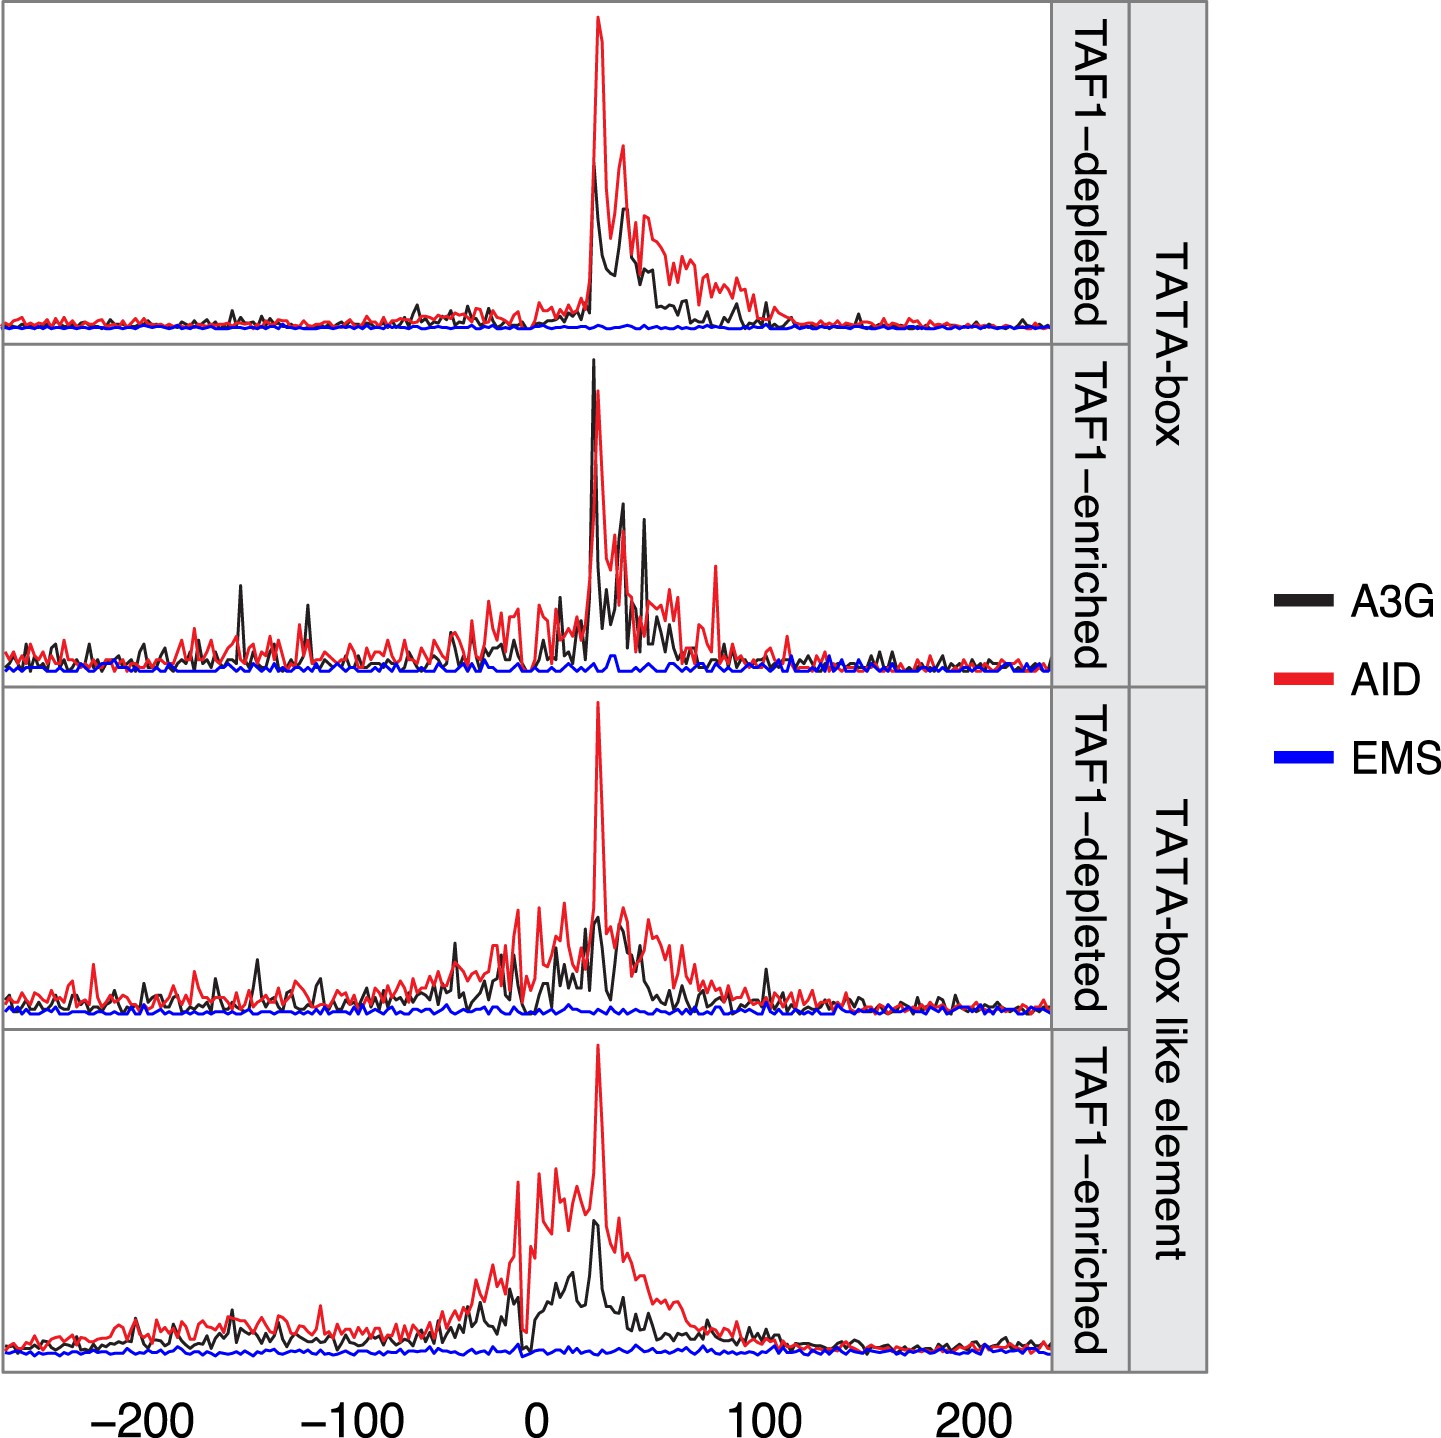
Density of mutations in relation to their distance to the nearest TATA box or TATA-like element.
Mutations are grouped according to the TAF1 enrichment status (data from Rhee and Pugh, 2012) with the line colour depicting the mutator (AID*, red; sA3G*, black; EMS, blue). Data includes all mutations in addition to MELs.
Figure 3—figure supplement 3
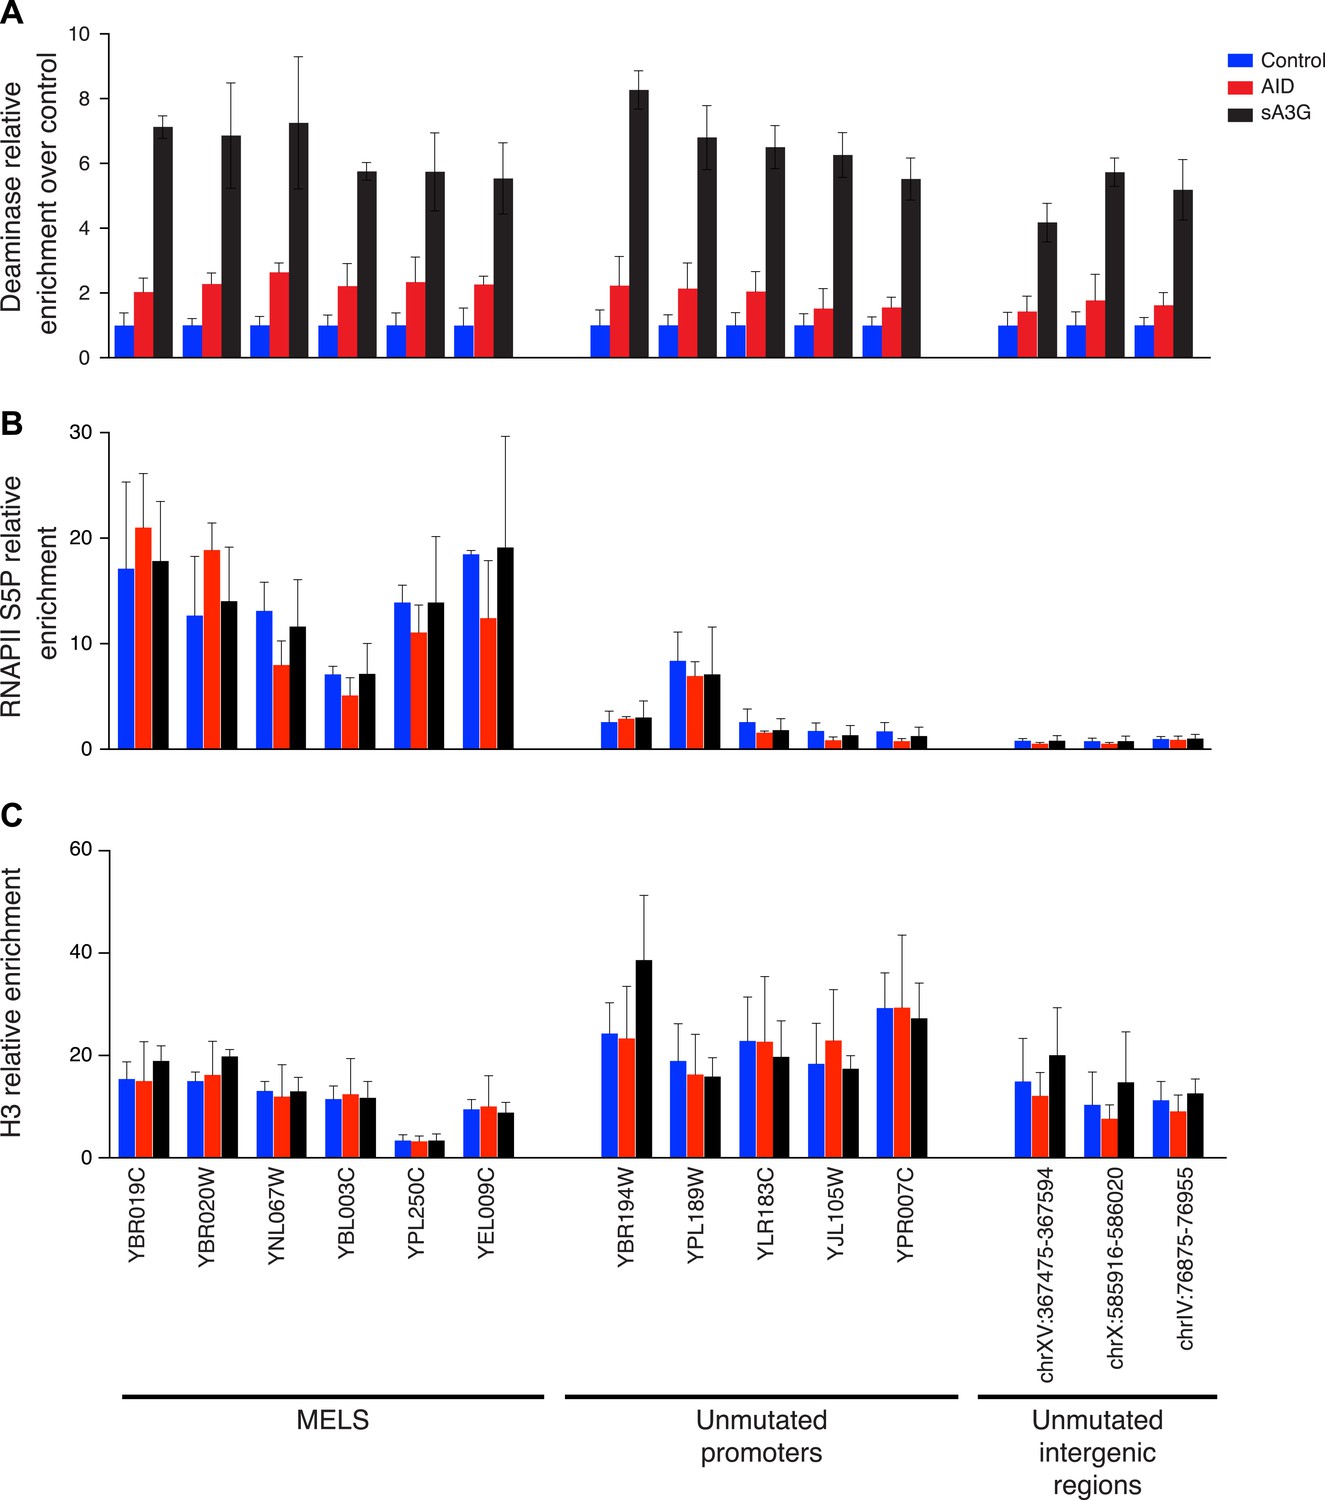
Distribution of the deaminases on chromatin is unrelated to mutation preferences.
Enrichment of (A) deaminase, (B) serine 5 phosphorylated RNAPII and (C) Histone H3 at MEL promoters, unmutated promoters and intergenic regions. Enrichment is shown relative to input chromatin (B and C) or further normalised to control cell lines (A). Data from 2–3 independent experiments.
Figure 3—figure supplement 4
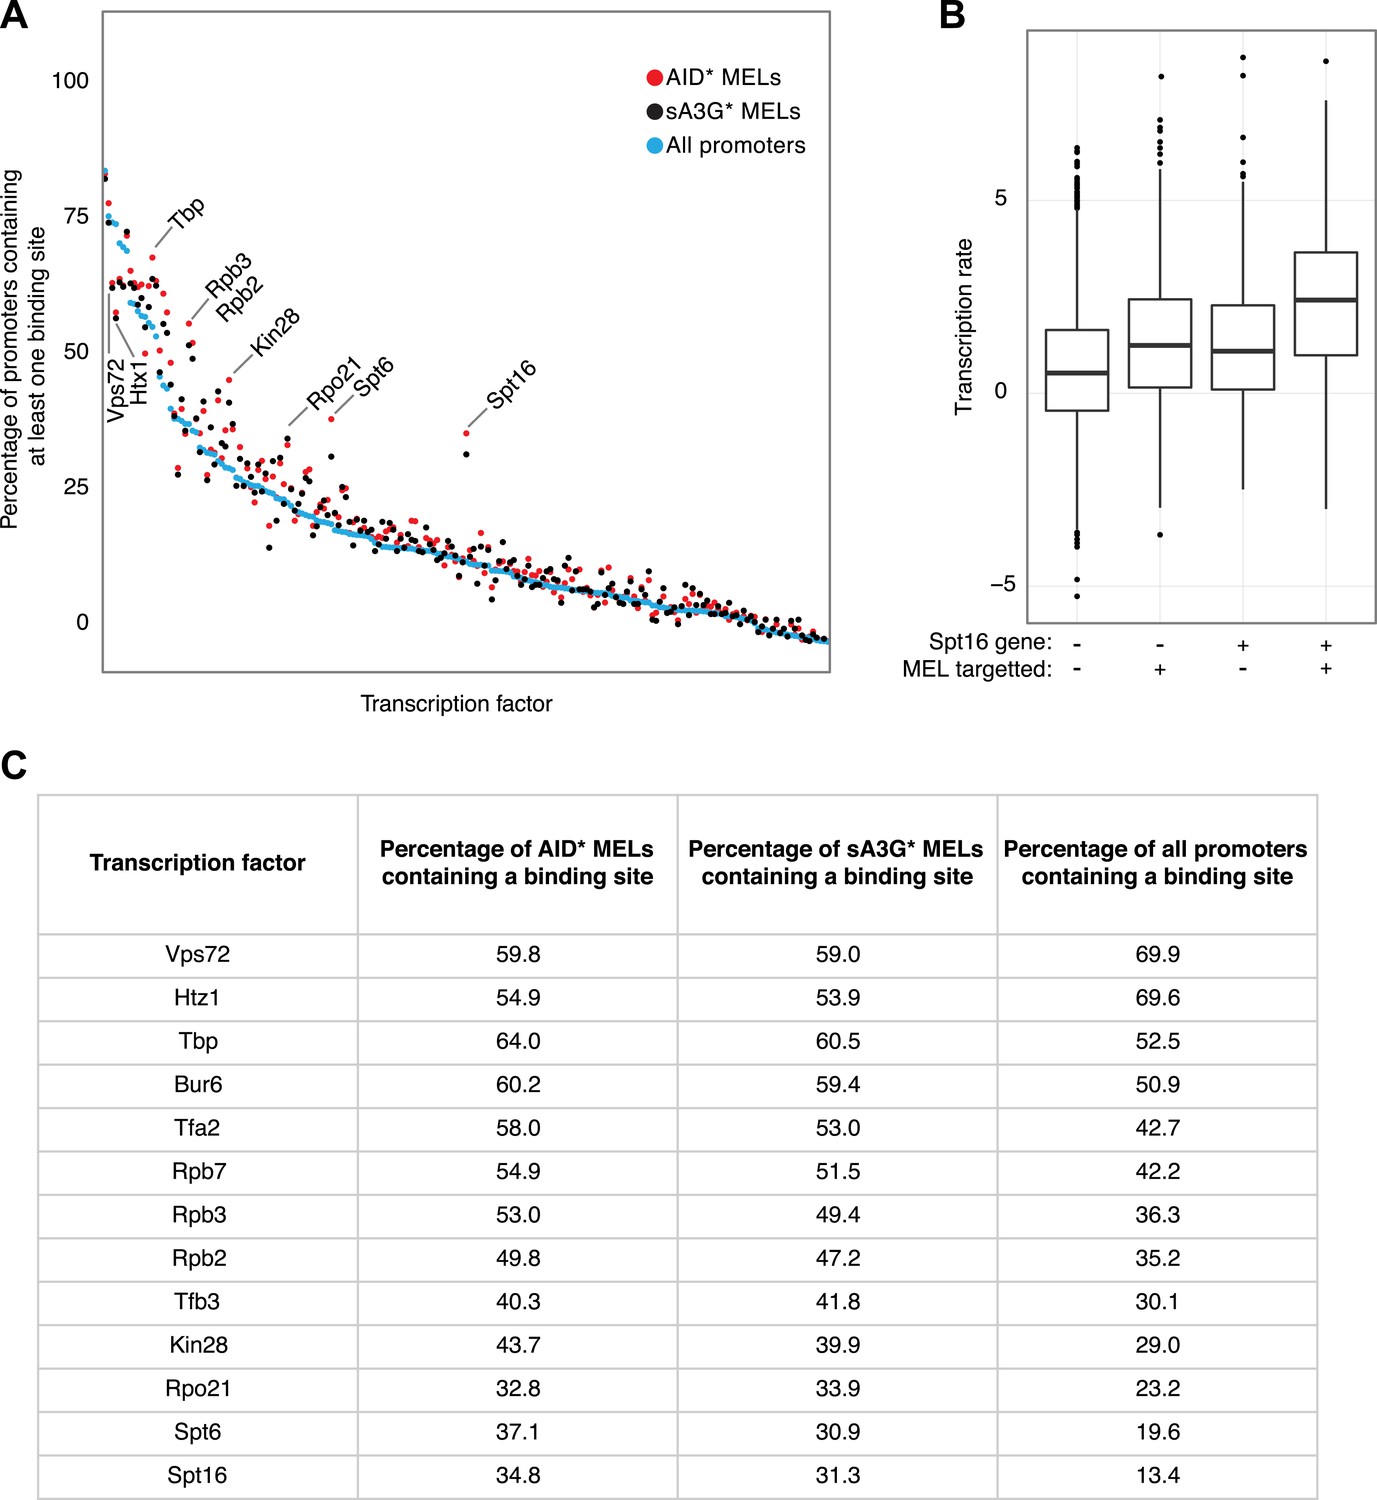
Transcription factor binding sites compared to MEL preferences.
(A) Frequency of each yeast transcription factor at individual promoters as described in (Venters et al., 2011) (blue dots) compared with the frequency that the transcription factor appears in the promoter of genes containing AID* (red dots) and sA3G* (black dots) MELs. Factors are ordered according to number of binding sites in all promoters. Basal transcription factors are the most commonly associated with deaminase targeted promoters (labelled). (B) Transcription rates of genes grouped according to Spt16 promoter occupancy and presence of MELs. (C) List of transcription factors found to vary in occupancy at MEL targeted promoters vs their overall frequency at all yeast promoters (Venters dataset). Transcription factors showing ±10% variation which are present in at least 25% of MELs are listed.
Figure 4 with 4 supplements
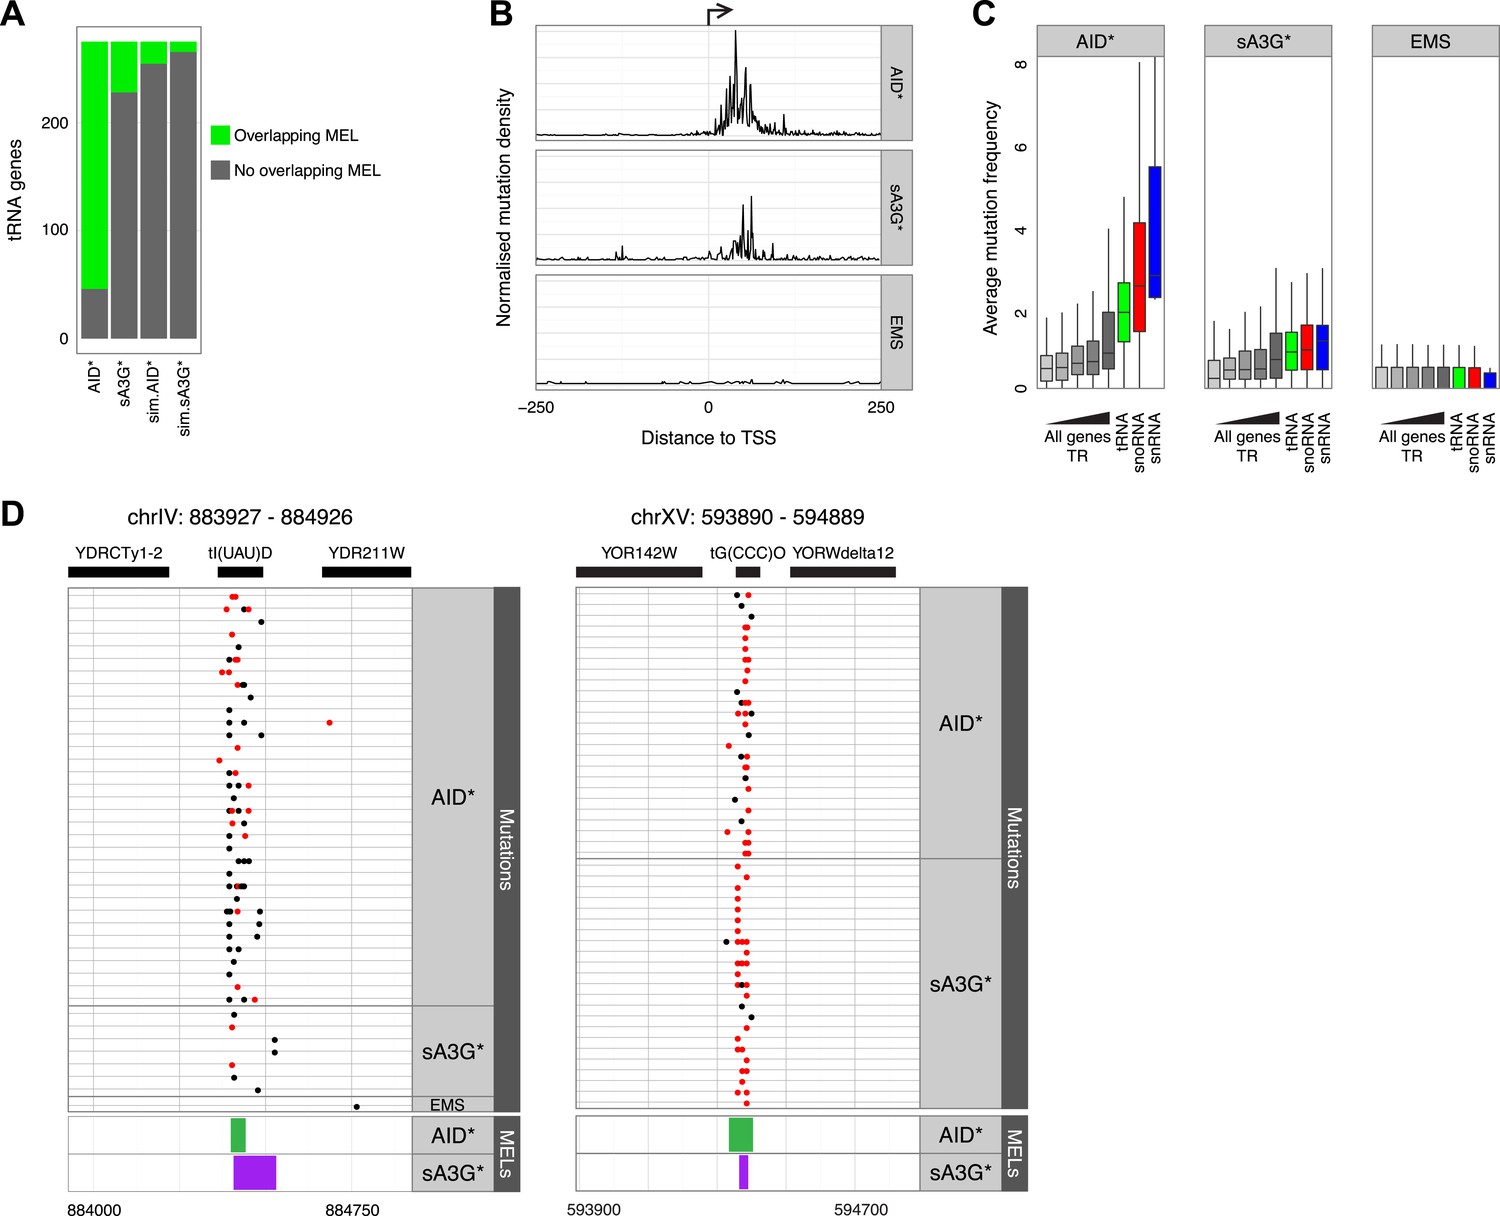
AID* and sA3G* target both RNAP II and RNAP III promoters.
(A) Number of tRNA genes harbouring (green) an AID* or sA3G* MEL compared with expected number from Monte Carlo simulations. (B) Density of mutations in relation to the transcription start site (TSS) of tRNA genes. Mutations within the 500 base pair interval centred at the TSS are included. (C) Mutation frequency in promoters of mRNA genes (within a window 500 bp upstream and 50 bp downstream of the TSS) compared to the frequency of mutations in the promoters of tRNA (550 bp window centred on the middle of the tRNA gene), snoRNAs and snRNA genes (550 bp window as for mRNA genes). mRNA genes are binned according to transcription rate as in Figure 3. Both RNAP II and III driven snoRNAs are included. (D) Example of MELs in ChrIV and ChrXV corresponding to tRNA tI(UAU)D and tG(CCC)O, depicted as in Figure 3.
Figure 4—figure supplement 1
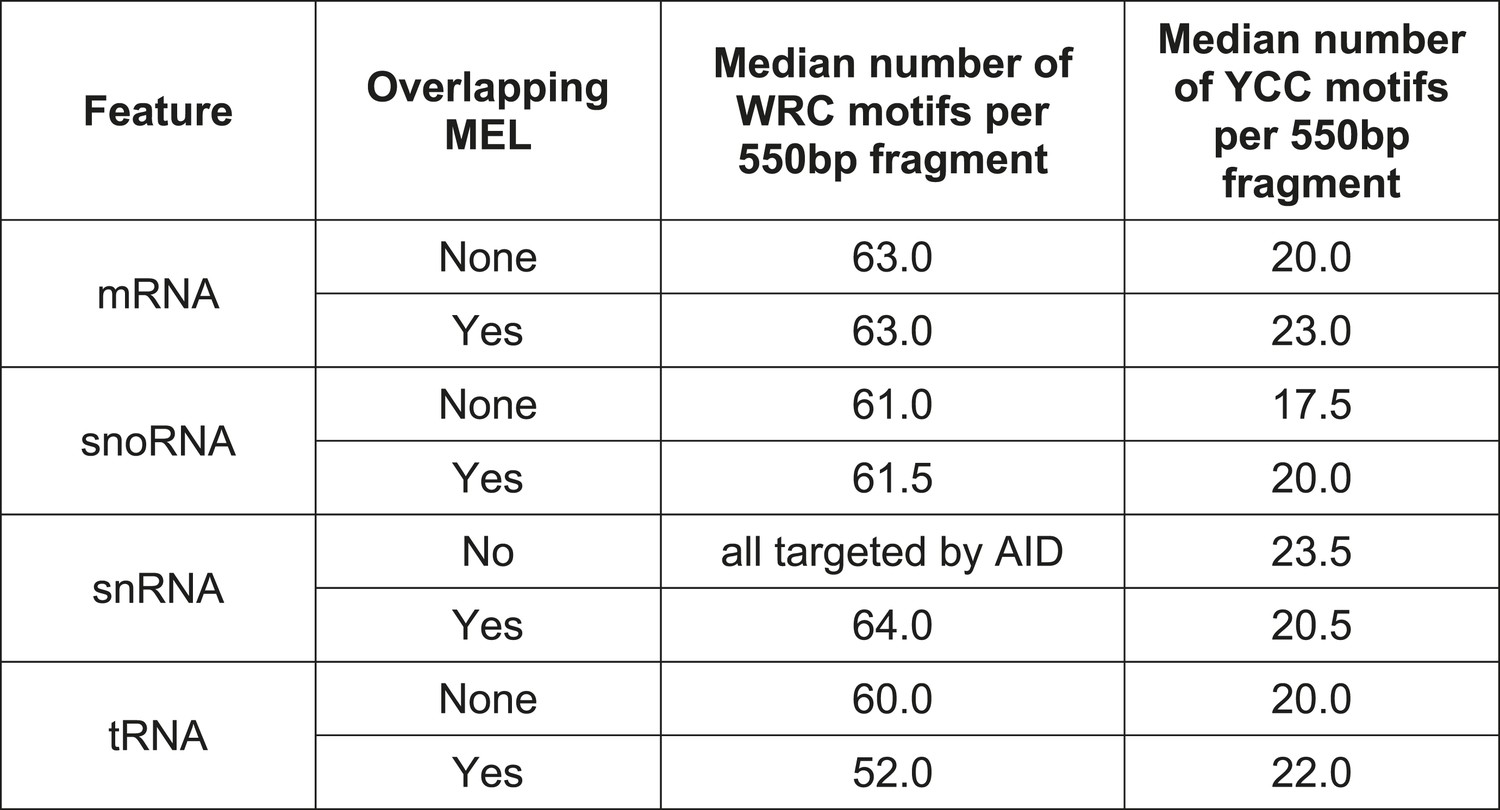
Median number of mutable motifs in promoter regions.
https://doi.org/10.7554/eLife.03553.014
Figure 4—figure supplement 2
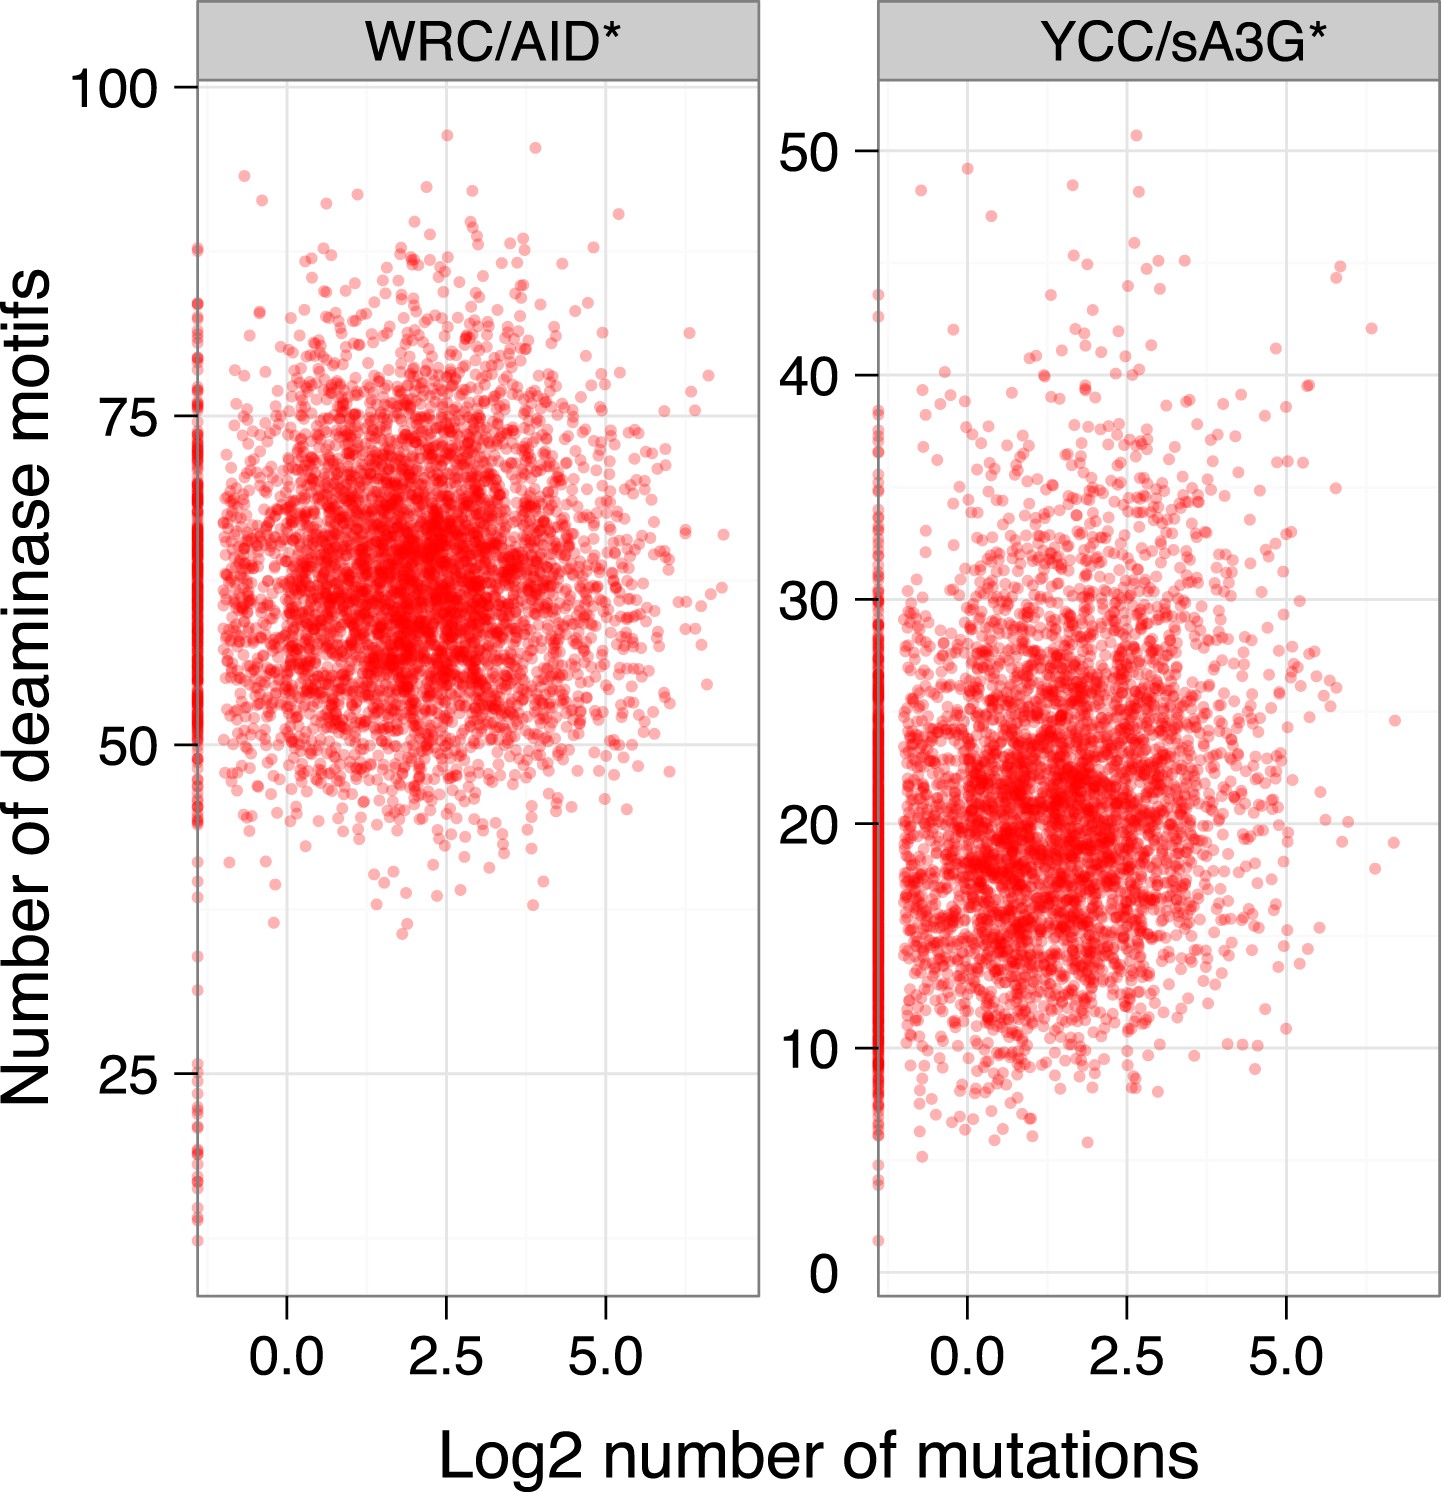
Mutationally enriched loci are not a consequence of increased density of mutable motifs.
The number of deaminase motifs for each MEL vs the number of mutations within each MEL for AID* and sA3G* datasets.
Figure 4—figure supplement 3
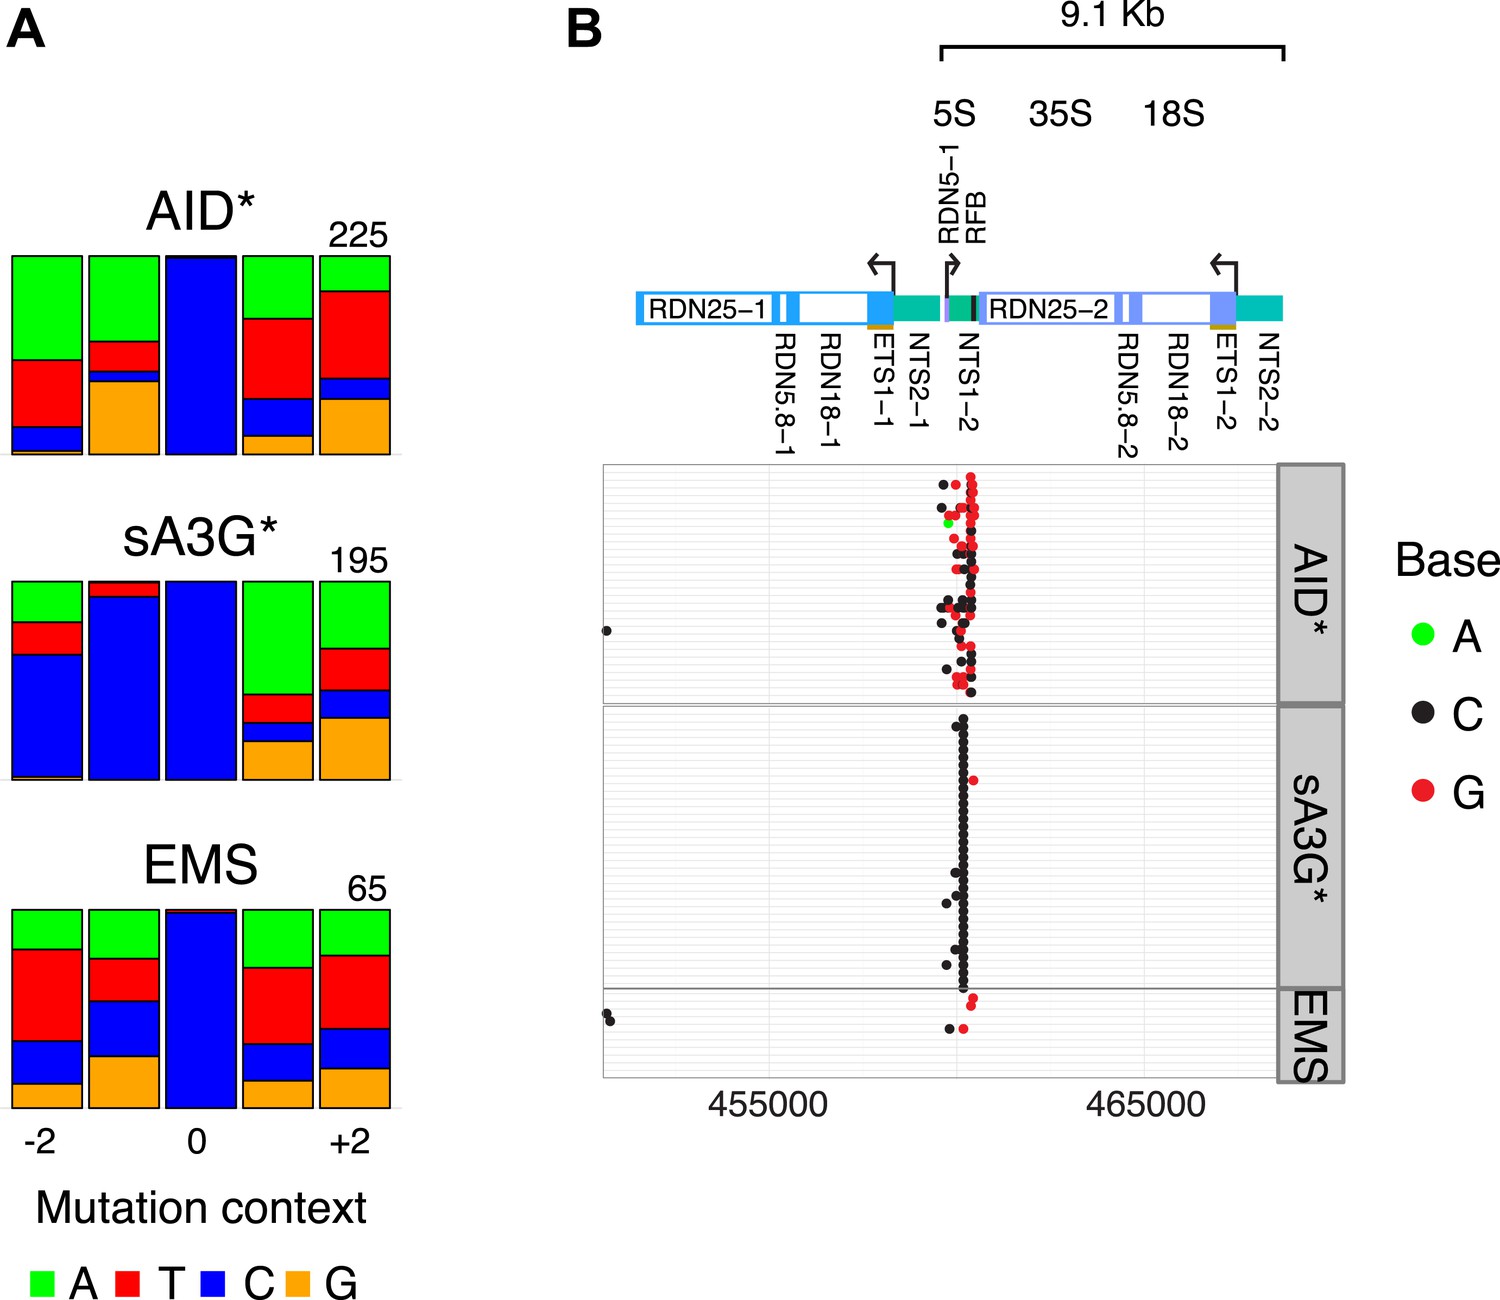
Mutations in the rDNA locus are restricted to the replication fork block (RFB) site.
(A) Sequence context of low allelic frequency mutations detected in the rDNA locus, as depicted in Figure 1C. (B) Schematic of the rDNA repeat region. Panels show mutations detected in yeast transformants at the rDNA locus. Each line represents one clone with dots representing mutations (mutation at C, black; at G, red; at A, green). Clones with no detected mutations are not depicted.
Figure 4—figure supplement 4
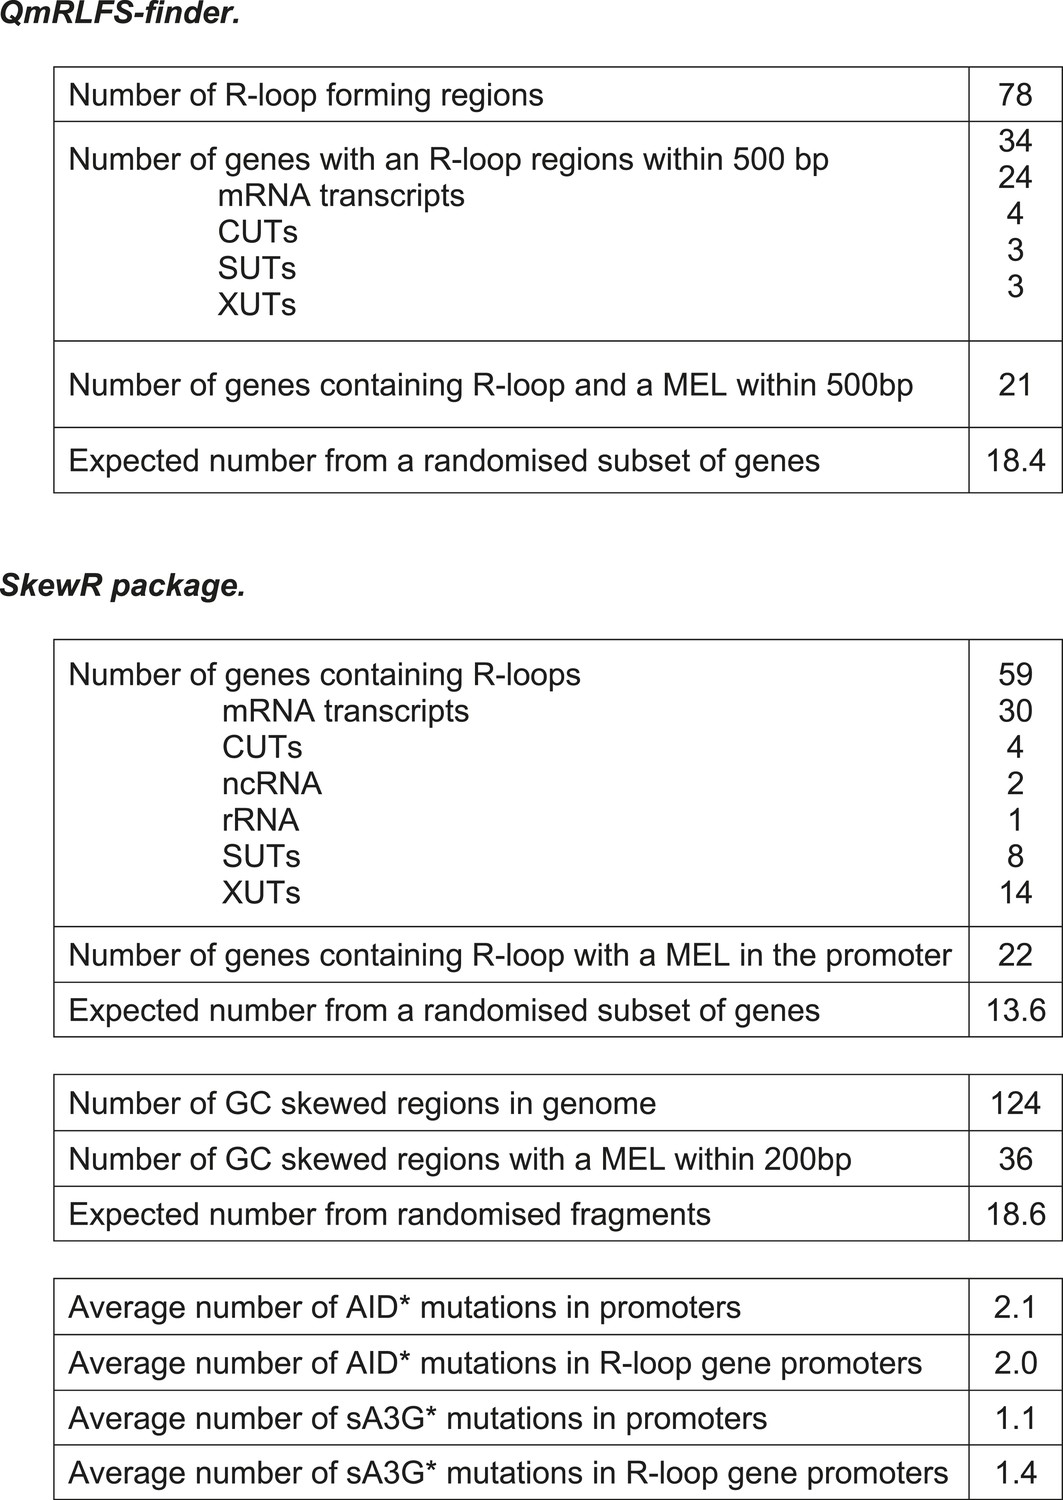
Deaminase induced mutation distribution in relation to R-loop forming potential.
Tables showing the correlation between R-loops formation predicted by the QmRLFS-finder (Wongsurawat et al., 2012) or SkewR package (Ginno et al., 2012) and the presence of MELs.
Figure 5 with 2 supplements
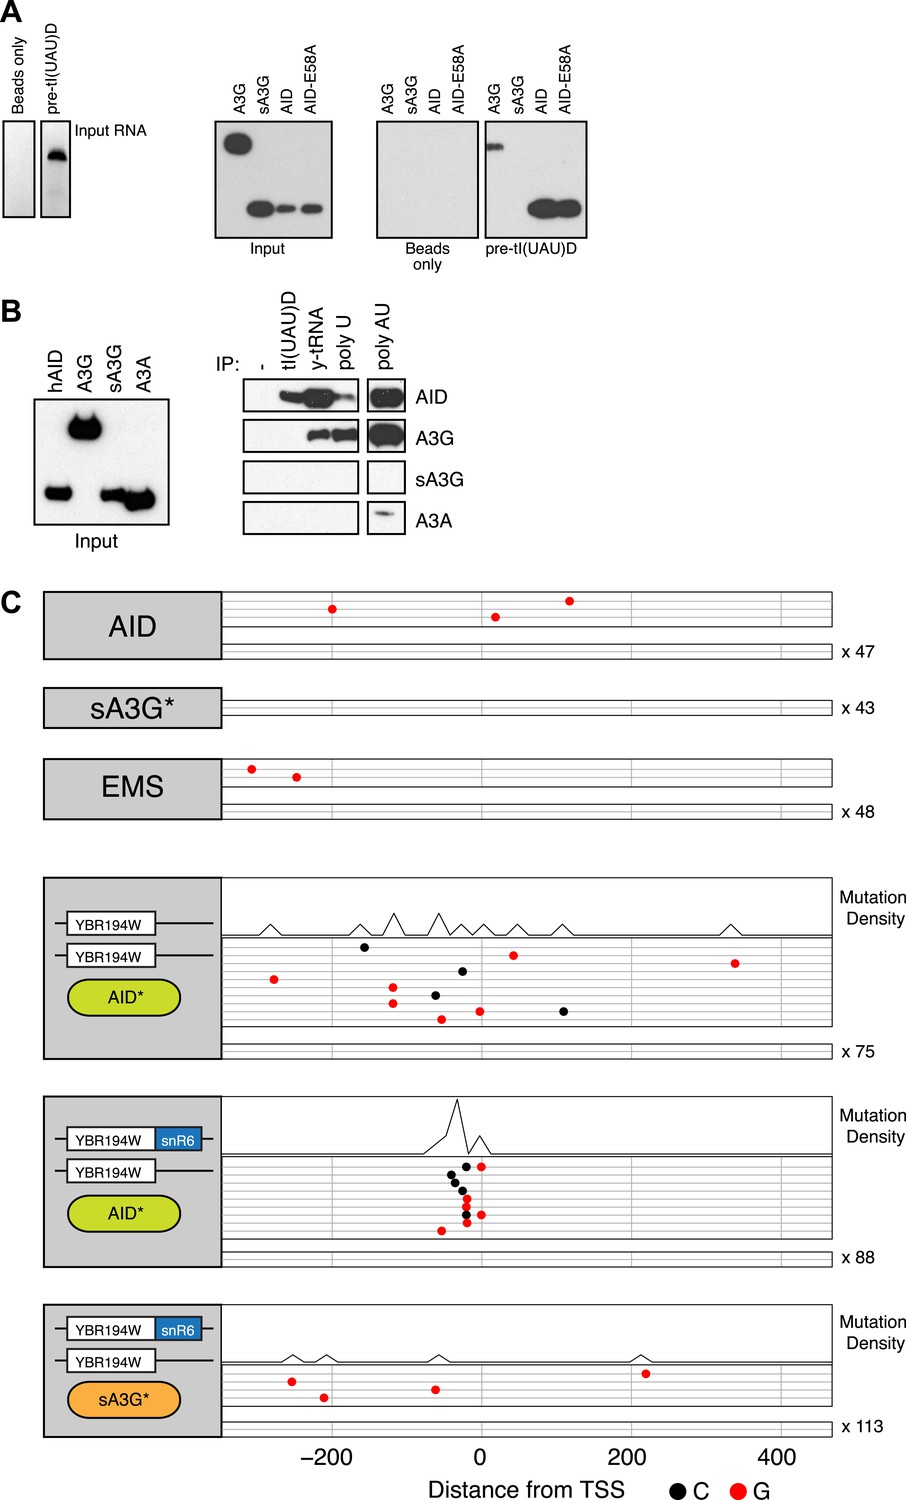
RNA binding by human AID and APOBEC3G.
(A) Left panel shows the in vitro transcribed pre-tI(UAU)D tRNA used for affinity purification. Right panel shows immunoblots for transiently overexpressed AID/APOBEC3G proteins following RNA-immunoprecipitation with pre-tRNA. (B) Affinity purification with tl(UAU)D probe, total yeast tRNA, homopolymeric single stranded (polyU) and double stranded (polyA:U) RNA. Left panel shows input proteins, right panel shows immunoblots for transiently overexpressed AID/APOBEC3 proteins following RNA-immunoprecipitation. Results representative of at least 3 independent experiments. (C) Deaminase induced mutations in the promoter region of the YBR194W locus. Top panels: accumulated mutations in the AID*, sA3G* and EMS whole genome datasets. Bottom panels: mutations detected in Sanger sequenced yeast clones unmodified or harbouring a chimeric YBR194W-snR6 locus. Each line represents one clone with dots representing mutations (at C, black; at G, red). Clones with no mutations are indicated.
Figure 5—figure supplement 1
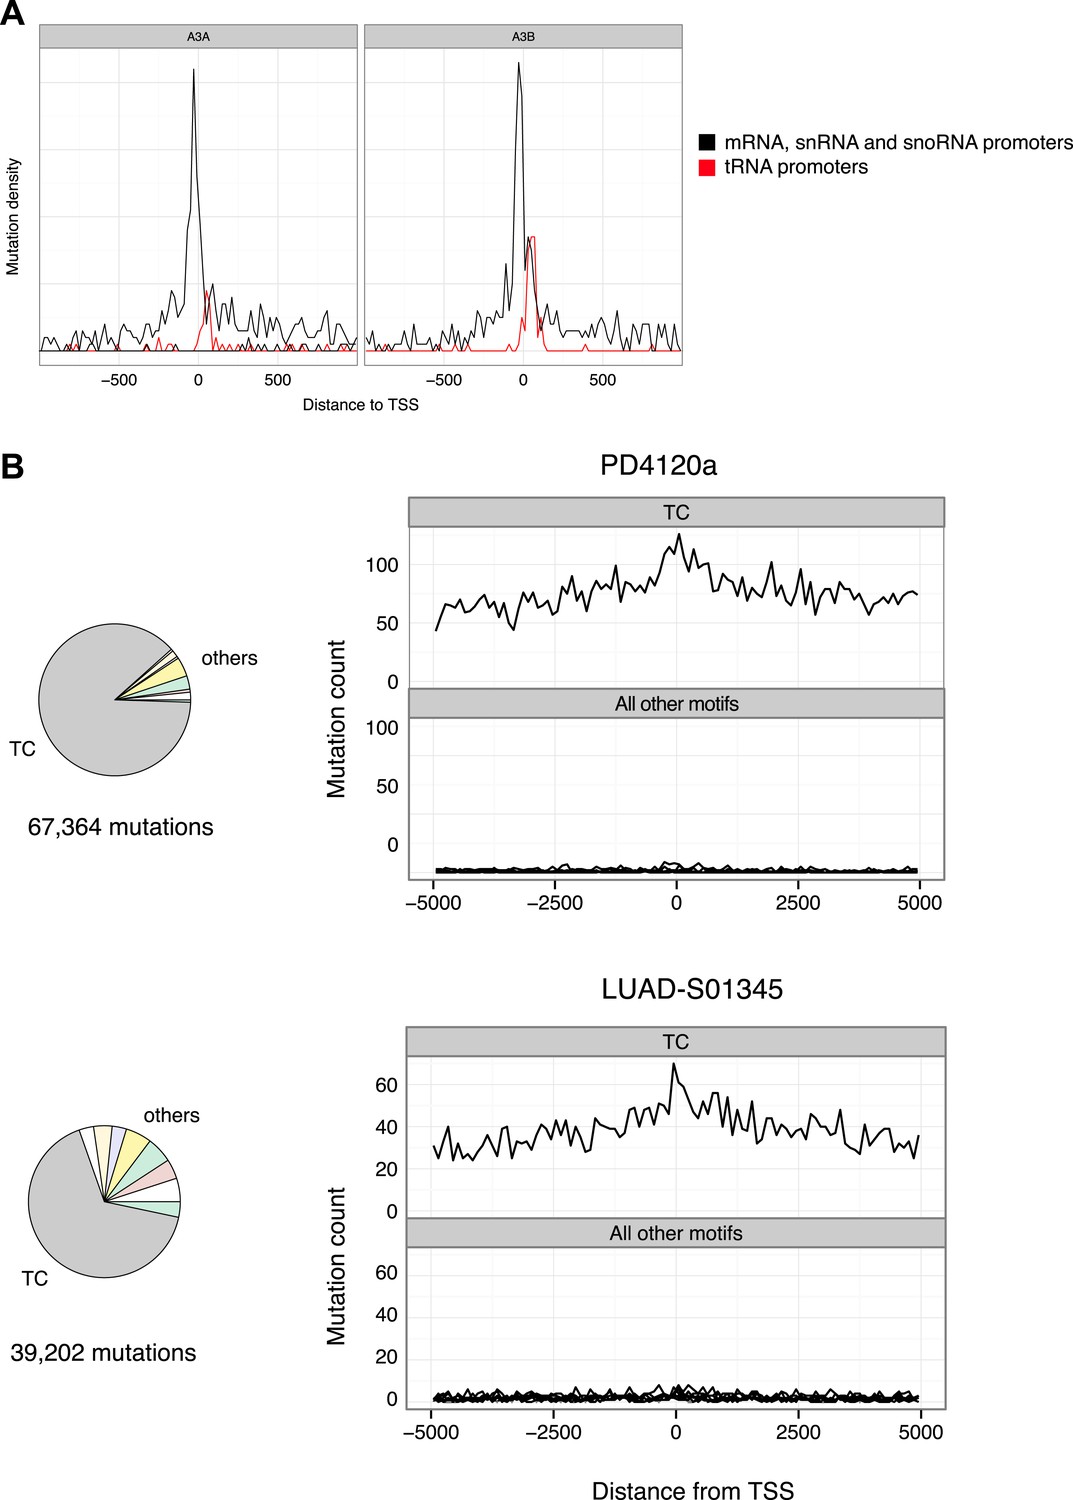
Promoter mutations are driven by APOBEC3A and 3B and are a feature of cancer genomes enriched for TC mutations.
(A) Mutation density relative to the TSS for APOBEC3A and APOBEC3B induced mutations from ungΔ haploid cells (data from Taylor et al., 2013). The density at tRNA promoters is shown separately in red. (B) Mutations in breast cancer genome PD4120a and lung adenocarcenoma LUAD-S01345. Pie charts show the contribution of mutations at TC over mutations at the remaining dinucleotides and histograms show mutation density relative to all human TSS (Ensemble annotation).
Figure 5—figure supplement 2
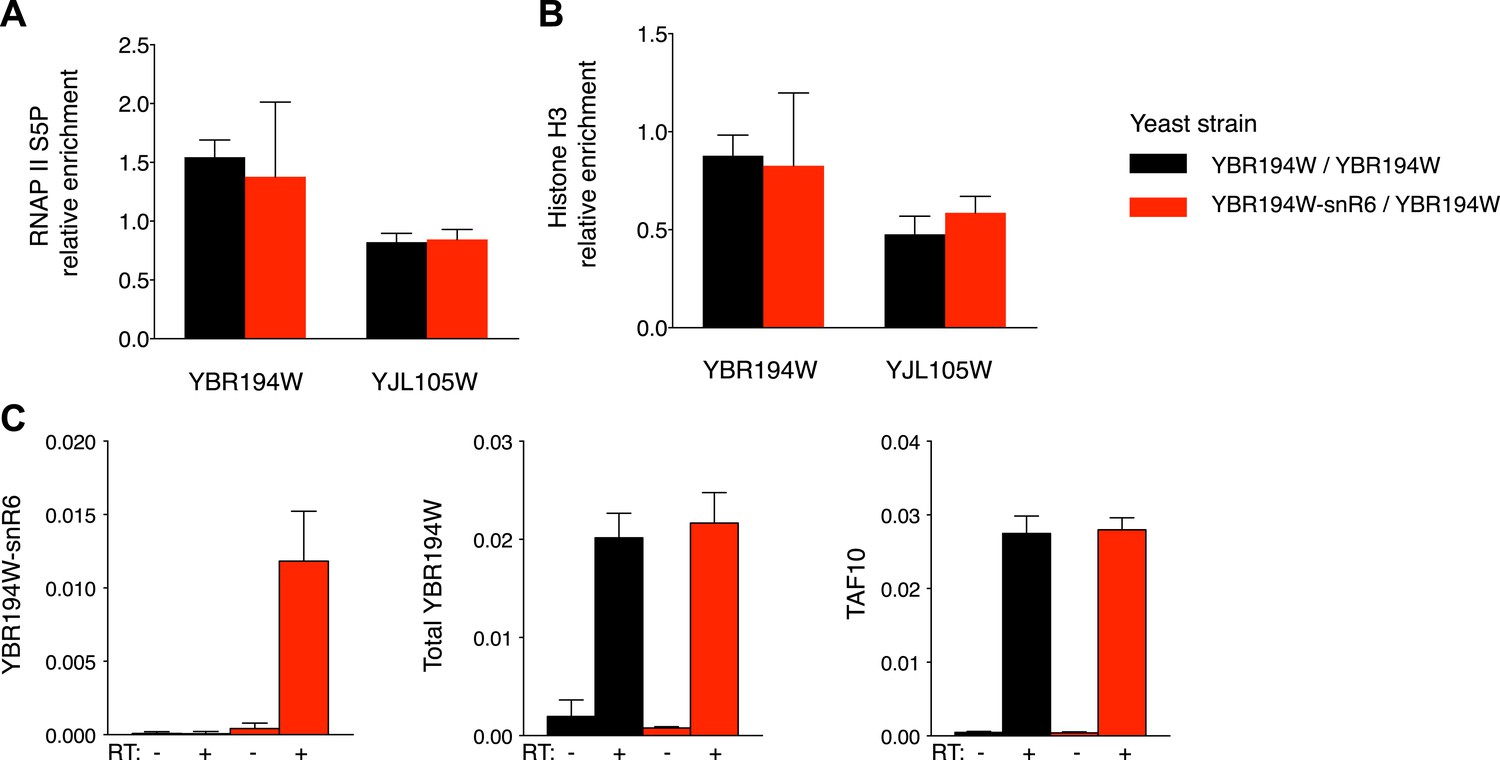
Functional comparison of the YBR194W locus in modified yeast clones.
(A) Immunoprecipitation of chromatin associated RNAP II or (B) Histone H3 from unmodified or YBR194W-snR6 chimeric yeast. Black bars show enrichment relative to input in the unmodified strain with the modified strain in red. An unrelated locus, YJL105W is shown as control. Data from three independent experiments. (C) mRNA levels of YBR194W shown relative to ACF1. Levels at the TAF10 gene are shown as a control. Data from three independent experiments.
Author response image 1
Tables
Table 1
Deaminase induced Mutation Enriched Loci (MEL) in yeast genomes
| Observed | Simulated | |||||
|---|---|---|---|---|---|---|
| AID* | sA3G* | EMS | AID* | sA3G* | EMS | |
| MELs | 1227 | 568 | 1 | 50 | 21 | 3 |
| % MEL mutation | 40.7 | 21.6 | 0.24 | 0.75 | 0.39 | 0.14 |
Additional files
-
Supplementary file 1
Catalogue of yeast mutations.
- https://doi.org/10.7554/eLife.03553.021
-
Supplementary file 2
Coordinates of MELs.
- https://doi.org/10.7554/eLife.03553.022
-
Supplementary file 3
All mutationally enriched regions (MELs). Top panel indicate position of each non-clonal mutation indicated by a dot (at C, black; at G, red), with horizontal lines representing a single genome. Middle panel shows MELs (AID*, green; sA3G*, purple; EMS, grey). Bottom panel displays genomic features (including transcripts, replication origins, centromers), coloured according to feature type, with arrows indicating the direction of transcription. The coordinates of the region are indicated. Regions are ranked according to the number of mutations present.
- https://doi.org/10.7554/eLife.03553.023
-
Supplementary file 4
Scripts used for data analyses.
- https://doi.org/10.7554/eLife.03553.024
Download links
A two-part list of links to download the article, or parts of the article, in various formats.
Downloads (link to download the article as PDF)
Open citations (links to open the citations from this article in various online reference manager services)
Cite this article (links to download the citations from this article in formats compatible with various reference manager tools)
Active RNAP pre-initiation sites are highly mutated by cytidine deaminases in yeast, with AID targeting small RNA genes
eLife 3:e03553.
https://doi.org/10.7554/eLife.03553


