Structure and transport mechanism of the sodium/proton antiporter MjNhaP1
- Max Planck Institute of Biophysics, Germany
Figures
Figure 1
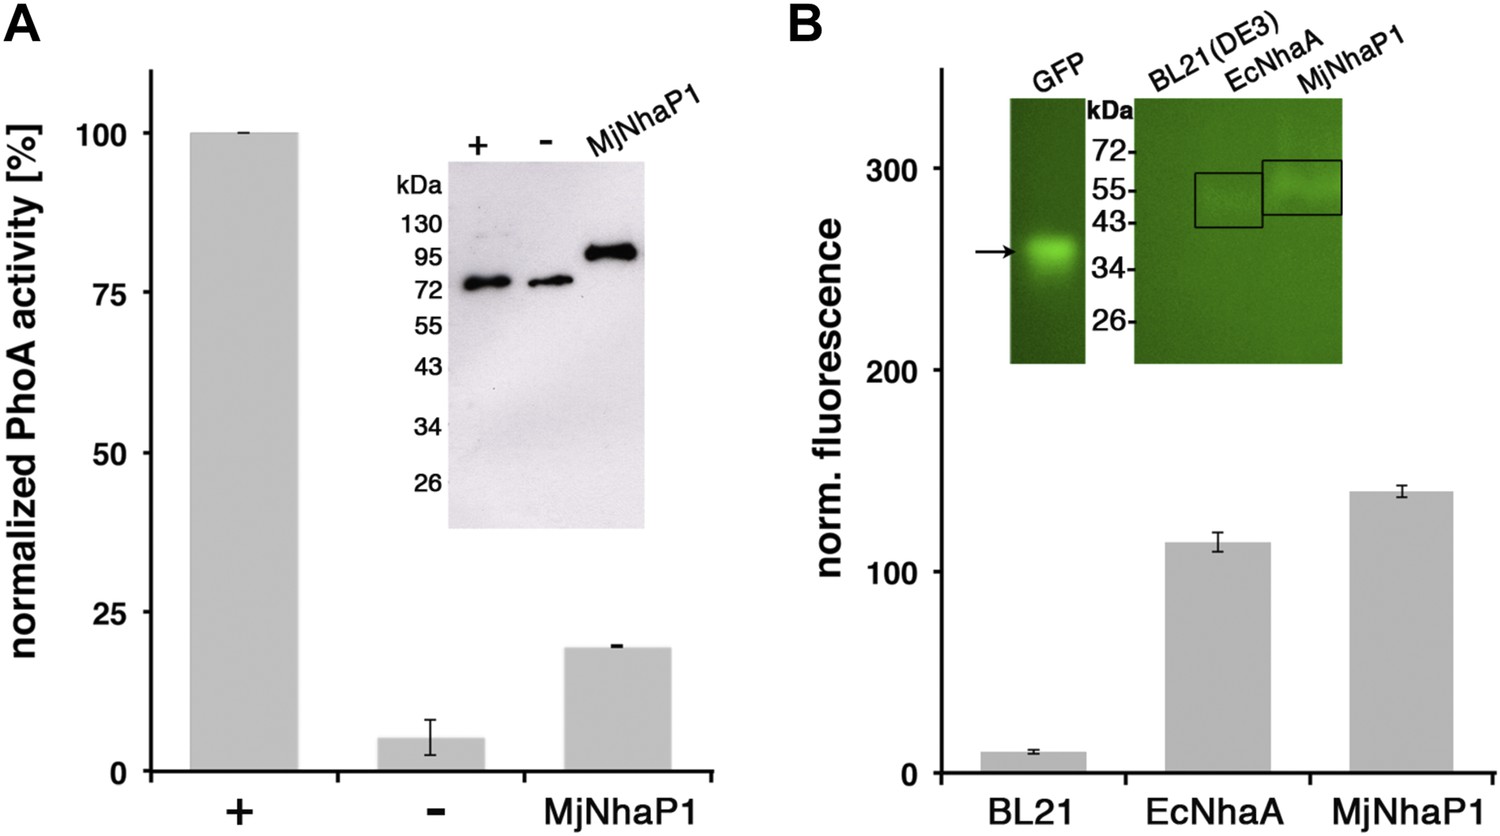
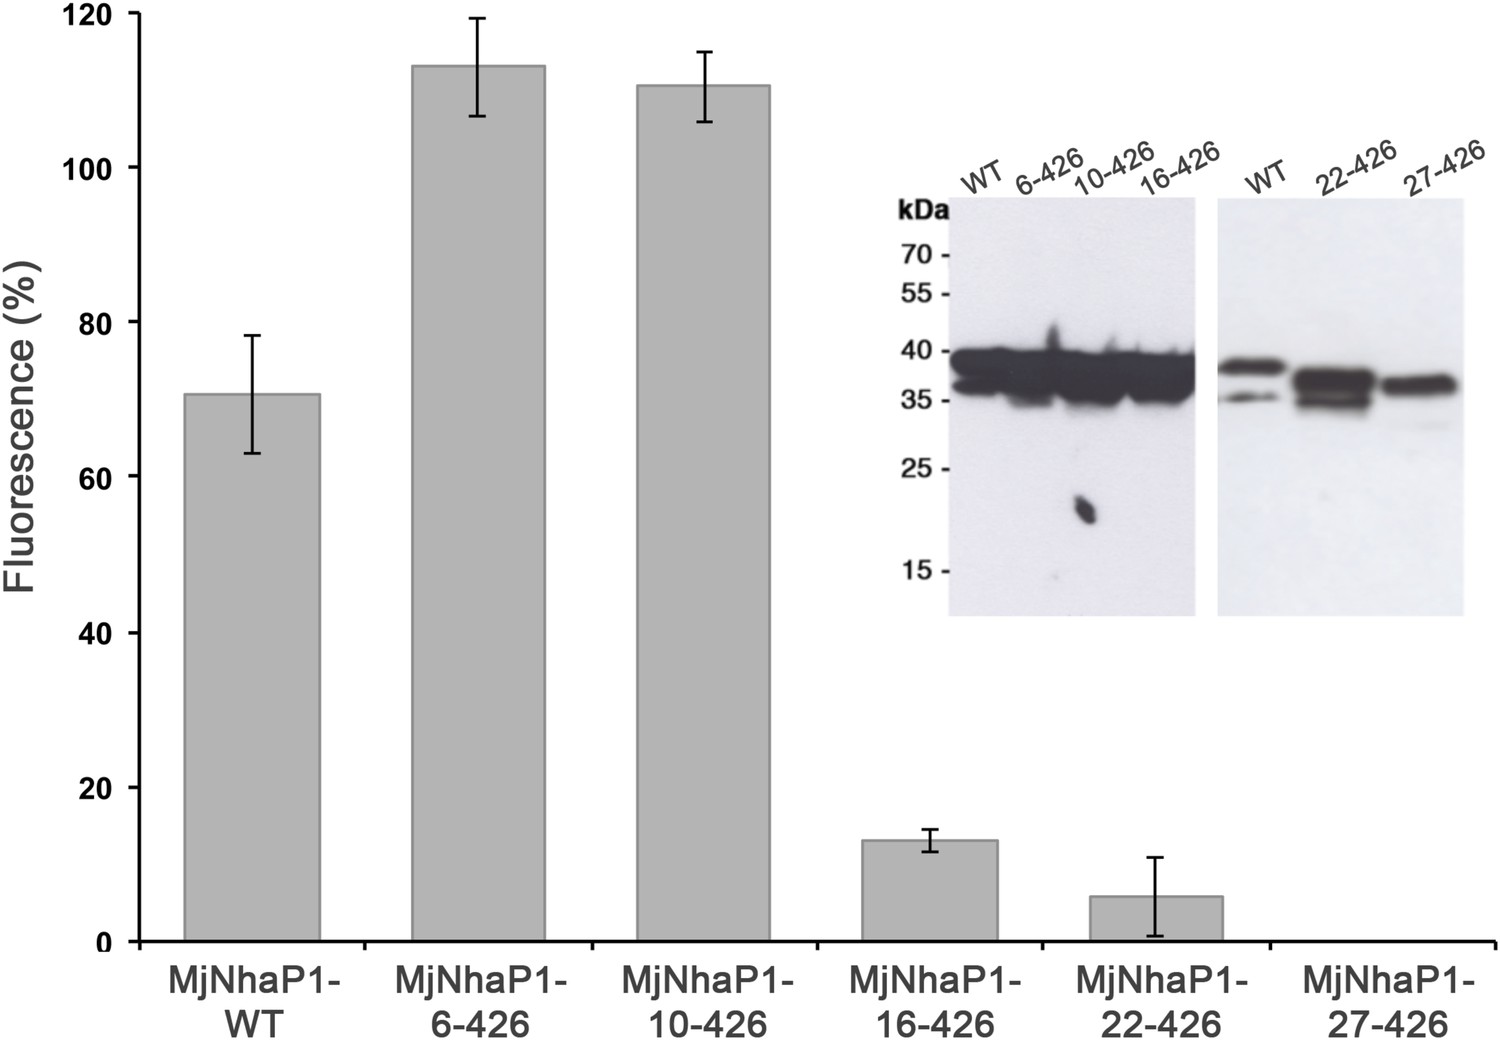
Membrane topology of MjNhaP1.
(A) PhoA activity assay. Enzymatic activity of a C-terminal MjNhaP1 fusion construct with alkaline phosphatase expressed in the PhoA-deficient E. coli strain CC118 was measured spectroscopically. PhoA is active only in the periplasm. (+) PhoA fused to the periplasmic C-terminus of YiaD or to the cytoplasmic C-terminus of YedZ were used as positive (+) or negative (−) controls. Western blot analysis (inset) shows that constructs were expressed at comparable levels. (B) GFP assay. Normalized whole-cell fluorescence of C-terminal MjNhaP1-GFP-fusion constructs expressed in BL21(DE3) cells. GFP is fluorescent only in the cytoplasm. EcNhaA, which has a cytoplasmic C-terminus, was used as positive control and untransformed BL21(DE3) cells as negative control. In-gel florescence of the constructs is shown in the inset. The activity of the positive control was set to 100%. The low activity of the PhoA construct, together with the fluorescence of the GFP fusion construct indicates that the C-terminus of MjNhaP1 expressed in E. coli is on the cytoplasmic side.
Figure 2 with 4 supplements
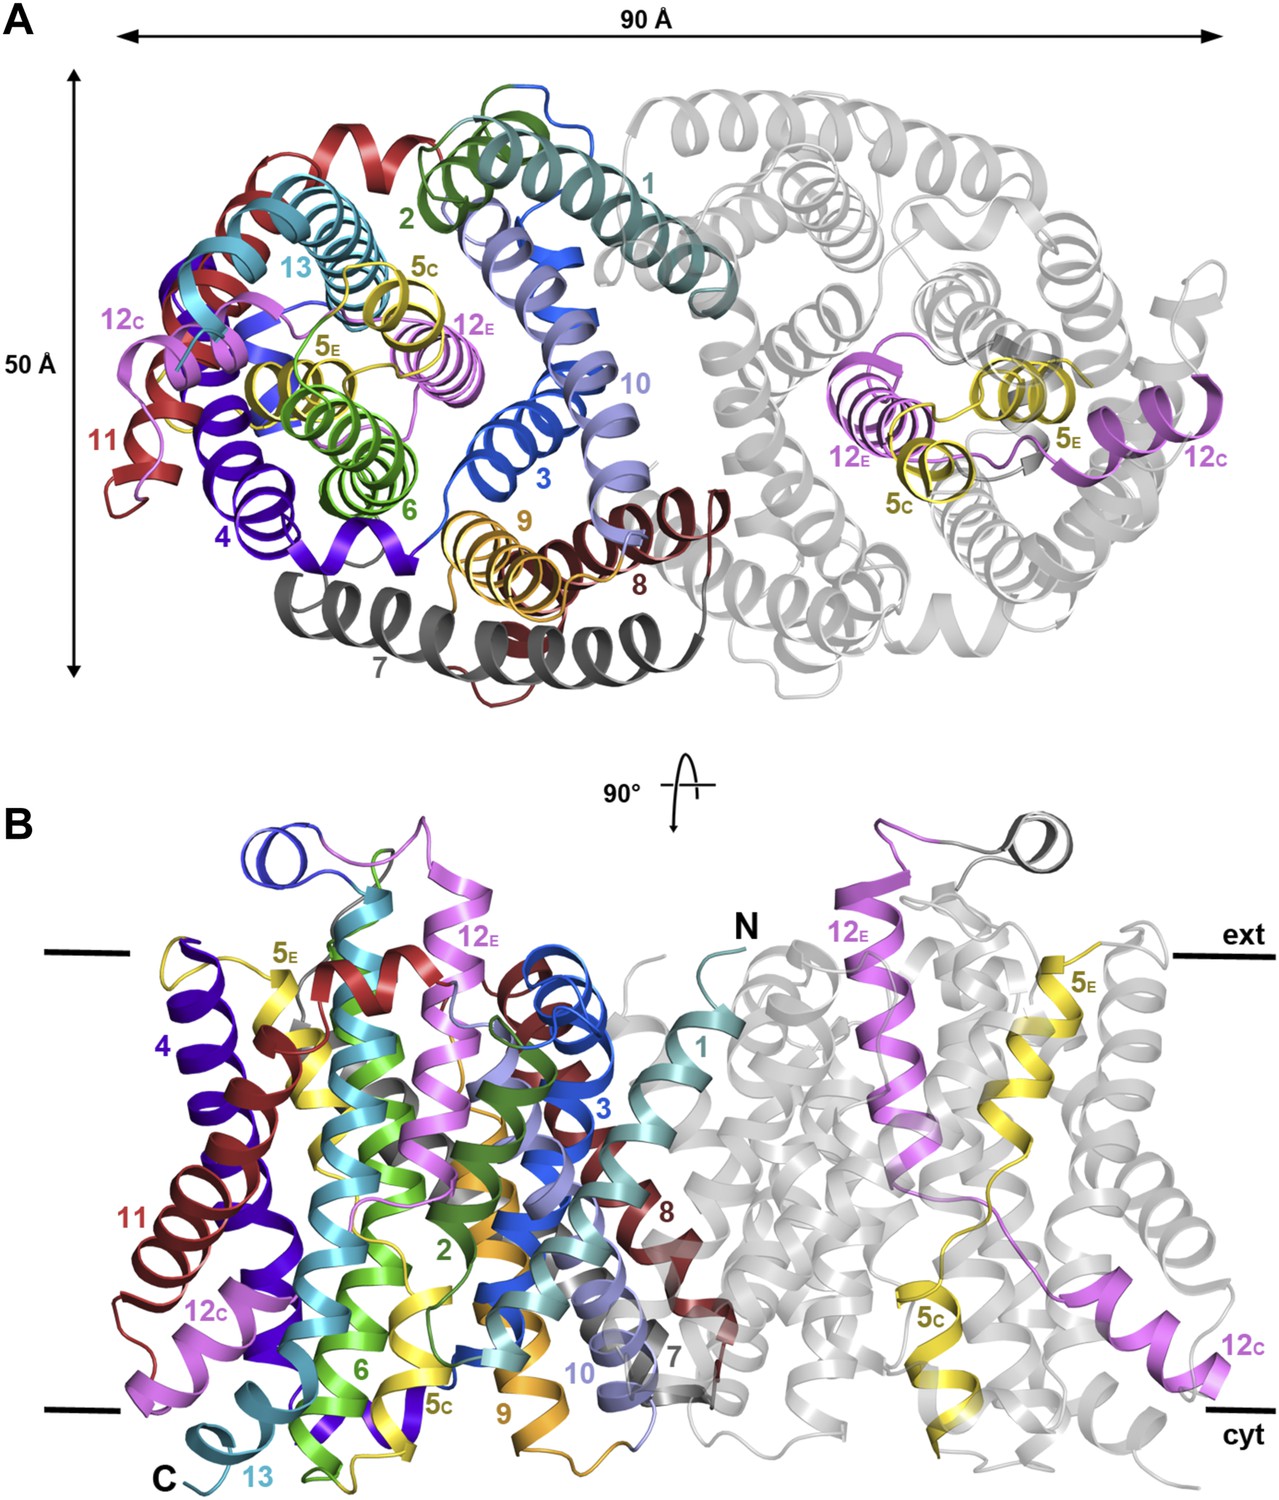
X-ray structure of MjNhaP1.
(A) The MjNhaP1 dimer seen from the cytoplasmic side. Helices H1 to 13 are color-coded and numbered. In one protomer, only the partly unwound helices H5 and 12 are colored. (B) Side view with the N-terminus of H1 on the extracellular side.
Figure 2—figure supplement 1
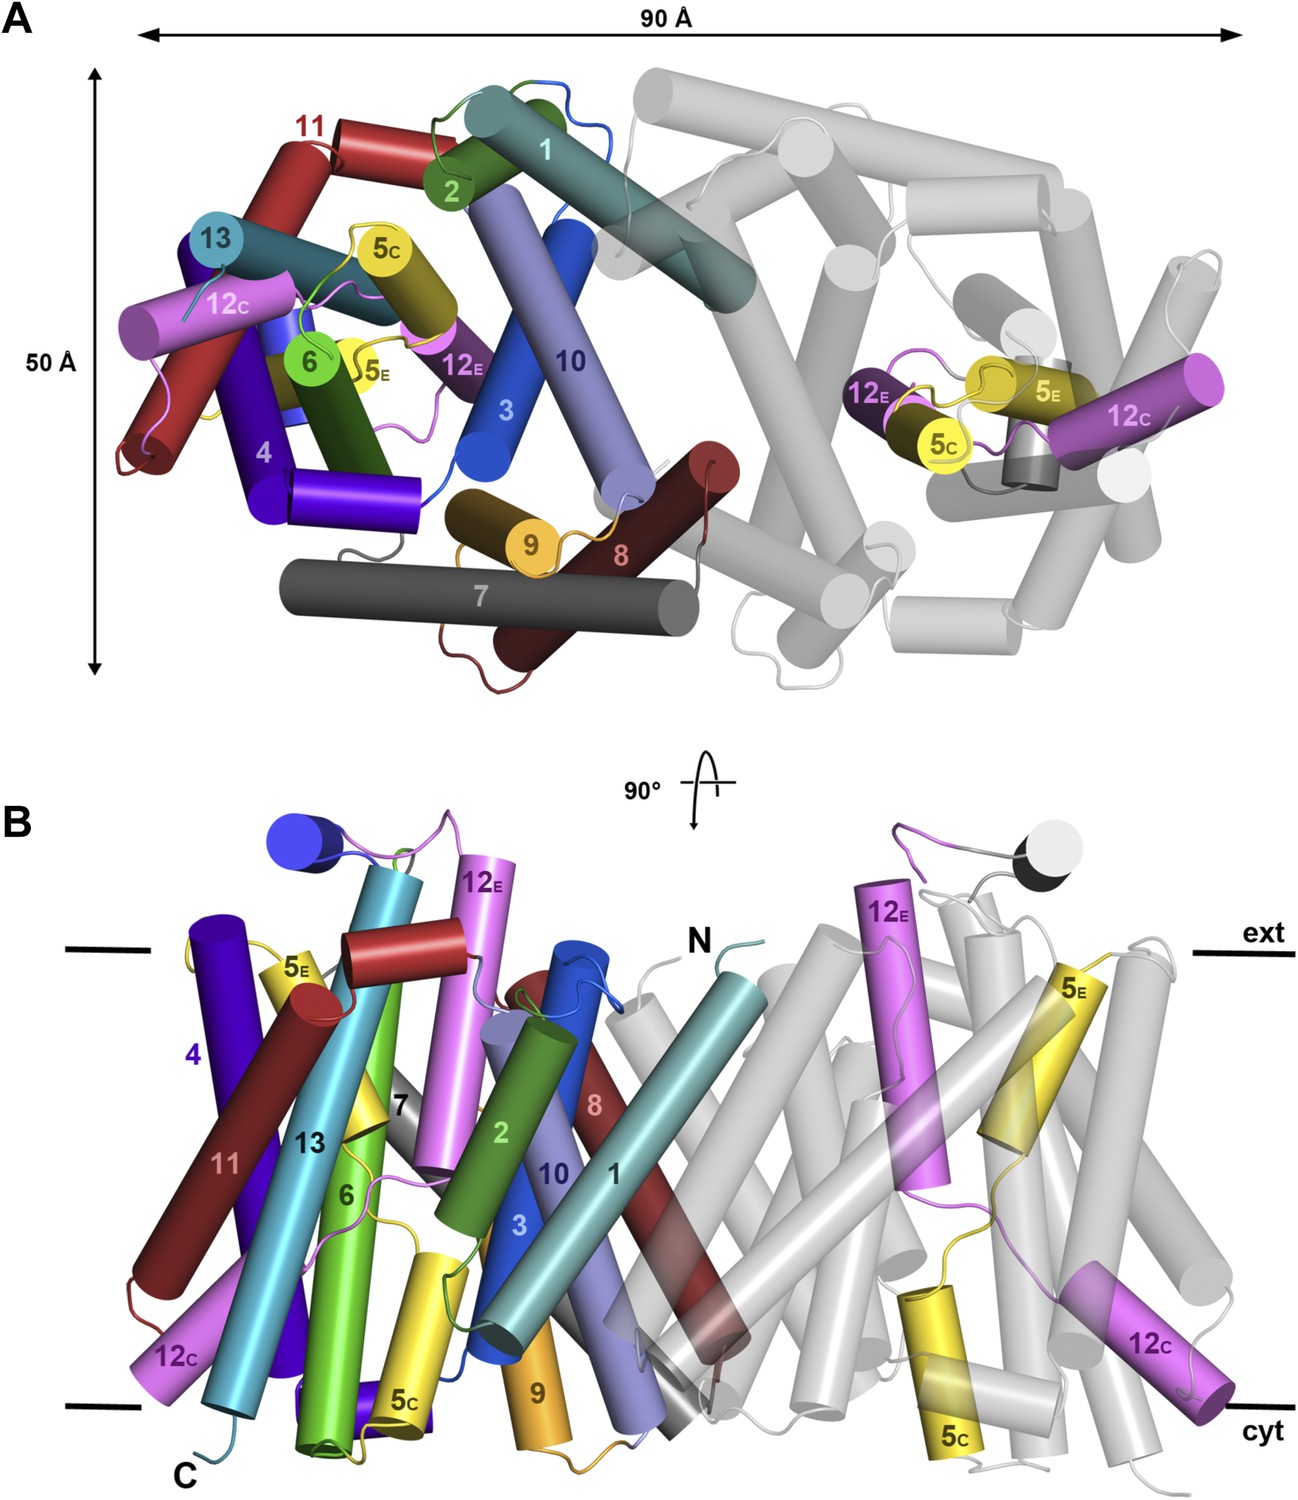
X-ray structure of MjNhaP1.
Cartoon representation of MjNhaP1 with helices shown as cylinders. (A) Cytoplasmic and (B) side view of the dimer, colour-coded as in the main figure.
Figure 2—figure supplement 2
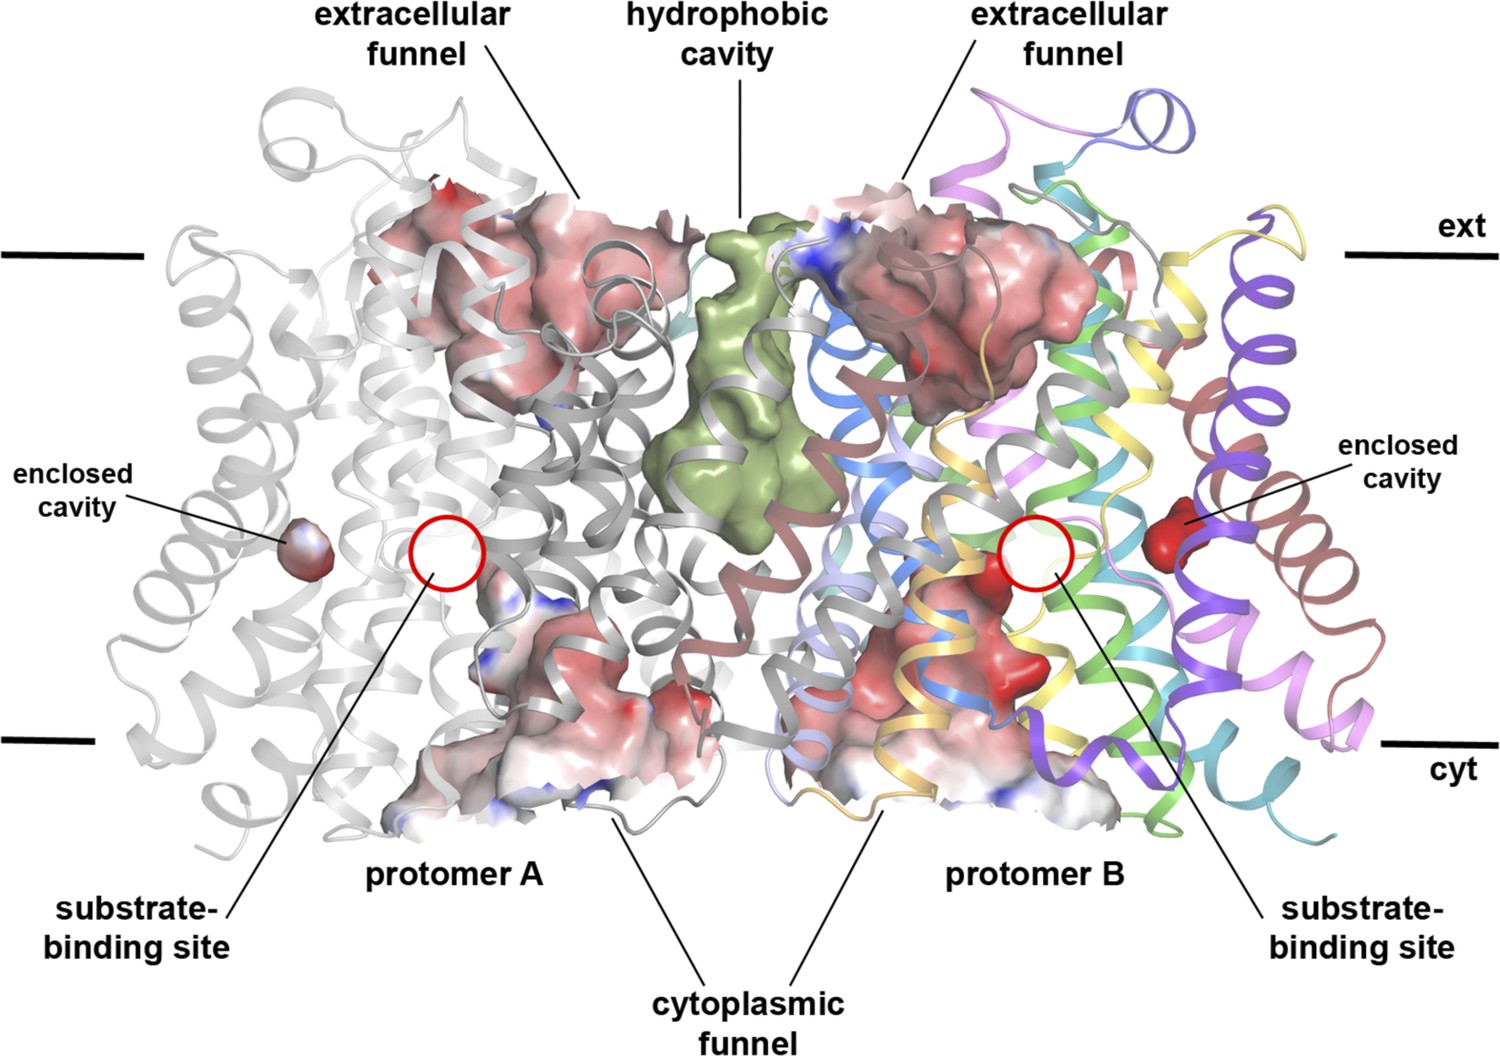
Cavities in MjNhaP1 at pH 8.
Side view of the dimer with protomer A shown in grey and protomer B in colour. The extracellular and cytoplasmic funnel and the enclosed cavity are colored by surface potential. The hydrophobic cavity between both protomers is shown in olive.
Figure 2—figure supplement 3
Na+/H+ antiport activity of H1 truncation mutants.
Activity depends strongly on the first 15 residues in the MjNhaP1 sequence and is lost completely when H1 is deleted. Constructs were expressed in the pTrcHis2TOPO plasmid in KNabc cells, and measurements were performed with everted vesicles at pH 6. Activities are expressed as percentages of fluorescence relative to the mean of at least four independent experiments. The apparently higher activity of the first two mutants is explained by differences in expression levels (inset).
Figure 2—figure supplement 4
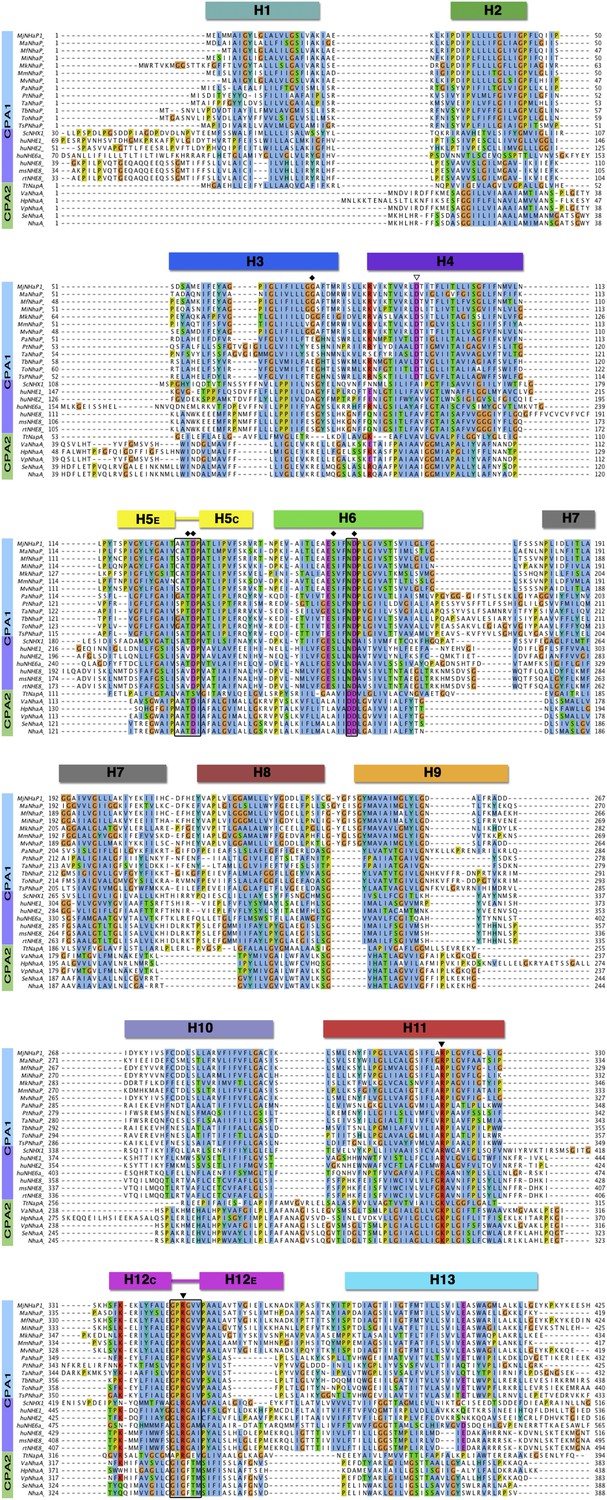
Sequence alignment of CPA antiporters.
Comparison of 13 archaeal NhaP antiporters (blue), one fungal NHX plus six mammalian NHE exchangers (purple), and six bacterial CPA2 antiporters (green). The two unwound regions in H5 and H12, and the ND/DD motif in H6 are boxed. Black diamonds mark residues in the PaNhaP ion-binding site. The partly (▽) or strictly (▼) conserved CPA1 residues D93, R320 and R347 affect transport but do not participate directly in ion binding.
Figure 3 with 2 supplements
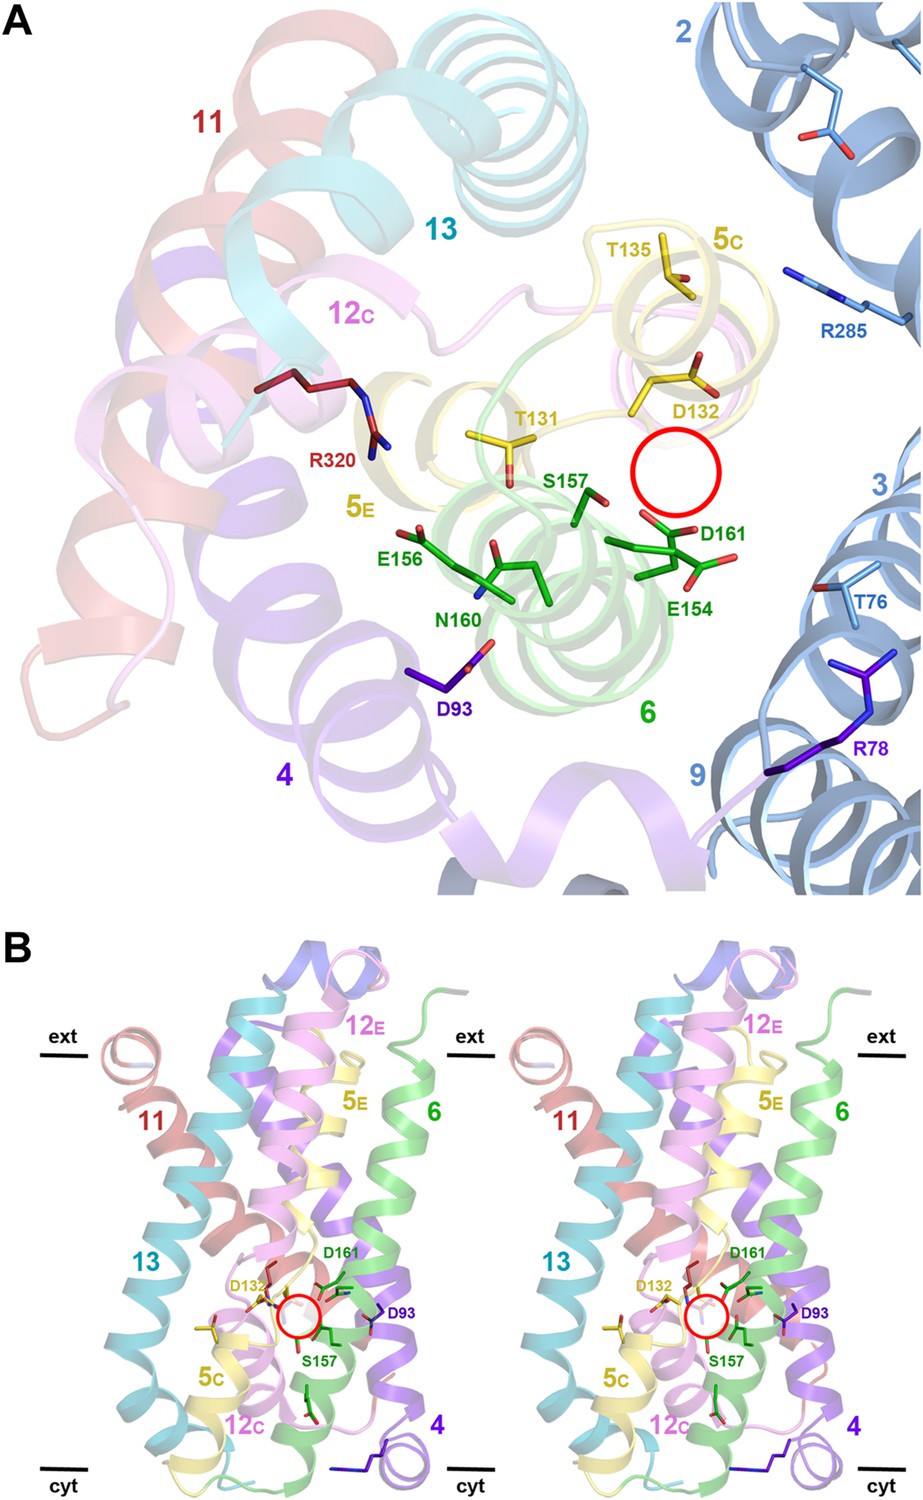
Detailed views of the MjNhaP1 x-ray structure.
(A) Cytoplasmic view of the 6-helix bundle with residues involved in substrate-ion binding and transport. The essential N160 in the ND motif points away from the ion-binding site and interacts with Asp93. Glu154 in H6 interacts with Thr76 in the interface helix H3. Thr76 replaces the ion-coordinating Glu73 of PaNhaP. The 6-helix bundle interacts via Thr135 in H5C with Arg285 in H10 and Asp31 in H2. Arg320 forms an ion bridge with Glu156. (B) Stereo view of the 6-helix bundle. The red circle marks the ion-binding site in PaNhaP (Wöhlert et al., 2014).
Figure 3—figure supplement 1

6-helix bundle in the CPA1 antiporters MjNhaP1 and PaNhaP.
Stereo views of the conserved substrate-binding site in MjNhaP1, compared to the known binding site in the homologous PaNhaP (Wöhlert et al., 2014). The substrate-binding site is located between the 6-helix bundle and the dimer interface helix 3. In the PaNhaP structure, the substrate ion with a bound water molecule and another water close to the ND-motif (Asn158 and Asp159) were resolved. The arginines and glutamates forming an ion bridge in the 6-helix bundle (Arg320 and Glu156 in MjNhaP1, Arg337 and Glu154 in PaNhaP) are conserved in CPA1 antiporters.
Figure 3—figure supplement 2
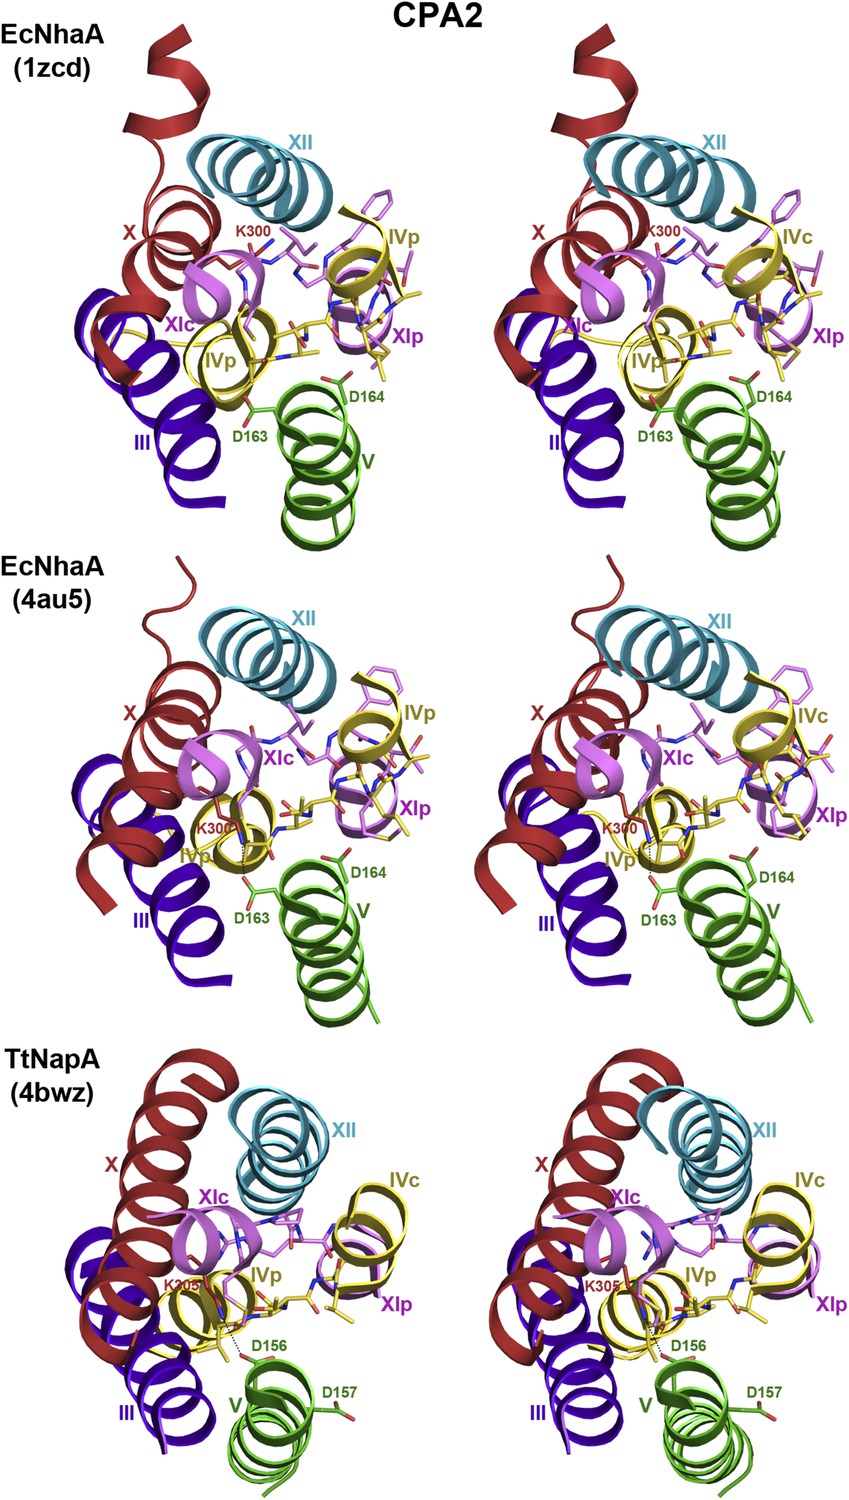
6-helix bundle in the CPA2 antiporters EcNhaA and TtNapA.
Stereo views of the putative ion-binding site in the CPA2 antiporters EcNhaA and TtNapA. In the structure of monomeric EcNhaA (pdb 1ZCD), Lys300 points towards helix XII while in the structure of the EcNhaA dimer (pdb 4AU5), Lys300 forms an ion bridge with Asp163 in the DD motif in helix V. In TtNapA the CPA2-conserved Lys305 forms an ion bridge with Asp156 in the DD motif.
Figure 4
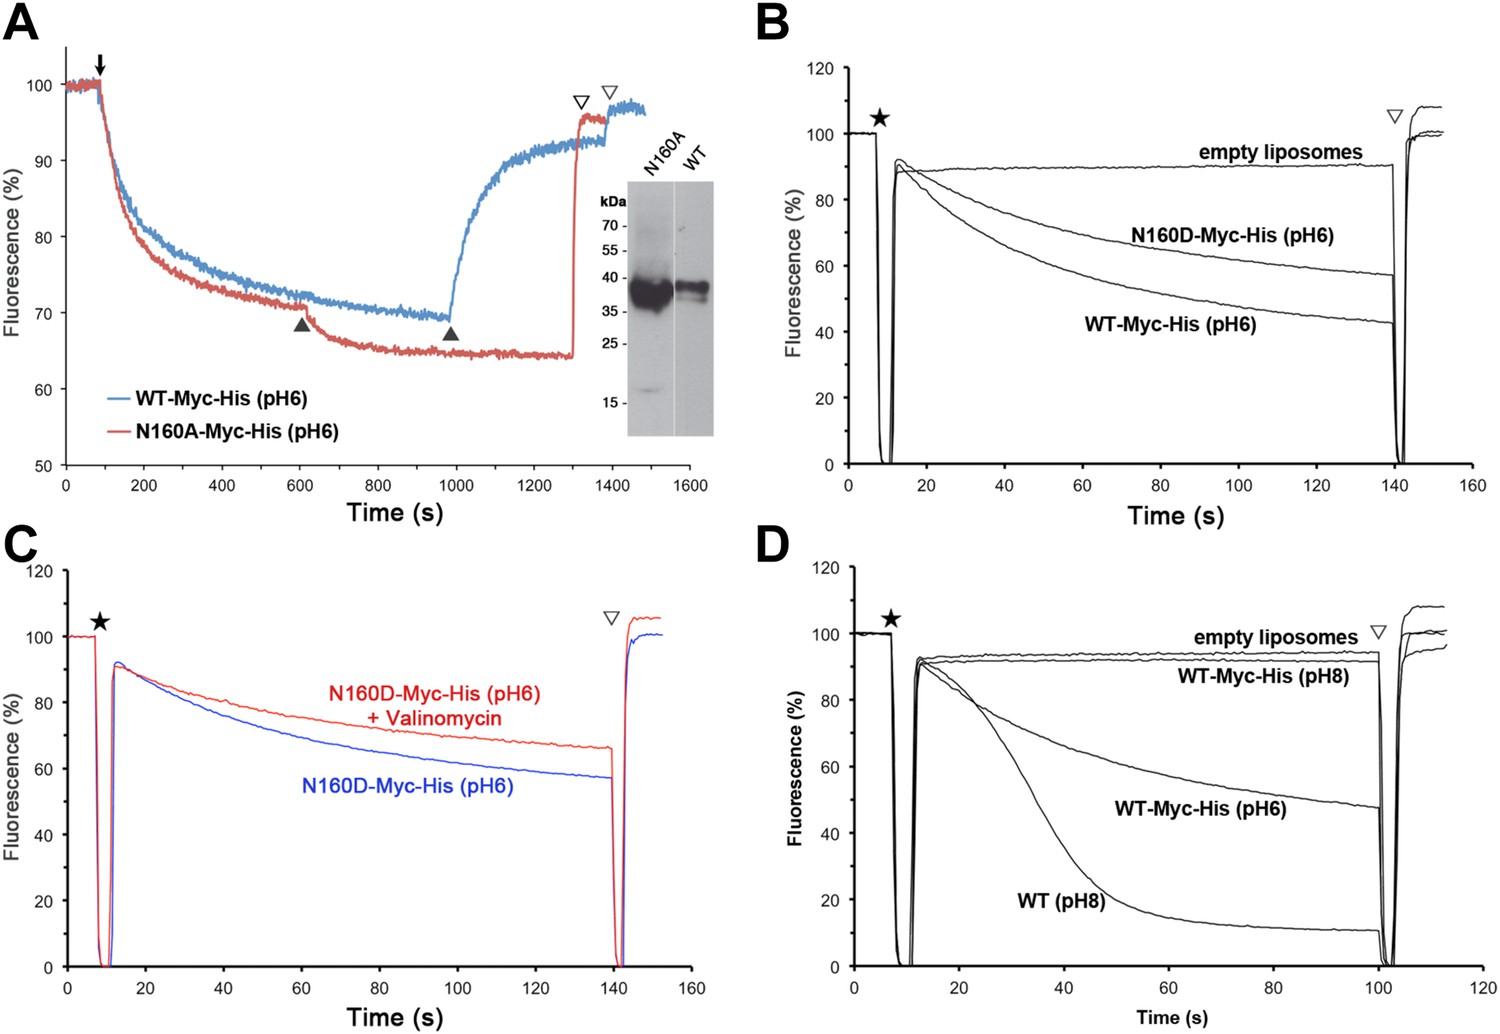
Activity of Asn160 mutants.
(A) Na+/H+ antiporter activity of wildtype (WT) and the N160A mutant measured under asymmetrical conditions in everted vesicles at pH 6. Constructs were expressed in Na+/H+ antiporter-deficient KNabc cells at comparable levels (inset). Everted vesicles were preloaded with protons by addition of 2.5 mM Tris/DL-lactate (↓). Transport was initiated by addition of NaCl to 25 mM (▲), and proton efflux was monitored by acridine orange fluorescence dequenching. (B) Activity of purified wildtype MjNhaP1 (WT) and the N160D mutant reconstituted into proteoliposomes under symmetrical pH. (C) Activity at pH 6 was unaltered in the presence of valinomycin, demonstrating that N160D is not electrogenic. Asterisks in (B) and (C) mark the addition of proteoliposomes. The pH gradient was dissipated with 25 mM NH4Cl (▽). (D) Transport by MjNhaP1 is inhibited by the Myc-His-Tag at pH 8 but not at pH 6.
Figure 5 with 1 supplement
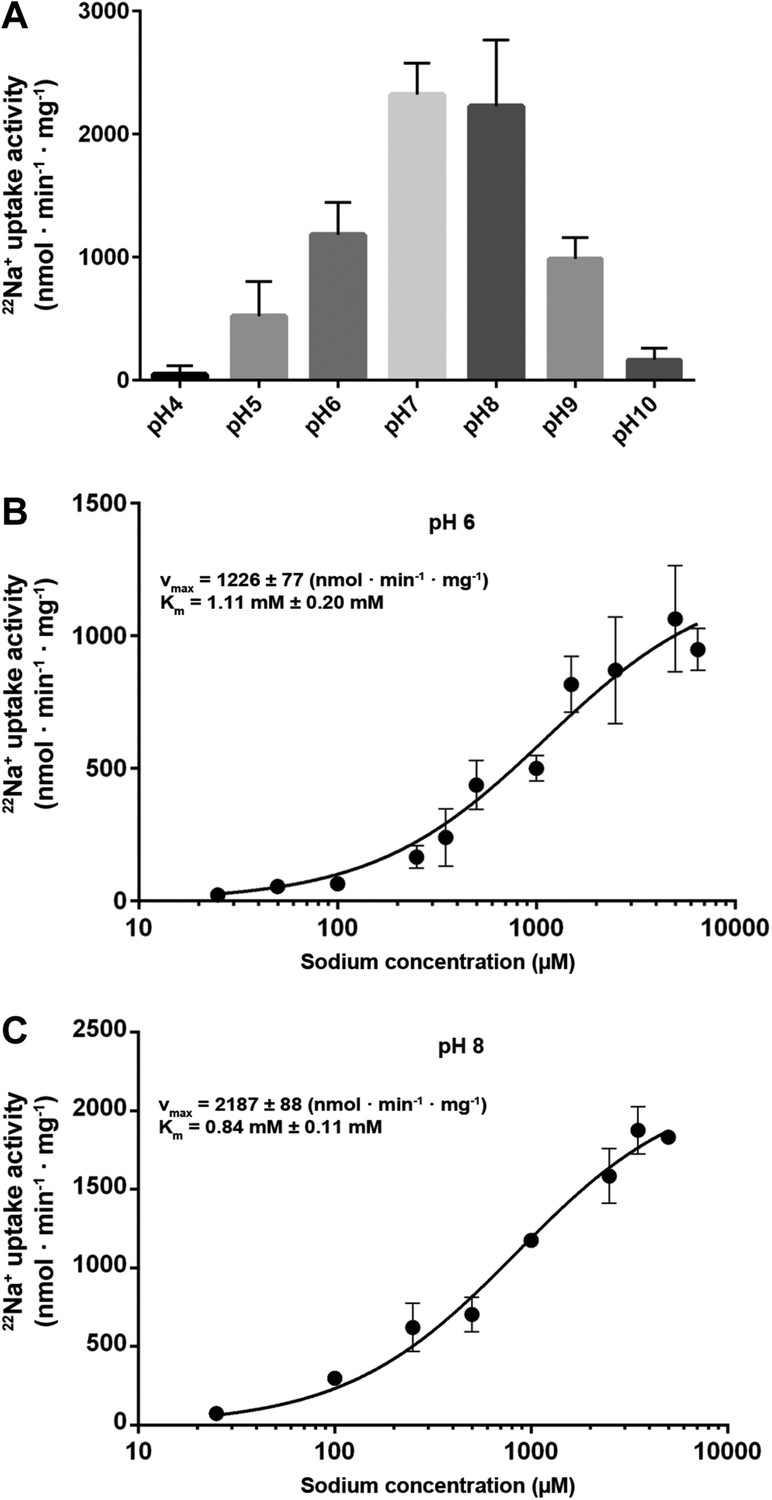
Transport activity of MjNhaP1.
(A) pH profile measured by 22Na uptake with acidic-inside proteoliposomes at 1.5 mM NaCl. MjNhaP1 activity is highest between pH 7 and pH 8 and drops to background level at pH 4 and pH 10. (B) 22Na+ transport at pH 6 follows Michaelis–Menten kinetics, with a Km of 1.11 mM ± 0.20 mM and a vmax of 1226 ± 77 nmol · min−1 · mg−1. (C) At pH 8, Km drops to 0.84 ± 0.11 mM and vmax increases to 2187 ± 88 nmol · min−1 · mg−1 (1.68 s−1).
Figure 5—figure supplement 1
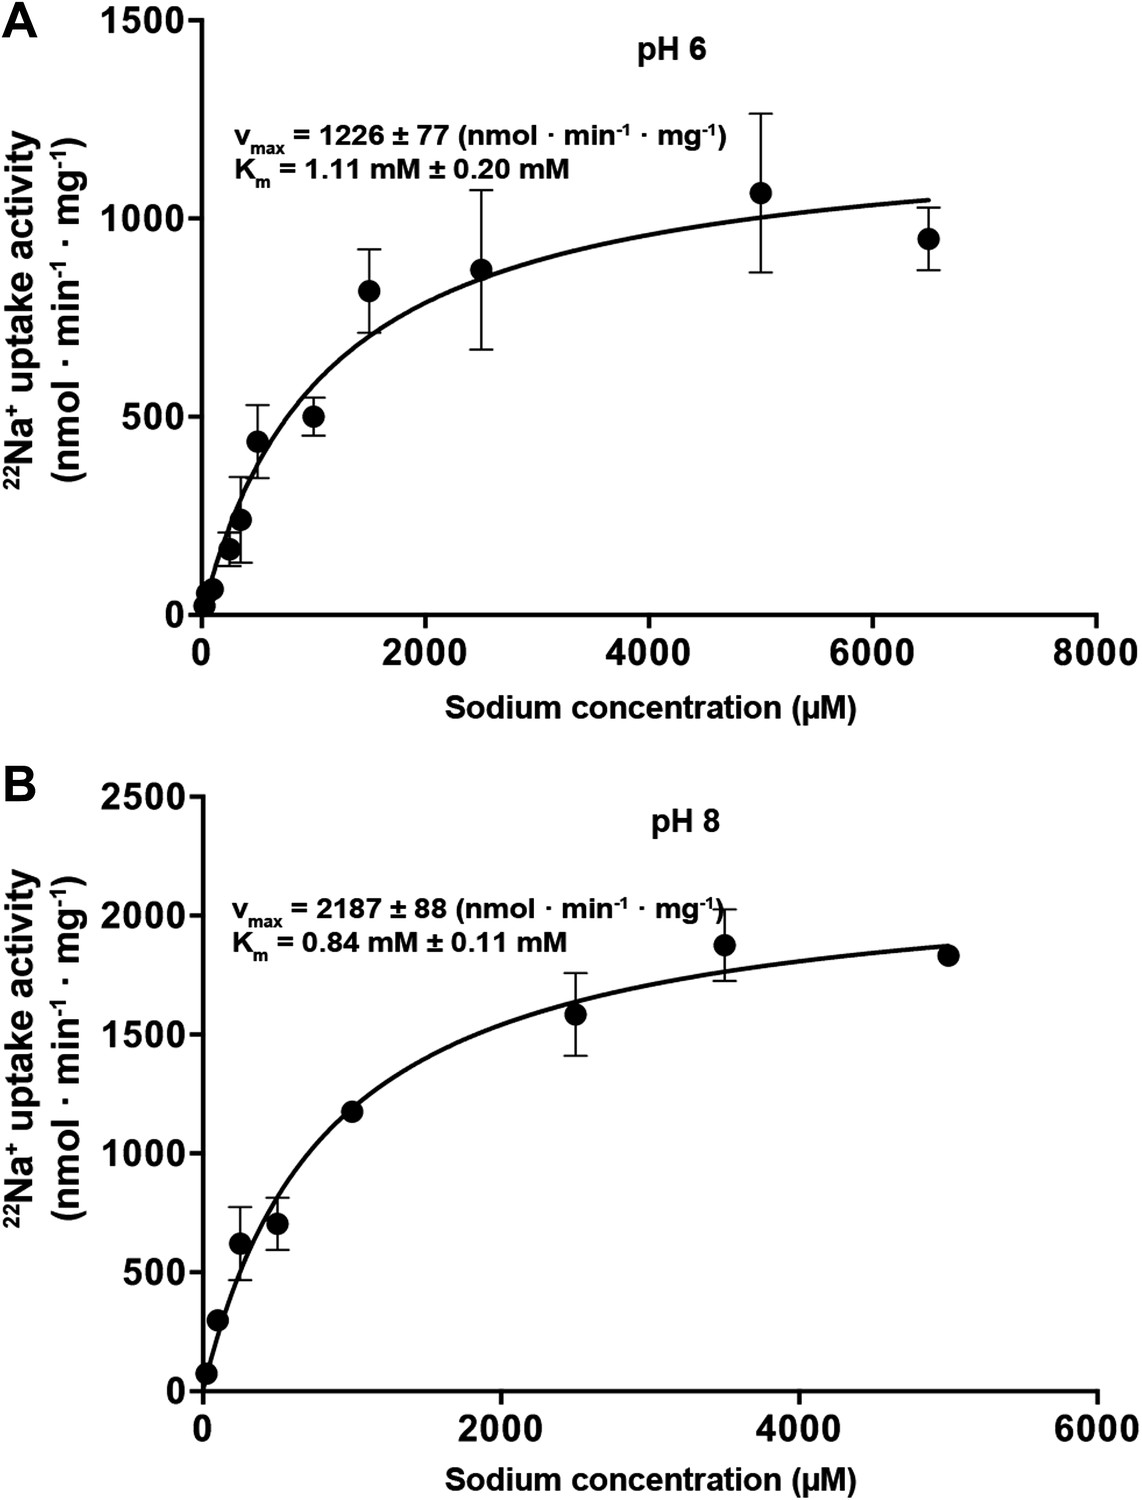
Na+-dependent transport activity on a linear scale.
The linear plots show that near-saturation is reached around 5 mM NaCl at both pH 6 (A) and pH 8 (B).
Figure 6 with 1 supplement
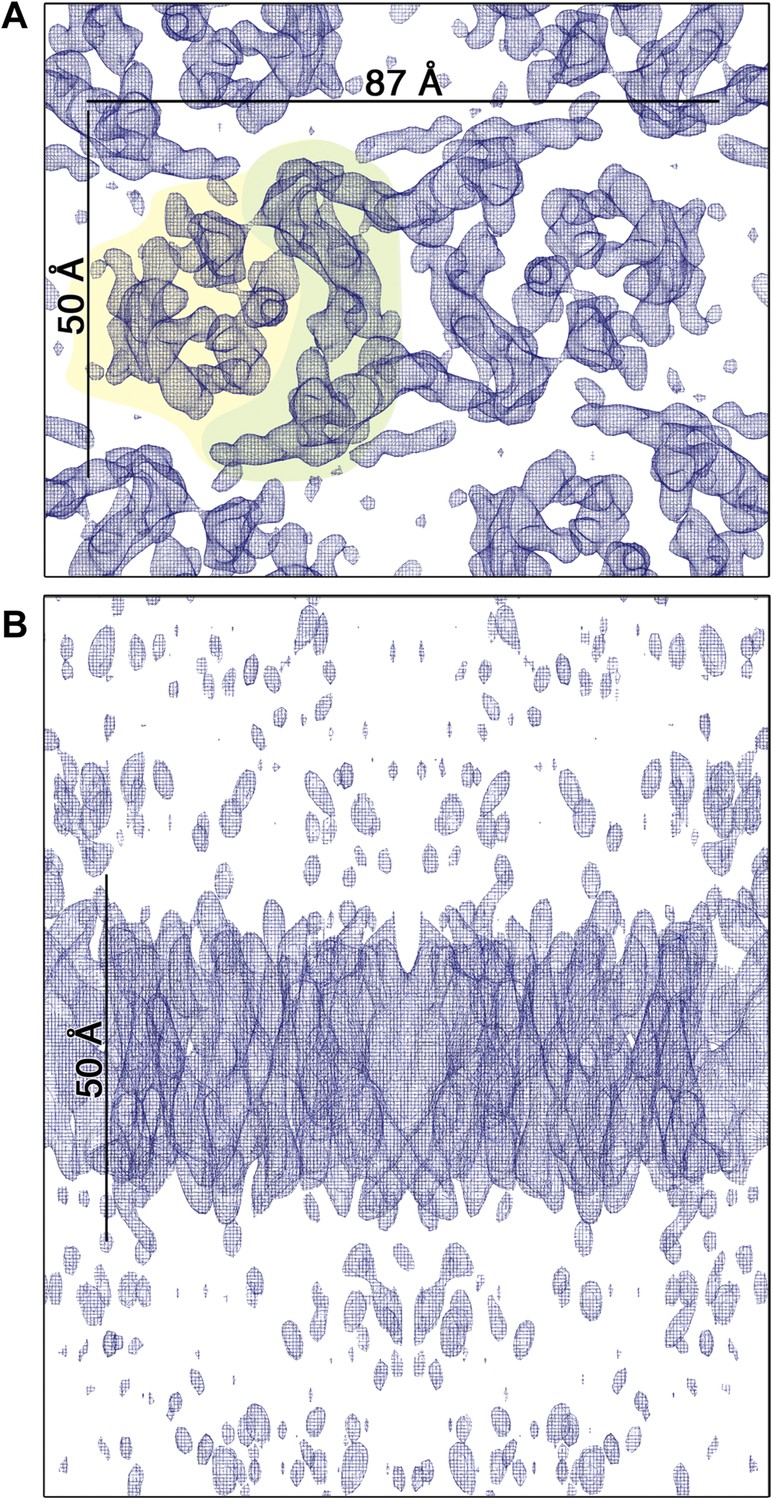
3D EM map of MjNhaP1 at pH 4 in the absence of Na+.
The map was contoured at 1.7σ and a B-factor of −200 Å2 was applied. (A) Cytoplasmic view of one dimer. The 6-helix bundle is shaded yellow and the dimer interface green. (B) The side view indicates low noise level outside the membrane.
Figure 6—figure supplement 1
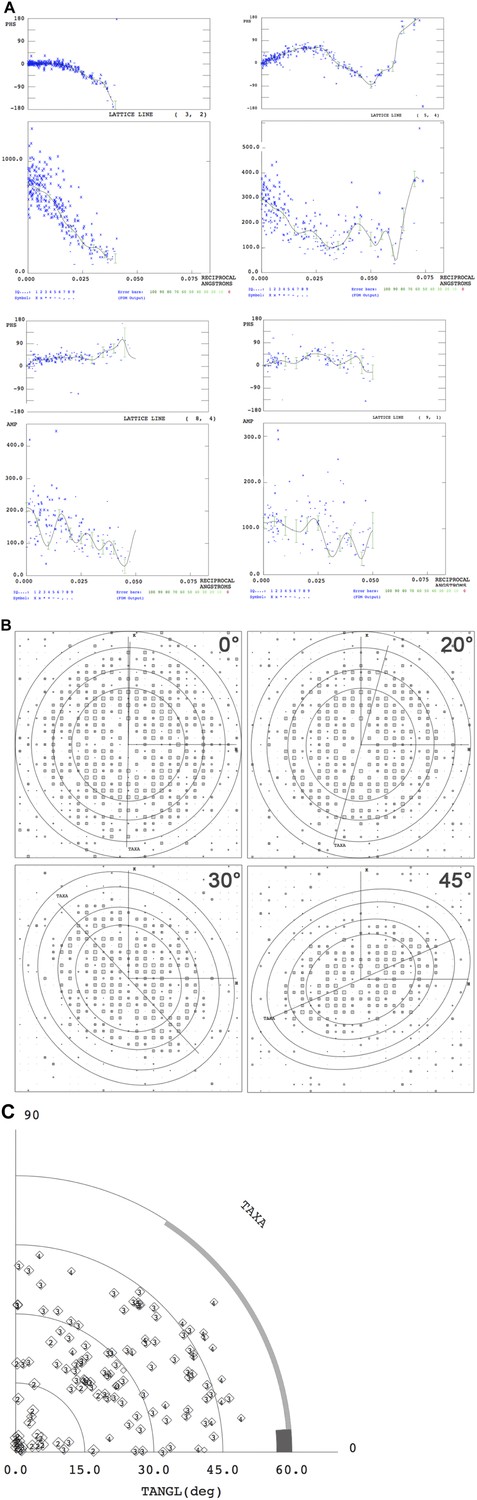
Electron crystallographic amplitudes and phases.
(A) Lattice lines for four representative reflections. The variation of phases (upper panel) and amplitudes (lower panel) along z* were fitted by weighted least squares. Each blue cross represents one measured reflection. (B) IQ plots of single images recorded at the tilt angles indicated. Circles indicate 12 Å, 9 Å, 7 Å and 6 Å resolution. h,k vectors and the tilt axis (TAXA) is shown. (C) Tilt angle distribution according to (Cheng and Yeager, 2004).
Figure 7
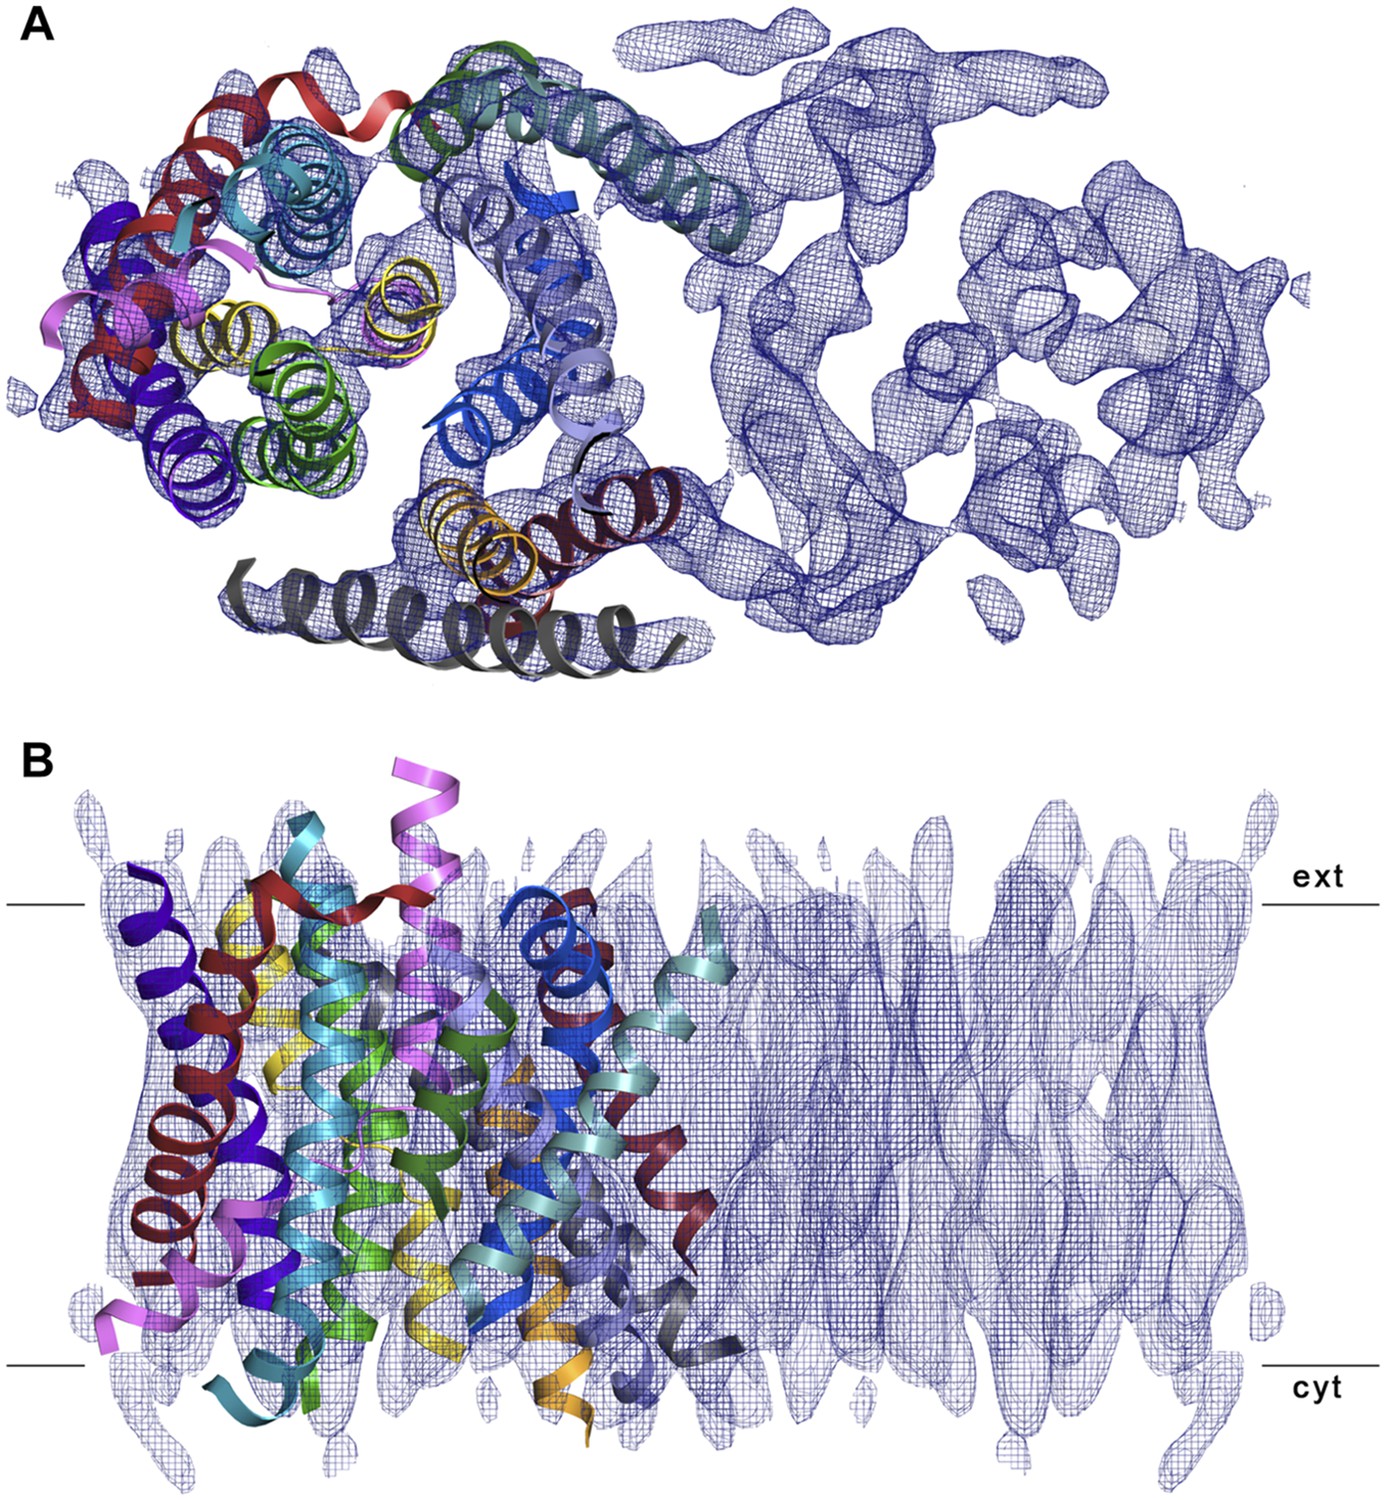
3D EM structure of MjNhaP1 at pH 4 without sodium.
Cytoplasmic (A) and side view (B) of 3D EM map with one MjNhaP1 protomer fitted. The map was sharpened with a B factor of −200 Å2 and contoured at 1.7σ. Connecting helices and loops without EM density were omitted for clarity.
Figure 8
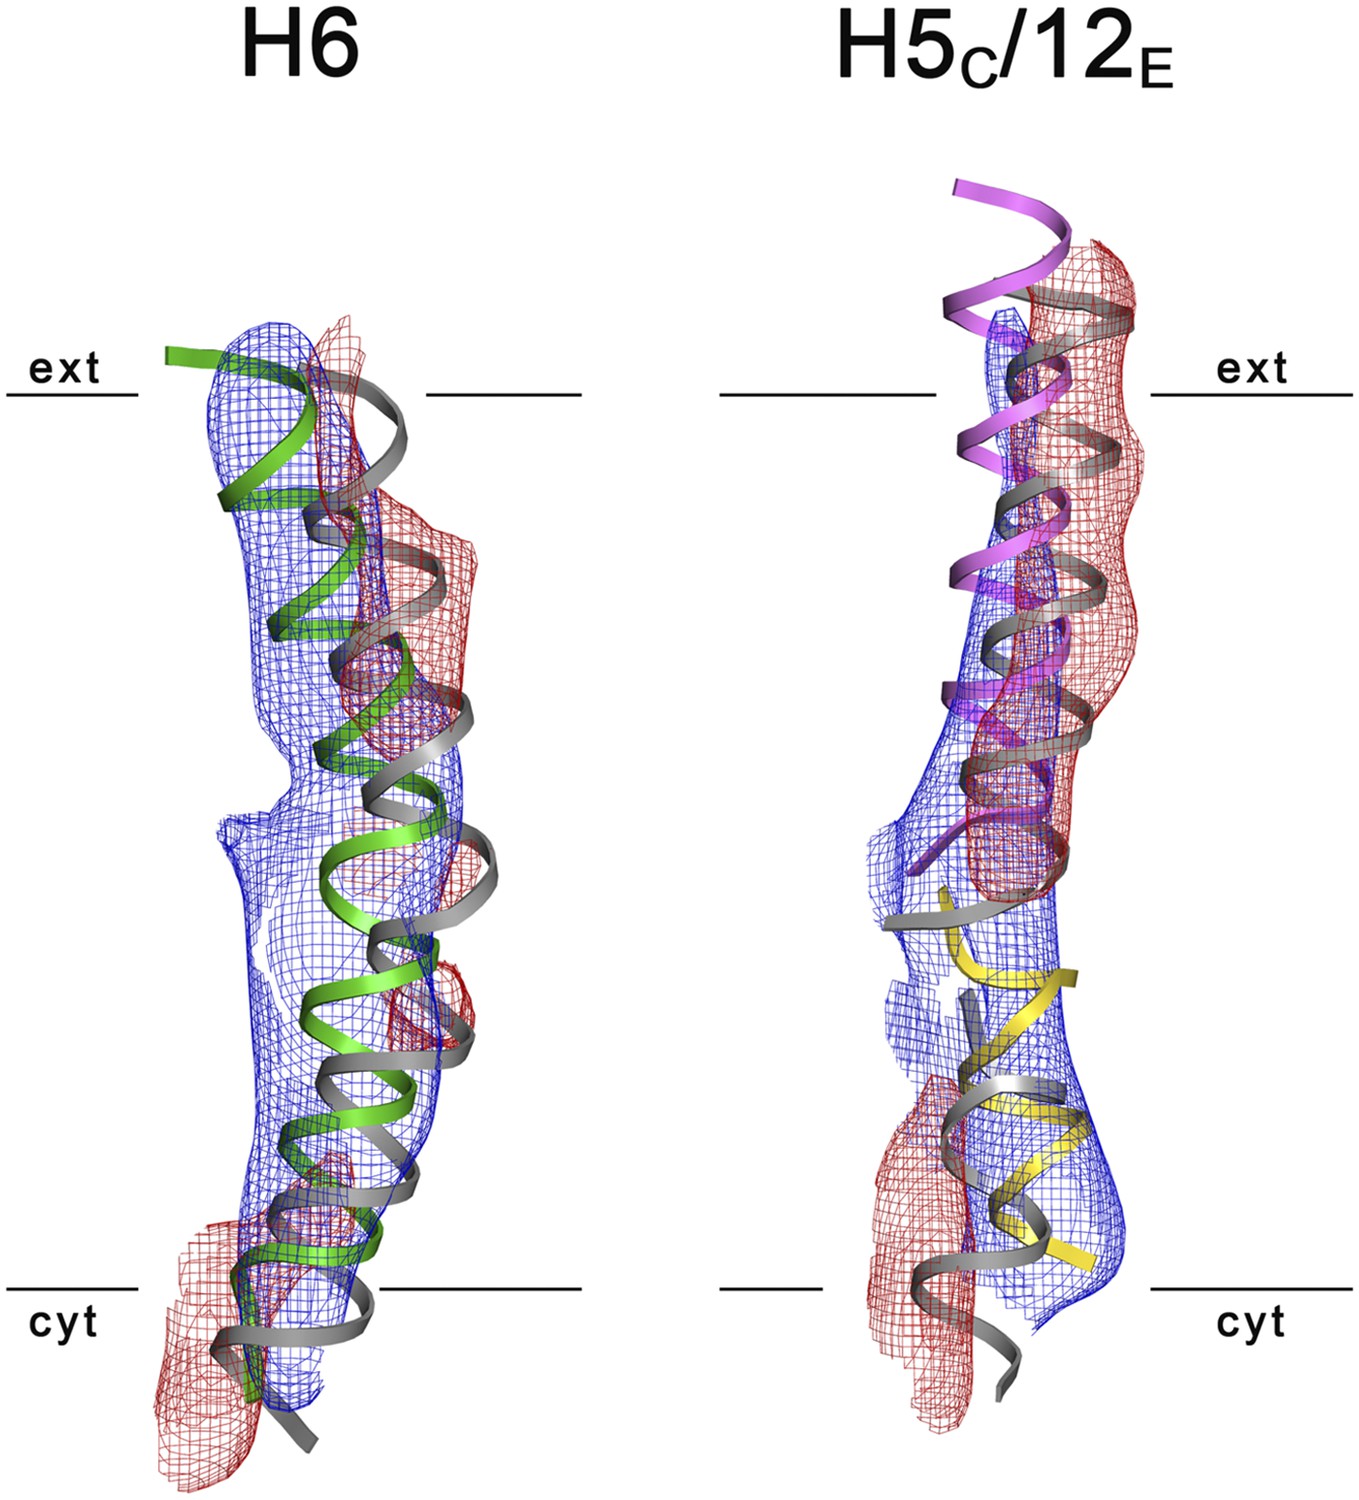
3D Difference maps.
Difference densities were calculated between the unsharpened experimental EM map (blue mesh) and the x-ray map truncated to 6 Å resolution. Difference maps are shown for H6 (green) and the 5C/12E pair of half helices (yellow/pink). For clarity, only negative difference densities are shown (red mesh). The x-ray structure of the inward-open state is grey. Maps were plotted at 2σ.
Figure 9 with 1 supplement
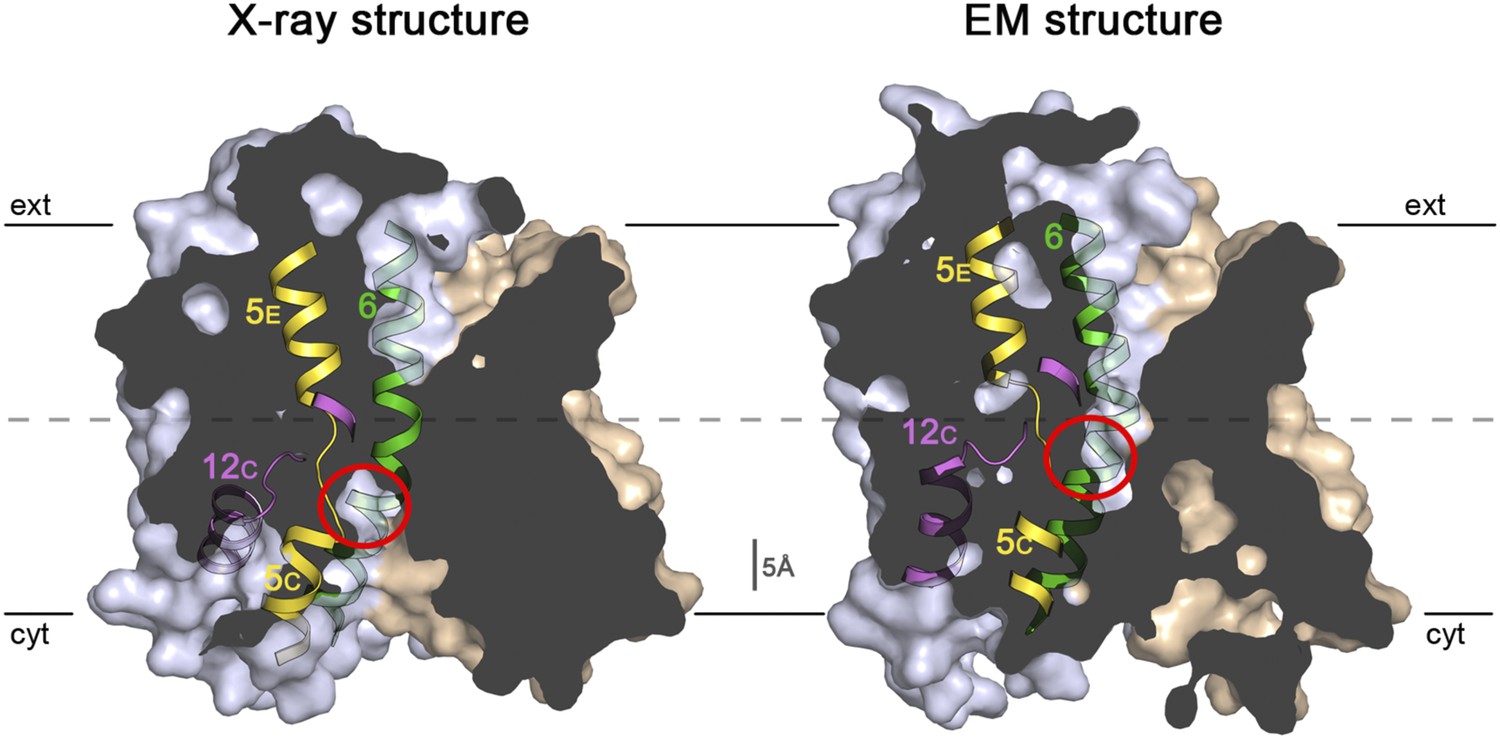
Sections through the MjNhaP1 x-ray and EM structures.
Sections through the inward-open x-ray structure and the outward-open EM structure of MjNhaP1. In the x-ray structure (left) the ion-binding site (red circle) is accessible from the cytoplasm. In the EM structure (right), the ion-binding site has moved upwards by ∼5 Å and is accessible through the extracellular funnel.
Figure 9—figure supplement 1
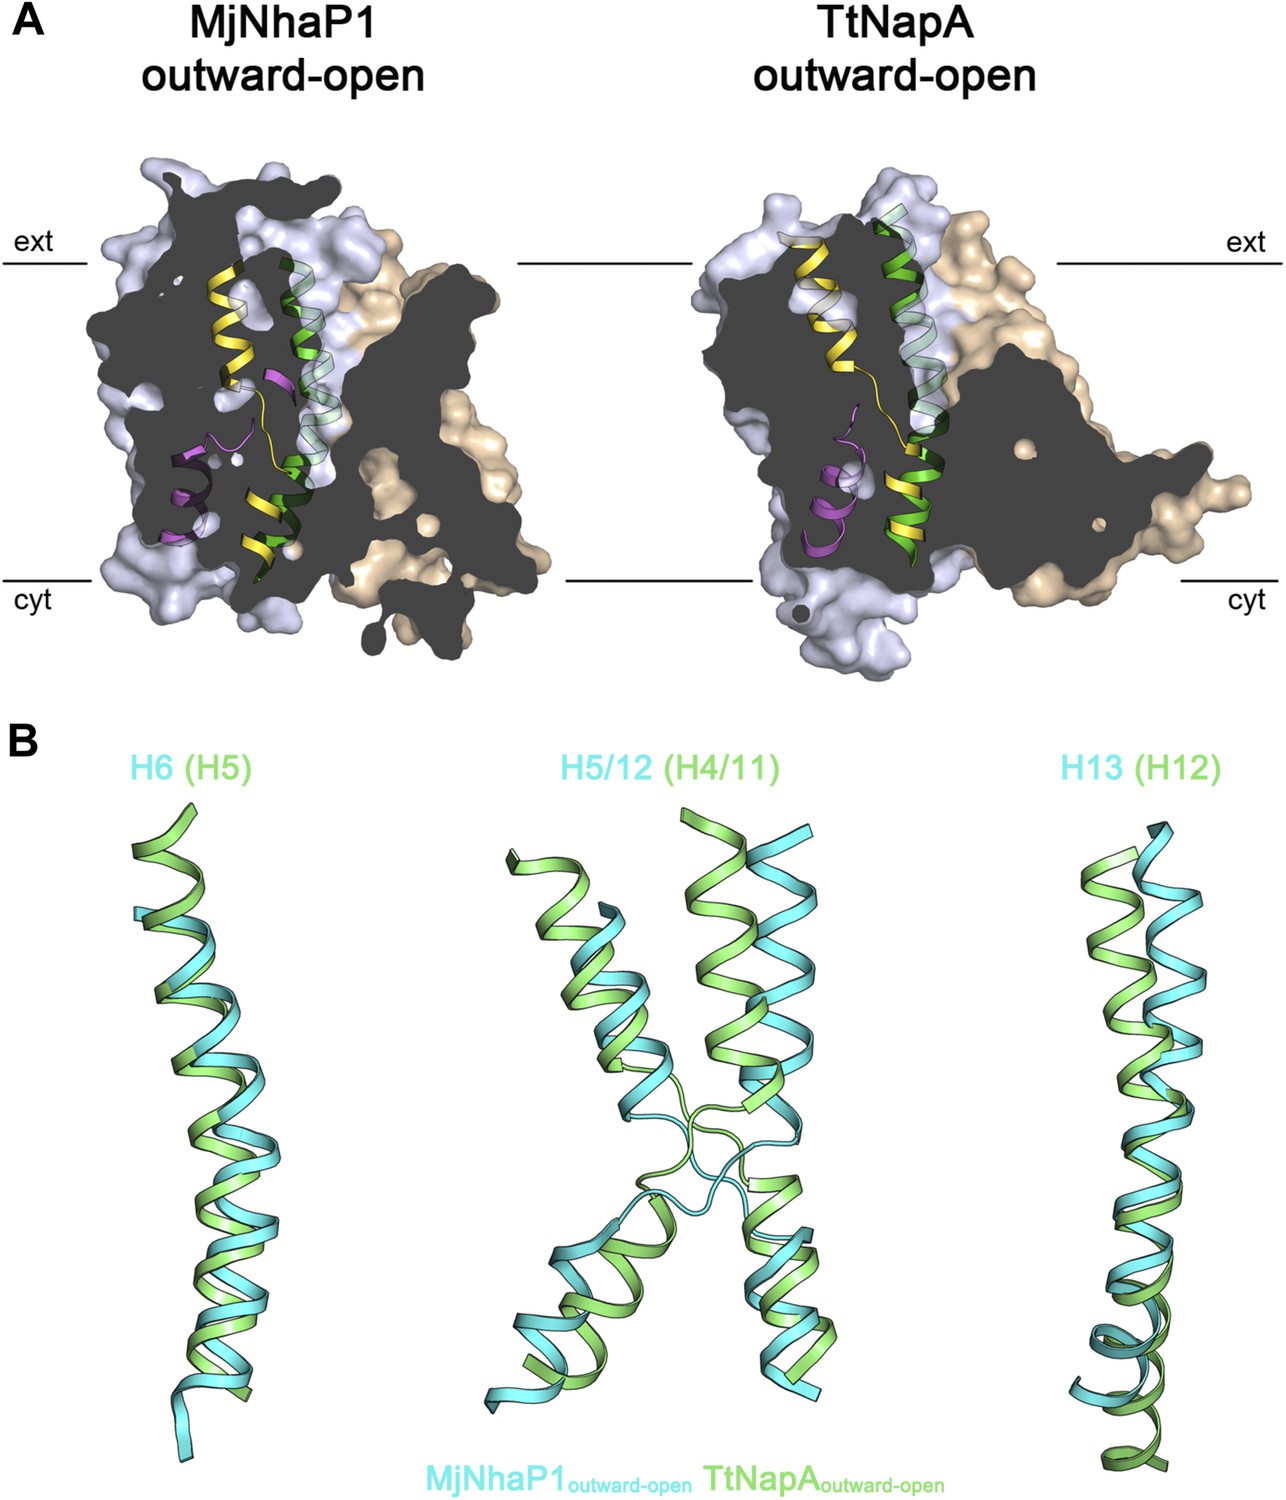
Comparison of MjNhaP1 and TtNapA.
(A) Sections through protomer volumes of the MjNhaP1 EM structure (left) and the outward-open TtNapA structure (Lee et al., 2013) (right). (B) Superposition of helices H5, H6, H12 and H13 in the MjNhaP1 EM structure (blue) and corresponding helices in TtNapA (green). Helix positions suggest that TtNapA is more open on the extracellular side than MjNhaP1.
Figure 10
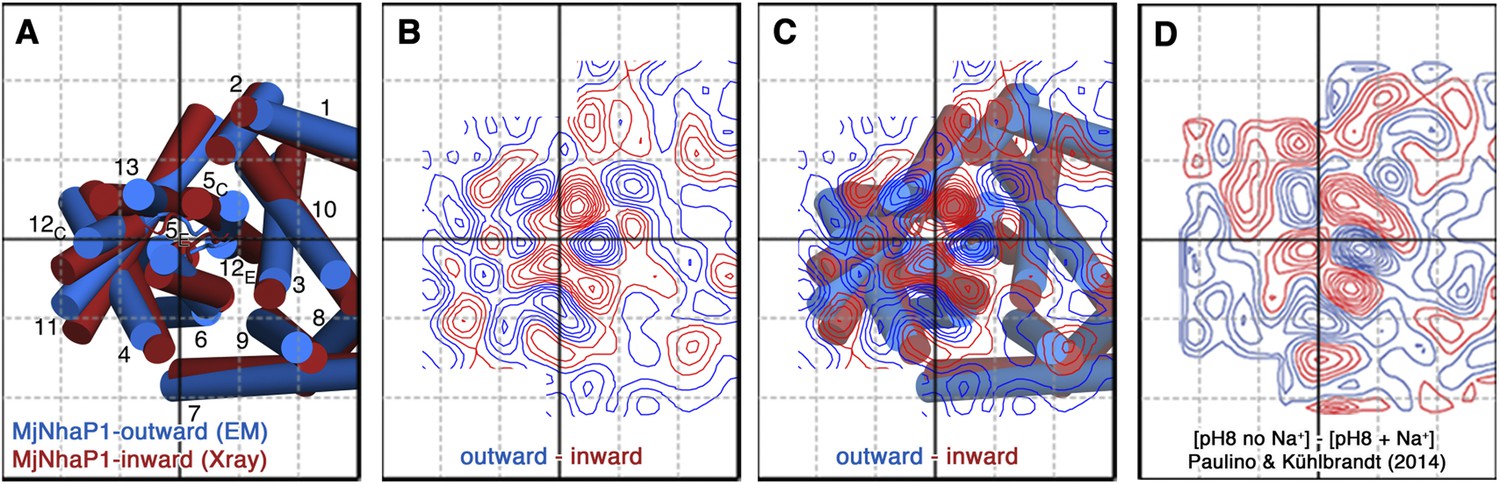
Projection difference maps.
(A) Superposition of the three-dimensional MjNhaP1 outward-open structure at pH 4 without sodium (blue) and the inward-open structure at pH 8 with sodium (red). Helices are shown as cylinders as seen from the cytoplasmic side. (B) 6 Å projection difference map calculated between the structures shown in (A). Major difference peaks are observed in the 6-helix bundle, whereas difference peaks at the dimer interface are weak. (C) Superposition of the inward-open and outward-open MjNhaP1 structures on the projection difference map shown in (B). (D) 6 Å projection difference map between MjNhaP1 2D crystals at pH 8 with and without sodium (adapted from Figure 5 in (Paulino and Kühlbrandt, 2014) top row, 500 mM NaCl brought to the same phase origin). The projection difference map calculated from the 3D structures closely resembles the projection map that shows sodium-induced changes in Paulino and Kühlbrandt (2014). The conformational change from the inward-open to outward-open state of MjNhaP1 is therefore induced by sodium ions.
Figure 11
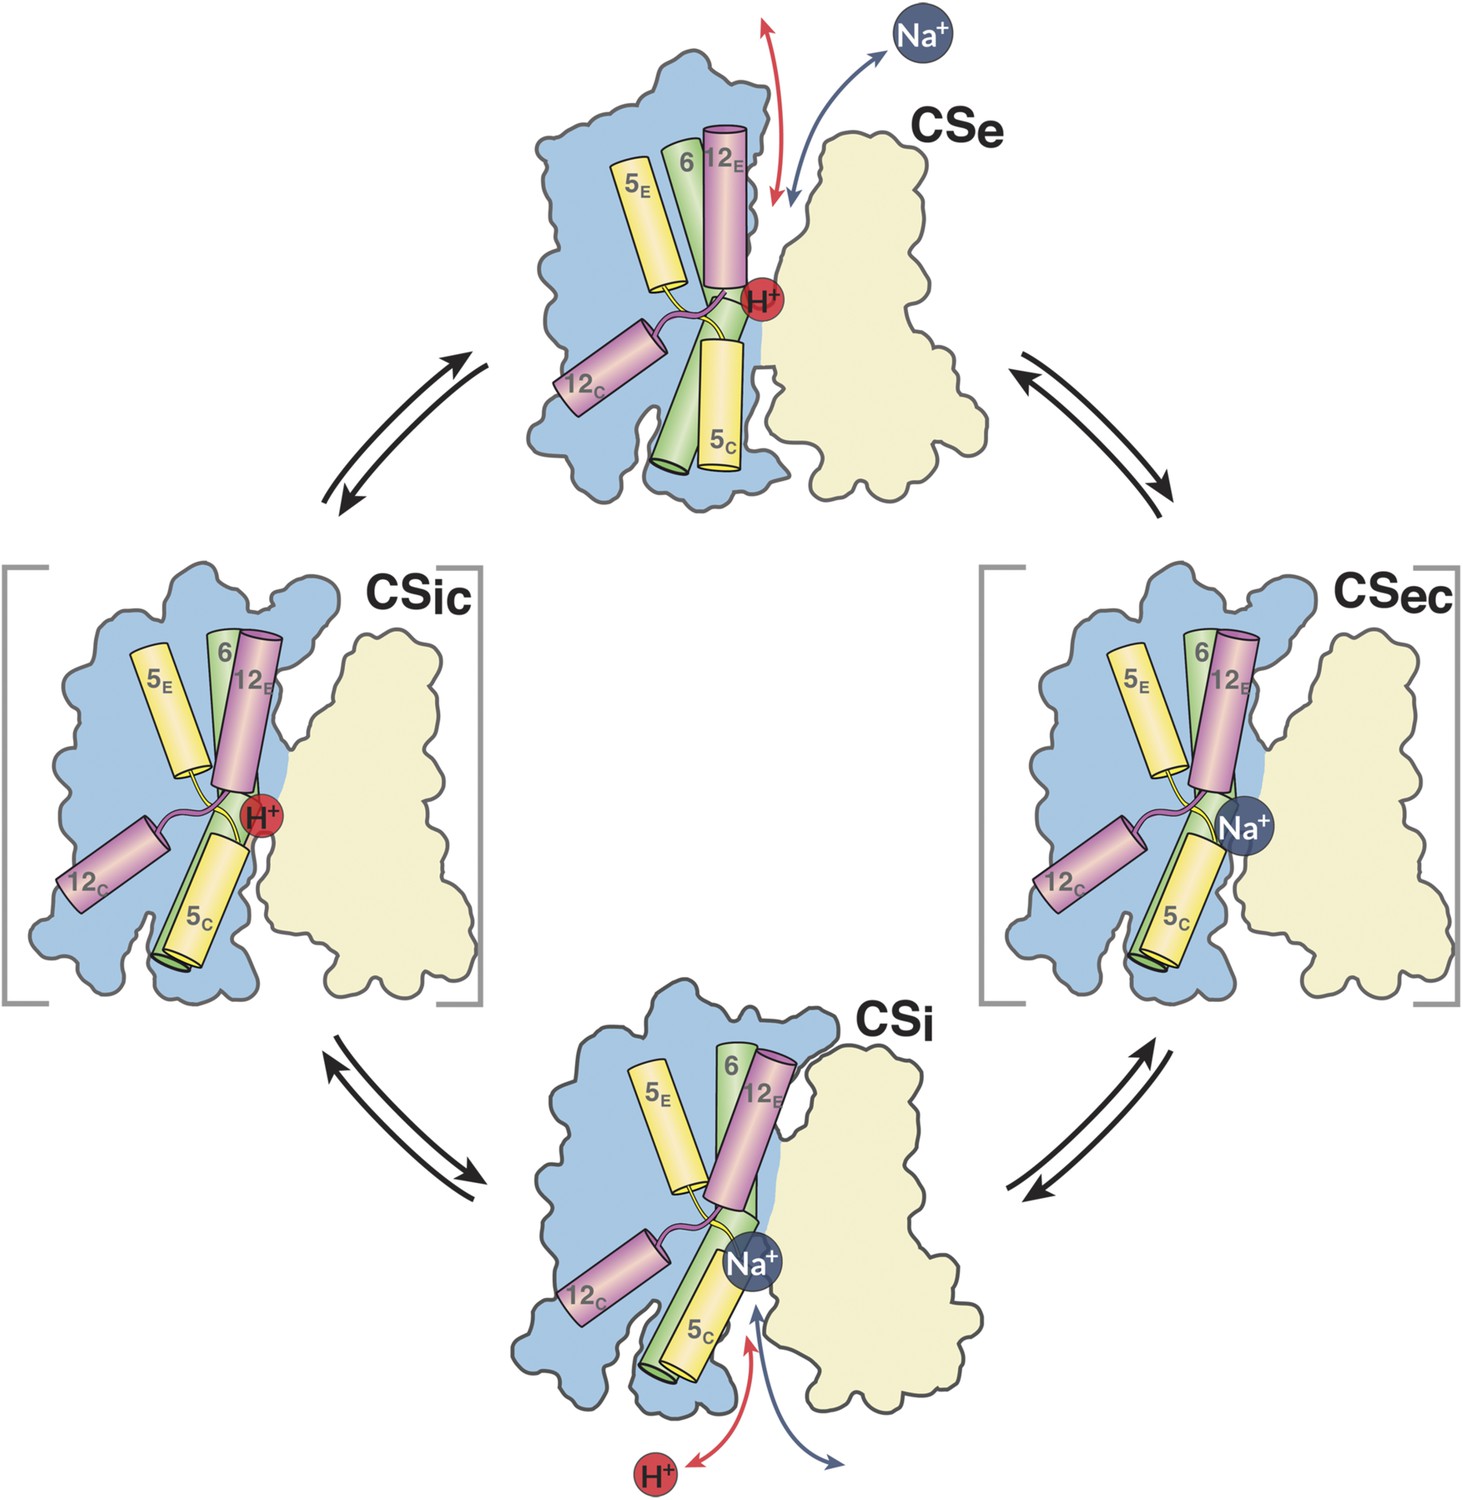
The MjNhaP1 transport cycle.
In the outward-open state (Ce), Na+ from the exterior medium gains access to the ion-binding site through the open extracellular funnel, where it replaces a bound proton. Na+ binding triggers the transition from the outward-open to the inward-open, substrate-bound conformation (CSi) via a substrate-occluded state (CSec). In the inward-open state, the cytoplasmic funnel widens and the extracellular funnel closes. A cytoplasmic proton releases the bound Na+ to the cell interior. Na+ release triggers the conformational change to the outward-open state via an occluded inward-open proton-bound conformation (CSic), and the cycle repeats. H5, 6 and 12 are color-coded. The 6-helix bundle (blue) performs a ∼7° rocking motion around an axis parallel to the dimer interface (light brown), which remains fixed in the membrane.
Videos
Video 1
Comparison of the x-ray structures of MjNhaP1 and PaNhaP.
One protomer of MjNhaP1 (colored) is superposed on one protomer of PaNhaP (grey).
Video 2
Conformational changes in MjNhaP1 and ASBT.
Morphing the transition from the outward-open to the inward-open states in MjNhaP1 (green) and ASBTYf (Zhou et al., 2014) (purple) reveals a very similar rigid-body movement of the 6-helix bundle relative to the dimer interface in both proteins. Cytoplasmic view (left) and side view (right). Structures were superimposed on the dimer interface and intermediate states were calculated using the program LSQMAN.
Video 3
Transport cycle of MjNhaP1.
Substrate-induced conformational changes in MjNhaP1 from the outward-open sodium-free state at pH 4 to the inward-open state at pH 8 in the presence of sodium. The 6-helix bundle rotates by ∼7° with respect to the dimer interface, and the ion-binding site moves by ∼5 Å, resulting in alternating access to the ion-binding site from the cytoplasm or from the extracellular side. Cytoplasmic view (left) and side view (right). Structures were superimposed on the dimer interface and intermediate states were calculated using the program LSQMAN.
Tables
Table 1
X-ray crystallographic data
| Native | |
|---|---|
| Data collection | |
| Wavelength | 0.976 |
| Space group | P21 |
| Cell dimensions | |
| a, b, c (Å) | 98.4, 102.5, 132.1 |
| α, β, γ (°) | 90.0, 105.6, 90.0 |
| Resolution (Å) | 31.93–3.5 (3.72–3.5) |
| Rpim | 0.086 (0.573) |
| I / σI | 6.0 (1.7) |
| CC* | 0.999 (0.918) |
| Completeness (%) | 99.3 (99.2) |
| Multiplicity | 7.0 (7.2) |
| Refinement | |
| Resolution (Å) | 31.93–3.5 (3.72–3.5) |
| Unique reflections | 58,249 |
| Reflections in test set | 3115 |
| Rwork/Rfree (%) | 25.2/30.2 (34.4/39.2) |
| CC(work)/CC(free) | 0.905/0.930 (0.799/0.645) |
| Wilson B-Factor (Å2) | 141 |
| Atoms in asymmetric unit | 12,548 |
| Protein | 12,535 |
| Ligands | 13 |
| r.m.s. deviations: | |
| Bond lengths (Å) | 0.003 |
| Bond angles (°) | 0.785 |
Table 2
Electron crystallographic data
| pH 4, 0 mM NaCl | |
|---|---|
| Unit cell dimensions | a = 81.5 Å, b = 103.3 Å, c = 200 Å, γ = 90° |
| Two-sided plane group | p22121 |
| Number of images (tilt angles in brackets) | 15 (0°), 23 (20°), 44 (30°), 46 (45° and above) |
| In-plane resolution | 6 Å |
| Resolution in z directiona | 14 Å |
| Defocus range | 0,12–1,8 μm |
| Tilt range | 0–54° |
| Total number of observed reflectionsb | 47,064 |
| Observed unique reflections | 15,509 |
| Unique reflections in asymmetric unit | 2686 |
| Overall weighted phase residualb | 12.1° |
| Overall weighted R-factorb | 24.8% |
-
a
calculated from the point spread function of the experimental data.
-
b
calculated with program LATLINEK.
-
a,b Reflections with IQ ≤ 6 Å were included.
Download links
A two-part list of links to download the article, or parts of the article, in various formats.
Downloads (link to download the article as PDF)
Open citations (links to open the citations from this article in various online reference manager services)
Cite this article (links to download the citations from this article in formats compatible with various reference manager tools)
Structure and transport mechanism of the sodium/proton antiporter MjNhaP1
eLife 3:e03583.
https://doi.org/10.7554/eLife.03583


