Transcription mediated insulation and interference direct gene cluster expression switches
- University of Oxford, United Kingdom
- European Molecular Biology Laboratory, Germany
Figures
Figure 1 with 4 supplements

Reciprocal switching of expression by carbon source reveals links to the YMC.
(A) The distribution of all ORF-Ts into different YMC phases. OX, oxidative phase; RB, reductive building phase; RC, reductive charging phase of the YMC. (B, C, F) YMC profiles (SCEPTRANS; http://moment.utmb.edu/cgi-bin/main_cc.cgi) (Kudlicki et al., 2007) showing cycling expression at 124 genes with the (B) most reduced and (C) most increased transcription (NET-seq) after a switch from glucose (GLU) to galactose (GAL) for 3 h and (F) at the HMS2:BAT2 locus. (D) Overlap between all YMC classes and all ORF-Ts showing >threefold change in transcription on the GLU to GAL shift. (E) NET-seq reads on sense or antisense strands genome-wide in GLU (red) or GAL (blue) for ORF-Ts with peak expression in phases of the YMC indicated. (G) Strand-specific TIF-seq (Pelechano et al., 2013), microarray and NET-seq data at the HMS2:BAT2 locus. Profiles from cells cultured in GLU or GAL on the Watson strand (top) or Crick strand (bottom) are shown. The TIF-seq data indicate each different transcript isoform, microarray data indicate levels of steady-state poly(A)+ RNA (blue—darker colour for more RNA) and the NET-seq data (normalized, unique, and clipped to 3′OH) display transcript reads (scale 0–30) associated with elongating RNAPII. Screen shots are displayed using IGV (Robinson et al., 2011; Thorvaldsdottir et al., 2013).
Figure 1—figure supplement 1
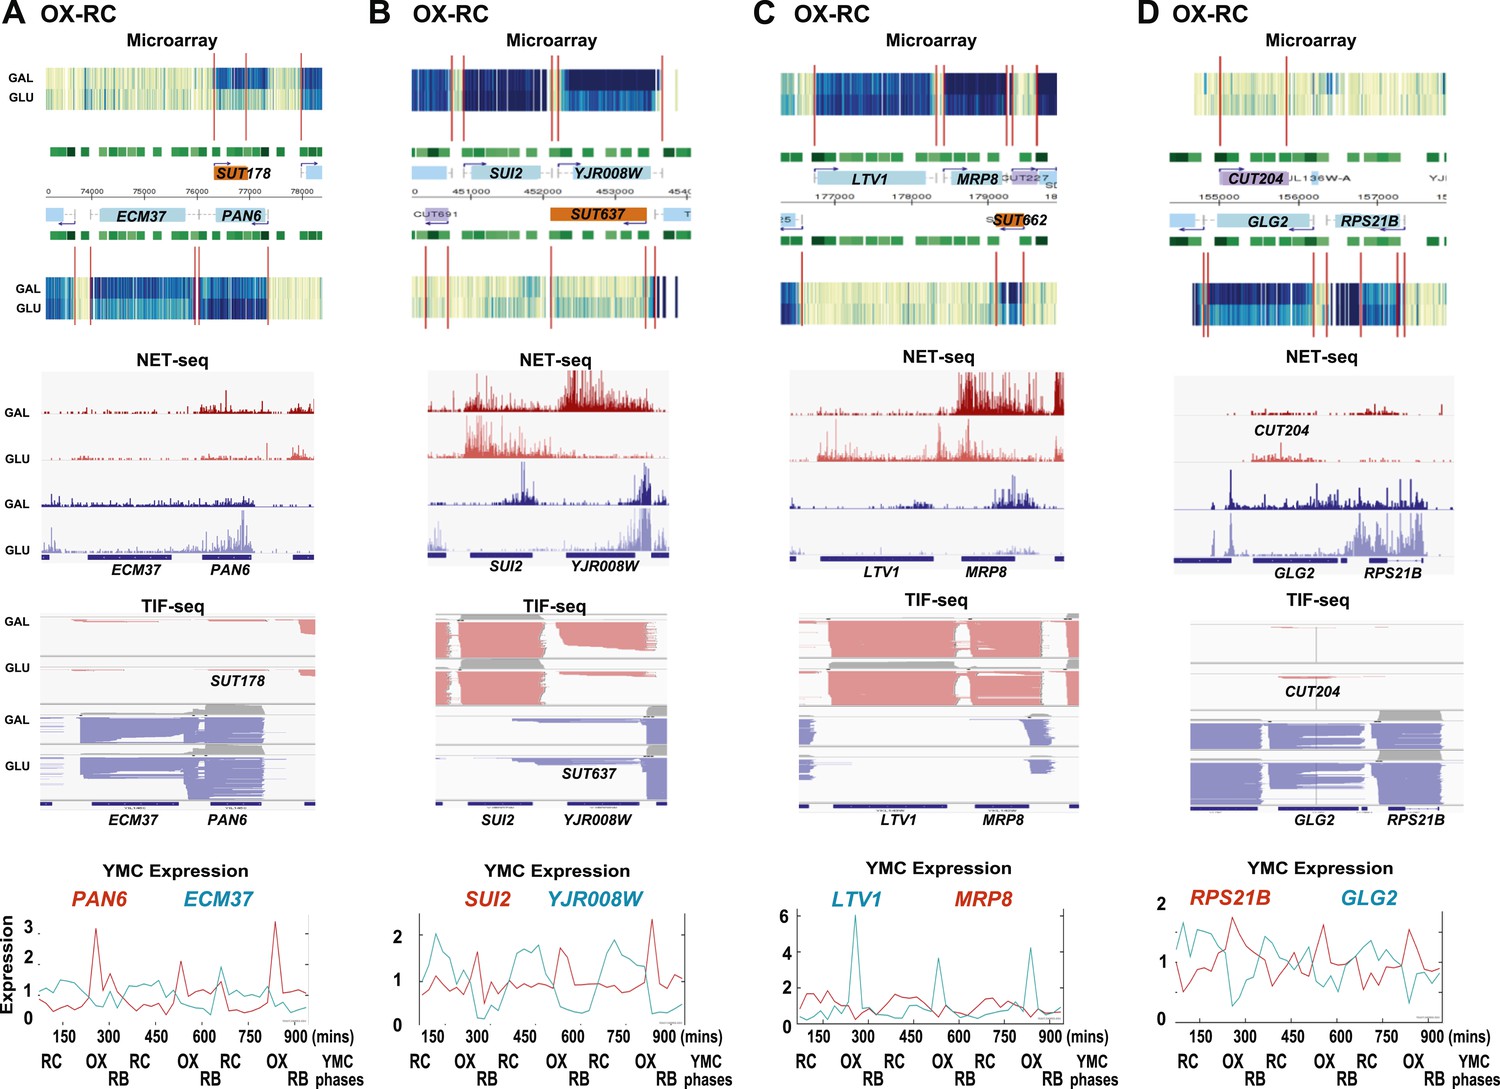
Exemplary tandem gene clusters and their regulation by carbon source and the YMC.
Supplements 1A–D, 2A–D, 3A–C show examples of tandem gene clusters with reciprocal switching of transcription by carbon source, di-cistrons, and antisense transcripts. Supplements 3D and 4A–D show examples of tandem gene clusters that do not show reciprocal switching of transcription by carbon source. Gene clusters were selected from the analyses in Supplementary files 1F–J. Each panel shows the poly(A)+ RNA profile by microarray, NET-seq, TIF-seq, and YMC profile screenshots for the Watson strand (top) or the Crick strand (bottom). Transcription over intergenic regions and di-cistonic transcripts is common to both groups of clusters.
Figure 1—figure supplement 2

Exemplary tandem gene clusters and their regulation by carbon source and the YMC.
Supplements 1A–D, 2A–D, 3A–C show examples of tandem gene clusters with reciprocal switching of transcription by carbon source, di-cistrons, and antisense transcripts. Supplements 3D and 4A–D show examples of tandem gene clusters that do not show reciprocal switching of transcription by carbon source. Gene clusters were selected from the analyses in Supplementary files 1F–J. Each panel shows the poly(A)+ RNA profile by microarray, NET-seq, TIF-seq, and YMC profile screenshots for the Watson strand (top) or the Crick strand (bottom). Transcription over intergenic regions and di-cistonic transcripts is common to both groups of clusters.
Figure 1—figure supplement 3

Exemplary tandem gene clusters and their regulation by carbon source and the YMC.
Supplements 1A–D, 2A–D, 3A–C show examples of tandem gene clusters with reciprocal switching of transcription by carbon source, di-cistrons, and antisense transcripts. Supplements 3D and 4A–D show examples of tandem gene clusters that do not show reciprocal switching of transcription by carbon source. Gene clusters were selected from the analyses in Supplementary files 1F–J. Each panel shows the poly(A)+ RNA profile by microarray, NET-seq, TIF-seq, and YMC profile screenshots for the Watson strand (top) or the Crick strand (bottom). Transcription over intergenic regions and di-cistonic transcripts is common to both groups of clusters.
Figure 1—figure supplement 4
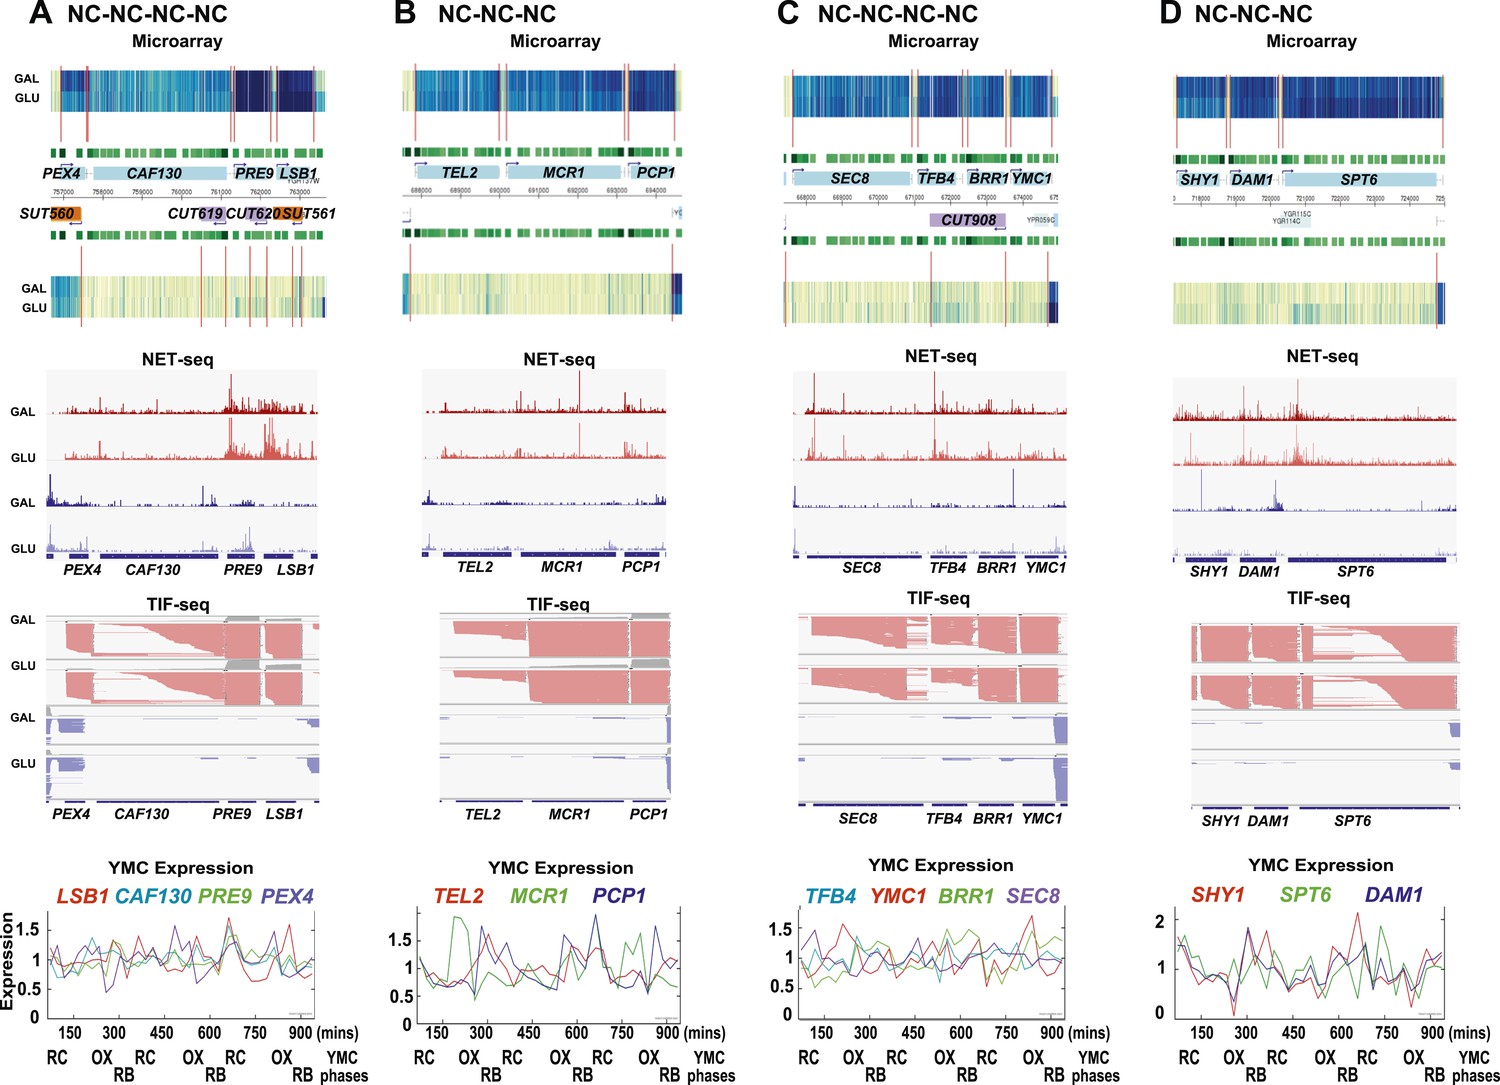
Exemplary tandem gene clusters and their regulation by carbon source and the YMC.
Supplements 1A–D, 2A–D, 3A–C show examples of tandem gene clusters with reciprocal switching of transcription by carbon source, di-cistrons, and antisense transcripts. Supplements 3D and 4A–D show examples of tandem gene clusters that do not show reciprocal switching of transcription by carbon source. Gene clusters were selected from the analyses in Supplementary files 1F–J. Each panel shows the poly(A)+ RNA profile by microarray, NET-seq, TIF-seq, and YMC profile screenshots for the Watson strand (top) or the Crick strand (bottom). Transcription over intergenic regions and di-cistonic transcripts is common to both groups of clusters.
Figure 2 with 1 supplement
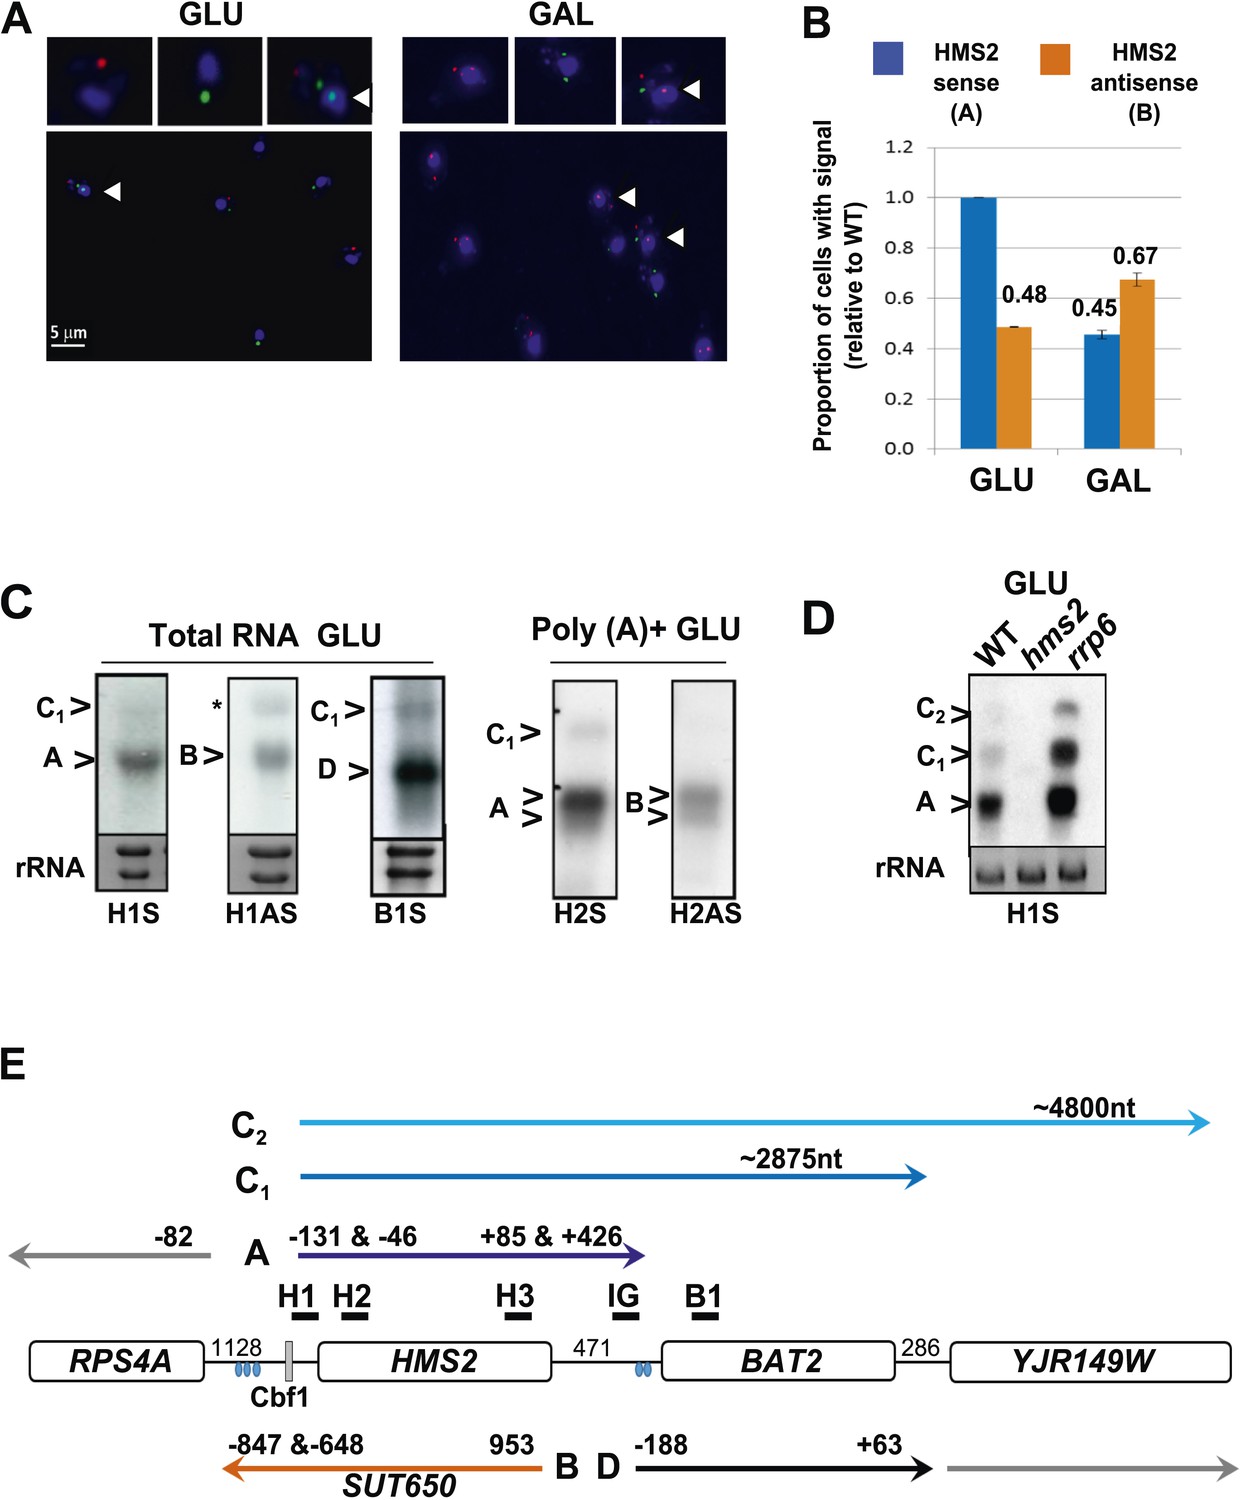
Characterization of transcripts around the HMS2:BAT2 locus (A).
Visualizing HMS2 transcripts using RNA fluorescence in situ hybridization (RNA FISH) in single cells using a combination of four, 50 nt DNA probes labelled with four fluorophores, either Cy5 (sense) or Cy3 (antisense), hybridised to paraformaldehyde-fixed yeast cells. DAPI (blue) marks the nucleus. Smaller boxes are zoomed images of selected cells in the field of view. Cells with nascent nuclear transcription event are marked with arrows. The images presented here are part of larger data sets. The graph (B) represents the proportion of sense- and antisense-expressing cells between growth conditions from different experiments. A total of ≈250 cells were assessed in each growth condition. The mean (MAX) signal from an hms2Δ strain prepared at the same time was used to threshold the signal intensity. Error bars are SEM, n = 2, Figure 2—source data 1A. (C) Northern blots of total and poly(A)+ selected RNA from WT cells probed with HMS2 (H) and BAT2 (B) sense (S)- and HMS2 antisense (AS)-specific probes (positions indicated in Figure 2E). Note the HMS2 antisense probe shows cross-hybridization with the 25S rRNA and is marked * in this and subsequent figures. Ethidium bromide-stained rRNA is used as a loading control. (D) Northern blot of total RNA showing HMS2 sense transcripts in strains indicated. (E) Map of transcripts (A to D) around the HMS2 locus showing approximate length, initiation sites, and termination sites relative to the ATG for each gene (see also Figure 2—figure supplement 1). The Cbf1 transcription factor binding site is shown (grey boxes). Different transcripts are coloured: blue for HMS2, orange for SUT650, black for BAT2, and grey for RPS4A and YJR149W. Transcripts are shown on the top or bottom of the schematic to reflect linked expression. Thick black lines indicate probe position for Northern blots, with the name of the probe above.
-
Figure 2—Source data 1
(A) Source data for Figure 2B, (B) Source data for Figure 2—Supplement 1B.
- https://doi.org/10.7554/eLife.03635.009
Figure 2—figure supplement 1
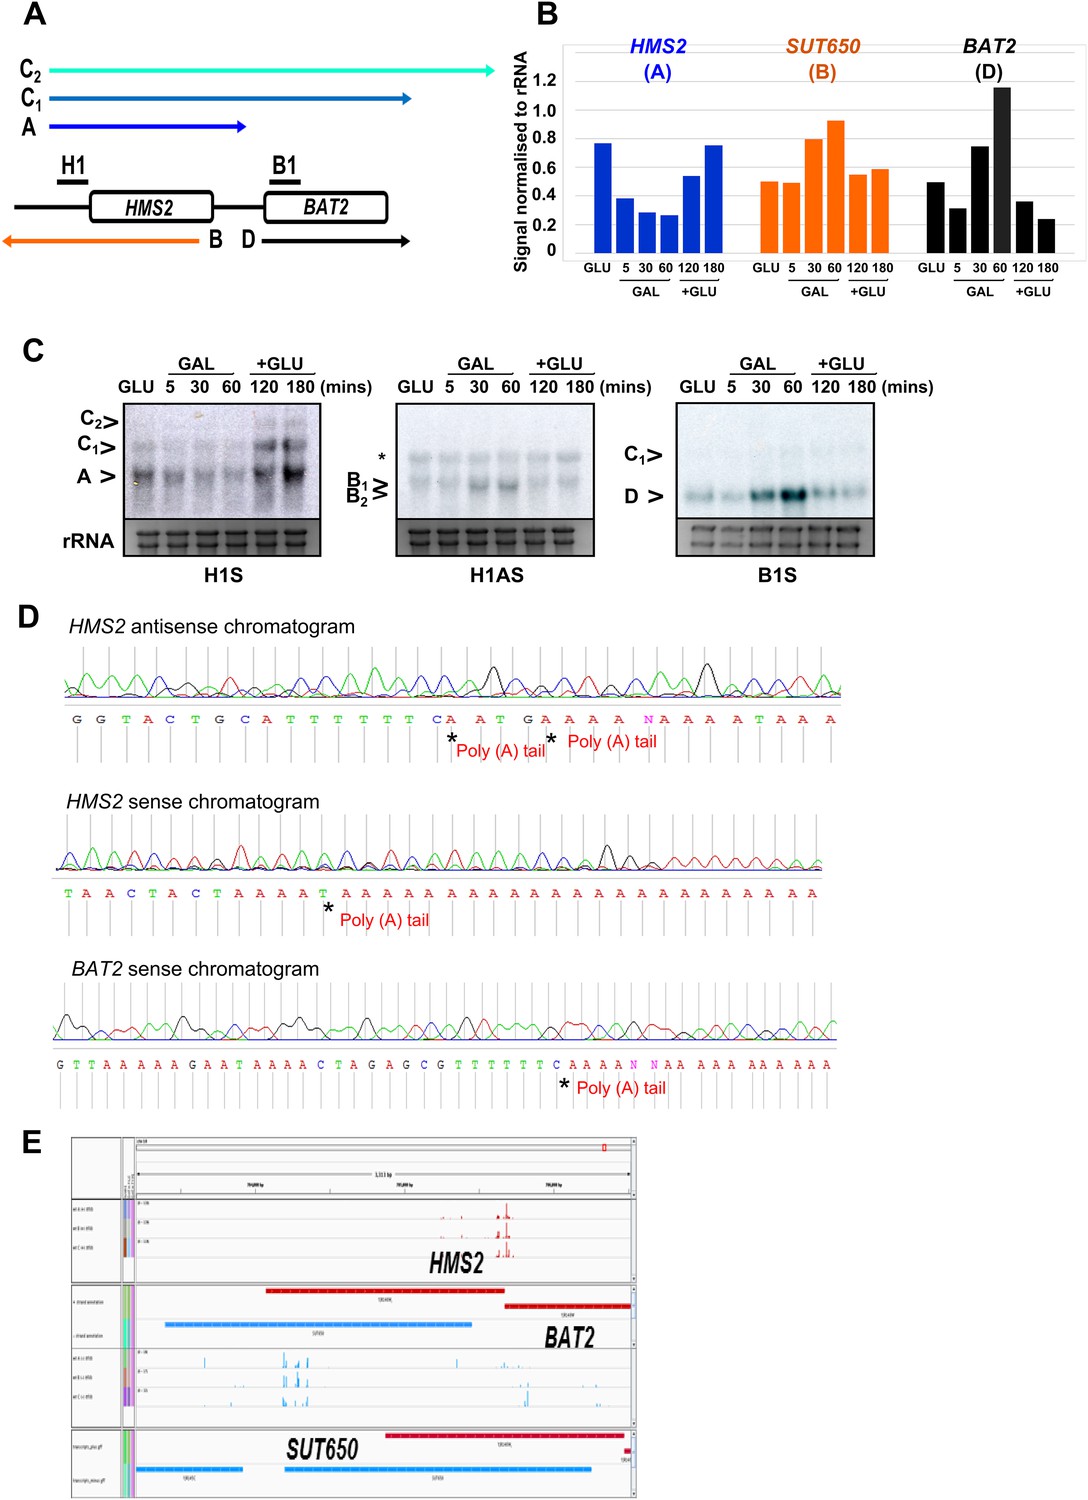
Characterization of transcripts around the HMS2:BAT2 locus.
(A) Map of transcripts. (B) Histogram showing quantitation of the Northern blot in (C) Figure 2—source data 1B. (C) Northern blot showing carbon source regulation of HMS2, SUT650, and BAT2 transcripts. Total RNA was prepared from cells growing exponentially in glucose, after 5, 30, or 60 min in galactose and then after transfer back to glucose for 1 or 2 hr. (D) Chromatograms showing sequence from 3′RACE mapping of transcripts at HMS2, BAT2, and SUT650 (HMS2 antisense). The positions of the poly(A) tails are indicated. (E) Screen shot of poly(A) site mapping at the HMS2 sense transcript (red, top panel) and SUT650 antisense (blue, bottom panel). Data in (E) taken from Pelechano et al. (2013); Wilkening et al. (2013).
Figure 3
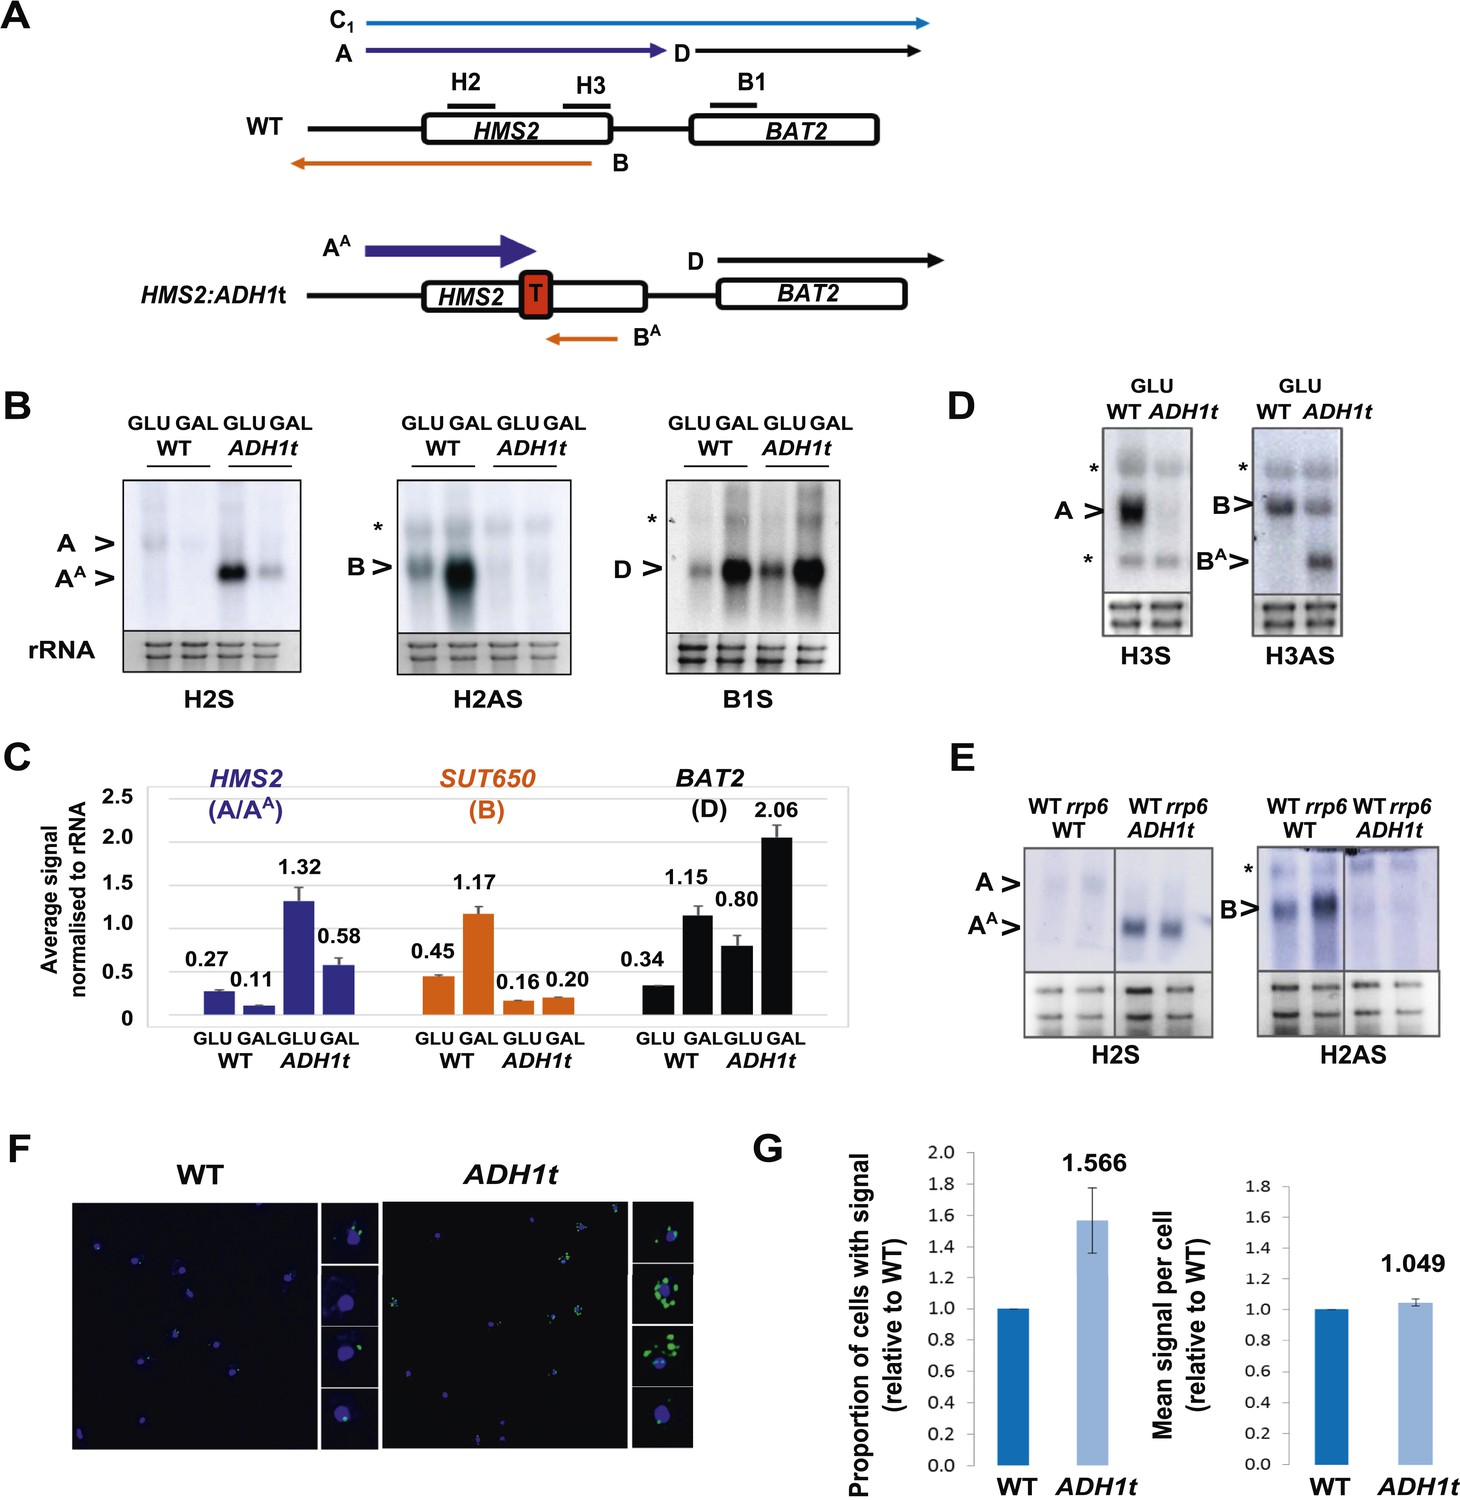
HMS2 mediates transcriptional interference of BAT2.
(A) Schematic showing constructs and transcripts at the WT HMS2:BAT2 locus and after insertion of the ADH1 terminator (T). (B) Exemplarily autoradiographs of Northern blots of total RNA prepared from the constructs in (A) cultured in glucose or after 60 min in galactose probed for the HMS2 sense, the SUT650 antisense, and the BAT2 sense transcripts. (C) Quantitation of autoradiographs showing average signal normalized to rRNA for the transcripts indicated. n = 2, errors are SEM, Figure 3—source data 1A. (D, E) Exemplarily autoradiographs of Northern blots of total RNA prepared from the strains indicated containing the constructs in (A) cultured in glucose probed for the regions indicated. (F) Visualizing HMS2 sense transcripts using fluorescence in situ hybridization (FISH) in single cells using a combination of four, 50 nt DNA probes labelled with four Cy5 fluorophores (green, sense), hybridised to paraformaldehyde-fixed yeast cells. The nucleus is shown in blue (DAPI). Smaller boxes are zoomed images of select cells in the field of view. The images presented here are part of a larger data set. (G) The graphs represent the proportion of sense-expressing cells in the WT compared to HMS2:ADH1t and the mean signal per cell. A total of ≈500 cells were assessed for each strain. Error bars are SEM; n = 4, Figure 3—source data 1A,C).
-
Figure 3—source data 1
- https://doi.org/10.7554/eLife.03635.012
Figure 4 with 1 supplement
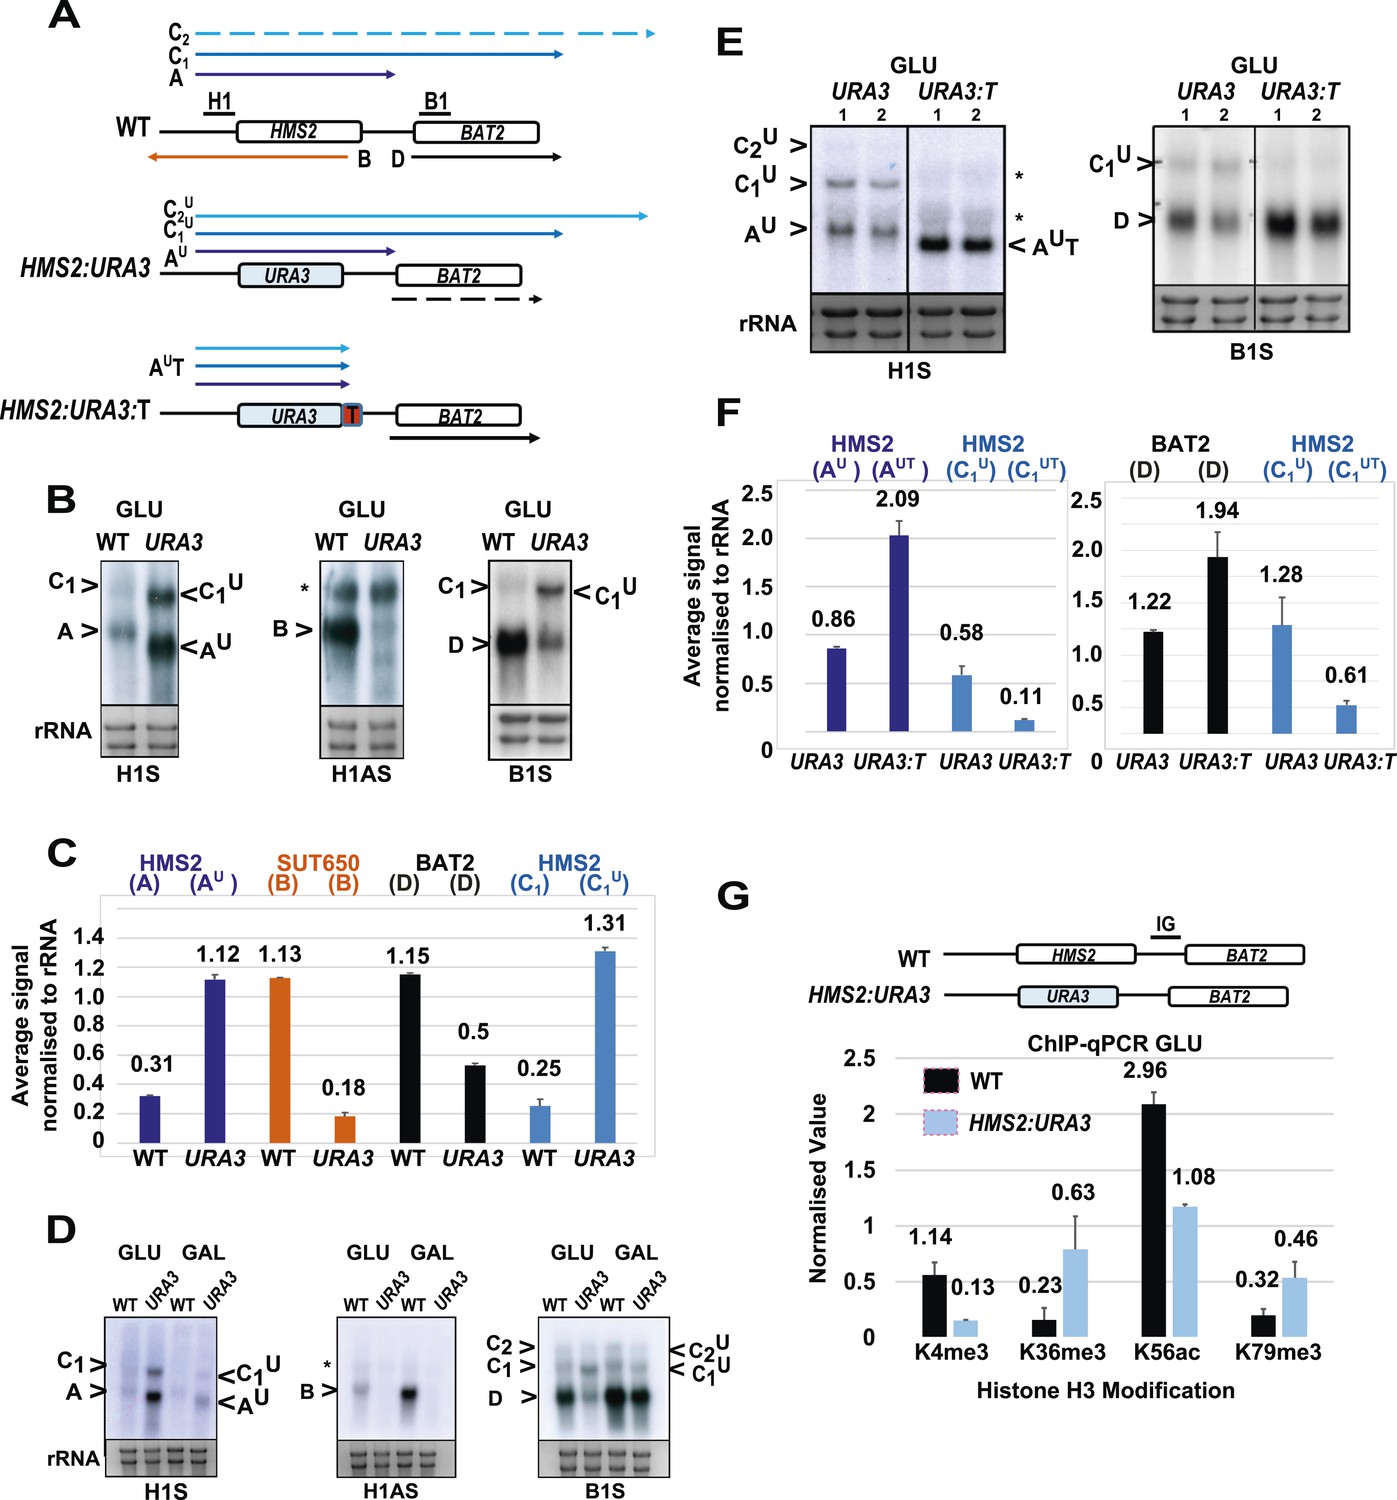
SUT650 antisense transcription insulates BAT2 from interference by HMS2.
(A) Schematic showing transcripts after replacement of the HMS2 coding region (top) with the URA3 coding region (middle) or URA3 plus a transcription terminator (T) (bottom). Transcripts resulting from the URA3 insertions are identified with a superscript U or UT. (B, D, E) Northern blots of total RNA in strains with the HMS2 coding region replaced with the URA3 coding region in glucose (B), after 1 h in galactose (D) or in glucose with a terminator (T) inserted after URA3 (E). In (E), samples were run on the same gel but intervening tracks removed. (C) Quantitation of transcripts for WT and HMS2:URA3 in glucose, n = 2, errors are SEM, Figure 4—source data 1A. (F) Quantitation of transcripts in (E) for HMS2:URA3 and HMS:URA3:T in glucose, n = 2, errors are SEM, Figure 4—source data 1B. (G) Chromatin immunoprecipitation (ChIP-qPCR) at the HMS2:BAT2 intergenic region (IG) in strains indicated using antibodies with the specificities indicated. Signals were normalized to Histone H3 and then the signal in the coding region of TUB2. Error bars are SEM for n = 2; Figure 4—source data 2.
-
Figure 4—source data 1
- https://doi.org/10.7554/eLife.03635.014
-
Figure 4—source data 2
Source data for Figure 4G.
- https://doi.org/10.7554/eLife.03635.015
Figure 4—figure supplement 1
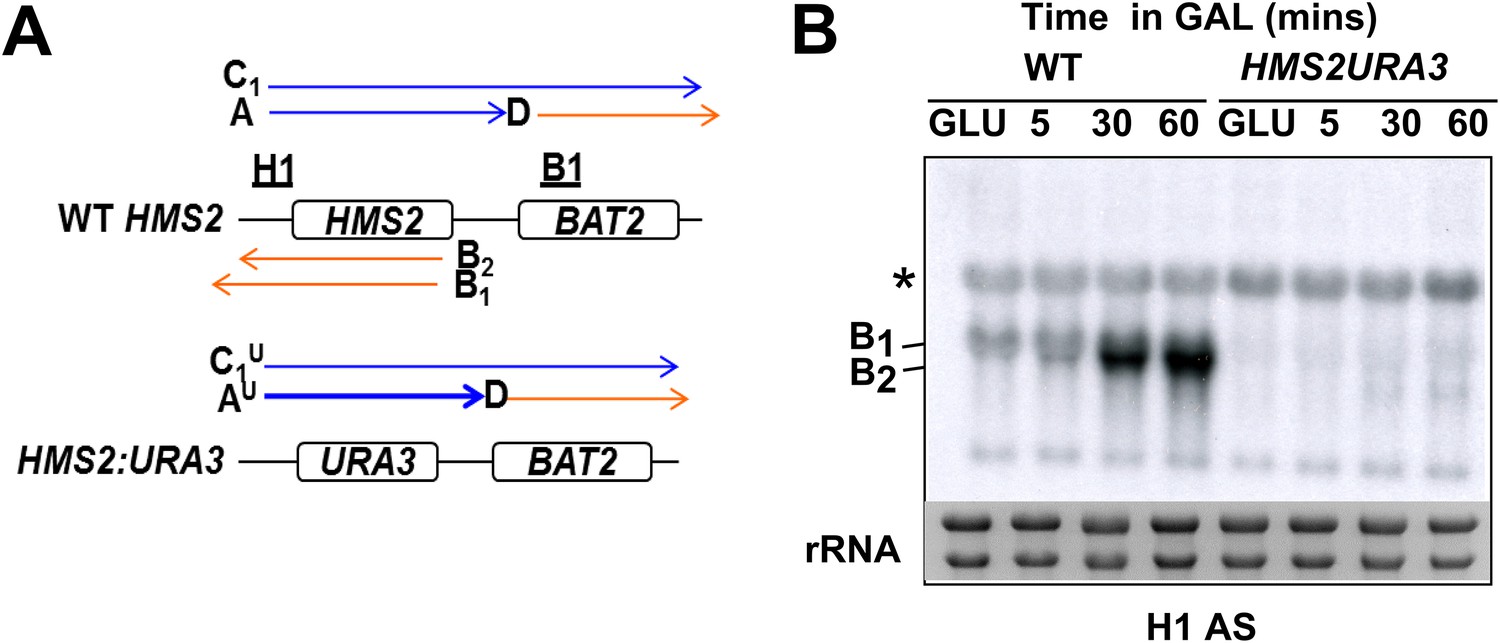
No SUT650 antisense transcription in either GLU or GAL in the HMS2:URA3 strain.
(A) Schematic showing transcripts after replacement of the HMS2 coding region (top) with the URA3 coding region (bottom). (B) Northern blots of total RNA in WT strain or with the HMS2 coding region replaced with the URA3 coding region in glucose or after 5, 30, and 60 min in galactose.
Figure 5 with 1 supplement
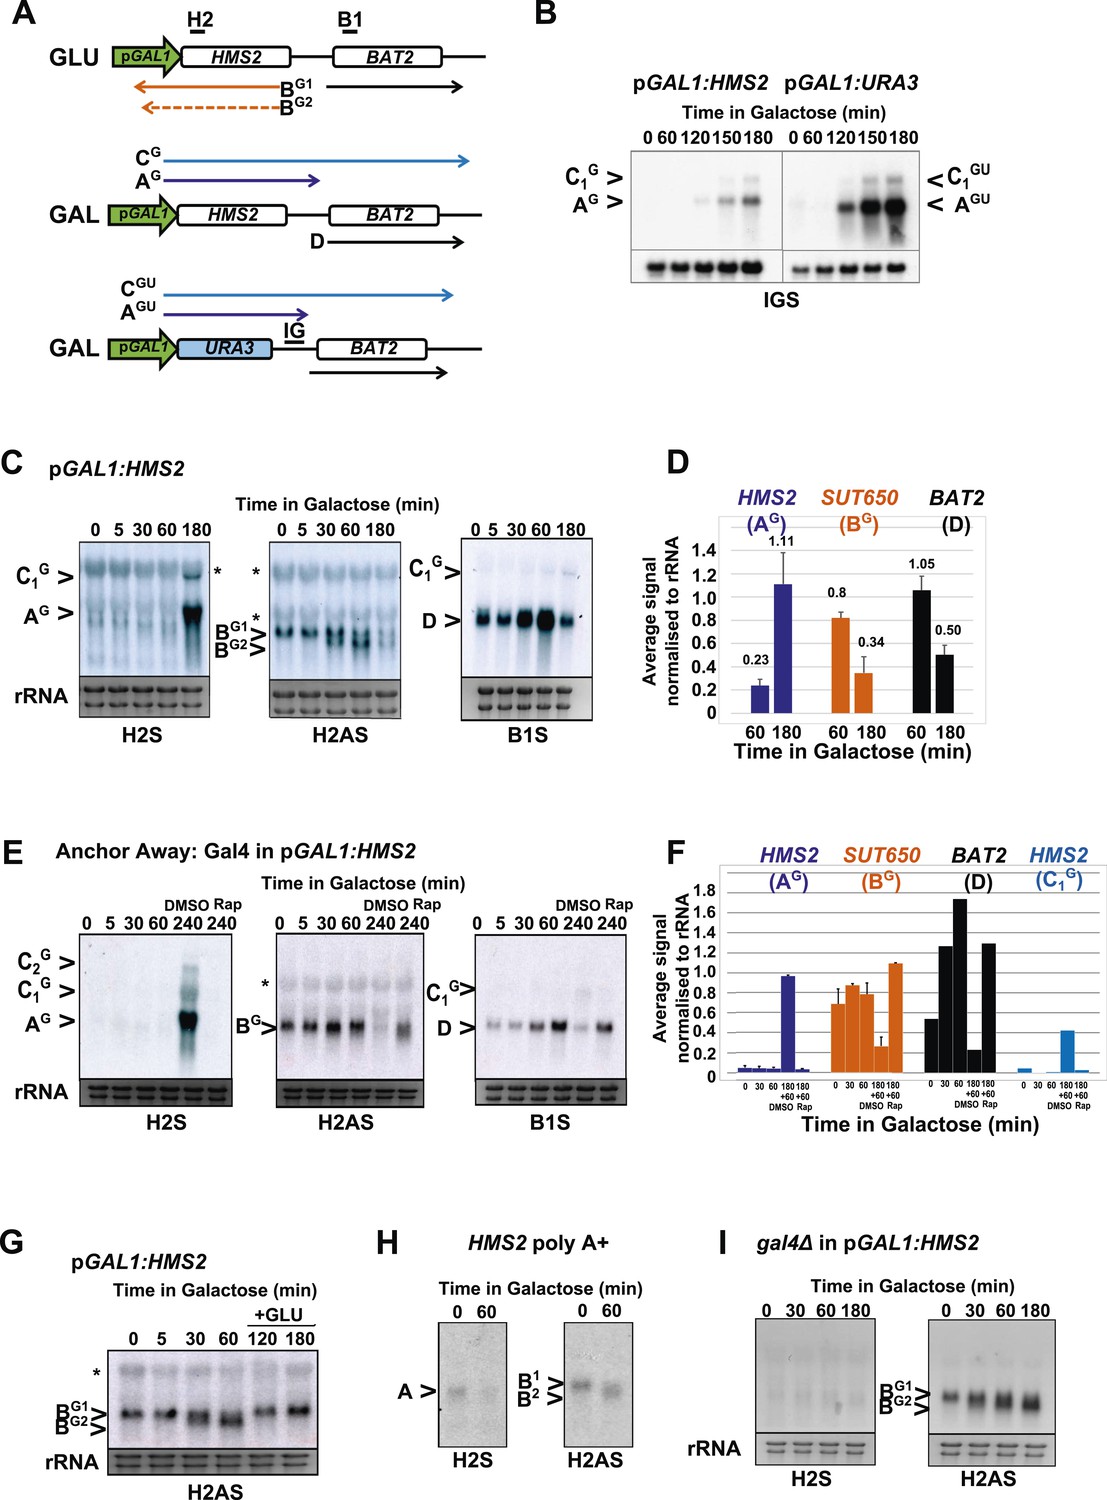
HMS2 sense transcription represses the HMS2 antisense transcript and BAT2.
(A) Schematic showing transcripts when expression of HMS2 is regulated by the GAL1 promoter (pGAL1) in glucose (antisense-dominant state) or galactose (sense-dominant state) or when the HMS2 coding region is substituted with the URA3 coding region. (B, C, E, G–I) Northern blots showing total RNA (C, E, G, I) or poly(A)+ RNA (B, H) from cells expressing pGAL1:HMS2 cultured in glucose (GLU) or induced for the times indicated in galactose (GAL) in the genetic backgrounds indicated. (D, F) Quantitation of the experiments exemplified in (C) and (E) respectively, n = 2, error are SEM, Figure 5—source data 1A,B,C. (E, F) Anchor Away of Gal4 is achieved after incubation with rapamycin in DMSO for 1 h, added 3 h after induction with galactose (240 Rap). The control culture (240 DMSO) was treated with DMSO. See also Figure 5—figure supplement 1.
-
Figure 5—source data 1
- https://doi.org/10.7554/eLife.03635.018
Figure 5—figure supplement 1
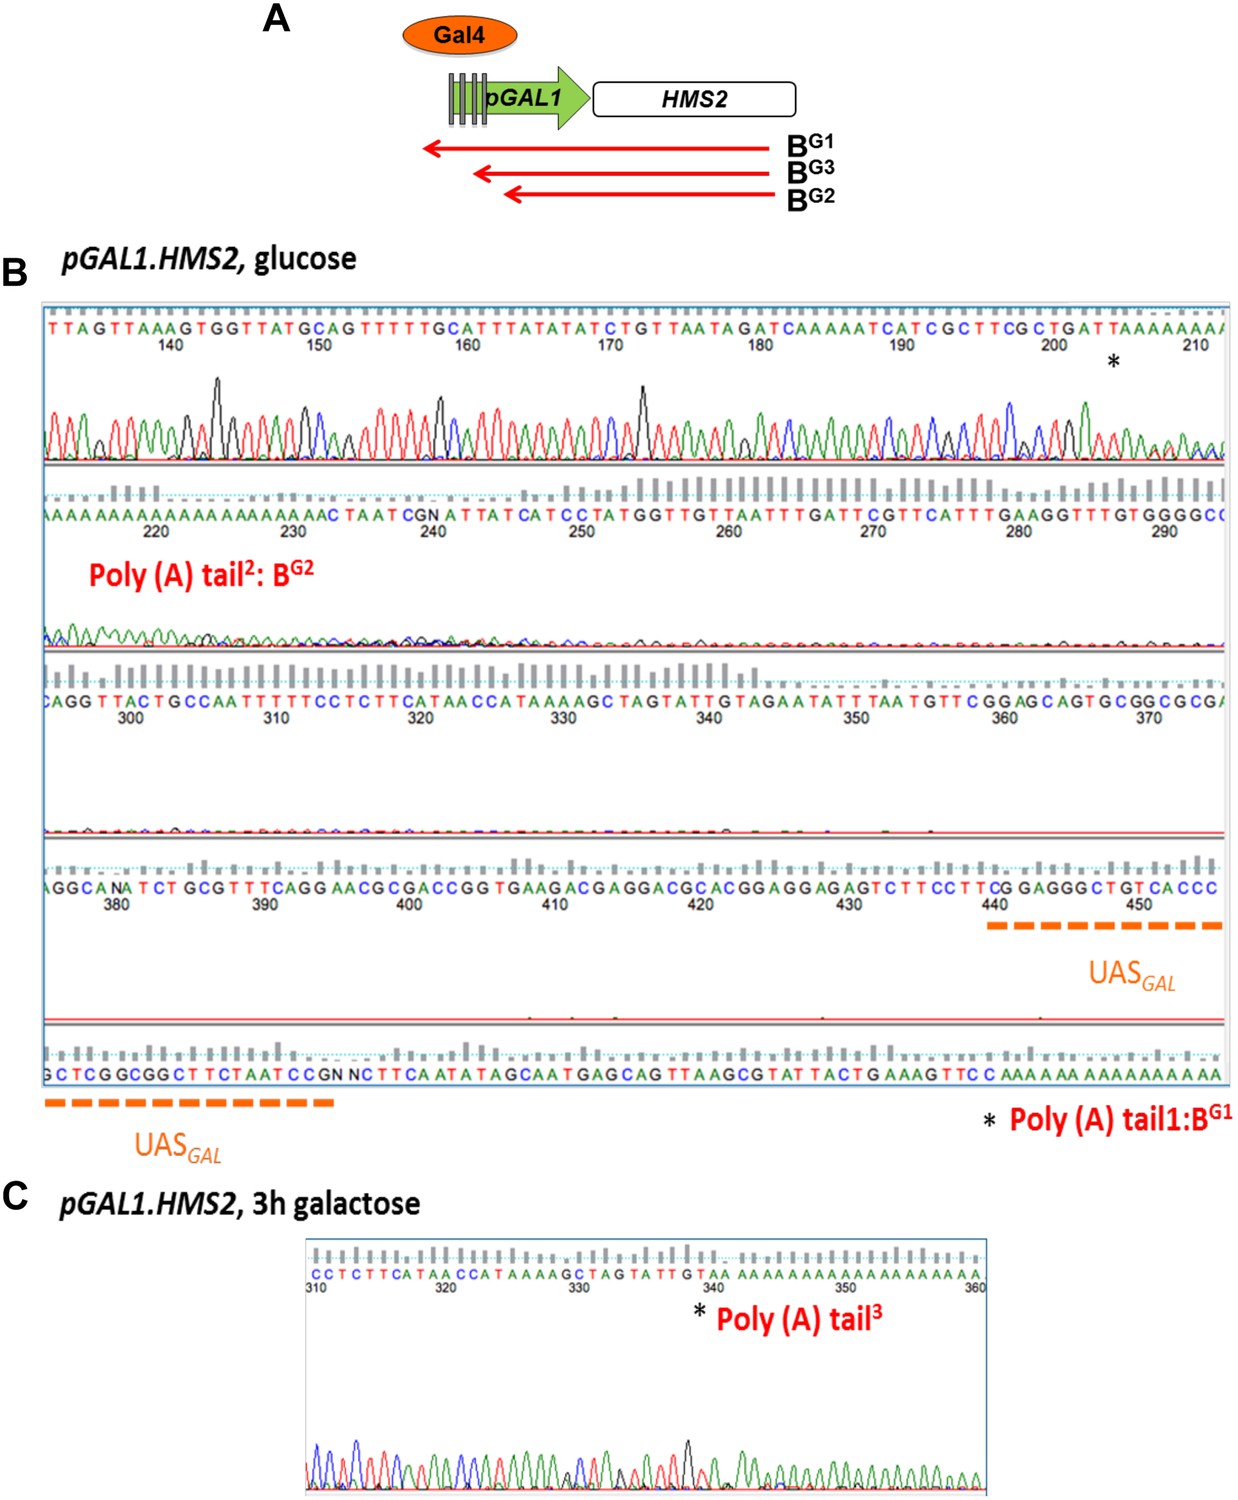
Mapping the 3′ ends of the pGAL.HMS2 antisense transcript isoforms.
(A) Schematic of the pGAL1.HMS2 transcription unit. (B) 3′RACE performed on the galactose-inducible HMS2 strain in glucose displays evidence of two poly(A) tails, one consistent with the short, BG2, AS isoform (poly(A) tail2) terminating at a region downstream of the UASGAL (underlined in orange) ≈195 nt upstream of the GAL1 ATG and the long isoform, BG1, terminating at a region upstream of the UASGAL (poly(A) tail1), ≈500 nt upstream of the GAL1 ATG. (C) Evidence for an intermediate species, BG3, not resolvable using Northern analysis, was detected after 3′ RACE was performed on cells grown in galactose for 3 hr. Potential end sites are marked with an asterisk.
Figure 6 with 1 supplement
General and specific transcription factors control state switching at HMS2.
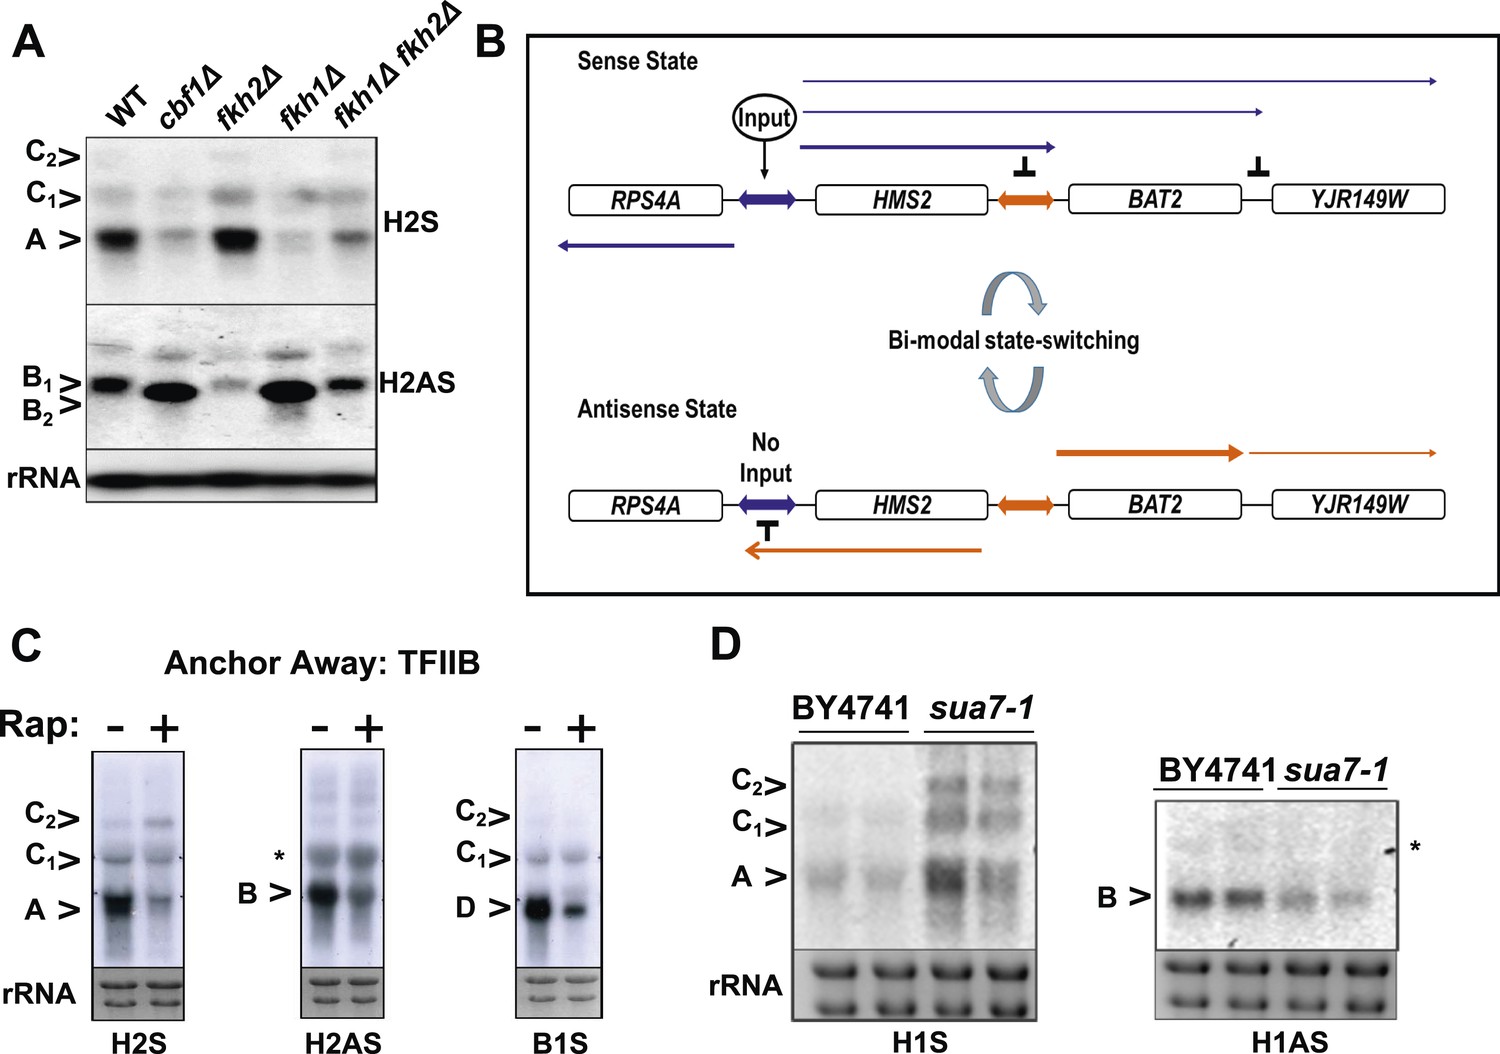
(A, C, D) Northern blots showing sense or antisense-dominant state at HMS2 in strains lacking general or specific transcription factors. (A) Strains were cultured in YPD depleted for tryptophan. (B) Model for state-switching between a sense-dominant state and an antisense-dominant state by transcription factors (Input) at the divergent promoters between RPS4A and HMS2 (blue double arrow) and HMS2 and BAT2 (orange double arrow). During growth in glucose (high input), cells cycle between the sense-dominant state and the antisense-dominant state with the majority of cells existing in the sense-dominant state. During growth in galactose (low input), cells cycle between the sense-dominant state and the antisense-dominant state with the majority of cells existing in the antisense-dominant state. (C) Anchor Away of TFIIB (Sua7) is achieved after incubation with rapamycin (Rap) (+) in DMSO for 1 h or DMSO alone (−). (D) Biological replicates for the WT strain BY4741 and the isogenic strain expressing the sua7-1 allele are shown.
Figure 6—figure supplement 1
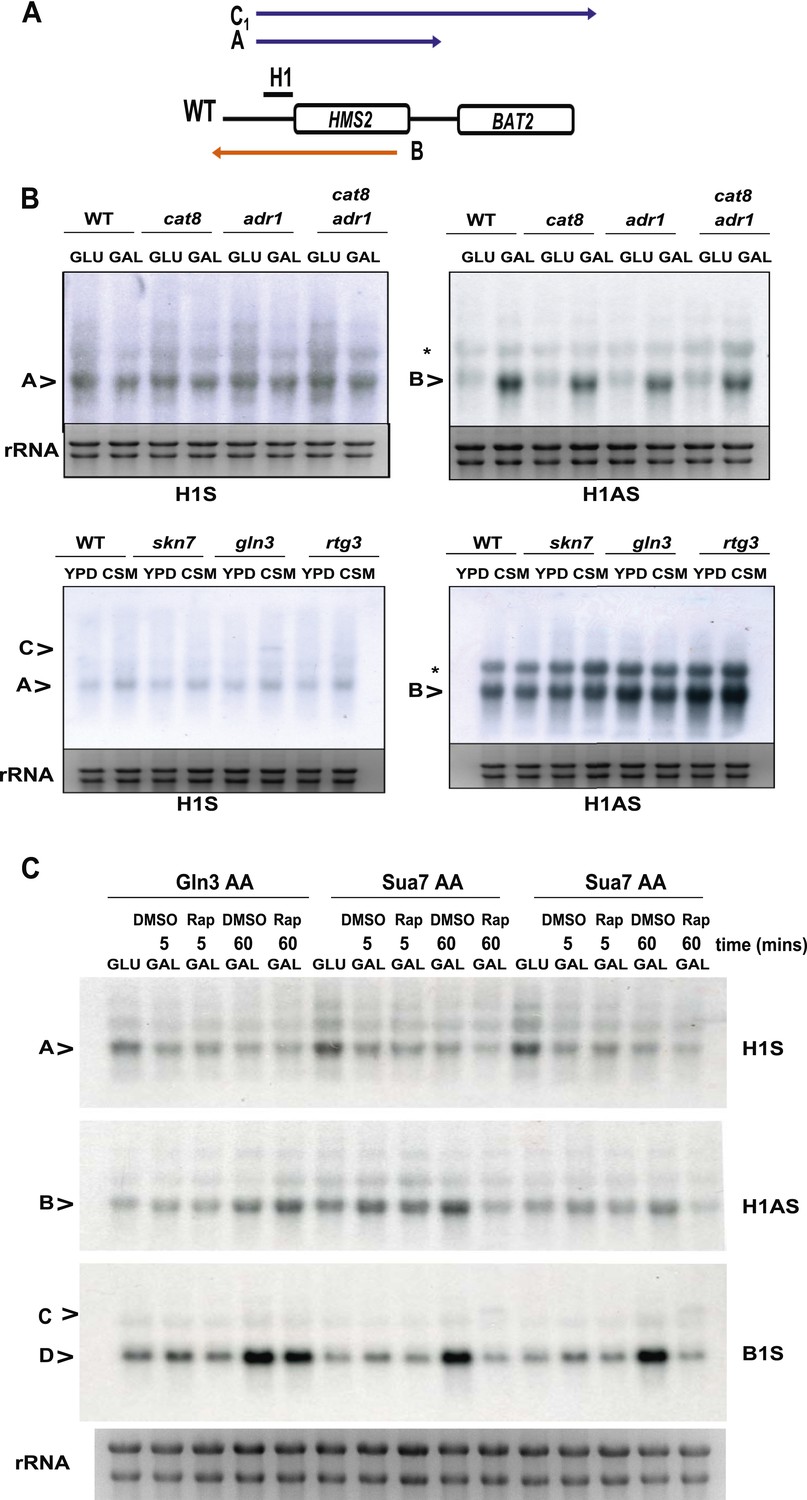
The effect of deletion or ablation of transcription factors with putative binding sites at the HMS2:BAT2 intergenic region on HMS2:BAT2 transcripts.
(A) Schematic of transcripts. (B, C) Northern blot analysis in the strains indicated. (B) In the top panel strains were grown in glucose (−) or for 1 hr in galactose (GAL, +). In the bottom panel, strains were cultured in YDP (Y) or CSM (-C). (C) Anchor Away (AA) analysis of Gln3 and Sua7 (repeated experiment) after 5 min or 60 min treatment with Rapamycin (Rap) in the conditions shown and probed for HMS2, SUT650, and BAT2 transcripts.
Figure 7 with 1 supplement
The plasticity of transcription units.
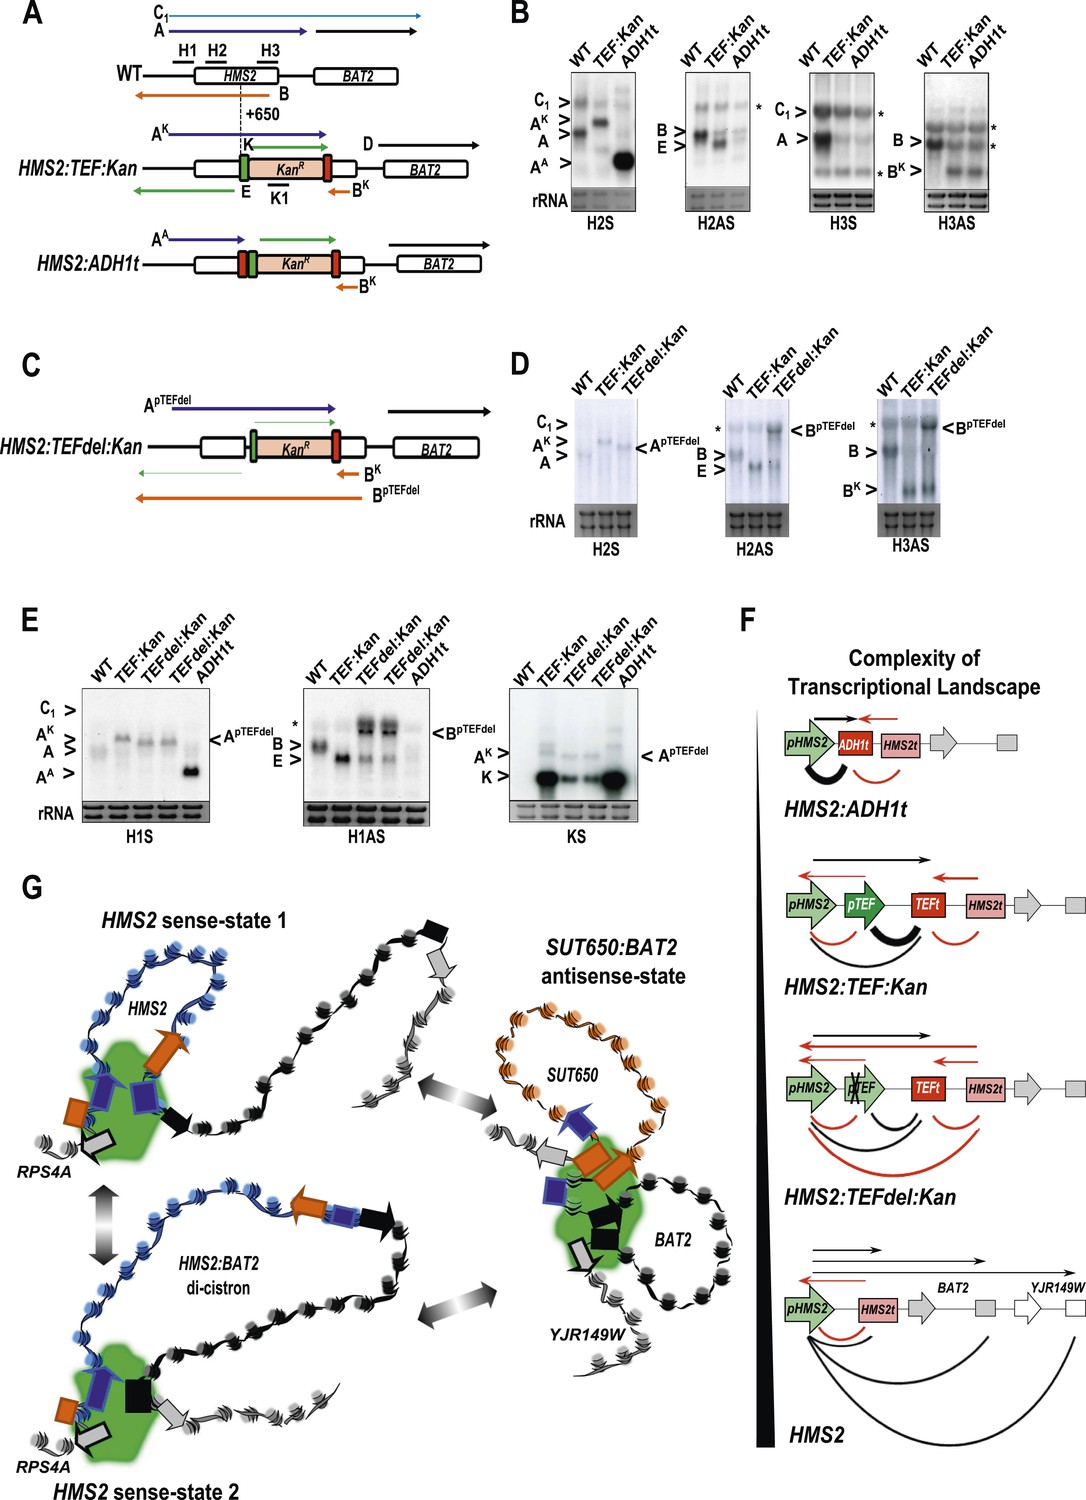
(A, C) Schematic of constructs showing transcripts and position of probes. Transcripts resulting from the pTEF:kanMX:TEFt insertion, the same construct with the ADH1 terminator (pink box), or the TEF:kanMX:TEF insertion with a deleted TEF promoter (p) are identified with a superscript K, A, or pTEFdel, respectively (see Figure 7—figure supplement 1 for more details). (B, D, E) Northern blots in the strains indicated showing the conditional nature of the TEF terminator (t) when the pTEF is compromised. (F) Modelling transcription in an interleaved genome demonstrating an increase in complexity of the transcriptional landscape as the strength of terminators and promoters decreases. Constructs representing each state are indicated; grey and white boxes are downstream TUs. Solid directional boxes are promoters; squares are terminators. Deeper colour indicates increased strength. Arrows on top of diagrams represent the transcripts initiating or terminating at pHMS2 and HMS2t (black sense; red antisense). Curved lines under diagrams show the extent of each individual transcription unit. Transcription units are envisaged as dynamic with any one region only involved in one TU at any time in an individual cell (see Figure 7G). Weakening of pTEF in the HMS2:TEF:Kan construct results in a level of transcription complexity (number of different TUs) similar to the native HMS2 locus. (G) Schematic showing the dynamic alternative transcription units at the HMS2:SUT650:BAT2 locus. Directional boxes are promoters, squares are terminators coloured coded according to the nature of the TU to which they belong (blue, HMS2; black, BAT2; Orange, SUT650; Grey, RPS4A and YJR149W). HMS2 forms alternative TUs with its own terminator (sense-state 1) or with the BAT2 terminator (sense-state 2—a di-cistronic transcription unit) excluding the SUT650, BAT2, and YJR149W promoters from a region where transcription can occur (green shading). RPS4A, an OX gene expressed divergently from HMS2 is active. The sense state predominates in the OX phase of the YMC and during growth on GLU. Any promoter or terminator excluded from the transcription machinery is neutral to the transcription process, explaining how both promoters and terminators are subject to extensive read-through transcription. The sense-state toggles to the alternative antisense-state, predominant in GAL and during the RC phase of the YMC. Here, the formation of the SUT650 transcription unit excludes the HMS2 and RPS4A promoters from the transcription machinery. This relieves interference of BAT2 and YJR149W by HMS2 sense transcription. One transcription unit is envisaged to exist in one cell at any one time. The antisense state is the default, requiring transcription factor-dependent activation at HMS2 to switch to the sense state.
Figure 7—figure supplement 1
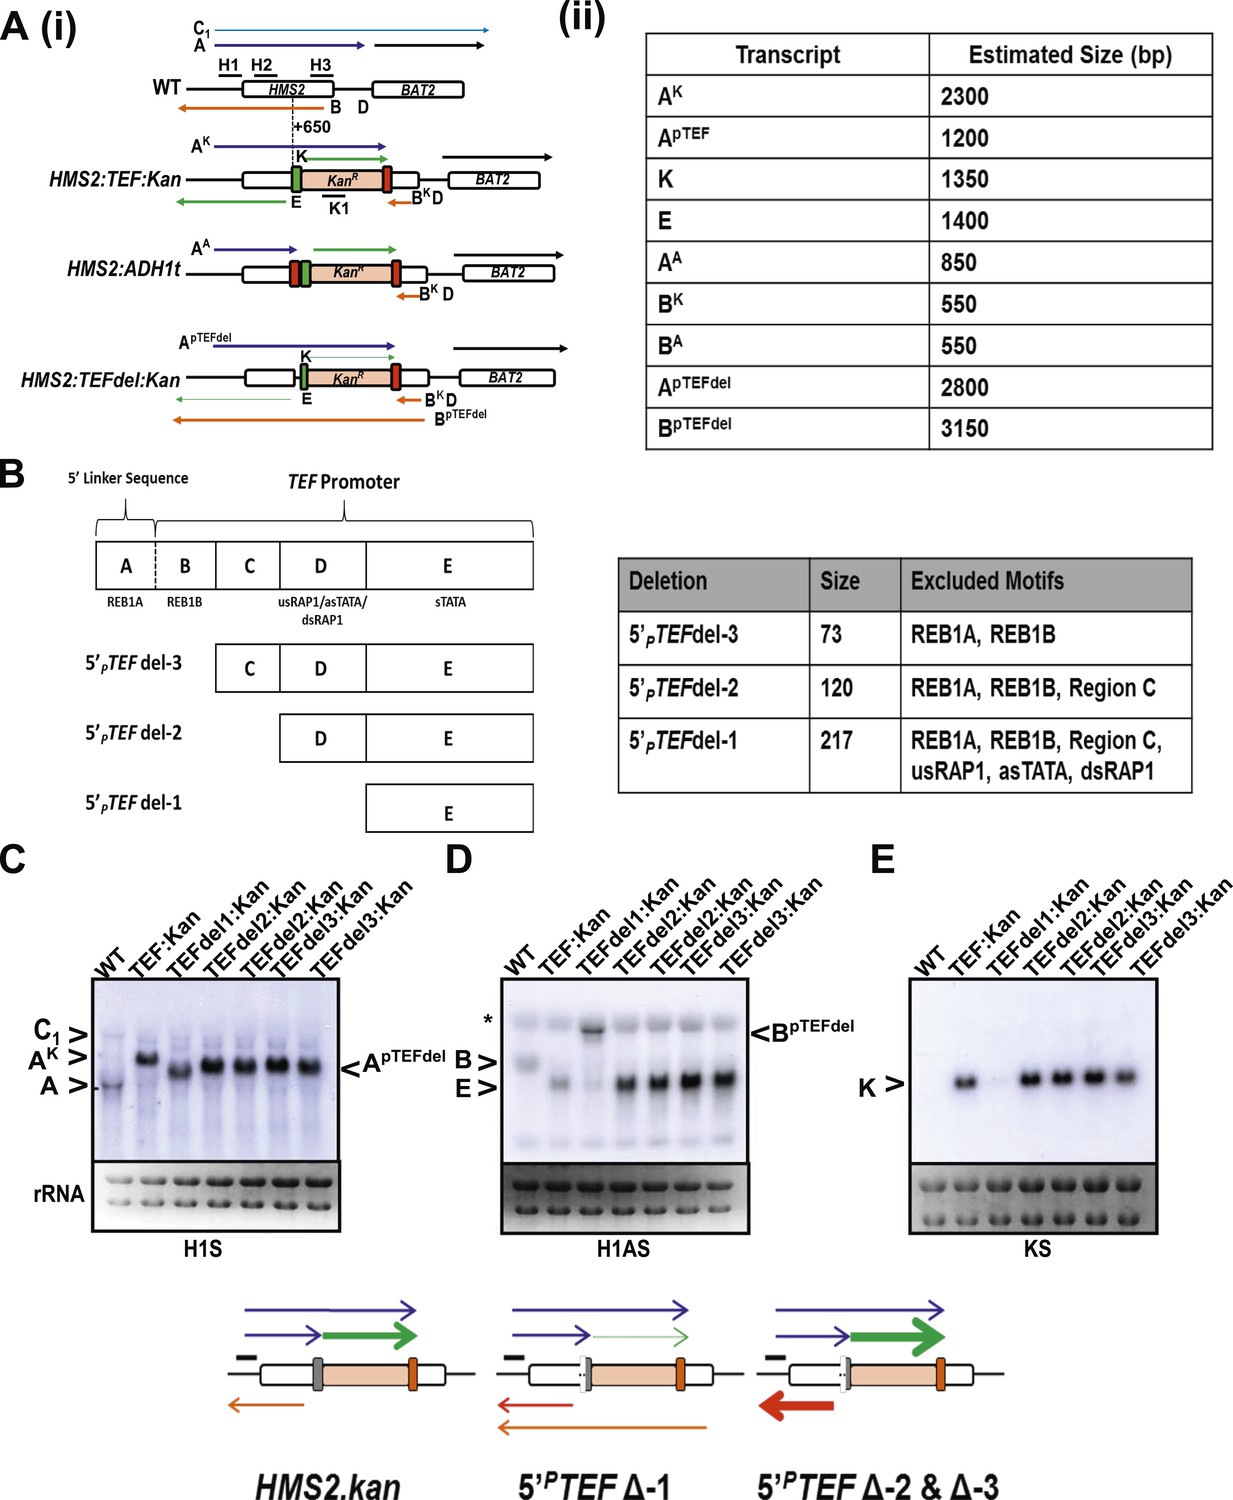
Creating and characterizing an interleaved locus around HMS2.
(A) Schematic (i) and estimated sizes (ii) of transcripts in the HMS2.kan, HMS2 TEFΔ1.kan, and HMS2.ADH disruption strains. (B) Dissection of the 5′ region of the TEF promoter. The TEF promoter can be divided into 5 arbitrary regions based on the presence of putative transcription factor binding sites. Schematic of TEF promoter dissection depicting the remaining promoter sequence after deletions (del or Δ) were introduced. 5′PTEFdel-2 excluded regions C, which contained no sequence of particular interest, and regions A and B, which contained the putative Reb1 binding sites, REB1A and REB1B. In 5′PTEFdel-3, regions A and B were excluded, effectively deleting all of the putative Reb1 binding sites but leaving most of the TEF promoter intact. A 217 bp deletion was introduced at the 5′ region of the TEF promoter to create the 5′ PTEFdel-1. The correct deletions were confirmed by DNA sequencing. (C) Northern analysis of 5′PTEF mutant strains. The deletions in the 5′TEF are reflected by the shift in size of the PHMS2-kan-TEFt sense transcript (transcript A). (B) In the antisense direction, only the 5′PTEFdel-1 deletion results in the reduction of the AS transcript (transcript E) and the generation long antisense transcripts (BpTEFdel). In contrast, the 5′PTEF del-2 and 5′PTEF del-3 mutations resulted in an increase in AS transcript E levels. (D) Using the K1 sense probe, the increase in transcript E was reflected by an increase in detectable levels of Kanr transcript (transcript K). Transcripts of interest are also depicted in the miniature transcript maps below the blots.
Additional files
-
Supplementary file 1
(A) Genome-wide NET-seq (NET) and poly(A)+ RNA hybridised to microarray (mi). (B) Data for Pie Charts in Figure 1. (C) YMC genes (Coloured in columns A, C, and E) that overlap with genes whose transcription changes >threefold on the GLU to GAL shift (Column G—complete list colour coded). (D) Gene Ontology (GO) associated with genes that change >threefold on the GLU to GAL shift. (E) Annotated CUTs and SUTs that change >threefold on GLU to GAL shift (from Supplementary file 1A). (F) Extracted data from genome-wide simulation of gene type, orientation, and regulation. (G). Gene Groups from genome-wide annotations of OX.RC, RC.OX, and non-cycling (NC) pairs in tandem—used to provide information for Supplementary file 1J and to derive the distinct environments surrounding pairs of cycling or non-cycling genes. (H) Selected genes from Supplementary file 1A and analysis of their environment. (I) Genes that change >threefold on the GLU/GAL shift that also have an annotated antisense CUT or SUT that also changes >threefold on the GLU/GAL shift. (J) Selected gene clusters resembling HMS2:BAT2. (K) Transcription-related factors enriched at the promoters of RC or OX genes. (L) Genotype of yeast strains used in this study. (M) Primers used for 3′RACE. (N) Primers used to generate strand-specific probes for Northern blot analysis. The T7 promoter sequence is shown in parentheses. (O) RNA FISH probes. (P) Primers used for real-time PCR.
- https://doi.org/10.7554/eLife.03635.024
-
Source Code 1
Source Codes in MATLAB 'simulation_gene_orientation_and_expression'.
- https://doi.org/10.7554/eLife.03635.025
Download links
A two-part list of links to download the article, or parts of the article, in various formats.
Downloads (link to download the article as PDF)
Open citations (links to open the citations from this article in various online reference manager services)
Cite this article (links to download the citations from this article in formats compatible with various reference manager tools)
Transcription mediated insulation and interference direct gene cluster expression switches
eLife 3:e03635.
https://doi.org/10.7554/eLife.03635


