Early patterning and specification of cardiac progenitors in gastrulating mesoderm
- Gladstone Institute of Cardiovascular Disease, United States
- Roddenberry Center for Stem Cell Biology and Medicine at Gladstone, United States
- University of California, San Francisco, United States
- University of San Francisco, United States
Figures
Figure 1 with 3 supplements
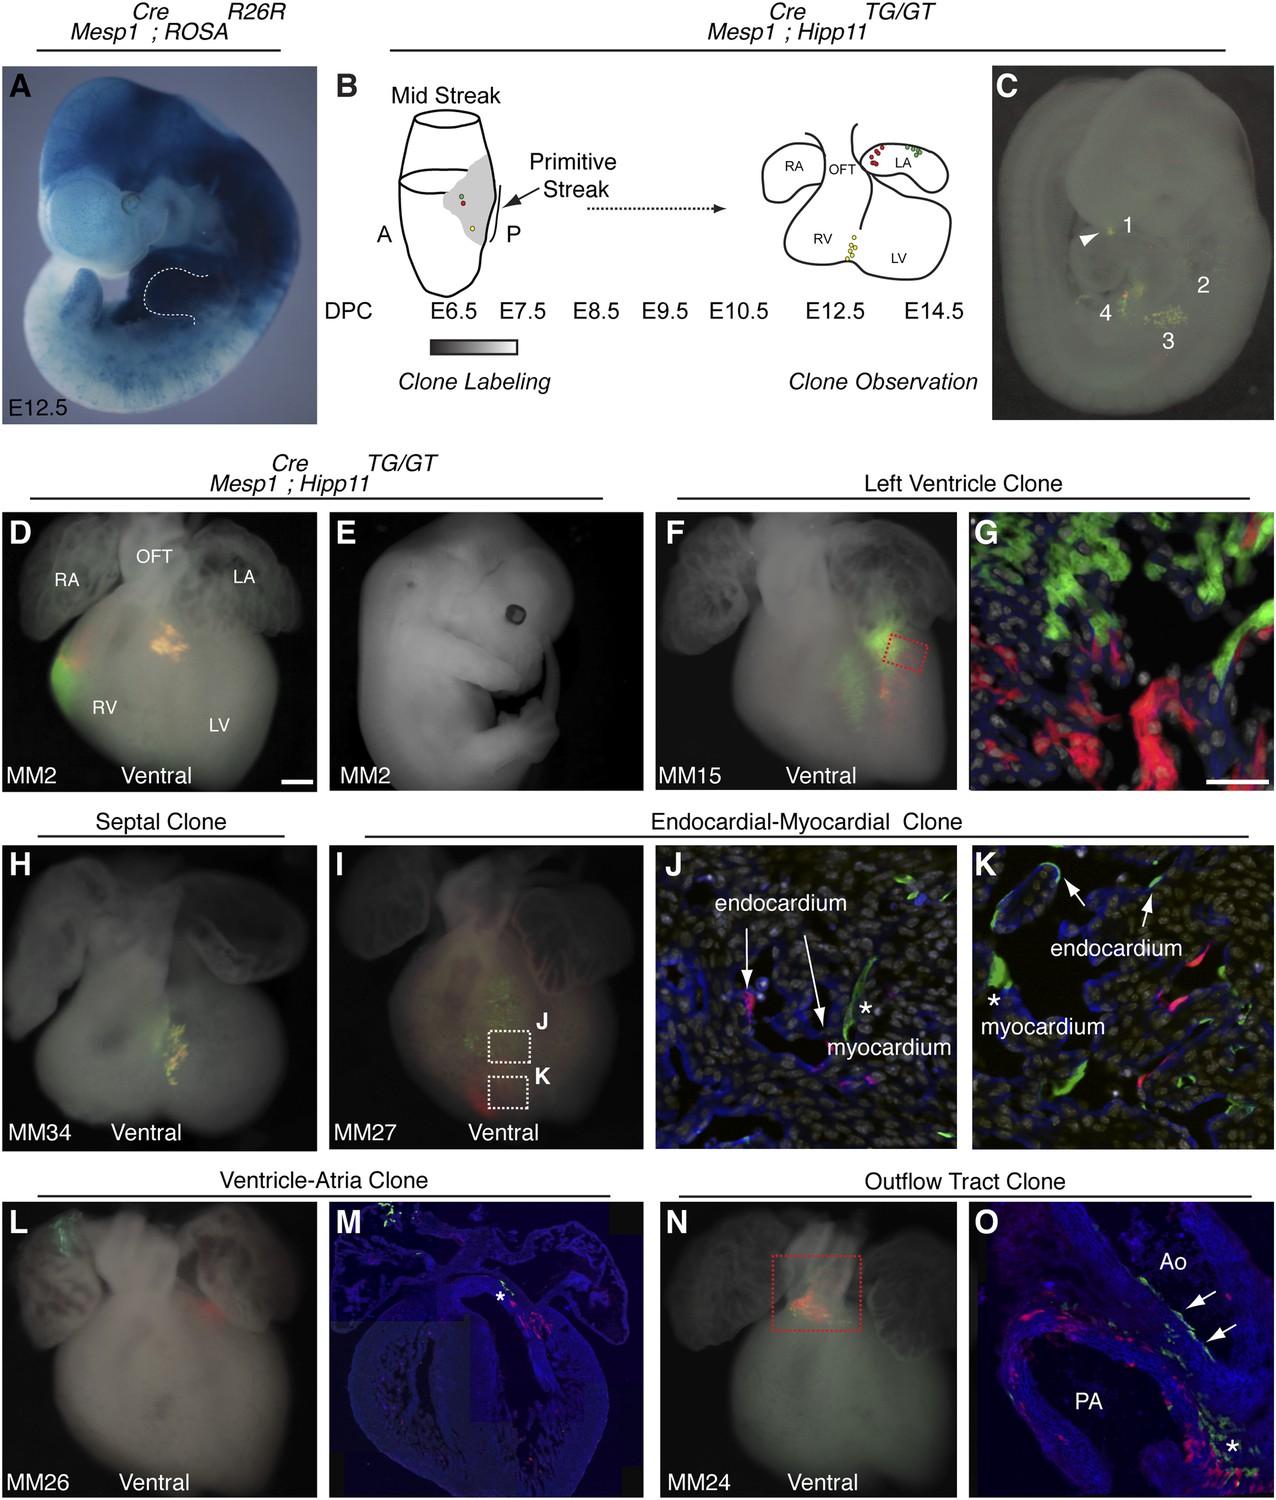
The first and second heart fields diverge early in gastrulating mesoderm.
(A) Genetic lineage tracing of Mesp1Cre;ROSAR26R mice reveals widespread labeling of mesodermal derivatives at E10.5, including forelimb (dotted outline). (B) Schematic of experimental protocol. Single cells are labeled early in gastrulating mesoderm and progeny of labeled cells observed later in development. (C) Example of clonal labeling in E9.5 embryo. Four distinct, scattered, clusters of labeled cells are present throughout trunk and neck, including a single yellow clone in ventricle (1, arrowhead). (D) Ventral view of a second heart field progenitor clone (red and green twin spots) with an additional yellow clone in the septal region (embryo ID MM2). (E) Whole mount view revealing an absence of non-cardiac clones elsewhere in the same embryo. (F) Ventral view of left ventricle clone (embryo ID MM15). Red and green twin spots are adjacent to each other. (G) Section through red-boxed area of embryo MM15 showing intermingling of red and green twin spots. (H) Ventral view of large, yellow septal clone (embryo ID MM34). (I) Whole-mount ventral view of red and green twin-spots in right ventricle (embryo ID MM27). Boxed regions indicate areas shown in higher magnification sections. (J) Section through clone in embryo MM27 reveals green labeled cardiomyocyte (asterisk) and red endocardial twin spot (arrows). Note overlap of red clonal labeling with blue PECAM staining. (K) Additional section through clone in embryo MM27. Green twin spot contributes to both cardiomyocytes (asterisk) as well as PECAM stained endocardial cells (arrows). (L) Whole-mount ventral view and (M) section of heart at E14.5 with a left ventricle-atria clone (embryo ID MM26). Note red and green twin spots (in LV and RA) in whole-mount view. Sectioning reveals a subset of the green twin spot has remained in the top of the left ventricle (asterisk). (N) Whole-mount ventral view of red and green twin spots in out-flow tract from embryo MM24. (O) Section through outflow-tract region reveals red twin spot contributing predominantly to pulmonary artery. Green twin spot contributes to both pulmonary artery and aorta. In addition, green twin spot appears to contribute to both endothelial lining of aorta (arrows) as well as cardiomyocytes (asterisk) at base of aorta. In (G, J–K) white: DAPI stained nuclei. In (J–K) blue: PECAM stained endothelial cells. In (M and O) blue: phalloidin stained actin. A, anterior; LA, left atrium; LV, left ventricle; OFT, out-flow tract; P, posterior; RA, right atrium; RV, right ventricle. Scale bars: (G and J–K), 100 µm (D, F, H, I, L, N), 200 µm.
Figure 1—figure supplement 1
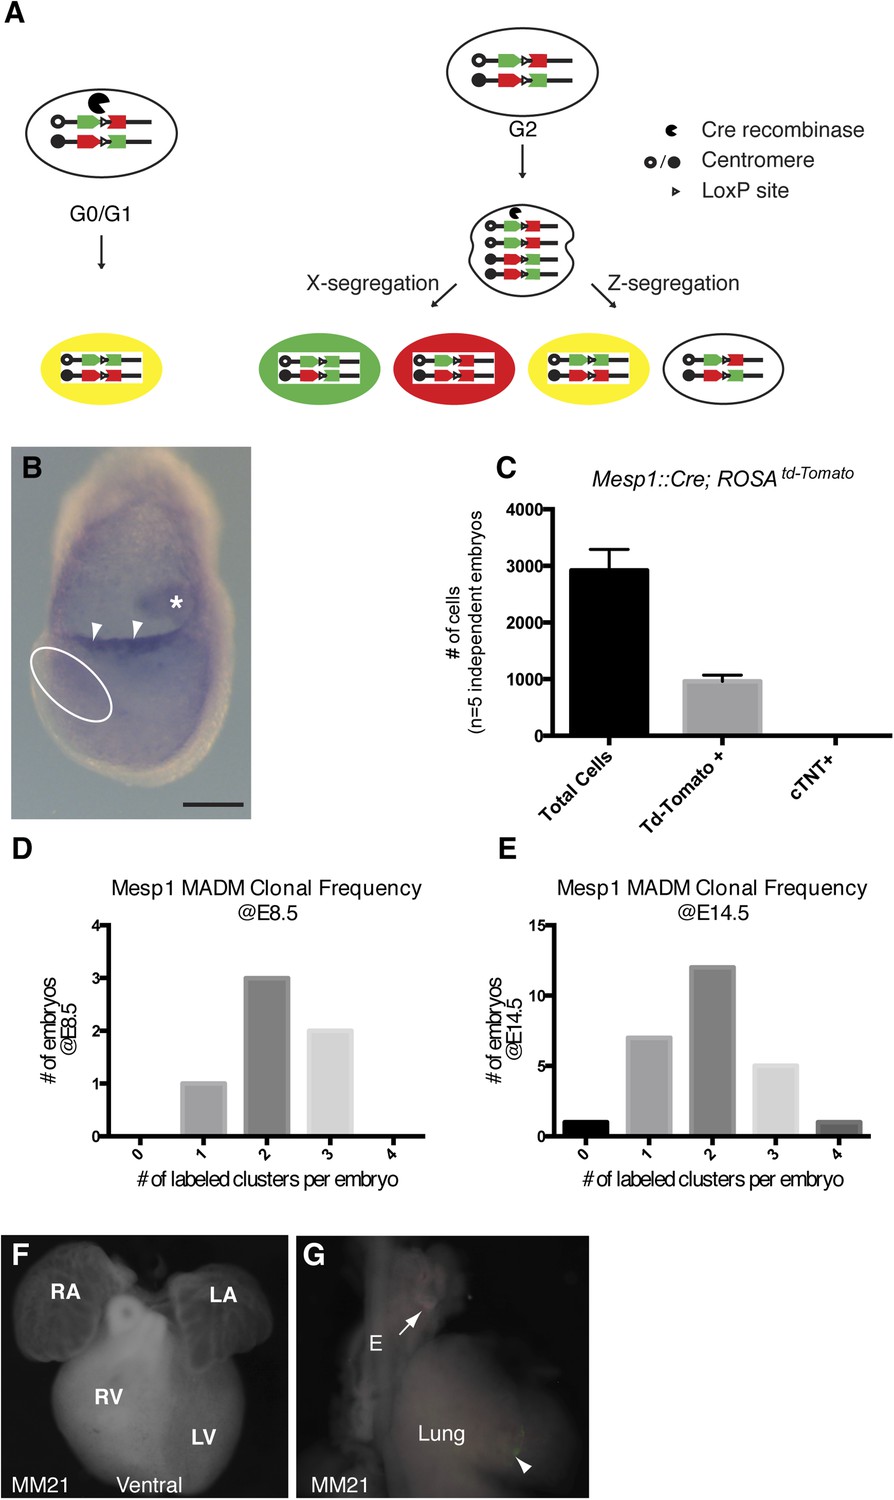
Overview of MADM clonal analysis and twin spot labeling.
(A) Prior to expression of Cre-recombinase, GFP and Tomato fluorophores are inactive. Interchromosomal recombination is induced by Cre recominase, thus restoring activity of GFP and Tomato. Recombination occurring in post-mitotic cells (G0) or in G1 phase of cell cycle generates red and green positive (yellow) cells. Recombination occurring after DNA replication (G2 phase of cell cycle) generates daughter cells that are uniquely labeled. So-called X-segregation generates daughter cells that are Red and Green and Z-segregation generates daughter cells that are colorless or yellow. (B) In situ hybridization for Cre mRNA in a Mesp1Cre embryo at the late head fold stage (LHF). Note expression in allantois (asterisk) as well as the allantoic membrane (arrowheads). Expression in the area of the forming cardiogenic mesoderm (dotted circle) is largely absent. (C) The total number of Mesp1Cre-derived cells was empirically determined by FACS analysis. Five independent Mesp1Cre; RosaTdTomato embryos at E7.5 were collected, dissociated, and stained for cardiac-Troponin (cTNT) and DAPI. The total number of cells as well as TdTomato and cTNT positive cells were counted and plotted. On average, 1/3 of the total number of cells are Mesp1Cre-derived. No cTNT positive cells were seen at this time point. (D–E) Counting the number of labeled clones at two different developmental time-points (E8.5 and E14.5) reveals a similar distribution of labeling frequency. A stable distribution of clonal labeling between the early and late time points argues against loss of twin spots over time due to apoptosis or ectopic induction after the initial Mesp1Cre induced clonal labeling. (F) Ventral view of heart with no clones (embryo ID MM21). (G) Lung and attached esophagus from same specimen with clones in mesenchyme surrounding esophagus and trachea (arrow) in mesenchyme of lung parenchyma (arrowhead). E, esophagus; LA, left atrium; LV, left ventricle; OFT, out-flow tract; RA, right atrium; RV, right ventricle. Scale bar: (B) 100 µm.
Figure 1—figure supplement 2
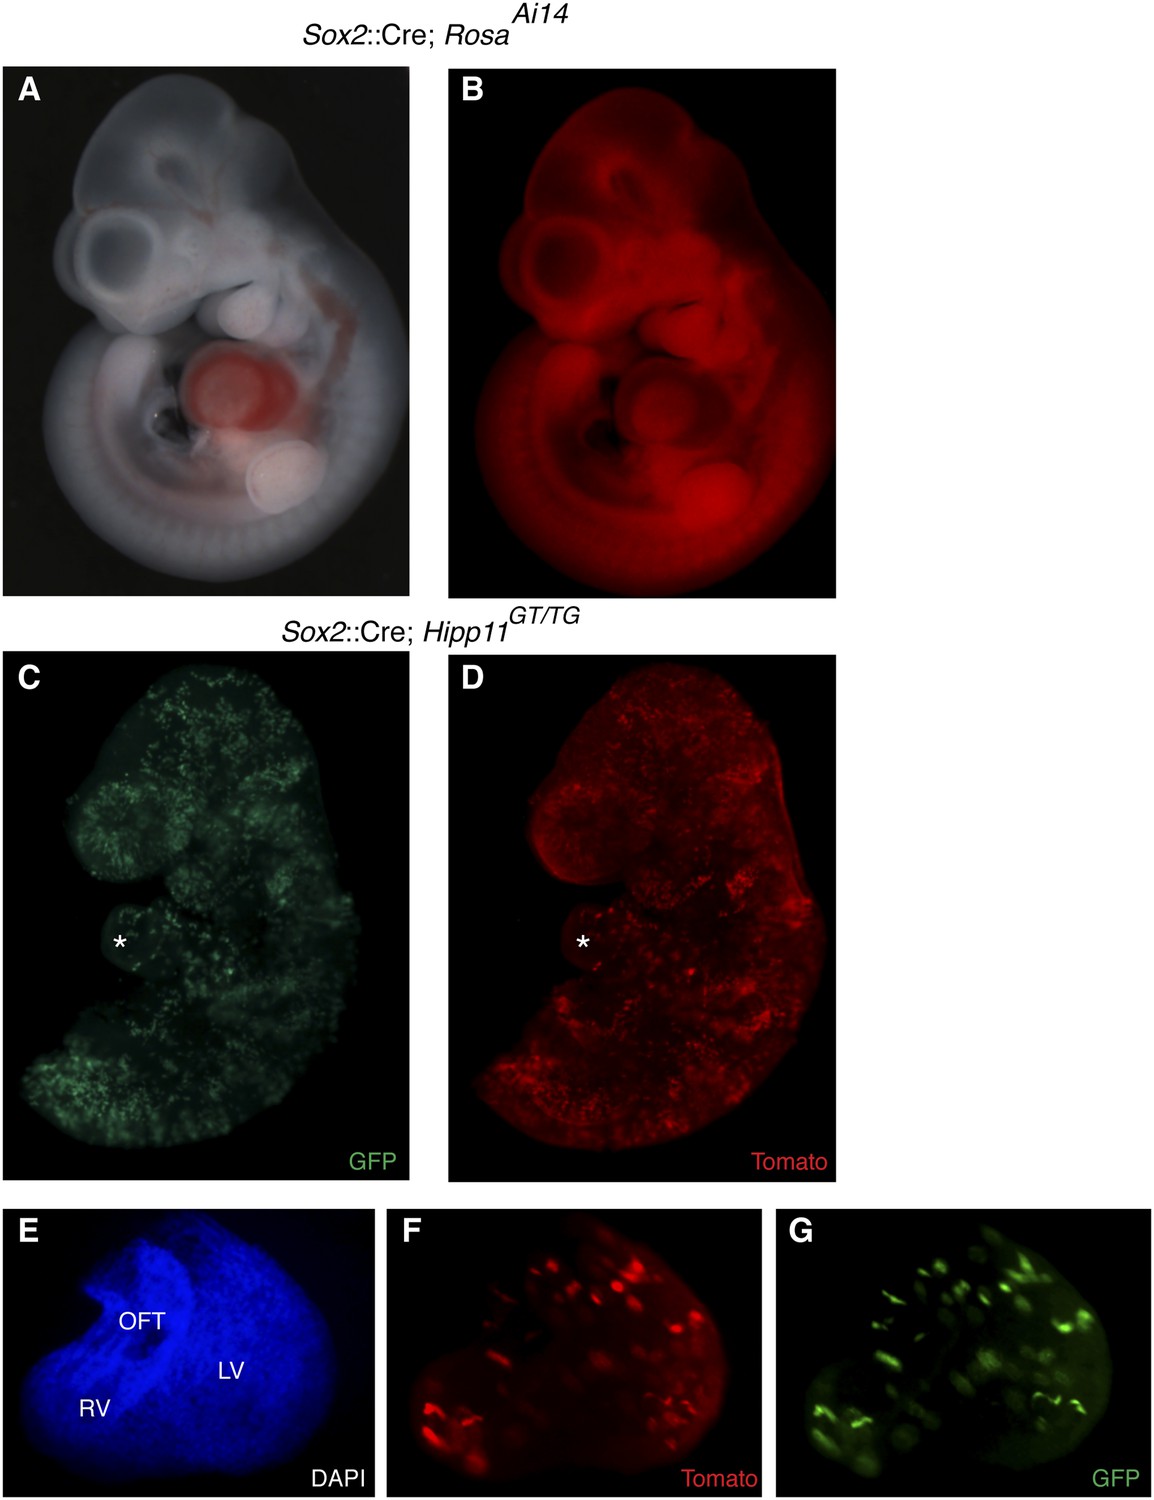
Epiblast-specific induction of MADM clones.
(A–B) The epiblast-specific Cre line, Sox2::Cre, is active in epiblast cells at E6.5 with little or no activity in extraembryonic tissues when passed through the male germline. Crossing male Cre-containing mice with ROSAAi14(TdTomato) results in broad reporter activity throughout the embryo proper at E10.5. (C–D) Left lateral views of E9.5 embryos of the indicated genotype reveals many yellow clones through the embryo, including the heart (asterisk) (E–G) Ventral view of isolated heart from an epiblast-induced MADM clone. A large, dispersed, yellow clone consisting of ∼75–100 cells extends from the OFT through the RV into the LV. Because of the dispersive nature and single color labeling of this particular example, it is unclear if this represents a single recombination event or multiple events. LV, left ventricle; OFT, outflow tract; RV, right ventricle.
Figure 1—figure supplement 3
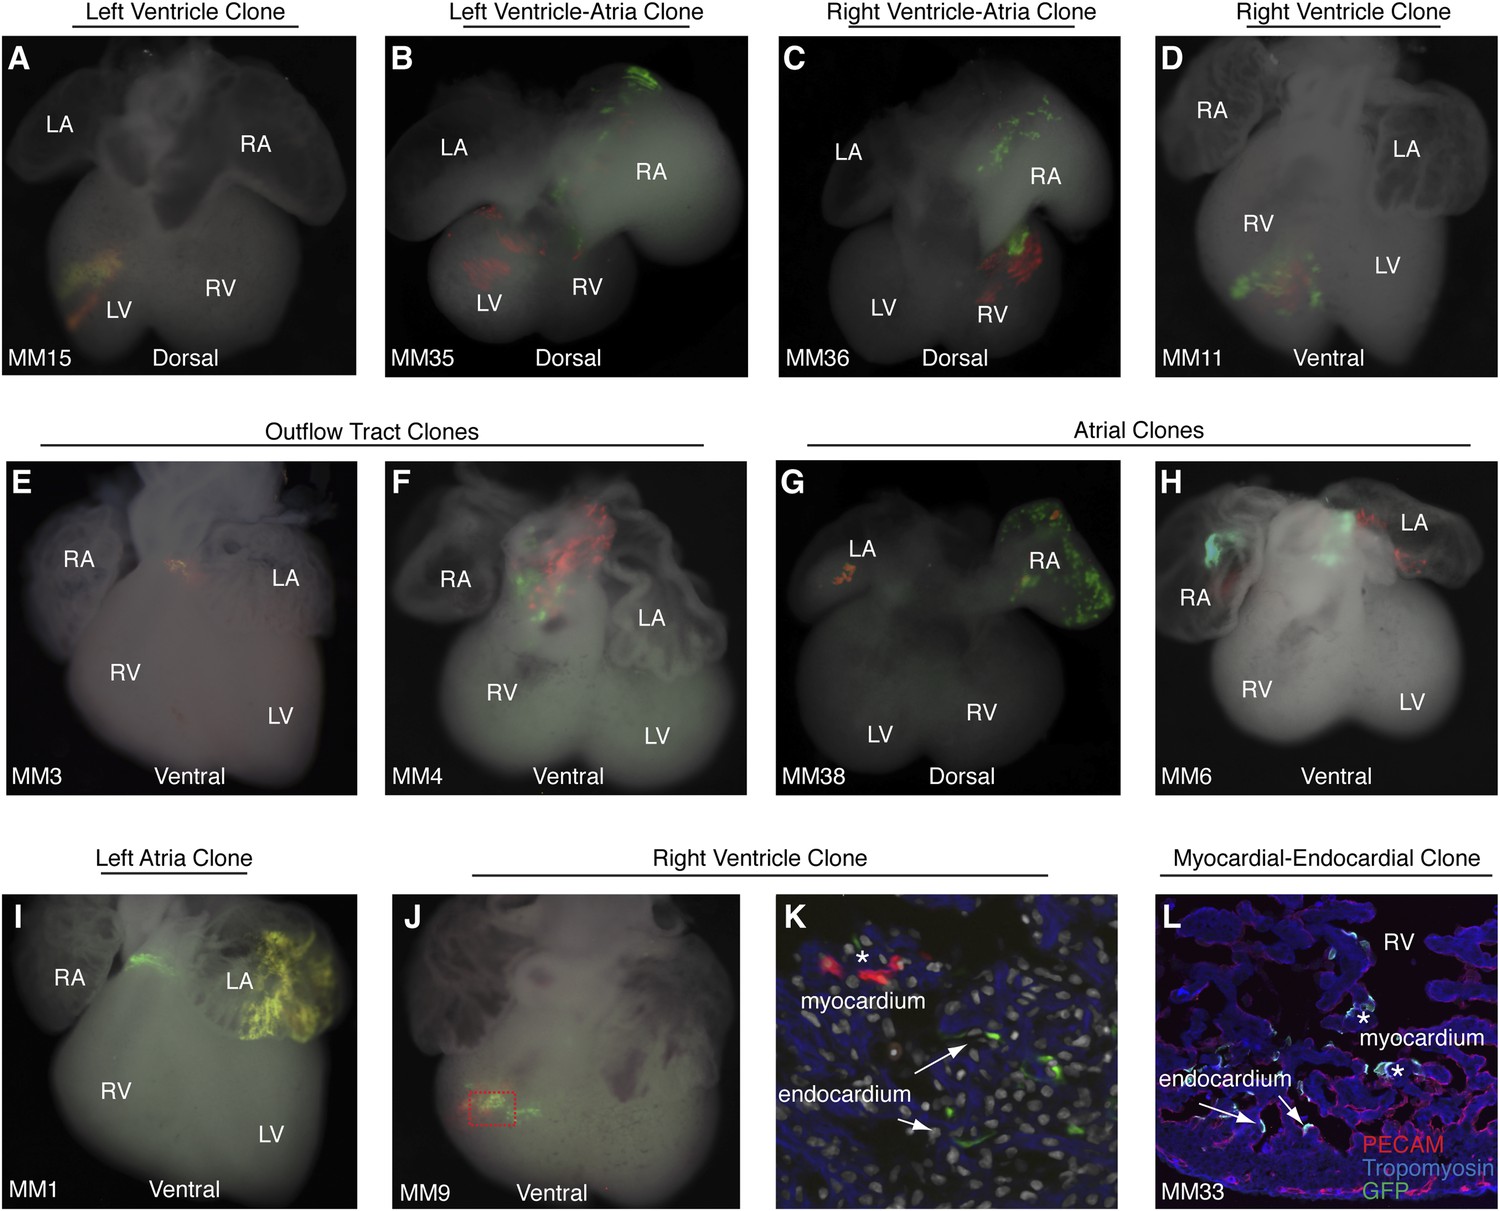
Additional examples of early cardiac progenitor clones.
(A) Dorsal view of left ventricle progenitor clone in embryo MM15 with both twin spots in the left ventricle. (B) Dorsal view of heart from embryo MM35. Note red twin spot in left ventricle and corresponding green twin spot in right atrium. (C) Dorsal view of heart from embryo MM36. Note red and green twin spots in right ventricle. Additional green labeling is present in the right atrium. (D) Ventral view of heart from embryo MM11 reveals red and green twin spots within the right ventricle. Because multiple twin spots are adjacent to one another, it is unclear if clones represent a single progenitor labeling event or more than one progenitor labeling events. (E) Ventral view of heart from MM3 showing an isolated yellow clone in ventral part of outflow-tract. (F) Ventral view of heart from MM4 showing red and green twin spots on outflow-tract. (G–H) Ventral views of hearts from MM38 (G) and MM6 (H) show red a green twin spots in left and right atria. (I) Ventral view of heart from MM1. Two separate clones are seen in this particular example. The first clone is clearly identifiable as an out flow tract clone and consists of a band of green cells around the ventral part of the outflow-tract and a red twin spot (not shown) on dorsal surface of outflow-tract. In addition, a large yellow clone is seen in the left atrium. (J) Ventral view of right ventricle clone (embryo ID MM9). Red and green twin spots are adjacent to each other. (K) Section through red-boxed area of embryo MM9 reveals red labeled cardiomyocytes (asterisks) and green labeled endocardial cells arrows). In (K) blue: phalloidin stained actin. (L) Section through right ventricle of embryo MM33. A single green twin spot is present within the right ventricle (stained with GFP). Endothelial cells have been labeled with anti-PECAM (red) and cardiomyoctes have been labeled with anti-tropomyosin (blue). Note that cells from this twin spot contribute to both PECAM-positive endocardial cells (arrows) as well as tropomyosin positive cardiomyocytes (asterisks). LA, left atrium; LV, left ventricle; OFT, out-flow tract; RA, right atrium; RV, right ventricle.
Figure 2
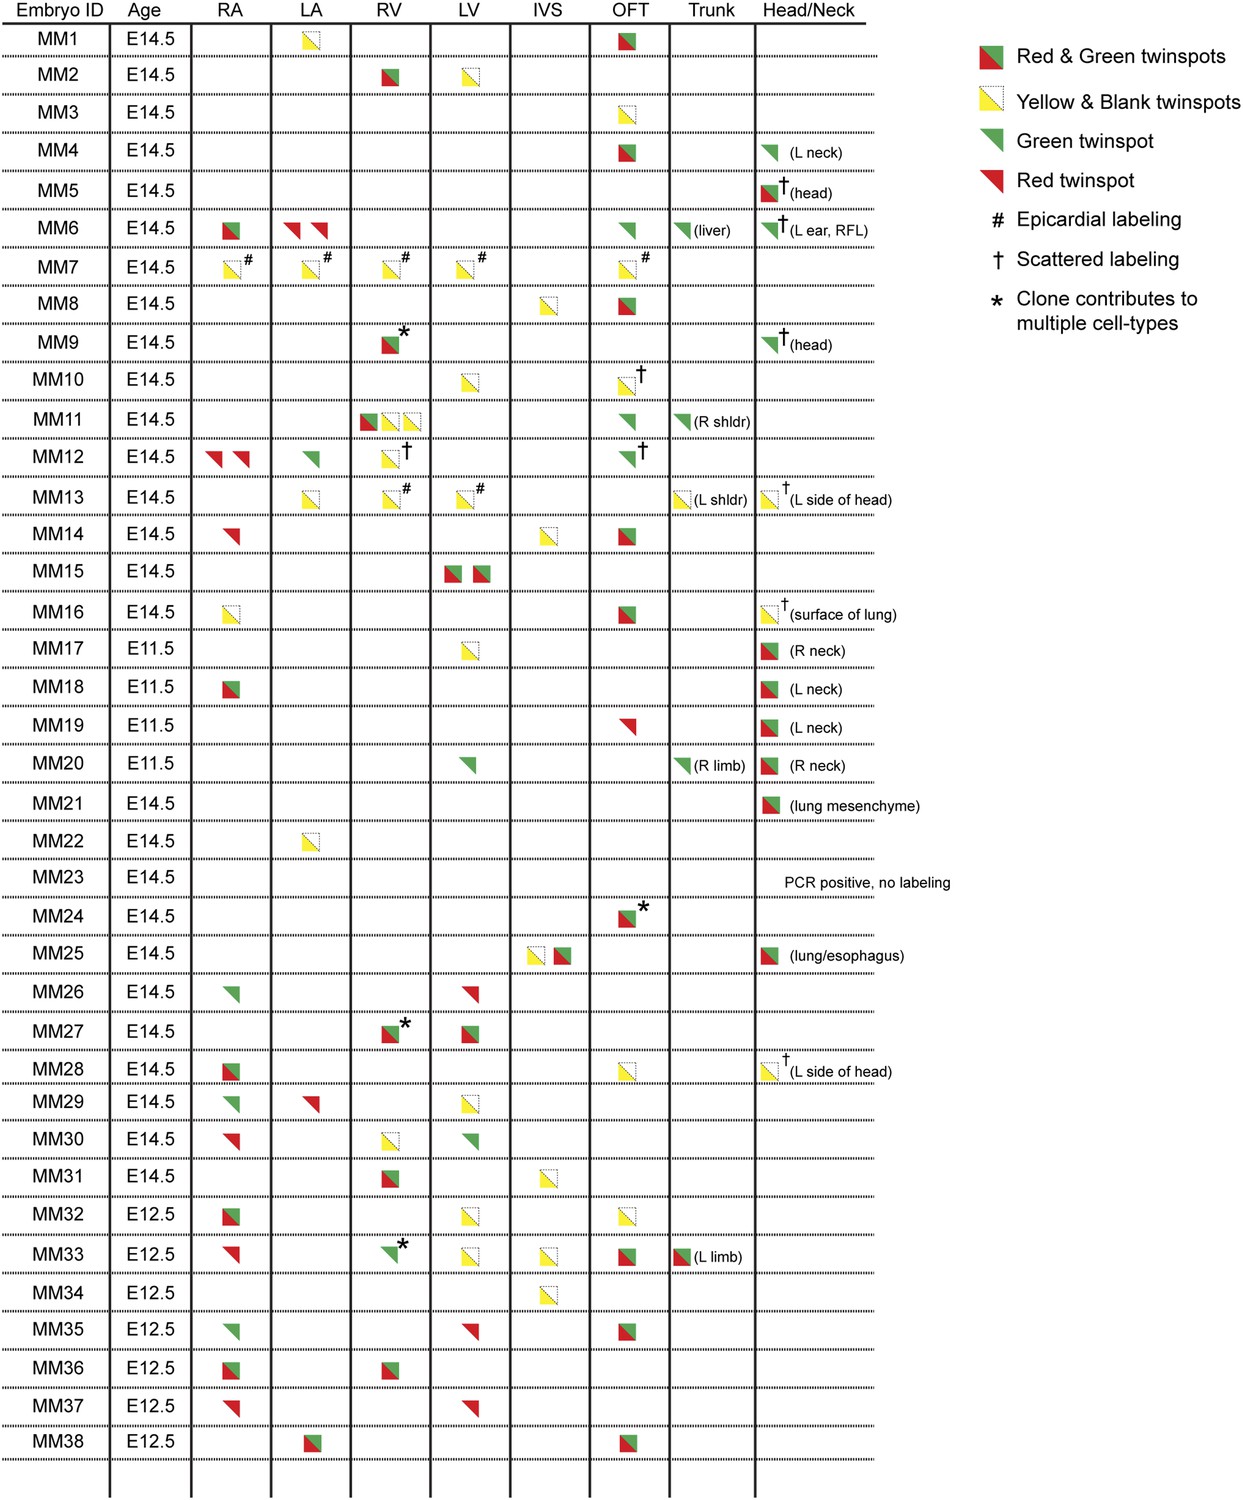
Complete description of all Mesp1Cre-MADM clones examined.
All observed clones are detailed here, including cardiac as well as extra-cardiac clones. An exhaustive description of extra-cardiac clones is beyond the scope of the current study and thus only a simple description of the tissue or organ containing a labeled clone is included. Red triangles correspond to red twin spots, green triangles correspond to green twin spots, and yellow triangles correspond to yellow twin spots.
Figure 3 with 2 supplements
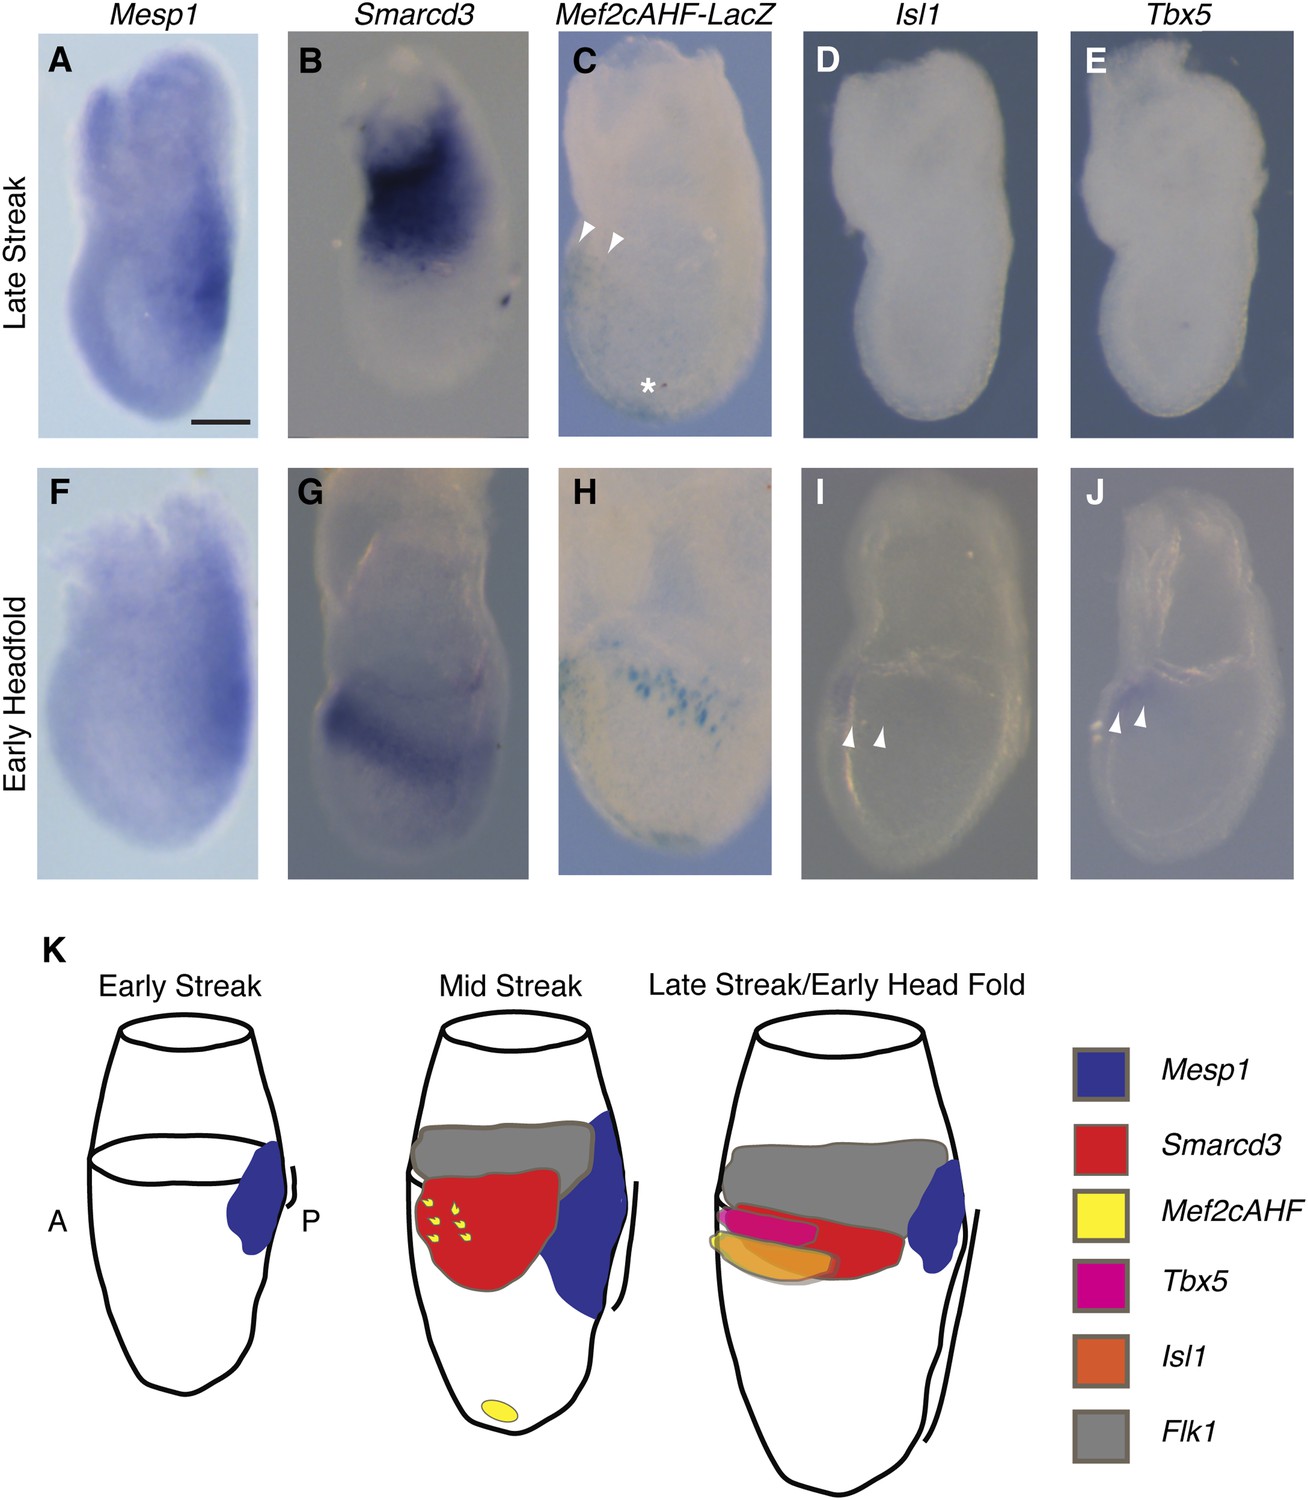
Smarcd3 expression initiates in gastrulating mesoderm and precedes expression of Isl1 and Tbx5.
(A–B and D–E) In situ hybridization at late-streak (LS) stage for Mesp1, Smarcd3, Isl1, and Tbx5. (C) X-gal staining at late-streak stage for Mef2cAHF-lacZ. Smarcd3 mRNA is expressed anterior to Mesp1 mRNA in embryonic and extraembryonic tissues. Tbx5 and Isl1 are undetectable by in situ hybridization at this stage. Activity of the Mef2cAHF enhancer is detectable around the node (asterisk) and in the anterior embryonic tissues (white arrowheads). (F–G and I–J) In situ hybridization at early-head-fold (EHF) stage for Mesp1, Smarcd3, Isl1, and Tbx5. (H) X-gal staining at early-head-fold (EHF) stage for Mef2cAHF-lacZ enhancer. Isl1 and Tbx5 expression is now detectable (arrowheads). (K) Summary of gene expression. Mesp1 expression (blue) precedes all other genes. Flk1 (gray), Smarcd3 (red), and Mef2cAHF (yellow) expression follows, beginning at the mid-streak stage, in overlapping domains. Isl1 (orange) and Tbx5 (magenta) expression begins at the late-streak/early head fold stage and overlaps with the stripe of Smarcd3 expression. Mesp1 expression at this stage is restricted to a small domain at the posterior of the embryo. Scale bars: (A–J) (100 µm).
Figure 3—figure supplement 1
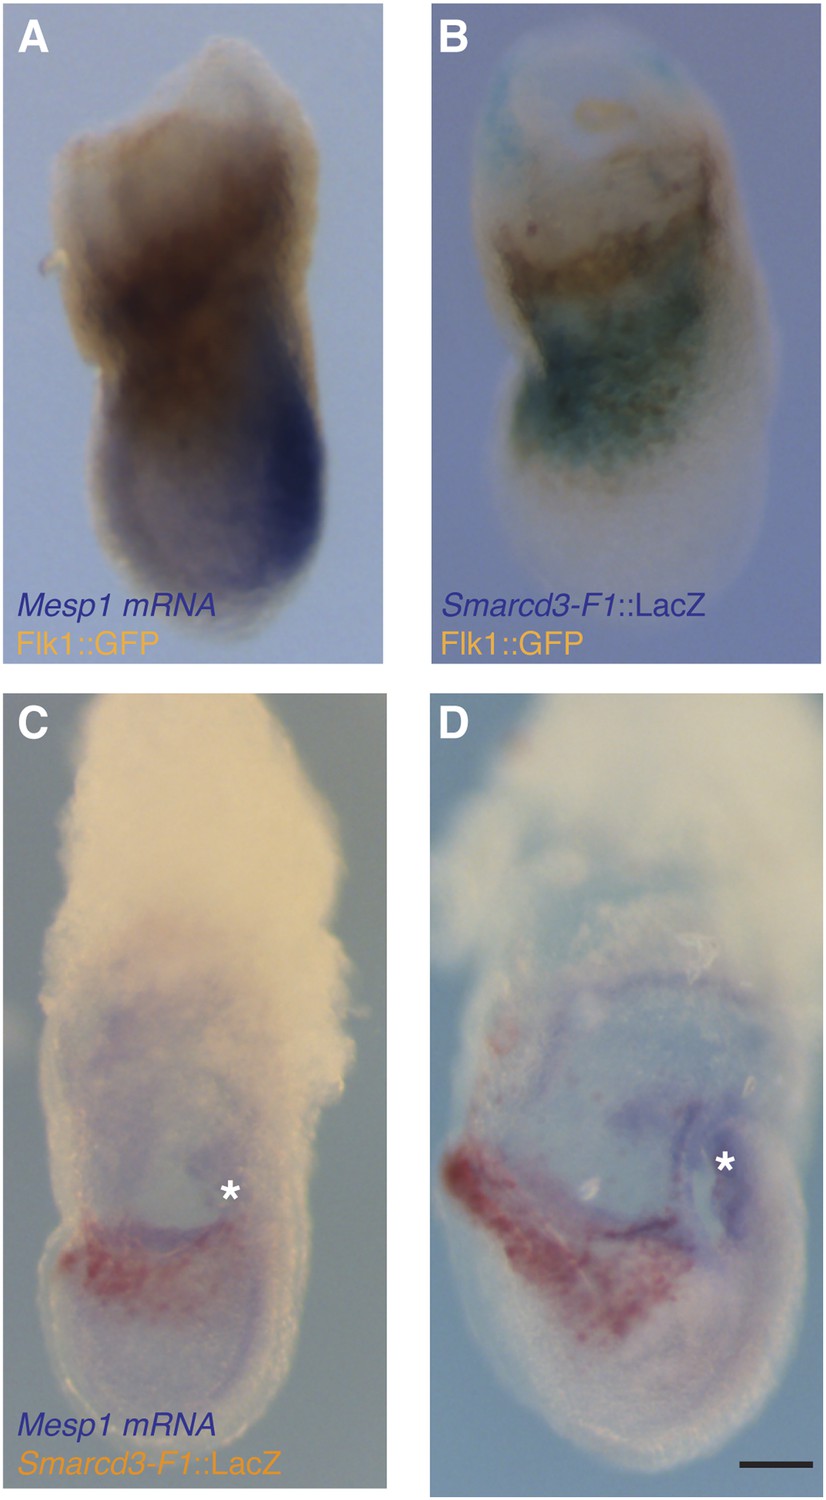
Additional characterization of Smarcd3-F1-LacZ expression.
(A) In situ hybridization for Mesp1 mRNA and antibody staining for GFP in Flk1GFP/+ LS stage embryo reveals minimal overlap between active expression of Mesp1 and Flk1. (B) Antibody staining for GFP and salmon-gal staining in Smarcd3-F1-lacZ; Flk1GFP/+ late-streak stage embryo shows significant overlap between Flk1 and Smarcd3 expression. (C) In situ hybridization for Mesp1 mRNA and salmon-gal staining of Smarcd3-F1-lacZ in LS and EHF (D) stage embryos. Mesp1 mRNA is localized predominantly at the base of the forming allantois (asterisks) and is largely non-overlapping with Salmon-gal staining of Smarcd3-F1-lacZ. Scale bars: (A–D), 100 µm.
Figure 3—figure supplement 2
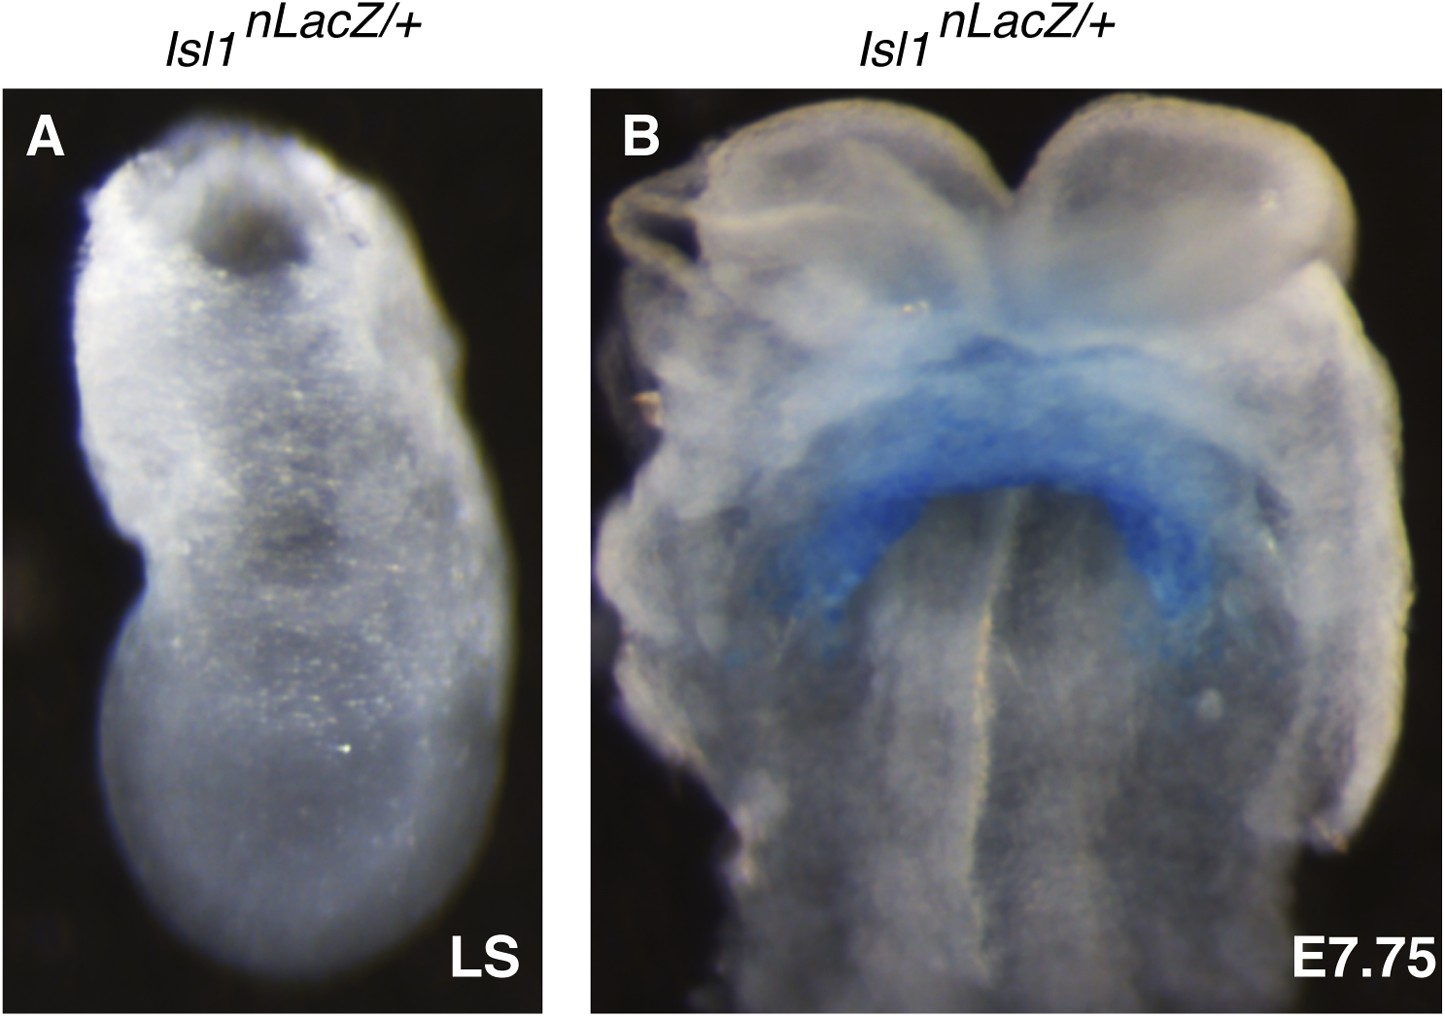
Characterization of early Isl1nlacZ expression.
(A) X-gal staining of Isl1nlacZ/+ late streak (LS) stage embryos reveals no detectable staining even after over-night incubation at 37°C in staining solution. (B) One day later at E7.75, X-gal staining is seen within the developing cardiac crescent.
Figure 4 with 1 supplement

Identification of an early cardiac specific enhancer of Smarcd3.
(A) Genomic region upstream of Smarcd3 translational start site (black arrow). Grey boxes: regions of non-coding sequence conservation between human and mouse. Indicated regions were used to generate Smarcd3-F1-lacZ and Smarcd3-F6-nlacZ alleles. (B–C) Salmon-gal staining of Smarcd3-F1-lacZ allele (red) closely mimics endogenous expression of Smarcd3 mRNA (dark blue). (D) X-gal staining of Smarcd3-F6-nlacZ allele (light blue) labels a fraction of total Smarcd3 mRNA. (E–I) lateral and frontal views of salmon-gal stained Smarcd3-F1-LacZ embryos at (E) early head fold (EHF), (F–G) cardiac crescent, (H) E8.5, and (I) E9.5 stages. Note the staining in extraembryonic tissues at EHF and cardiac crescent stages (asterisks). Also note salmon-gal staining in lateral mesoderm of E8.5 and E9.5 embryos (arrowheads). (J–N) A single copy of the F6 enhancer along with Hsp68 minimal promoter and nls-LacZ coding sequence were targeted to the Hipp11 locus on chromosome 11 (see extended methods for details). Lateral and frontal views of X-gal stained Smarcd3-F6-Hsp68-nLacZ embryos at (J) early head fold (EHF), (K–L) cardiac crescent, (M) E8.5, and (N) E9.5 stages. Note absence of staining in extraembryonic tissues at EHF and cardiac crescent stages as well as restricted cardiac expression at E8.5 and E9.5 (arrowheads). (O) Lateral view of late streak stage Mesp1Cre; ROSAmTmG; Smarcd3-F1-lacZ embryo showing partial overlap of Smarcd3 expression with the Mesp1-derived lineage. (P) Additional anterior view. Blue: DAPI stained nuclei, Green: GFP staining, Red: Beta-galactosidase. Scale bars: (B–D, E–G, J–L), 100 µm, (H and M), 100 µm, (I and N), 100 µm.
Figure 4—figure supplement 1
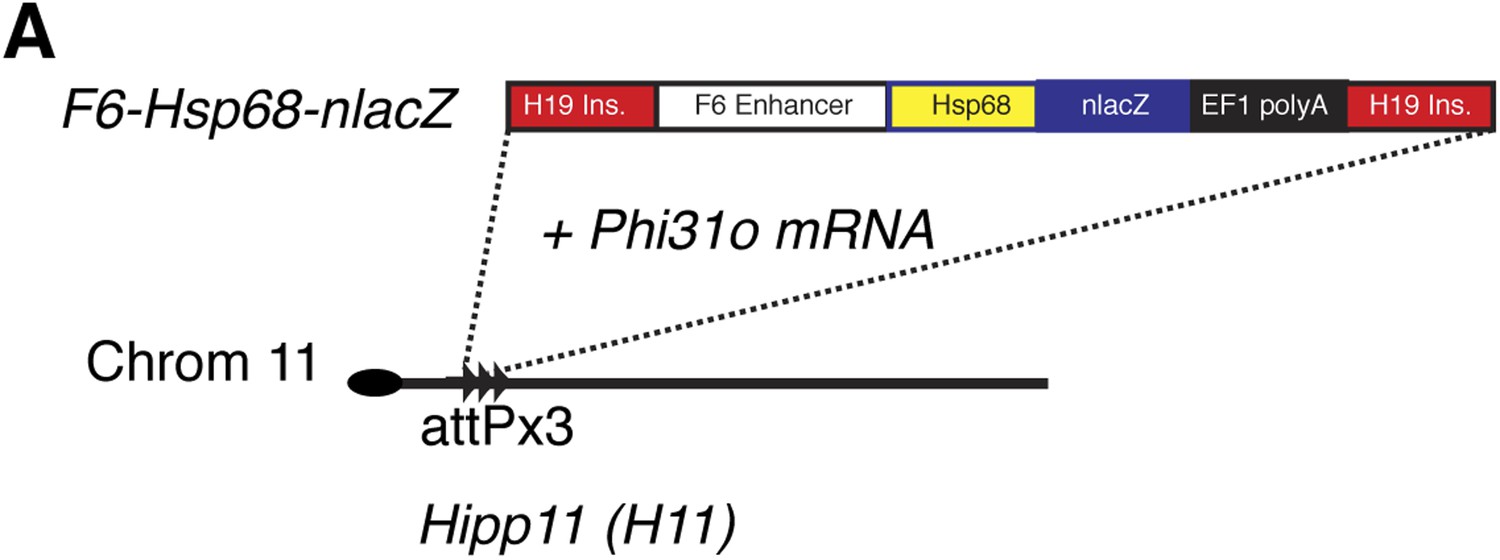
Generation of Smarcd3-F6nLacZ reporter mice.
(A) A single copy of the F6 enhancer along with the Hsp68 minimal promoter and nLacZ coding sequence were targeted to the Hipp11 locus on chromosome 11 (see extended methods for details).
Figure 5 with 3 supplements
A Smarcd3 enhancer in the late gastrulating embryo labels a population of specified cardiac precursors.
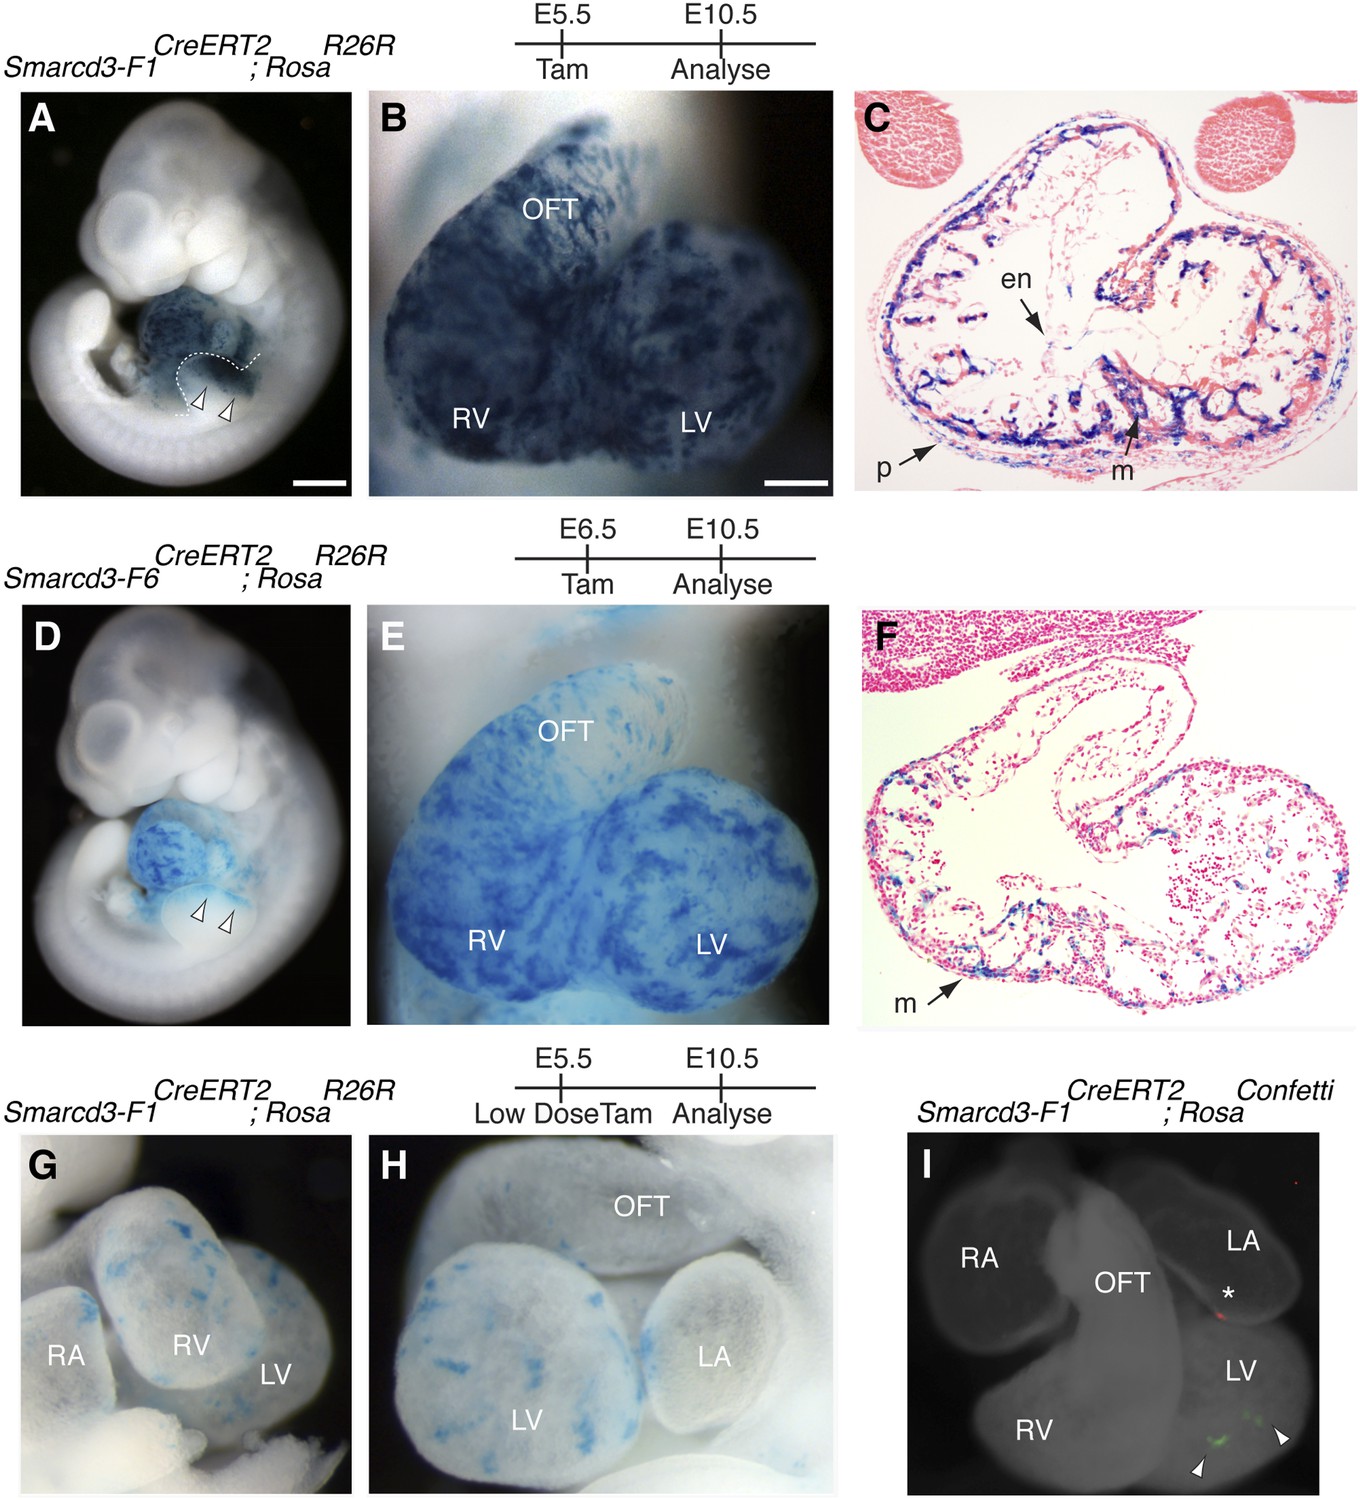
(A) Smarcd3-F1+ cells labeled at E5.5 and observed at E10.5 contribute to the heart and anterior forelimb (arrows). In addition, scattered cells are observed in the trunk and neck (not shown). (B) Labeled cells are present in all chambers of the heart, including the RV, LV, OFT, and RA and LA (not shown). (C) Within the heart, labeled cells contribute to the pericardial layer as well as the cardiomyocte and endocardial cell layers. (D) Smarcd3-F6+ cells labeled at E6.5 and observed at E10.5 contribute to the heart and anterior forelimb. No additional labeling in the trunk or neck is observed. (E) Labeled cells are also present in all chambers of the heart. The number of labeled cells, however, appears reduced. (F) Within the heart, myocardial and pericardial (not shown) cells are labeled. (G–H) Limiting doses of tamoxifen administered to Smarcd3-F1CreERT2;RosaR26R embryos at E5.5 label scattered clusters of cells throughout the heart at E10.5. (I) Clonal analysis with the Smarcd3-F1CreERT2;RosaConfetti line (E5.5 label, harvested at E10.5) shows that a single Smarcd3-F1+ progenitor can populate the left ventricle (YFP, arrow heads) or the left atrium (red fluorescent protein, asterisk). Scale bars: (A and D), 500 µm (B and E), 200 µm (I), 50 µm. en, endocardium; LV, left ventricle; LA, left atrium; m, myocardium; OFT, out flow tract; p, pericardium; RA, right atrium; RV, right ventricle.
Figure 5—figure supplement 1
Generation and characterization of Smarcd3-F1CreERT2 and Smarcd3-F6CreERT2 mice.
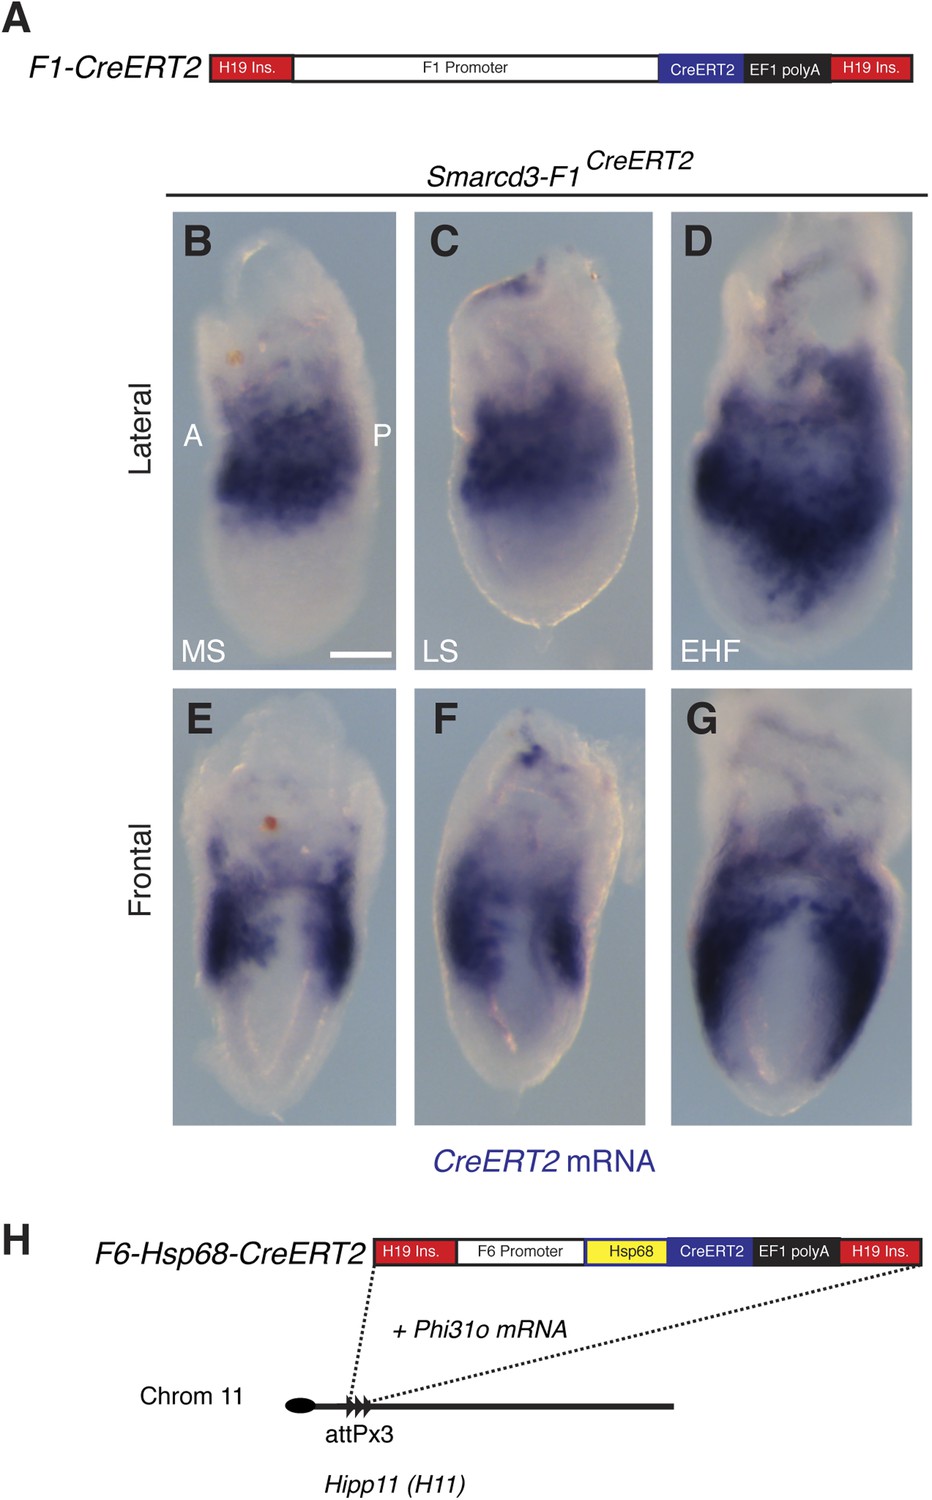
(A) Schematic of Smarcd3-F1CreERT2 construction. The Smarcd3-F1 enhancer/promoter was cloned upstream of the CreERT2 coding sequence. Flanking H19 insulator sequences were added to minimize position effects (see extended methods for details). (B–G) In situ hybridization for CreERT2 in Smarcd3-F1CreERT2 embryos at MS (B and E) LS (C and F) and EHF (D and G) stages reveals an identical pattern of expression to the Smarcd3-F1-lacZ allele and endogenous Smarcd3 early in development. (H) Schematic of Smarcd3-F6CreERT2 construction. A single copy of the F6 enhancer along with the Hsp68 minimal promoter and CreERT2 coding sequence were targeted to the Hipp11 locus on chromosome 11 (see extended methods for details).
Figure 5—figure supplement 2
Additional characterization of Smarcd3-F1CreERT2 mice.
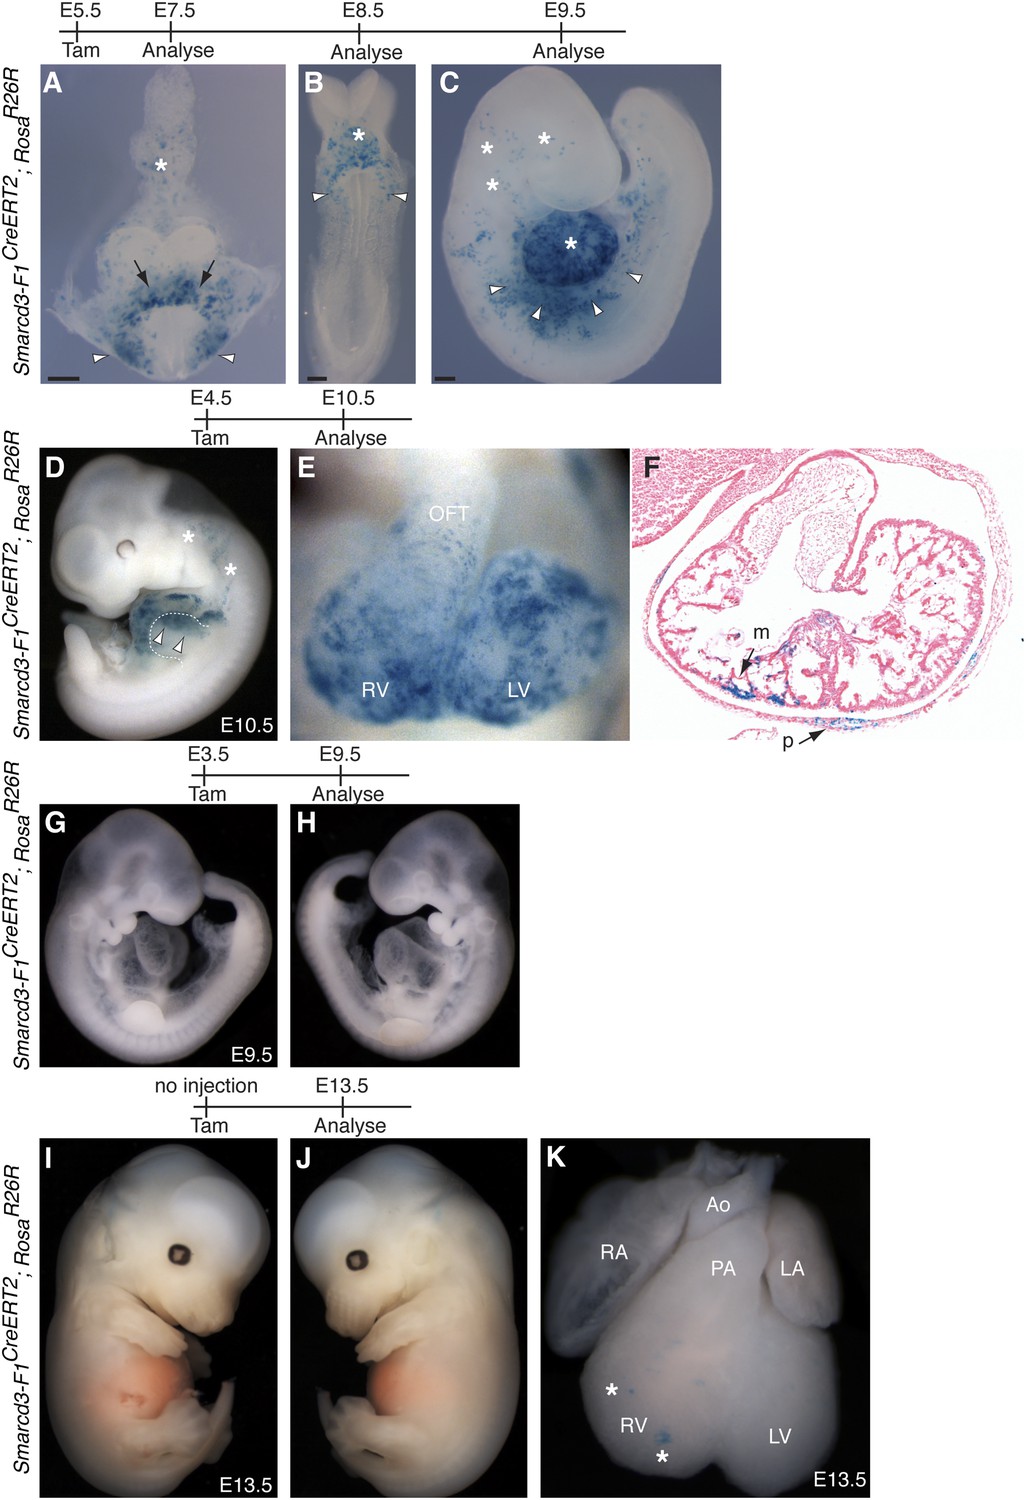
(A) Early labeling using Smarcd3-F1CreERT2 at E5.5 followed by observation at E7.5 reveals robust labeling within the cardiac crescent (arrows) as well as lateral plate mesoderm (arrowheads) and allantois (asterisk). (B) Observation one day later at E8.5 reveals a similar distribution of cells within the looping heart (asterisk) and lateral plate mesoderm (arrowheads). (C) At E9.5, labeled cells are present within the heart (asterisk) and scattered along the lateral plate mesoderm (arrowheads) and cranial mesoderm (asterisks). (D) Smarcd3-F1CreERT2 cells labeled at E4.5 and observed at E10.5 contribute to the heart and anterior forelimb (arrows). In addition, labeled cells within trunk and cranial mesoderm are present (asterisks). (E–F) Labeled cells are present in all chambers of the heart, including the RV, LV, OFT, and RA and LA (not shown) and contribute to the myocardium and pericardium. (G–H) Injection of tamoxifen into Smarcd3-F1CreERT2 animals at E3.5 and observation at E9.5 reveals no labeling in embryos. (I–K) Un-injected Smarcd3-F1CreERT2 animals have no labeled cells in the head, trunk, or limbs, and rare un-injected embryos have a few scattered cells in the heart (K, asterisks) at E13.5. A total of 16 mock injected embryos were examined and the embryo shown is an extreme example that represents the most labeling that we saw throughout the 16 mock-injected embryos. LA, left atrium; LV, left ventricle; m, myocardium; OFT, out-flow tract; p, pericardium; RA, right atrium; RV, right ventricle.
Figure 5—figure supplement 3
Additional characterization of Smarcd3-F6CreERT2 mice.
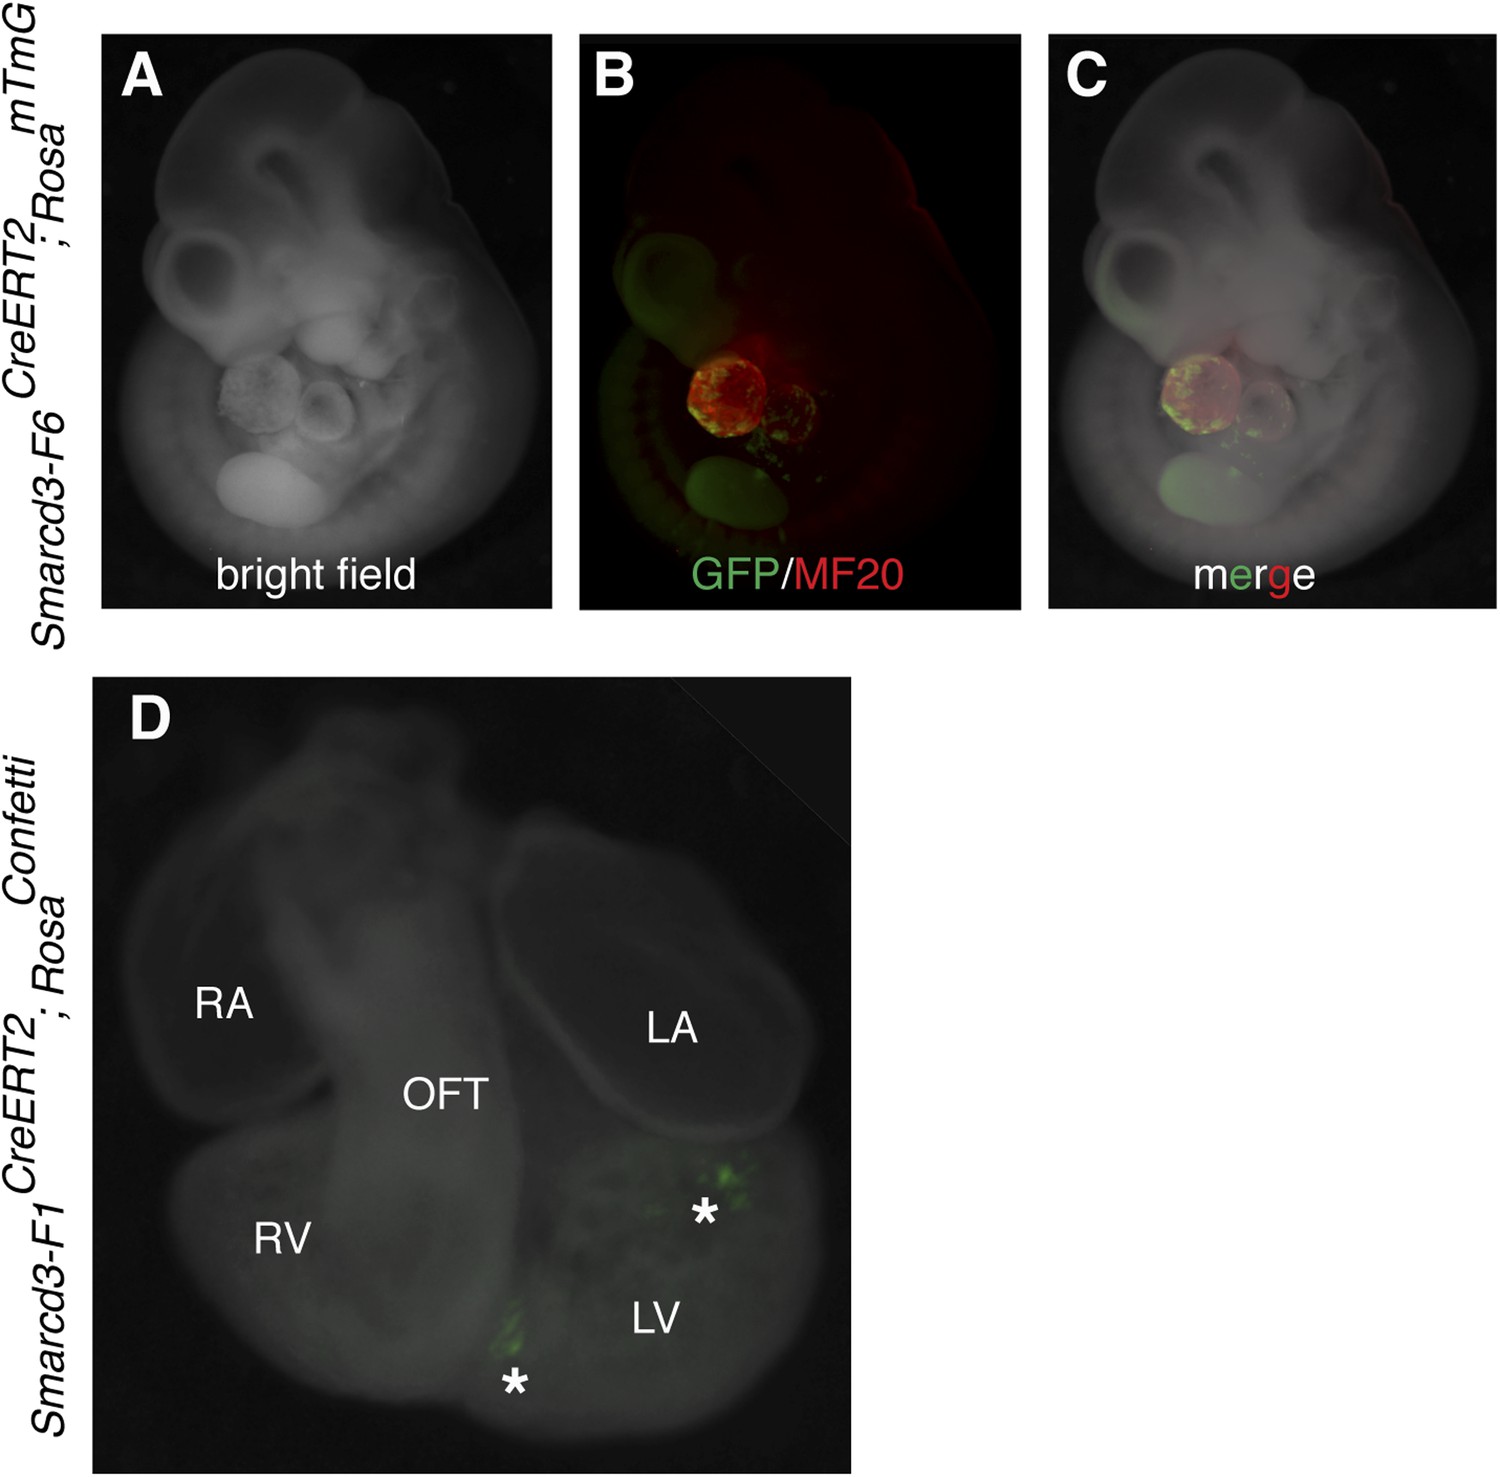
(A–C) Early labeling using Smarcd3-F6CreERT2 at E6.5 and observation at E10.5 reveals scattered cells (green) throughout the heart (red) without significant contribution to trunk or cranial mesoderm. (D) limiting doses of tamoxifen were used to induce small numbers of well-isolated labeled cells at E6.5 in Smarcd3-F1CreERT2;RosaConfetti embryos. Hearts were observed at E10.5. Note isolated clones of YFP labeled cells adjacent to interventricular septum and top of left ventricle (asterisks). LA, left atrium; LV, left ventricle; m, myocardium; OFT, out-flow tract; p, pericardium; RA, right atrium; RV, right ventricle.
Figure 6 with 1 supplement
Smarcd3-F6 enhancer labels an early cardiac progenitor in differentiating ES cells.
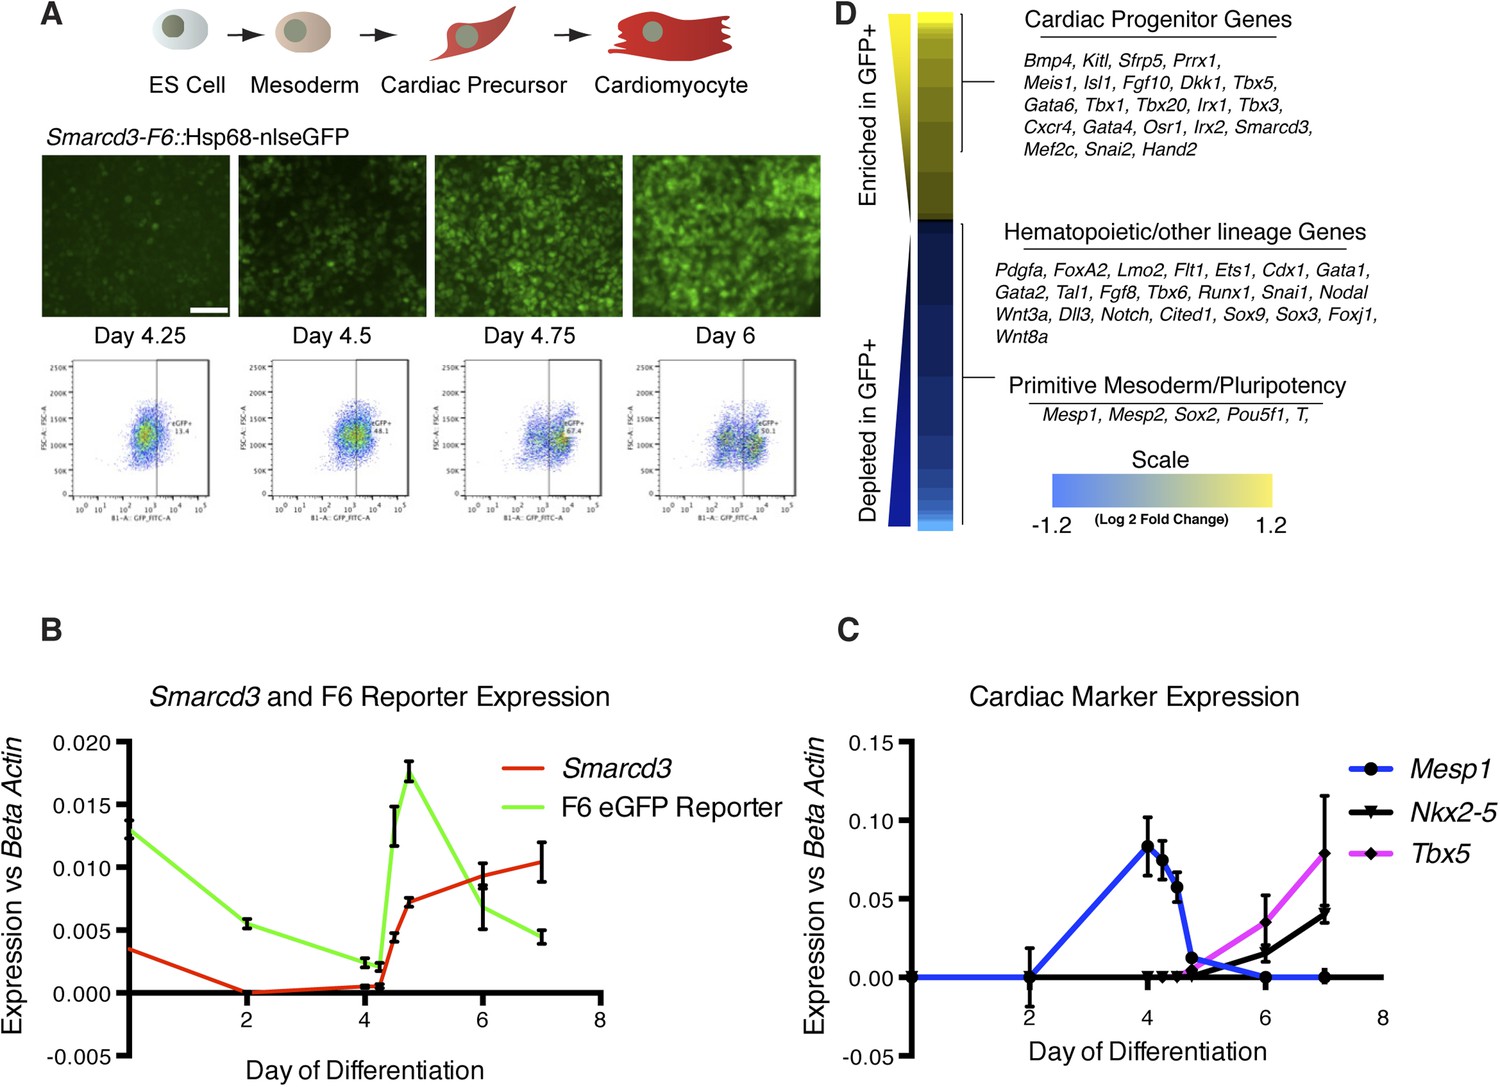
(A) Schematic of cardiac differentiation protocol and representative images at indicated time points during differentiation of Smarcd3-F6nlsEGFP mESCs. (B) Time course of gene expression during cardiac differentiation. Low expression of Smarcd3 as well as GFP is detectable in ES cells. Expression decreases over the course of the differential protocol but is rapidly induced shortly after day 4. (C) Expression of Mesp1 peaks between day 3-day 4 of the differentiation protocol. Expression of Nkx2-5 and Tbx5 begins later at day 5. Values shown are the mean plus SEM for 4 independent experiments, each performed in triplicate (D) Heatmap showing differential gene expression in GFP + compared to GFP- sorted cells. Many genes involved in cardiac progenitor development are enriched in the GFP + population. Markers of primitive mesoderm and of hematopoietic and other cell lineage development are enriched in the GFP- population. Values are log2 fold change and are clipped at 1.2. Analysis is based on three biological replicates. Yellow = higher in GFP positive population, blue = higher in GFP negative population.
-
Figure 6—Source data 1
Complete list of differentially expressed genes meeting strict FDR of 0.02.
A mouse ESC line with the Smarcd3-F6 nlsEGFP reporter was differentiated toward the cardiac lineage (see methods for complete details). 18 hours after replating, GFP + cells were sorted from GFP- cells. Total RNA was extracted and analyzed by RNA-sequencing. Following bioinformatics analysis (see methods) a list of differentially expressed transcripts meeting a strict FDR of 0.02 was selected. This list of transcripts was used to generate the heatmap in Figure 3K.
- https://doi.org/10.7554/eLife.03848.018
Figure 6—figure supplement 1
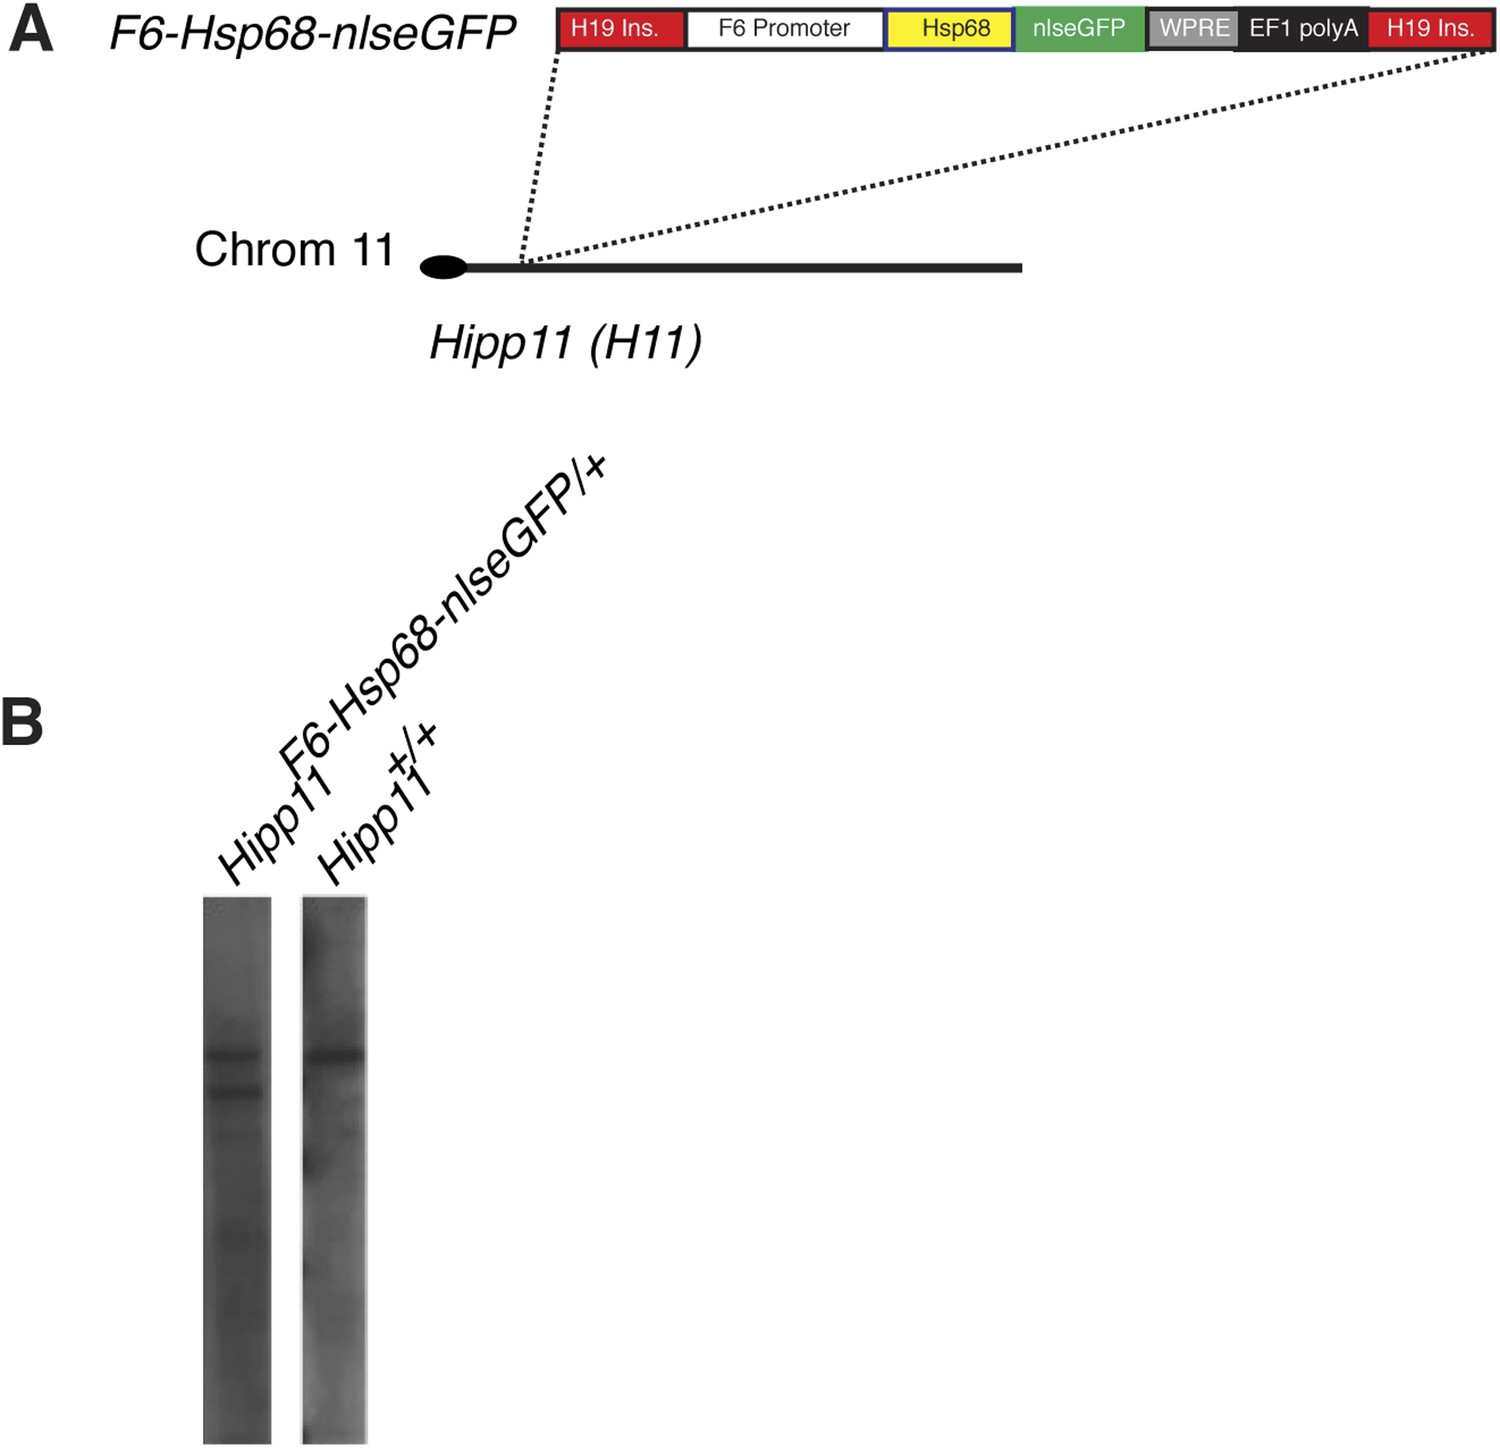
Generation and characterization of Smarcd3-F6nlsEGFP mESC line.
(A) Schematic of Smarcd3-F6nlsEGFP mESC construction. The Smarcd3-F6 enhancer was cloned upstream of the Hsp68 minimal promoter and nlsEGFP coding sequences. The reporter construct was flanked by H19 insulator sequences. The entire construct was targeted to the Hipp11 locus on chromosome 11 and successfully targeted ESC clones were identified by PCR (not shown) and Southern blotting (B).
Figure 7 with 3 supplements

Early establishment of a boundary between the right and left ventricle at the interventricular septum.
(A) Ventral view of yellow septal clone (embryo ID MM8) with additional red and green twin-spots in outflow tract (arrow heads). (B) Section through heart reveals sharp septal boundary of clone (arrows) with an extension of cells at top of septum into RV (asterisk). (C) Ventral view of large septal clone (embryo ID MM25) originating from left ventricle. (D) Section through red-boxed area reveals large yellow clone (arrows) extending from apex of left ventricle towards the top of the interventricular septum. An additional clone of red cells (asterisks) is directly adjacent to the yellow clone. The green twin spot is located just medial to the red twin spot (arrowheads). All clones appear to be originating from the apex of the left ventricle. (E–F) Tbx5+ cells labeled at E6.5 and observed at E10.5 contribute to left ventricle and atria. (G–H) Mef2cAHF + cells labeled at E6.5 and observed at E10.5 contribute to specific anterior heart field structures, including the right ventricle and outflow tract. Note sharp boundary at future site of interventricular septum (IVS, asterisks). (I–J) Tbx5+ cells labeled at E7.5 and observed at E14.5 for mTmG. (K–L) Tbx5+ cells labeled at E6.5 and observed at E14.5 for R26R. A sharp boundary at IVS between the left and right ventricles is present following early labeling of Tbx5+ cells. (M) Smarcd3-F1/Mef2cAHF double positive cells were labeled at E6.5 and observed at E10.5 using the intersectional reporter, RosaAi66. Labeled cells contribute to right ventricle and outflow tract with a minor population of cells extending into the left ventricle. (N) Tbx5+ cells were labeled at E6.5 and their lineage followed using the RosamTmG Cre-reporter (green). Mef2cAHF + cells were also labeled at E6.5 and their lineage followed using the RosanKmB Dre-reporter (blue). Note largely non-overlapping Tbx5 and Mef2cAHF derived lineages in left and right ventricles, respectively, except perhaps a small area of overlap at the forming interventricular septum (asterisks). (O) Tbx5/Mef2cAHF double positive cells were labeled at E6.5 and observed at E10.5 using the intersectional reporter, RosaAi66. A narrow ring of labeled cells is present between the left and right ventricles. (P) Sections confirm a restricted population of labeled cells within the interventricular septum and superior aspect of the ventricular chamber (asterisk). Red, TdTomato; Green, Tropomyosin.
Figure 7—figure supplement 1
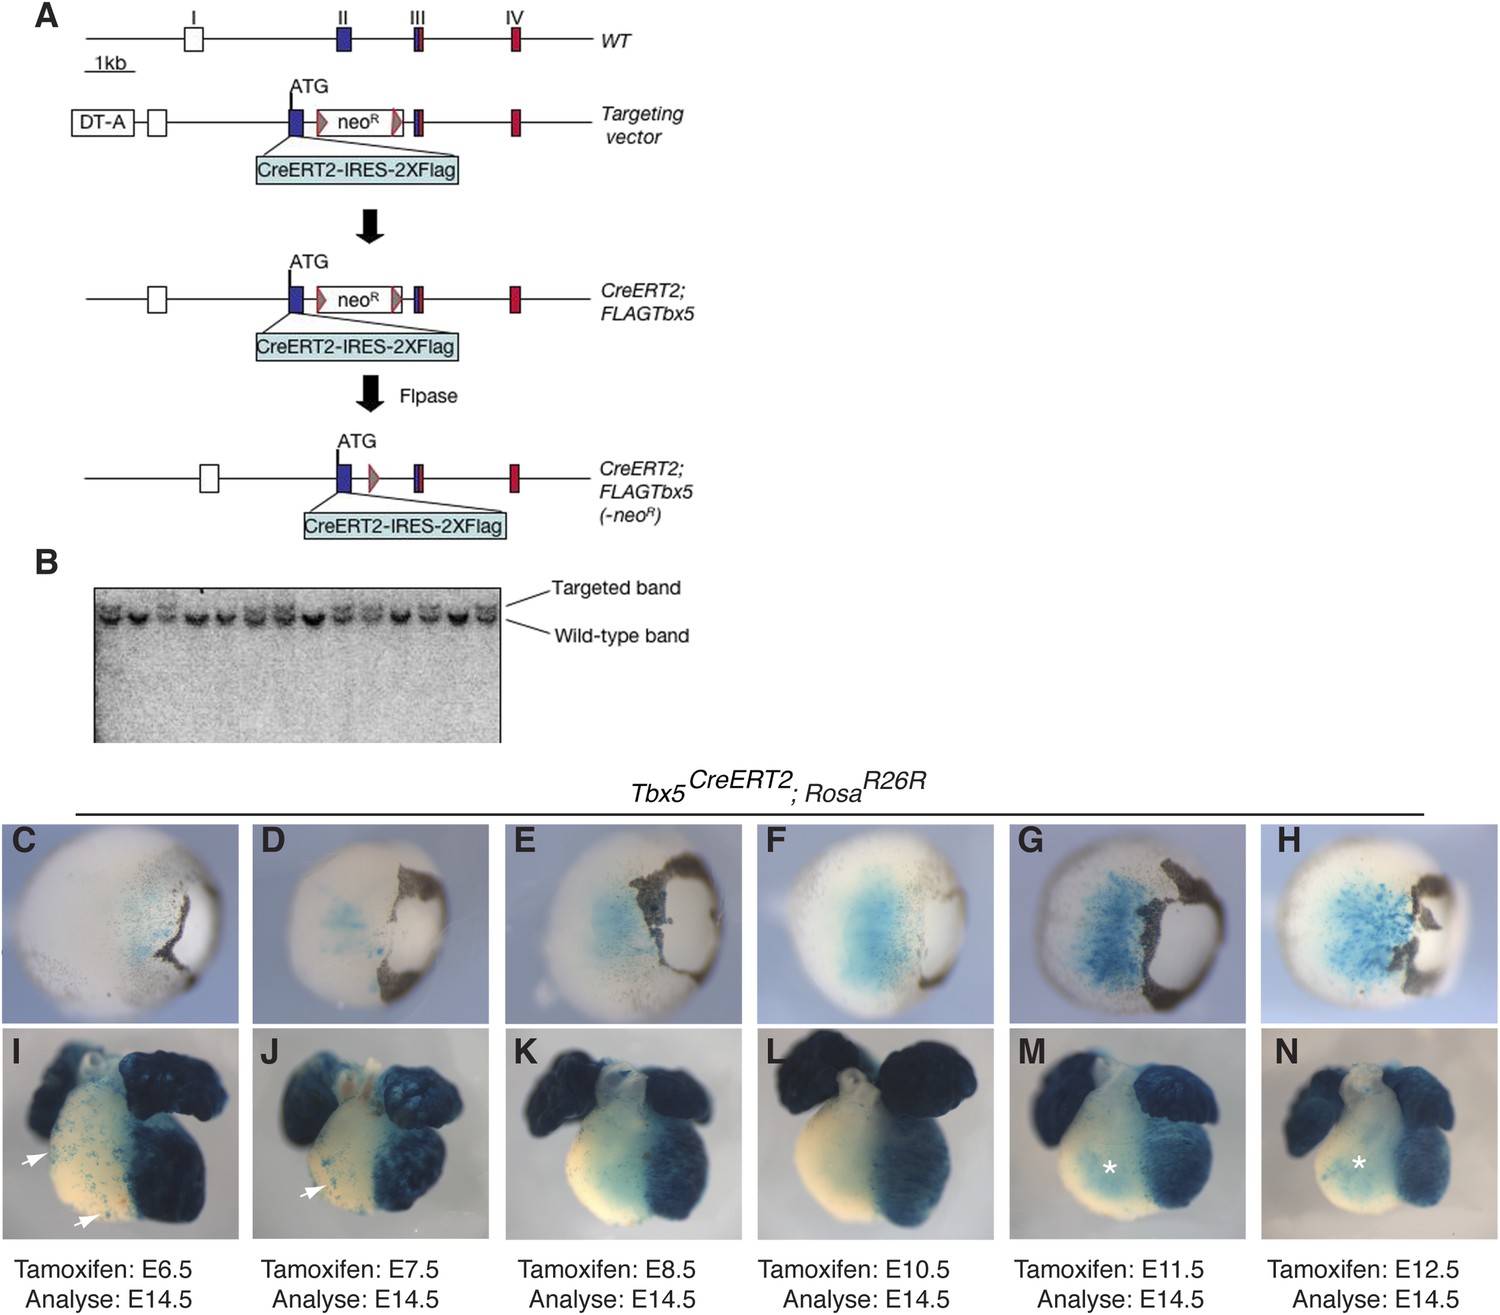
Generation of a multi-use Tbx5 allele.
(A) Tbx5 targeting strategy. Top shows the wild-type (WT) allele of Tbx5: exons are indicated by roman numerals. Open boxes are untranslated regions, filled boxes are coding regions, and red box shows T-box encoding sequence. The targeting vector has a CreERT2-IRES-2X-FLAG inserted in frame with the endogenous Tbx5 coding region and a neomycin resistance cassette (neoR) flanked by frt sites (triangles) in the second intron. Flpase was used to remove the neoR cassette. (B) Southern analysis shows proper targeting of multiple independent ES cell lines. (C–N) Tbx5CreERT2 mice were crossed to RosaR26R reporter mice. Cre activity was induced at the indicated timepoints by tamoxifen injection and analyzed at E14.5. (C–H) Early induction labeled few reporter cells in the retina of double transgenic embryos, however later induction robustly labeled cells within the retina. (I–N) Early induction robustly labeled cells in the left ventricle and atria of double transgenic embryos. In addition, scattered cells are noted on the surface of the right ventricle and outflow-tract (arrows). Induction after E8.5 (L–N) continued to label the left ventricle and atria as well as the trabeculae of the right ventricle (asterisks M–N). Surface labeling on the right ventricle was no longer present after induction at E8.5. LV, left ventricle; RV, right ventricle; IVS, interventricular septum.
Figure 7—figure supplement 2
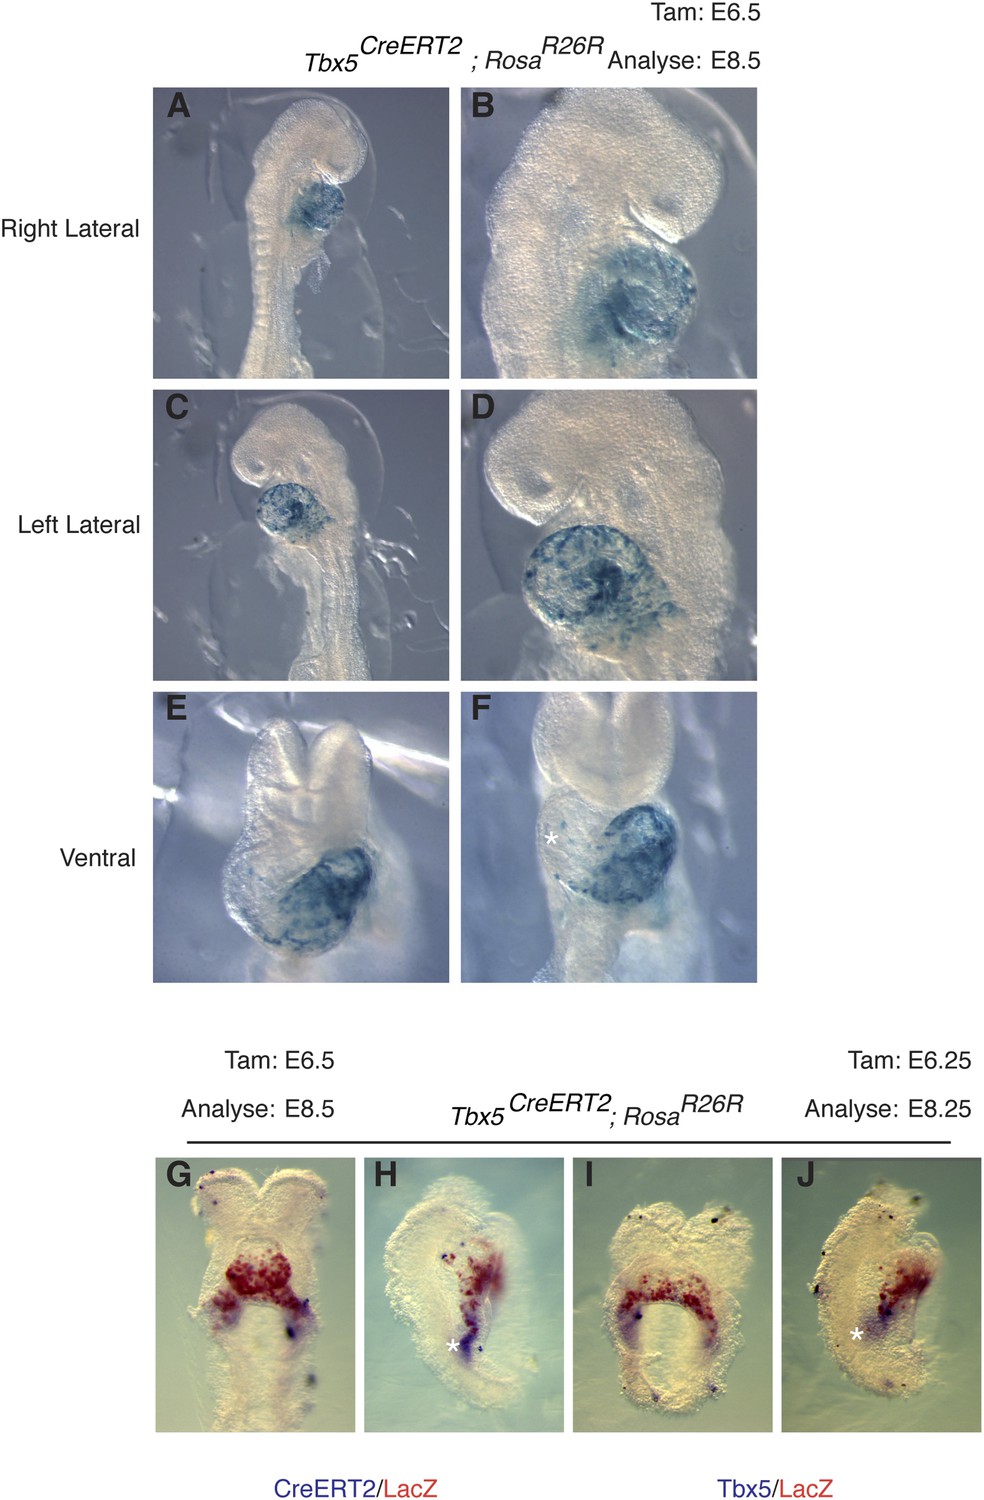
Early labeling of Tbx5CreERT2 lineage.
(A–F) Tbx5CreERT2 mice were crossed to RosaR26R reporter mice. Cre activity was induced at E6.5 and embryos were evaluated at E8.5. Early labeling marks a restricted population of cells that is predominantly localized to the presumptive left ventricle. A few scattered cells are noted on the surface of the forming right ventricle (asterisks, F). In situ hybridization for CreERT2 (G–H) or Tbx5 (I–J) along with salmon gal staining for lacZ in embryos labeled at E6.25 and analyzed at E8.25. Note significant overlap of salmon gal staining with CreERT2 and Tbx5 mRNA. A small domain of CreERT2 and Tbx5 mRNA expression at the caudal end of the sinus horns (asterisks) is not double labeled, consistent with the dynamic nature of Tbx5 expression.
Figure 7—figure supplement 3
Additional characterization of early Mef2cAHF and Tbx5 lineages.
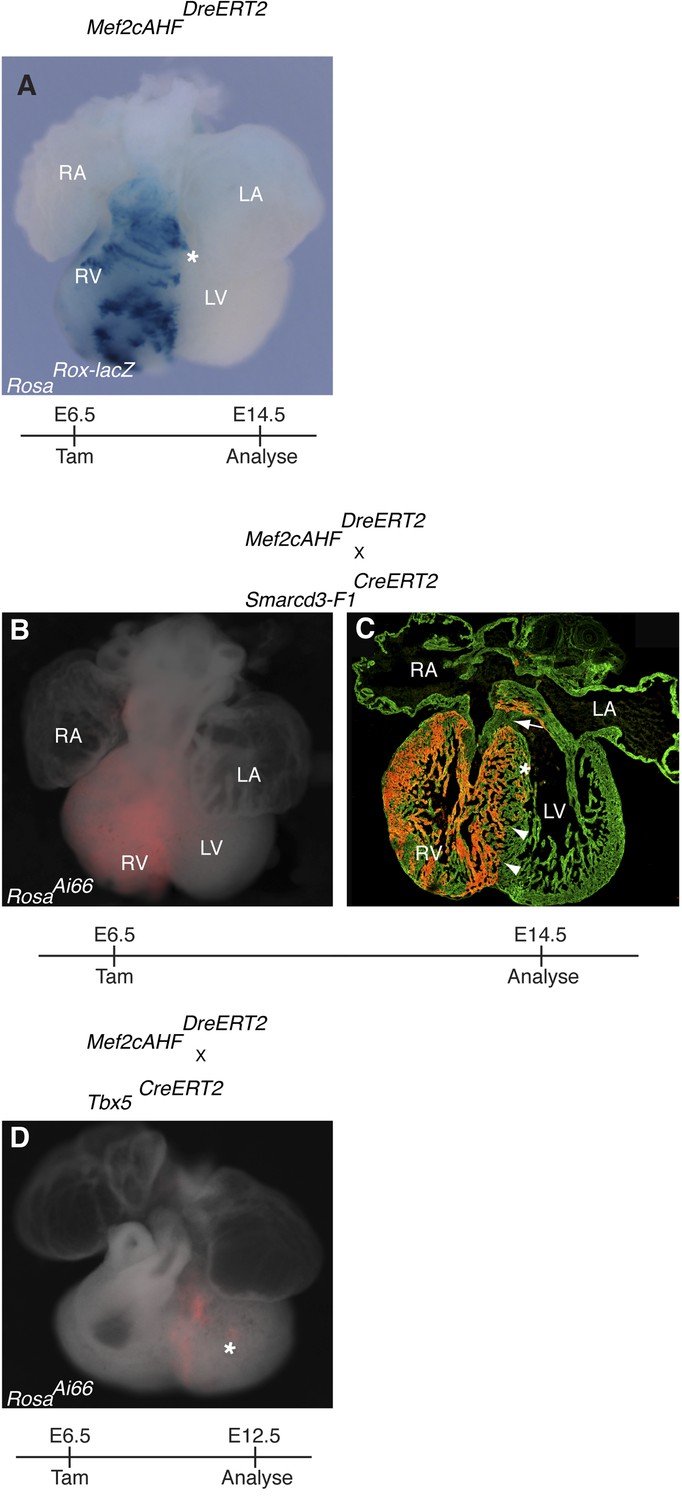
(A) Mef2cAHFDreERT2 mice were crossed to RosaRoxlacZ reporter mice. Dre activity was induced at E6.5 and embryos were evaluated at E14.5. Early labeling marks a restricted population of cells that is predominantly localized to the right ventricle and outflow tract. A few scattered cells are noted extending into the left ventricle (asterisks, and data not shown). (B–C) Smarcd3-F1/Mef2cAHF double positive cells were labeled at E6.5 and observed at E14.5 using the intersectional reporter, RosaAi66. Labeled cells contribute to right ventricle and outflow tract. A sharp boundary is present within the interventricular septum at the apex of the heart (arrowheads), however a minor population of cells extend into the left side near the superior portion of the septum (asterisk). Note an absence of contribution to the cushion at the top of the interventricular septum (arrow). (D) Tbx5/Mef2cAHF double positive cells were labeled at E6.5 and observed at E12.5 using the intersectional reporter, RosaAi66. A narrow ring of labeled cells is present between the left and right ventricles. A few, scattered double positive cells also populate the left ventricular chamber (asterisk).
Figure 8

Summary of patterning and specification of early gastrulating mesoderm.
Clonal analysis reveals early patterning of gastrulating mesoderm including the segregation of cardiac vs non-cardiac mesoderm. Among cardiac mesoderm, progenitors for the two heart fields diverge soon after the initiation of gastrulation and rapidly become specified into discrete populations of committed precursors. Expression of Smarcd3 begins prior to that of other known markers of cardiac progenitors (Nkx2-5, Tbx5, and Isl1) and an enhancer of Smarcd3 (Smarcd3-F6) marks the earliest cardiac-specific progenitor population. Expression of the Mef2AHF enhancer and Tbx5 further subdivides this early population into first vs second heart field progenitors. Inducible genetic lineage tracing along with clonal analysis predicts the existence of a compartment boundary between the future left and right ventricles that is established prior to cardiac morphogenesis.
Download links
A two-part list of links to download the article, or parts of the article, in various formats.
Downloads (link to download the article as PDF)
Open citations (links to open the citations from this article in various online reference manager services)
Cite this article (links to download the citations from this article in formats compatible with various reference manager tools)
Early patterning and specification of cardiac progenitors in gastrulating mesoderm
eLife 3:e03848.
https://doi.org/10.7554/eLife.03848


