Functional fission of parvalbumin interneuron classes during fast network events
- University of California, Irvine, United States
- University of Pécs, Hungary
- David Geffen School of Medicine, University of California, Los Angeles, United States
- West Los Angeles, VA Medical Center, United States
Figures
Figure 1
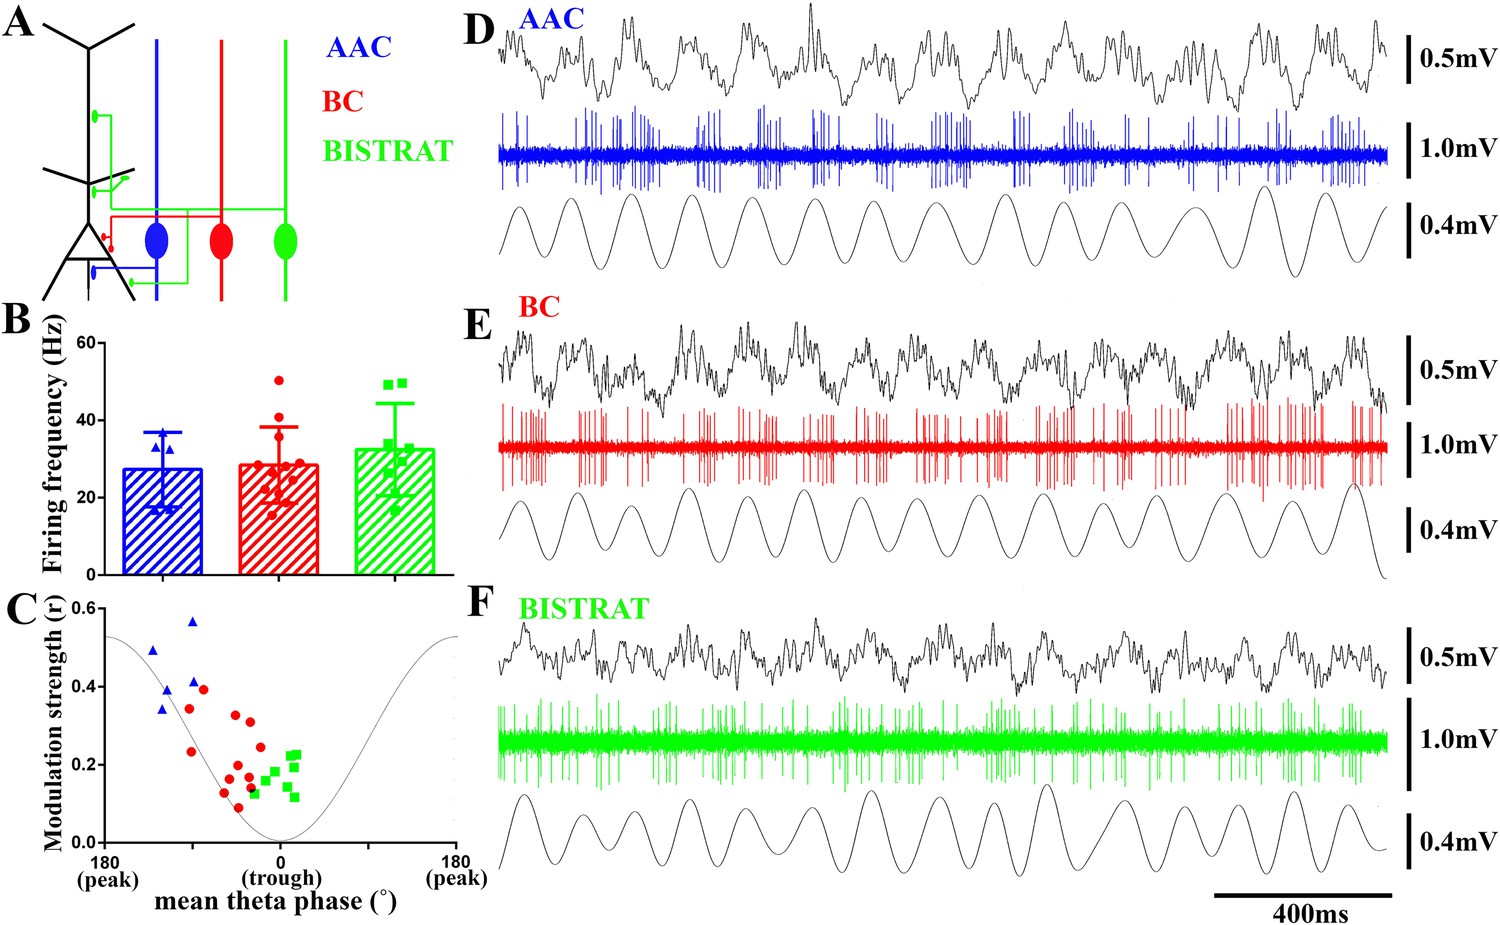
PV cells discharge at similar rates during running-associated theta oscillations but show between-class differences in theta modulation and preferred phases of firing.
(A) The 3 classes of PV interneuron innervate distinct post-synaptic domains of CA1 PCs (black). AACs exclusively target the axon initial segments (AAC, blue); BCs innervate the perisomatic region (somata and proximal dendrites) (BC, red); Bistrat cells synapse on the apical and basal dendrites (Bistrat, green). (B) Firing frequencies during running are high and not significantly different between the 3 PV cell classes. (C) Mean preferred phase vs modulation strength of PV cell discharges. Blue triangles: AACs, red circles: BCs, green squares: Bistrat cells. A thin gray line representing a theta cycle is shown to illustrate the theta phases. (D–F) Example traces of LFP, spikes, and filtered theta oscillation of an AAC (D), BC (E), and Bistrat cell (F). Scales: LFPs = 0.5 mV; single cell unit firing = 1 mV; theta = 0.4 mV.
Figure 2
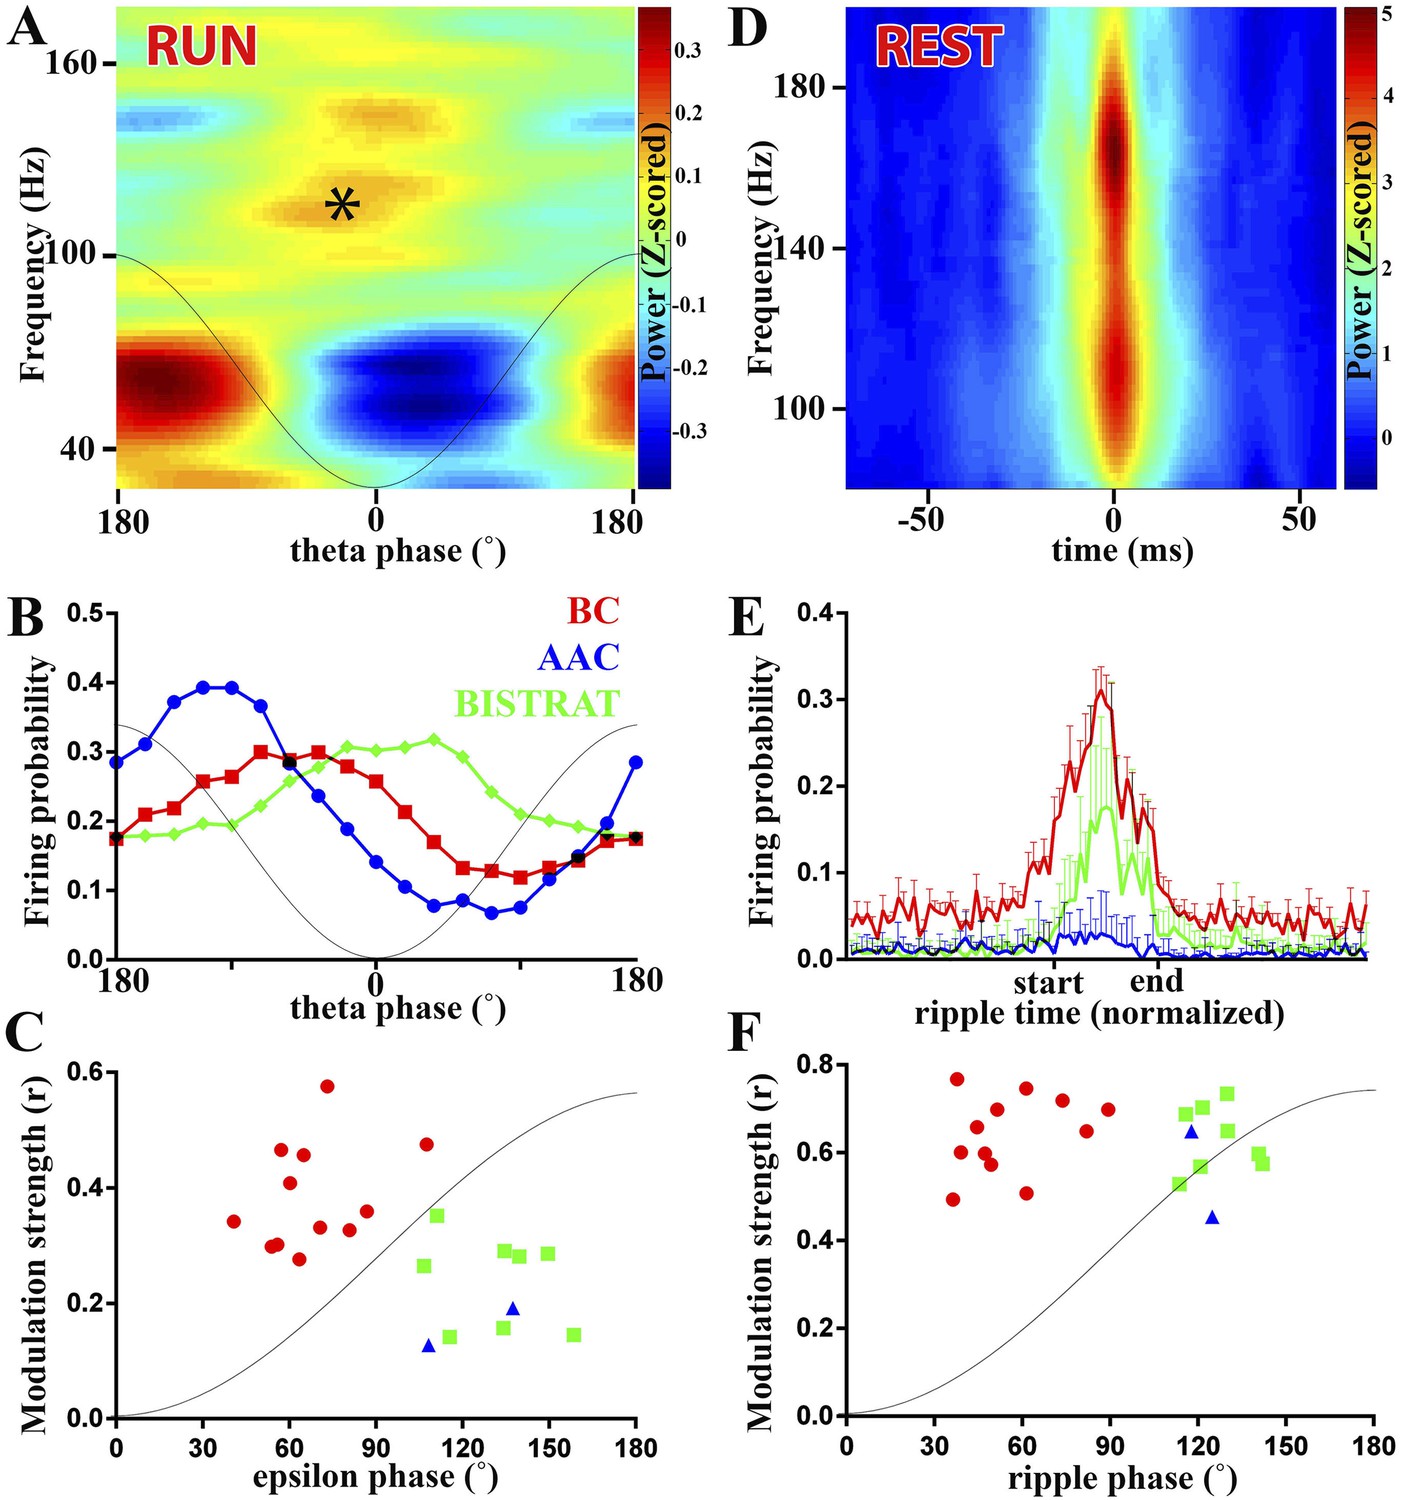
PV cell discharges during high-frequency (>90 Hz) oscillations associated with running or resting.
(A–C) Running-associated, theta-nested epsilon oscillations. (A) Averaged time–frequency plot triggered by theta troughs during running. A thin gray line representing a theta cycle is overlaid on the plots in panels A and B to illustrate the theta phases. Asterisk indicates the epsilon oscillations occurring during the late descending phase of theta. (B) Average firing probabilities of the 3 PV cell classes during theta oscillations. Note that the peak firing probability of BCs and Bistrat cells overlaps with the occurrence of epsilon oscillatory epochs (asterisk in panel A). (C) Preferred phase of firing and strength of modulation of discharges during epsilon oscillations (individual cells). A thin gray line representing half an epsilon cycle is overlaid on the plot to illustrate the epsilon phases. (D–F) Rest-associated ripples. (D) Time–frequency plot of detected ripples (90–200 Hz) during resting. (E) The mean firing probabilities of PV cell classes before, during, and after ripples (error bars: S.D.). (F) Preferred phase of firing and strength of modulation of discharges during ripple oscillations (individual cells). A thin gray line representing half a ripple cycle is overlaid on the plot to illustrate the ripple phases. Blue triangles: AACs, red circles: BCs, green squares: Bistrat cells.
Figure 3
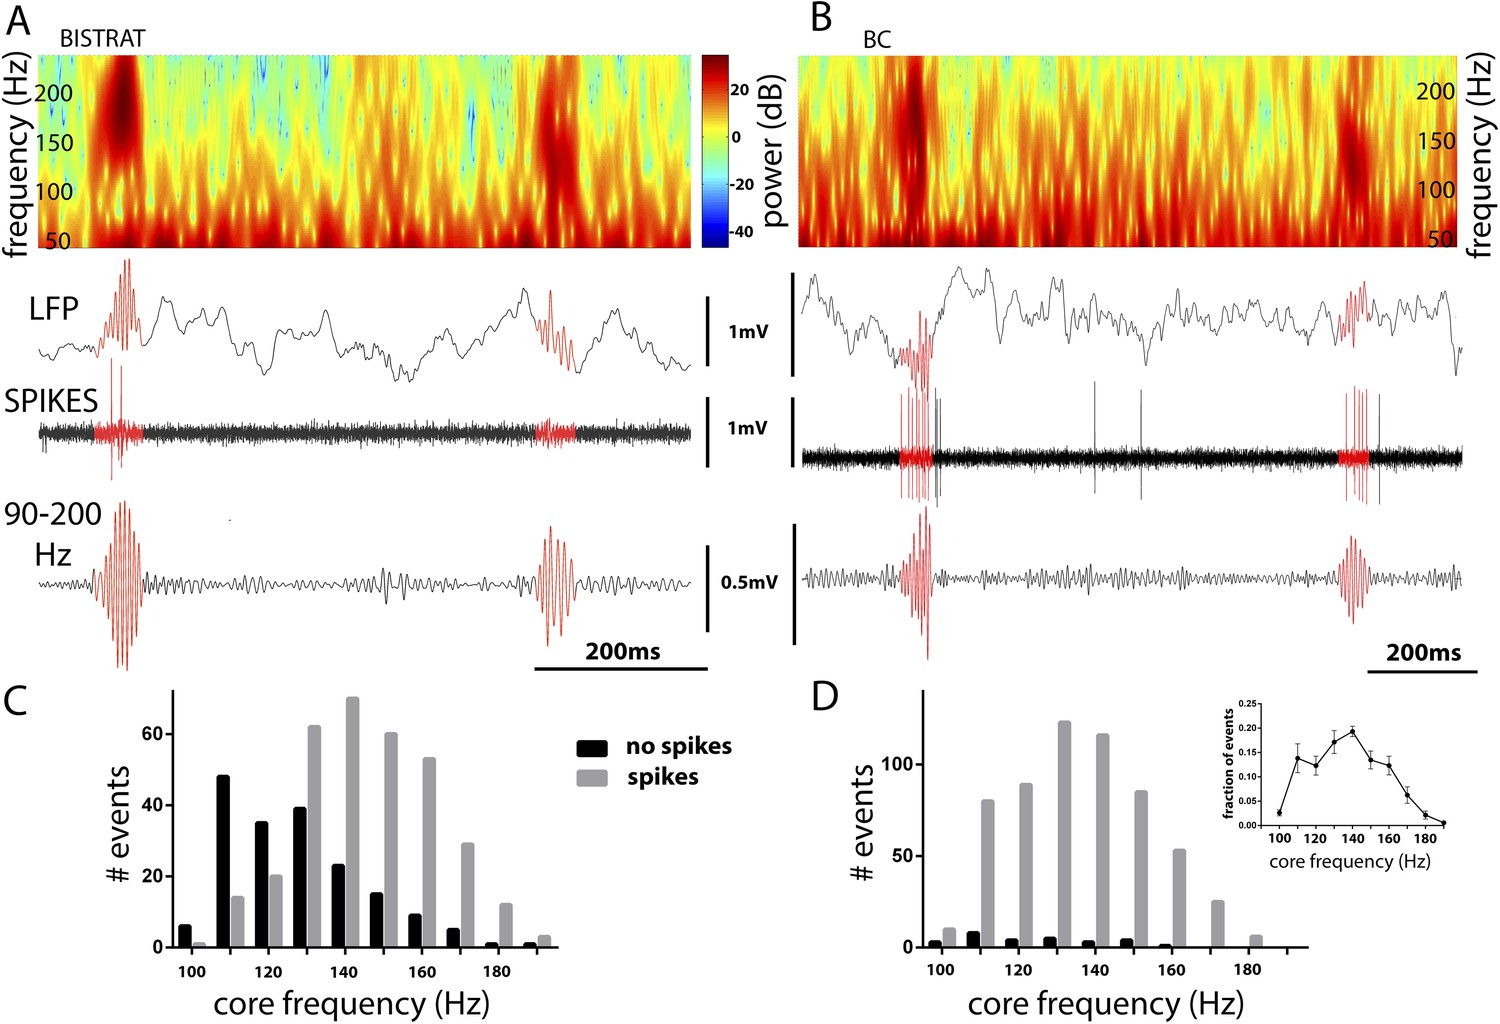
Bistrat cells, in contrast to BCs, differentially fire during faster and slower ripples.
(A and B) Time–frequency representation (top) of example traces (LFP) with two high-frequency epochs (highlighted in red). Note that spikes of the recorded Bistrat cell (A) occurred only during the first, higher frequency oscillatory event, but remained silent during the second, lower frequency one. However, the BC (B) was highly active during both the higher and lower frequency epoch. (C and D) Frequency distribution of ripple events with (gray bars) or without (black bars) Bistrat cell (C) or BC (D) spiking (10 Hz binned). Data are pooled from all recorded Bistrat cells (n = 8, C) and BCs (n = 12, D). Note that Bistrat cells selectively fired during the higher frequency events but BCs discharged during virtually all ripple events. Inset in (D) illustrates that the high-frequency events showed a continuum of core frequencies (n = 16 animals; note that mean and standard error are plotted in the inset to facilitate comparison with Figure 1B in Sullivan et al., 2011).
Figure 4
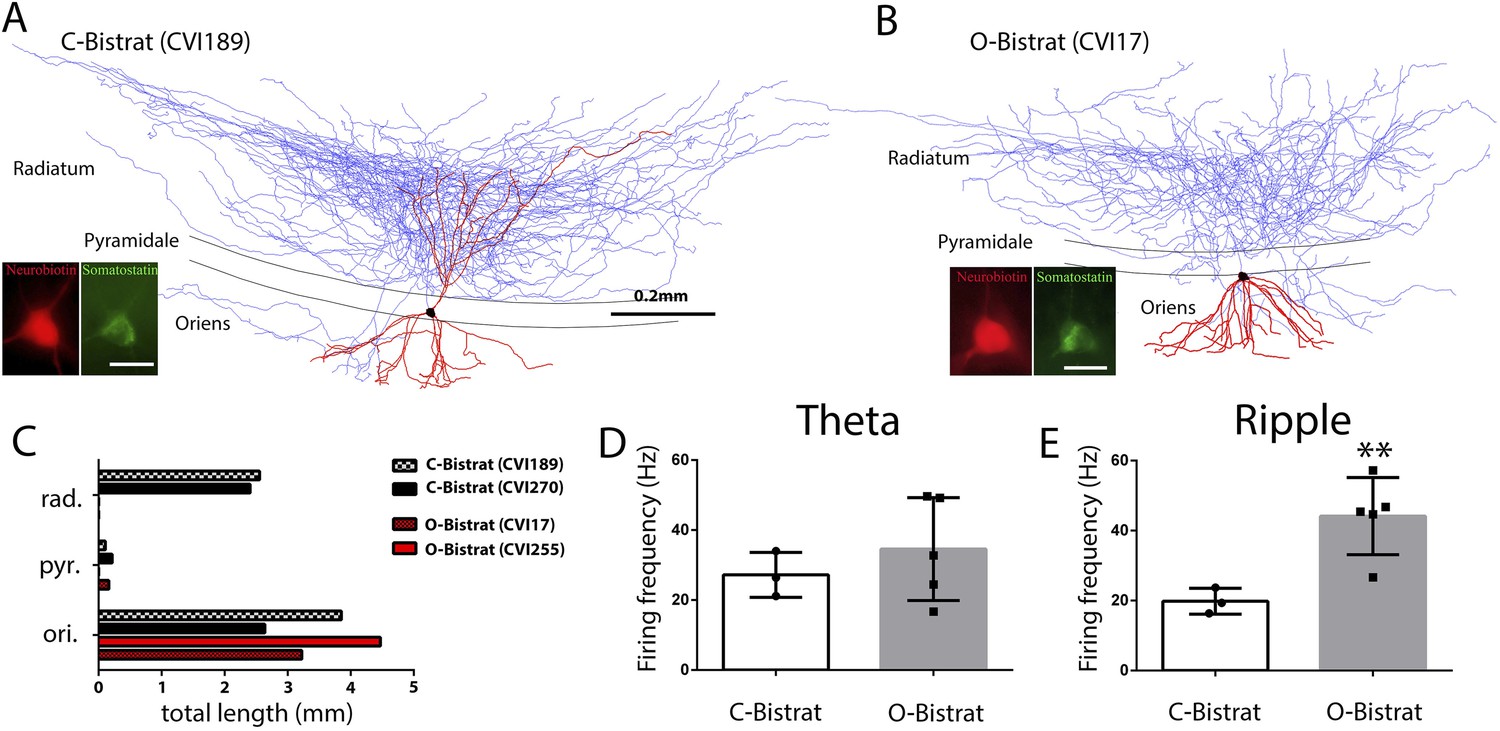
Morphologically distinct Bistrat cell sub-classes fire differentially during sharp-wave associated ripple events.
(A and B) Fully reconstructed (axons: blue; dendrites: red; soma: black) representative cells of the two Bistrat cell sub-classes. (C) Total dendritic lengths measured in stratum radiatum/pyramidale/oriens of individual cells, with each cell differentially color coded. The O-Bistrat cells (B) have no dendrites in the radiatum, the C-Bistrat cells (A) have dendrites in stratum radiatum and oriens as well. (D) The firing frequencies of the O-bistrat and C-bistrat cells did not show significant differences during running-associated theta oscillations. (E) The O-Bistrat cells discharged at significantly higher rates than the C-Bistrat cells during ripples.
Figure 5
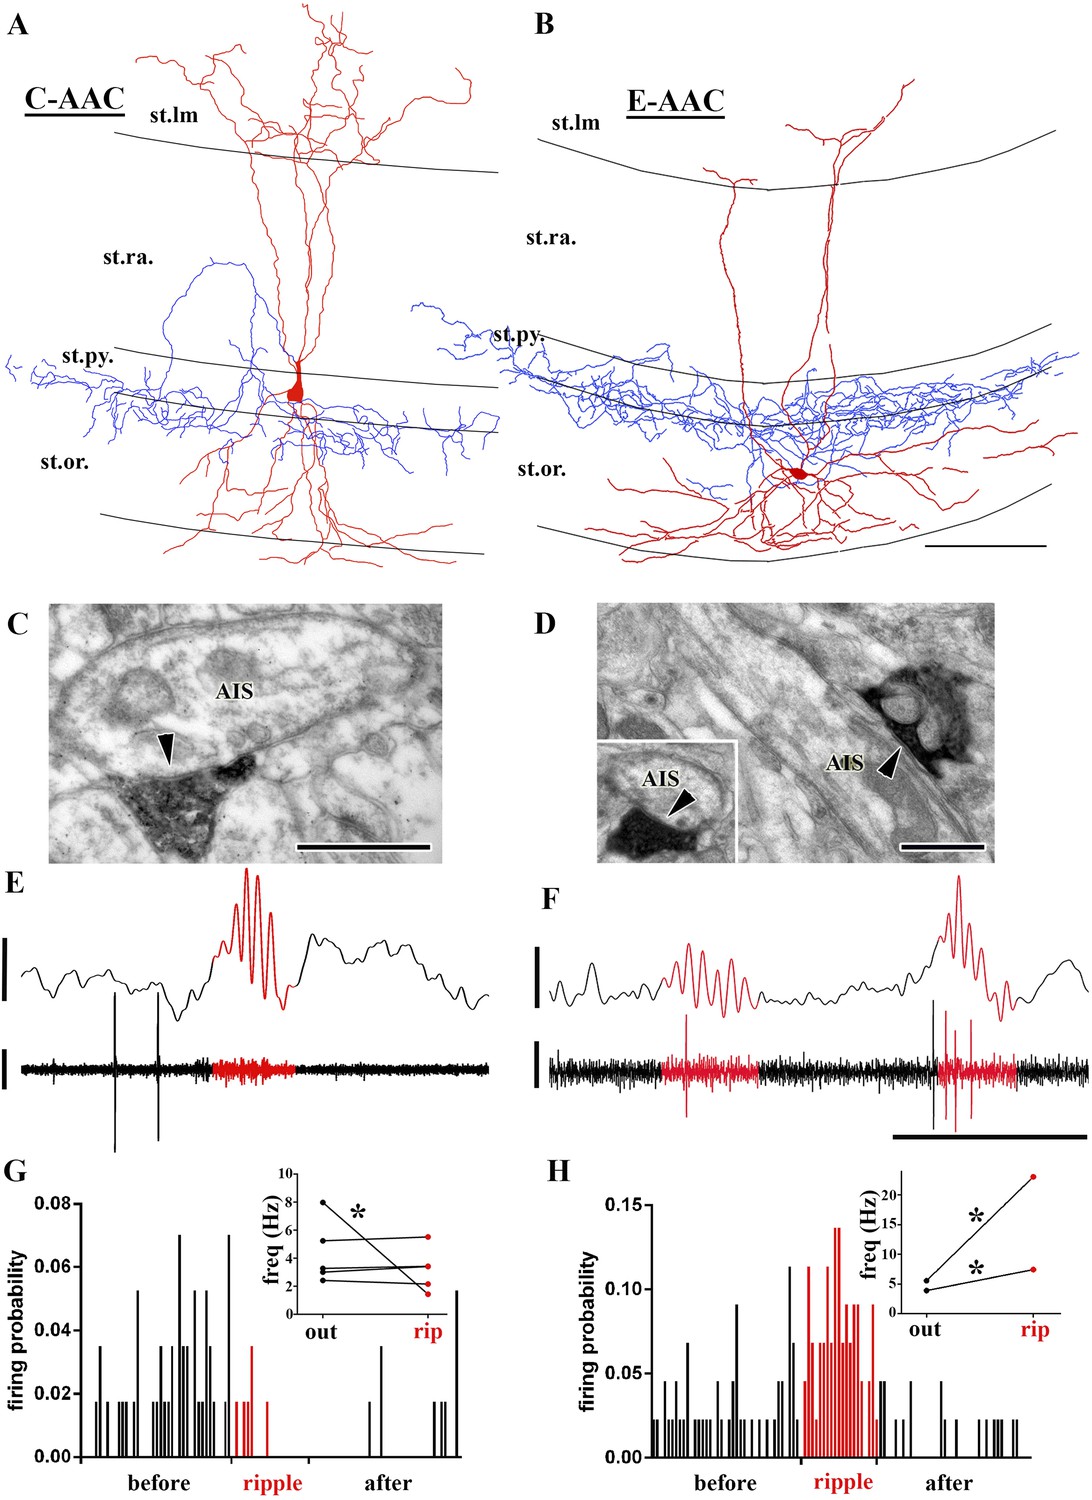
Sub-populations of AACs show distinct action potential discharge probabilities during ripples.
(A and B) Full reconstruction of dendritic arborizations and cell bodies of two representative AAC cells. Note that the cell body in (A) is located within stratum pyramidale (C-AAC), but the cell in (B) is in the stratum oriens (E-AAC; scale: 100 μm). (C and D) Electron microscopic verification of axon initial segments (AISs) as the exclusive post-synaptic targets of the axons of AACs in (A) and (B), respectively. The bouton in (C) innervates two adjacent AISs. Panel (D) also illustrates that targets were verified on longitudinally and transversely (inset) sectioned AISs (arrowheads in C, D: synaptic clefts, scales: 500 nm). (E and F) Example LFPs (upper traces) and the action potentials of cells shown in (A) and (B), respectively. Ripples are highlighted with red. Note the different firing activity of cell (A) and (B) during the events. Voltage scales: 0.5 mV; time scale: 100 ms. (G and H) Firing probabilities of cells in (A) and (B), respectively, as a function of normalized time before, during, and after ripples. Insets in (G and H): average firing frequencies of individual cells outside (‘out’; black dots) and inside (‘rip’; red dots) of ripple events. C-AACs (G, n = 5) did not change significantly their firing frequency during ripples; however, E-AACs (n = 2) showed elevated activity during events (statistical analysis as in Varga et al. (2012), based on randomization of spike times; see ‘Materials and methods’). Significance is indicated with asterisks (p < 0.05).
Figure 6
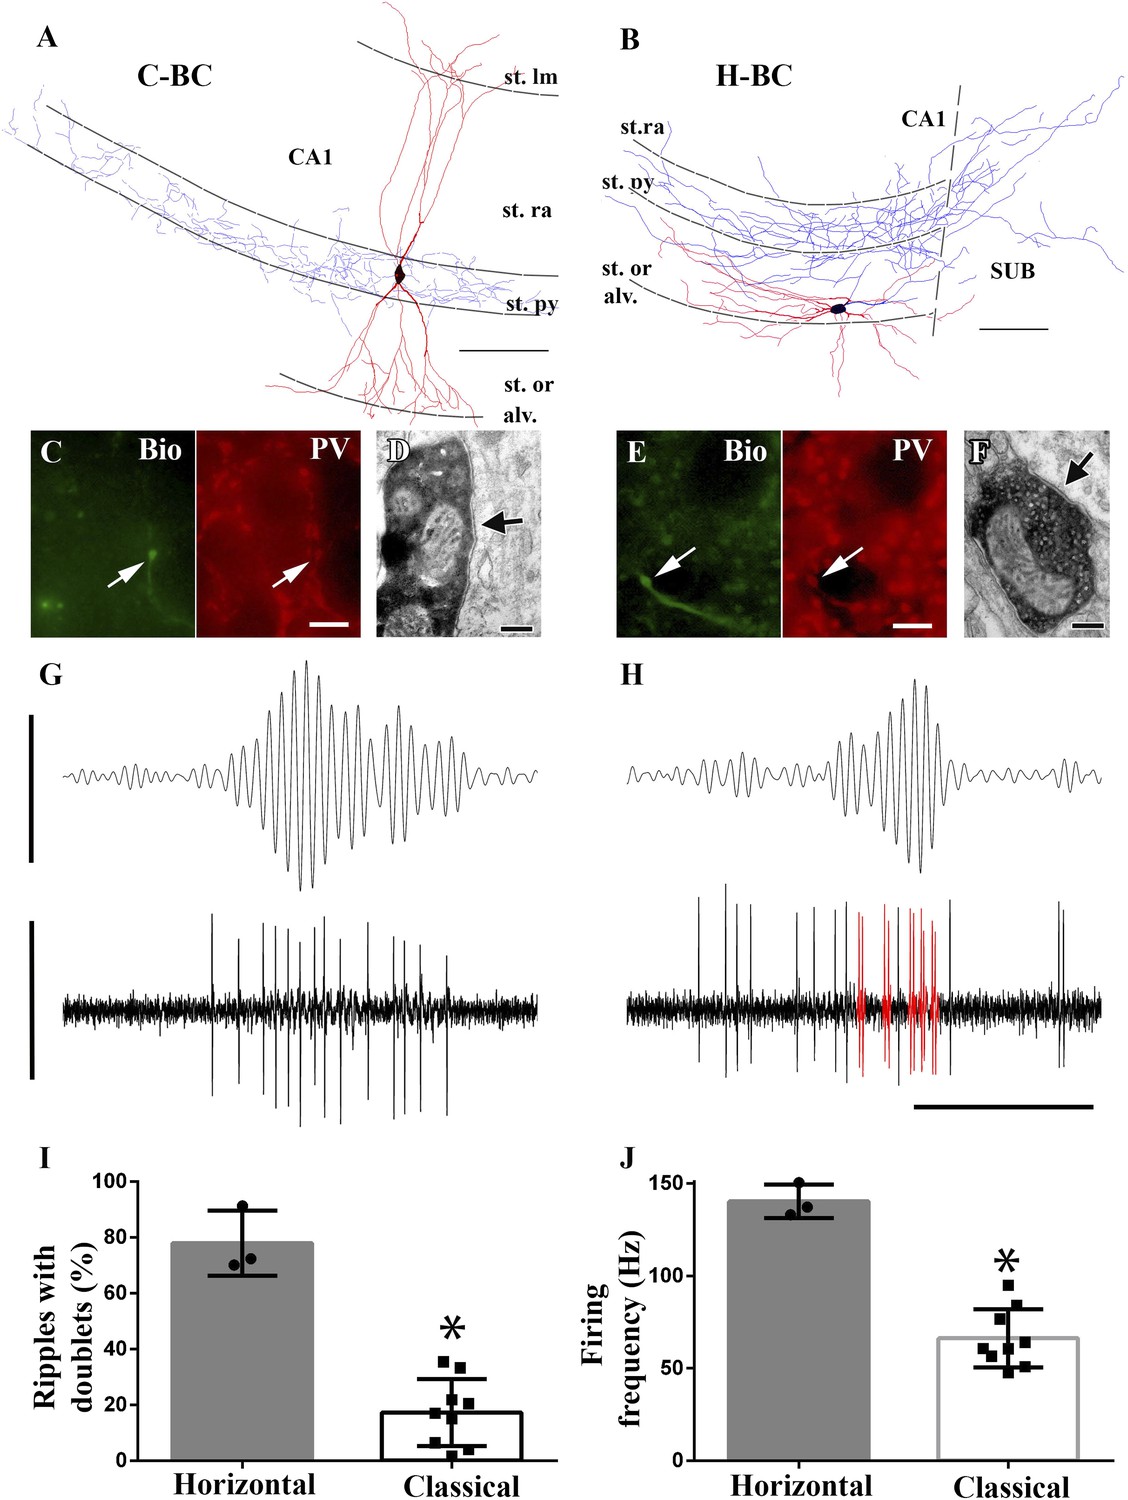
Horizontal-BCs located outside pyramidal layer fire doublets during sharp-wave associated events.
(A and B) Full dendritic (red) and partial axonal reconstructions of a classical (A) and a horizontal (B) BC. Axons were partially reconstructed from single 60 μm sections for better visualization. Note that the H-BC had dendrites only in oriens/alveus, whereas the C-BC had dendrites in the stratum radiatum (and lacunosum-moleculare) as well. The H-BC sent axons both to the subiculum and CA1, in contrast to the C-BCs that innervated only the CA1 pyramidal layer. Scales: 100 μm. (C and E) Immunohistochemical verification of PV expression of cells in (A) and (B), respectively. Arrows point to neurobiotin (Bio) filled boutons (green) in the stratum pyramidale and to the corresponding PV positive profiles (scales: 10 µm). (D and F) Electron micrographs of boutons of the same classical (A and D) and horizontal (B and F) BCs innervating somata in the CA1 pyramidal layer. Arrows indicate the synaptic specializations. (G and H) Example band-pass filtered LFPs (90–200 Hz; upper traces) and the action potentials of the H- and C-BCs (A and B, respectively). Note that the H-BC repeatedly fired two spikes per oscillatory cycle (doublets: red), whereas the C-BC fired one spike per ripple cycle. LFP: 0.4 mV; unit traces: 1 mV; time scale: 100 ms. (I) The relative number of ripple events with doublets of action potential firing was significantly higher for H-BCs compared to C-BCs. (J) Average firing frequencies during ripple events were also significantly higher in H- than in C-BCs.
Figure 7
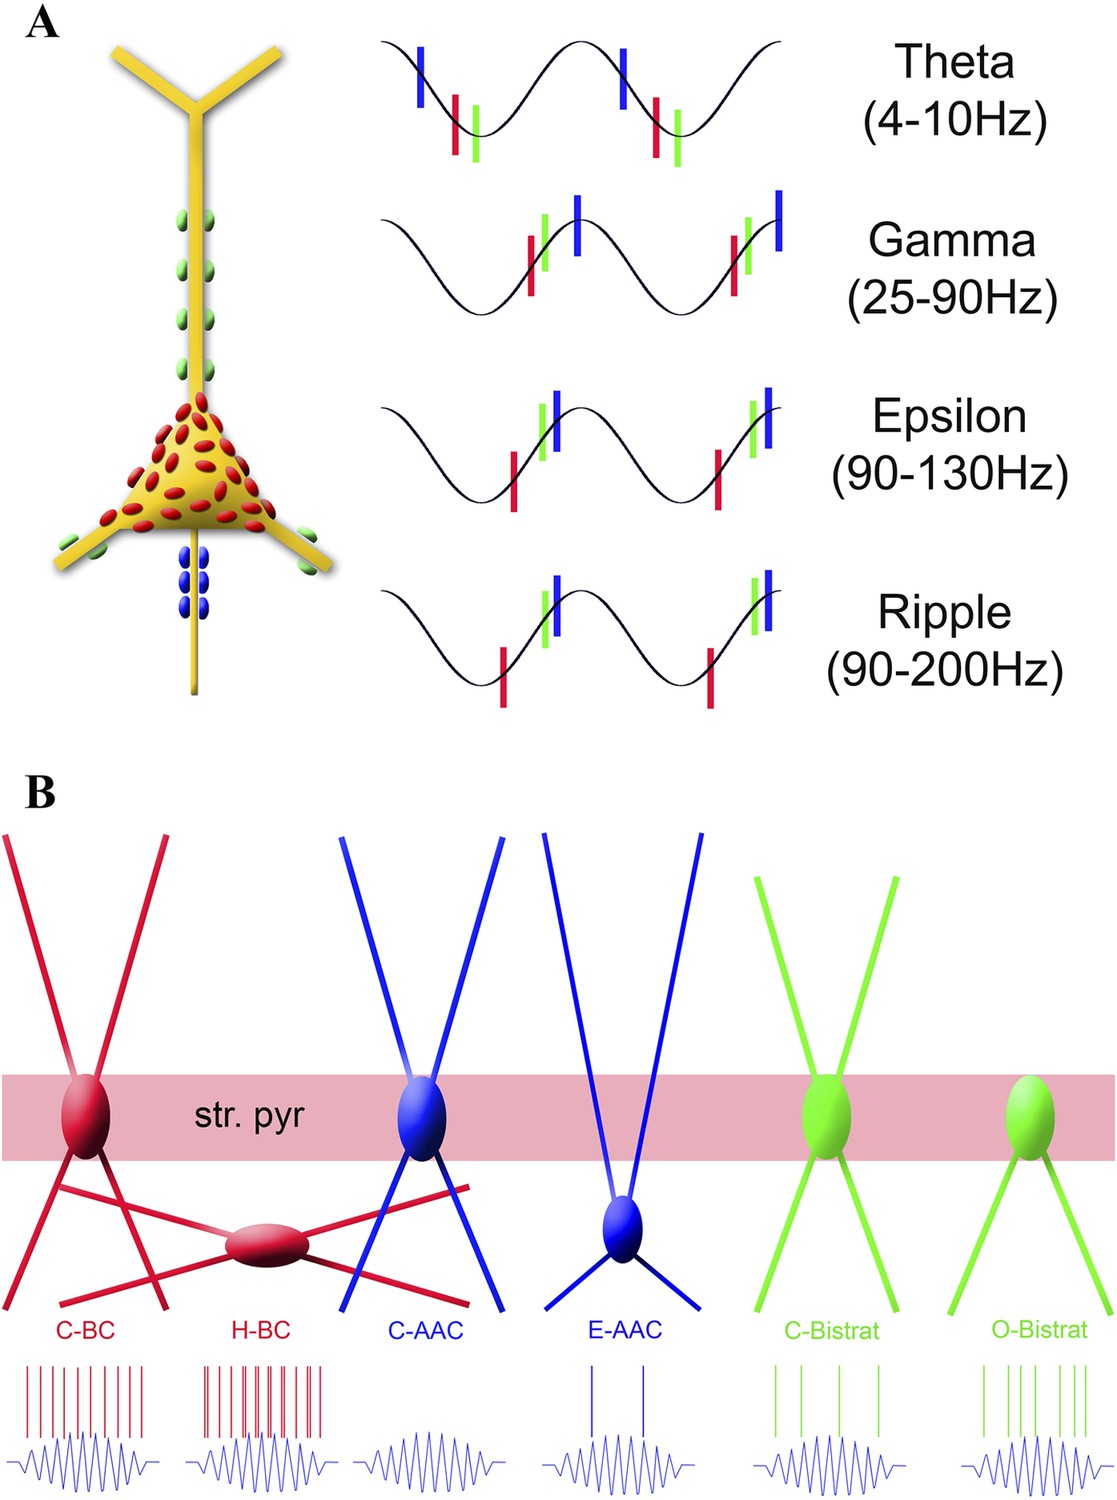
Summary of the temporal ordering of discharges by the three main PV cell classes (A) and the firing properties of the new sub-classes of PV cell during ripples (B).
(A) Schematic illustration shows a PC with axon terminals from AACs (blue), BCs (red), and Bistrat cells (green); the same color code is used to illustrate the phase-preferential firing of the three major PV cell classes during theta, gamma, epsilon, and ripple oscillations. Note that the axon initial segment receives the earliest inputs during theta waves, whereas during the faster rhythms (gamma, epsilon, ripple) BCs fire first, followed by the Bistrat cells and the AACs. (B) Layer-specific locations of somata and dendrites segregate with the ripple-related discharge properties of the 6 PV sub-classes. Note the enhanced firing by the H-BCs, E-AACs, and the O-Bistrat cells compared to their classical counterparts (C-BCs, C-AACs, and C-Bistrats).
Tables
Table 1
List of all n = 27 in vivo juxtacellularly filled PV interneurons and their identification based on immunocytochemistry and electron microscopy (EM)
| Cell ID# | Cell type | Parvalbumin | Somatostatin | mGluR1a | SATB1 | Bouton targets | |
|---|---|---|---|---|---|---|---|
| AnkyrinG verification | EM verification | ||||||
| 123011c3 | C-BC | + | n.t. | n.t. | n.t. | n.t. | Soma/proximal dendrite |
| cvi30 | C-BC | + | n.t. | n.t. | n.t. | n.t. | Soma/proximal dendrite |
| cvi33 | C-BC | + | n.t. | n.t. | n.t. | n.t. | n.t. |
| cvi35 | C-BC | + | n.t. | n.t. | n.t. | n.t. | n.t. |
| cvi55 | C-BC | n.t. | n.t. | n.t. | n.t. | n.t. | Soma/proximal dendrite |
| cvi65 | C-BC | + | n.t. | n.t. | n.t. | n.t. | n.t. |
| cvi75 | C-BC | + | n.t. | n.t. | n.t. | n.t. | n.t. |
| cvi151 | C-BC | n.t. | n.t. | n.t. | n.t. | n.t. | n.t. |
| cvi251 | C-BC | n.t. | n.t. | n.t. | n.t. | n.t. | n.t. |
| cvi240b | H-BC | + | n.t. | n.t. | n.t. | n.t. | Soma/proximal dendrite |
| 042911c5 | H-BC | + | n.t. | n.t. | n.t. | n.t. | n.t. |
| gs0920 | H-BC | + | n.t. | n.t. | n.t. | n.t. | n.t. |
| gs012913 | O-Bistrat | + | + | n.t. | n.t. | n.t. | n.t. |
| gs022713 | O-Bistrat | + | + | n.t. | n.t. | n.t. | n.t. |
| cvi017 | O-Bistrat | n.t. | + | n.t. | n.t. | n.t. | n.t. |
| cvi255 | O-Bistrat | − | + | n.t. | n.t. | n.t. | n.t. |
| cvi312 | O-Bistrat | n.t. | + | − | n.t. | n.t. | n.t. |
| cvi270 | C-Bistrat | + | + | n.t. | n.t. | n.t. | n.t. |
| imi069 | C-Bistrat | n.t. | + | n.t. | n.t. | n.t. | n.t. |
| cvi190 | C-Bistrat | − | + | n.t. | n.t. | n.t. | n.t. |
| 090311c3 | E-AAC | + | n.t. | n.t. | n.t. | n.t. | AIS |
| cvi059 | E-AAC | n.t. | n.t. | n.t. | n.t. | n.t. | AIS |
| cvi153 | C-AAC | n.t. | n.t. | n.t. | n.t. | n.t. | AIS |
| cvi258 | C-AAC | + | n.t. | n.t. | n.t. | n.t. | AIS |
| cvi315 | C-AAC | n.t. | n.t. | n.t. | − | n.t. | n.t. |
| imi075 | C-AAC | + | n.t. | n.t. | n.t. | AIS | n.t |
| 07082014cs6 | C-AAC | n.t. | n.t. | n.t. | n.t. | AIS | AIS |
-
Abbreviations: n.t.: not tested; AIS: axon initial segment.
Download links
A two-part list of links to download the article, or parts of the article, in various formats.
Downloads (link to download the article as PDF)
Open citations (links to open the citations from this article in various online reference manager services)
Cite this article (links to download the citations from this article in formats compatible with various reference manager tools)
Functional fission of parvalbumin interneuron classes during fast network events
eLife 3:e04006.
https://doi.org/10.7554/eLife.04006


