Astrocytes refine cortical connectivity at dendritic spines
- Duke University Medical Center, United States
- Boston Children's Hospital, Harvard Medical School, United States
- Duke Institute for Brain Sciences, United States
Figures
Figure 1
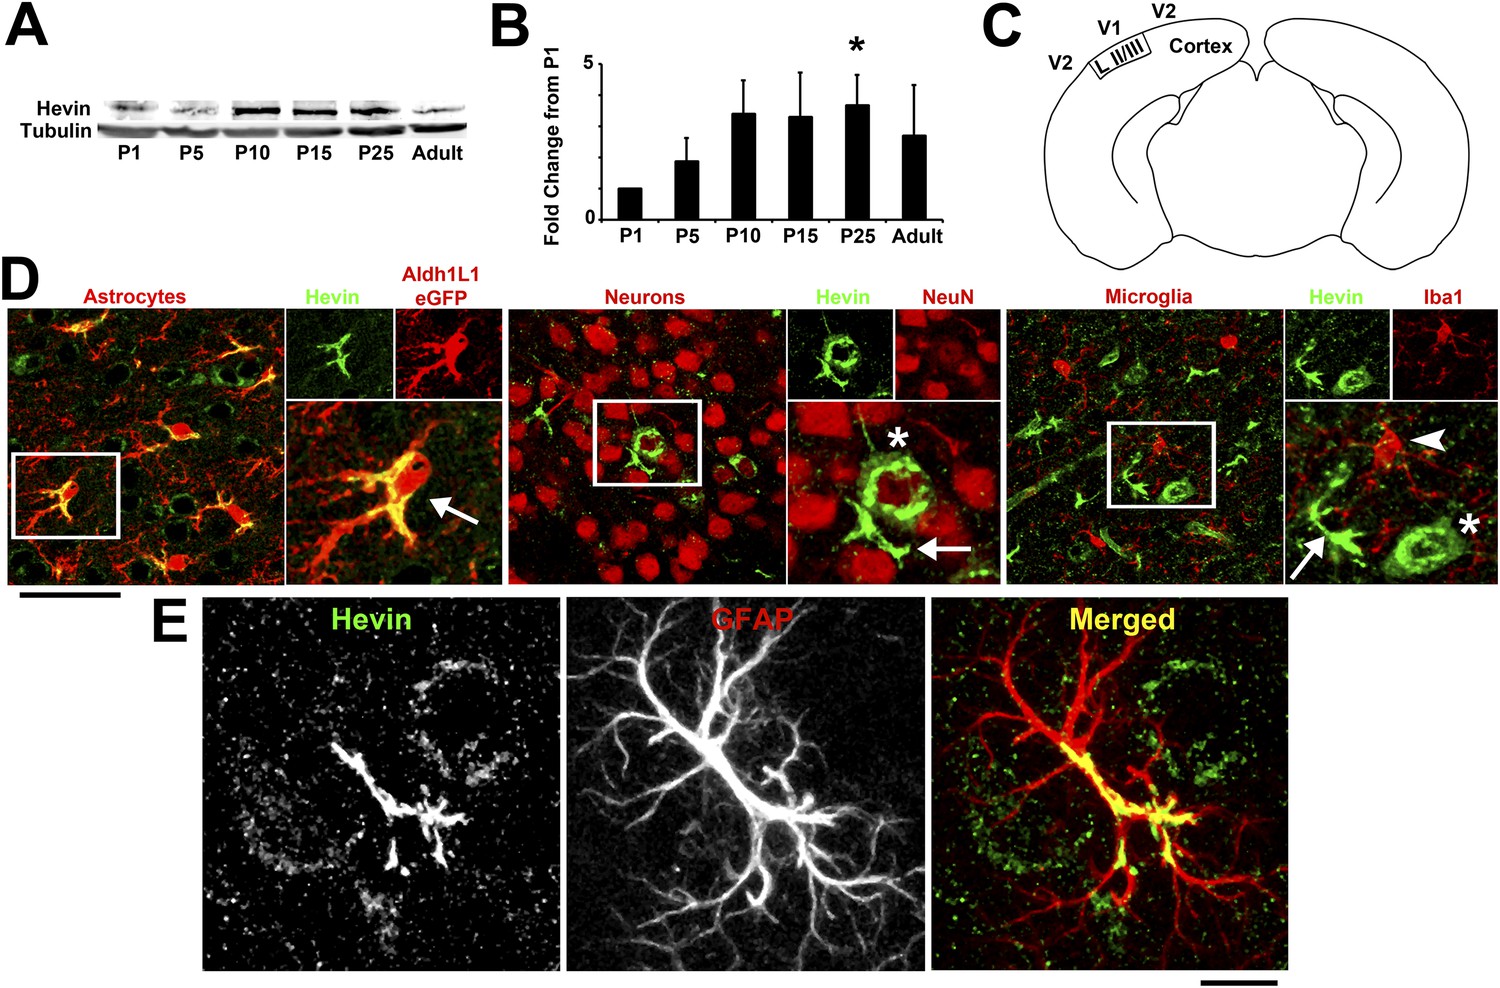
Hevin expression by astrocytes is developmentally regulated in the cortex.
(A) Representative Western blots showing the developmental timeline for hevin expression in mouse cortex and hippocampus (tubulin was used as a loading control). (B) Quantification of Western blot analysis of hevin expression shows high expression between P15–P25. Data is presented as fold change compared to P1 levels (n = 3 animals per age; p < 0.05; one-way ANOVA with Dunnett's post hoc test). (C) Schematic diagram of a coronal slice through mouse brain shows the synaptic zone of primary visual cortex (V1) where EM, IHC and Golgi-cox staining analyses were performed. Layer II/III neurons of the visual cortex heavily project their dendrites to this region (D) IHC staining reveals that hevin expression (green) overlaps with all astrocytes (left, arrow) and a small subset of neurons (middle, asterisk) in V1, with no overlap seen with microglia (right, arrowhead). Cell-specific markers in red: Aldh1L1-EGFP for astrocytes, NeuN for neurons, Iba1 for microglia. Scale bar, 50 µm. (E) The rarely occurring GFAP+ astrocytes (red) in healthy visual cortex also express hevin (green). Scale bar, 10 µm.
Figure 2 with 4 supplements
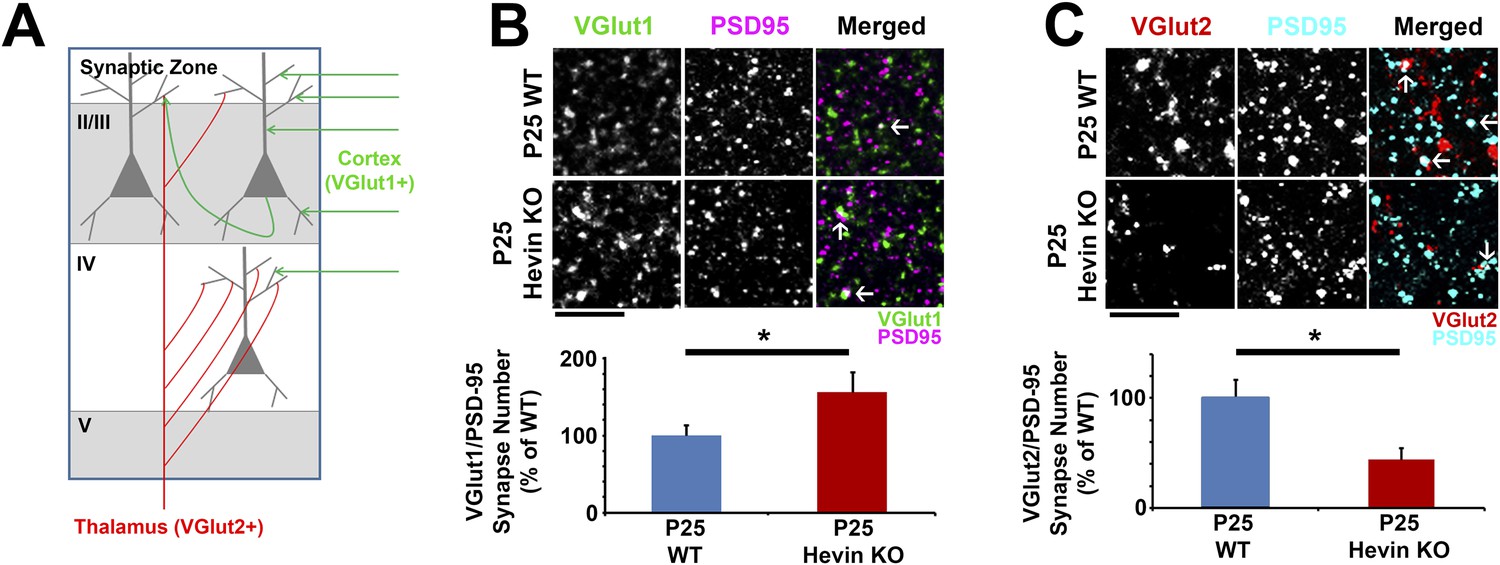
Hevin is required for proper thalamocortical innervation of V1.
(A) Schematic of synaptic input to area V1. Most inputs are intracortical (green) and contain primarily VGlut1. The thalamus sends VGlut2+ projections (red) to various layers of V1 (primarily Layer IV). Competition occurs between VGlut1+ and VGlut2+ terminals for the same postsynaptic targets. (B) Co-localization of VGlut1 (green) and PSD95 (magenta) revealed an increase in intracortical synapses (co-localized puncta; arrows) in the synaptic zone of P25 hevin KO V1 (n = 3 z-stacks per animal, 5 animals per genotype; p < 0.05, nested ANOVA). Scale bar, 5 µm. (C) VGlut2 (red) and PSD95 (cyan) co-localization (arrows), representing thalamocortical synapses, was significantly decreased in P25 hevin KO compared to P25 WT (n = 3 z-stacks per animal, 4 animals per genotype; p < 0.05, nested ANOVA). Scale bar, 5 µm.
Figure 2—figure supplement 1
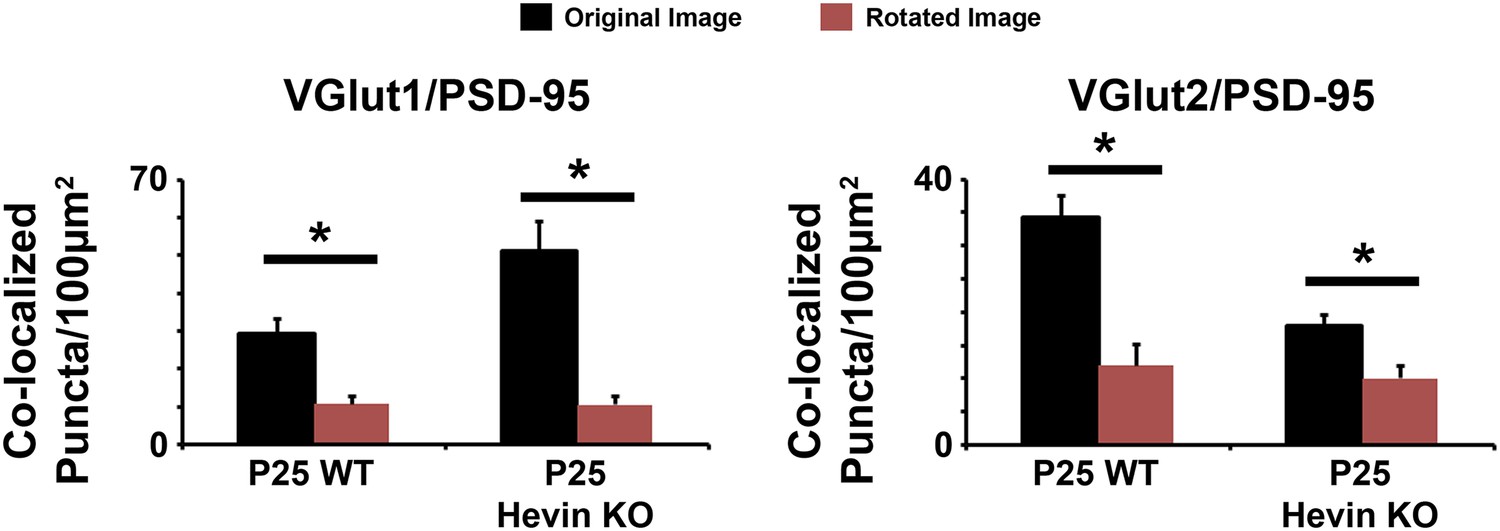
Co-localized synaptic puncta are not due to random chance resulting from dense synaptic staining.
Confocal Z-stacks were split into two channels (pre- and post-synaptic), the presynaptic channel was rotated 90° out of alignment, then the two channels were re-merged and analyzed for co-localized synaptic puncta. For both VGlut1/PSD95 (left) and VGlut2/PSD95 (right) co-localized puncta, puncta density was significantly decreased in the rotated image (red) compared to the original unrotated image (black) in both the WT and hevin KO mice (n = 3 z-stacks per animal, 4 animals per genotype; p < 0.01, Student's t test).
Figure 2—figure supplement 2
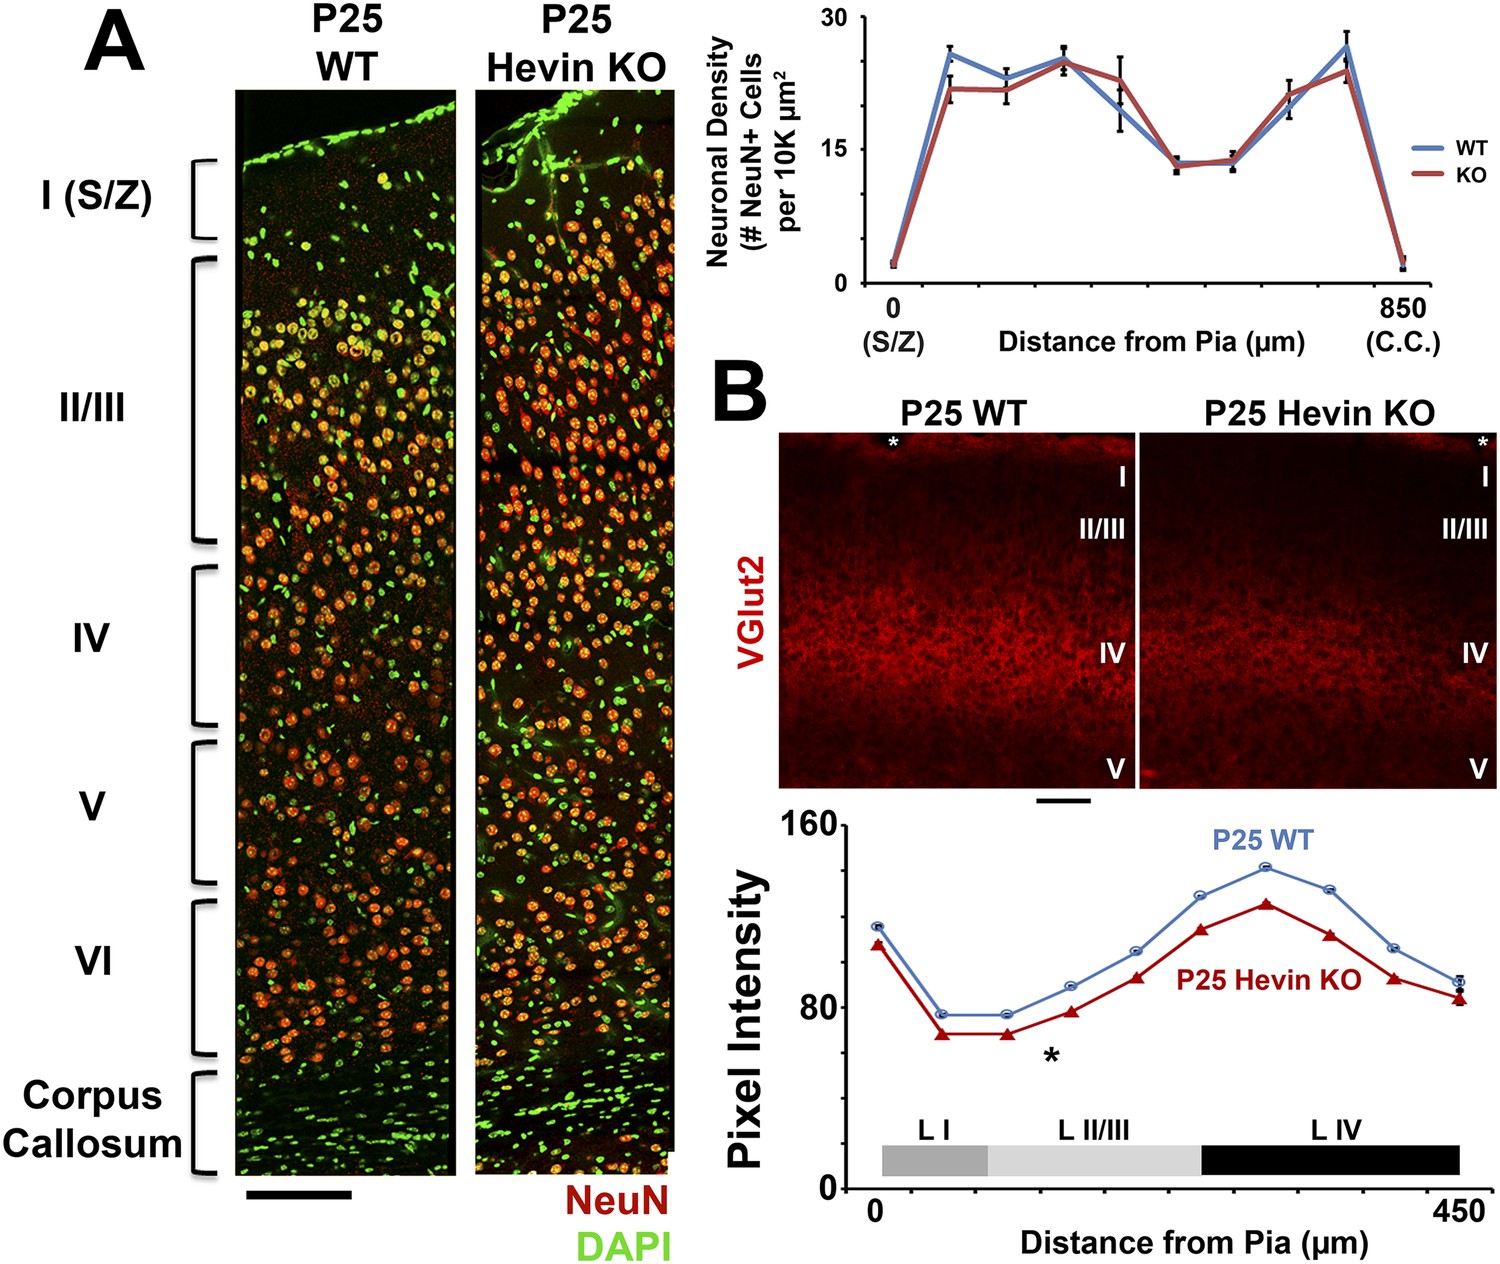
Deficient thalamocortical connectivity in hevin KO is not due to decreased cortical neuron density.
(A) Left: V1 stained for neuronal marker NeuN (red) and DAPI (green) revealed no differences in the gross morphology of cortical layers between P25 WT and hevin KO. Scale bar, 50 µm. Right: Quantification of neuronal density showed no significant differences throughout the cortices of P25 WT vs Hevin KO (n = 3 sections per animal, 3 animals per genotype; p > 0.05, ANCOVA). (B) Top: Staining for VGlut2+ thalamic projections showed decreased intensity across multiple cortical layers, including S/Z, Layer II/III and Layer IV in hevin KO V1. White *=pial surface. Scale bar, 50 µm. Bottom: Quantification of VGlut2 pixel intensity for P25 WT and hevin KO across cortical layers I–IV (*p < 0.05, ANCOVA).
Figure 2—figure supplement 3
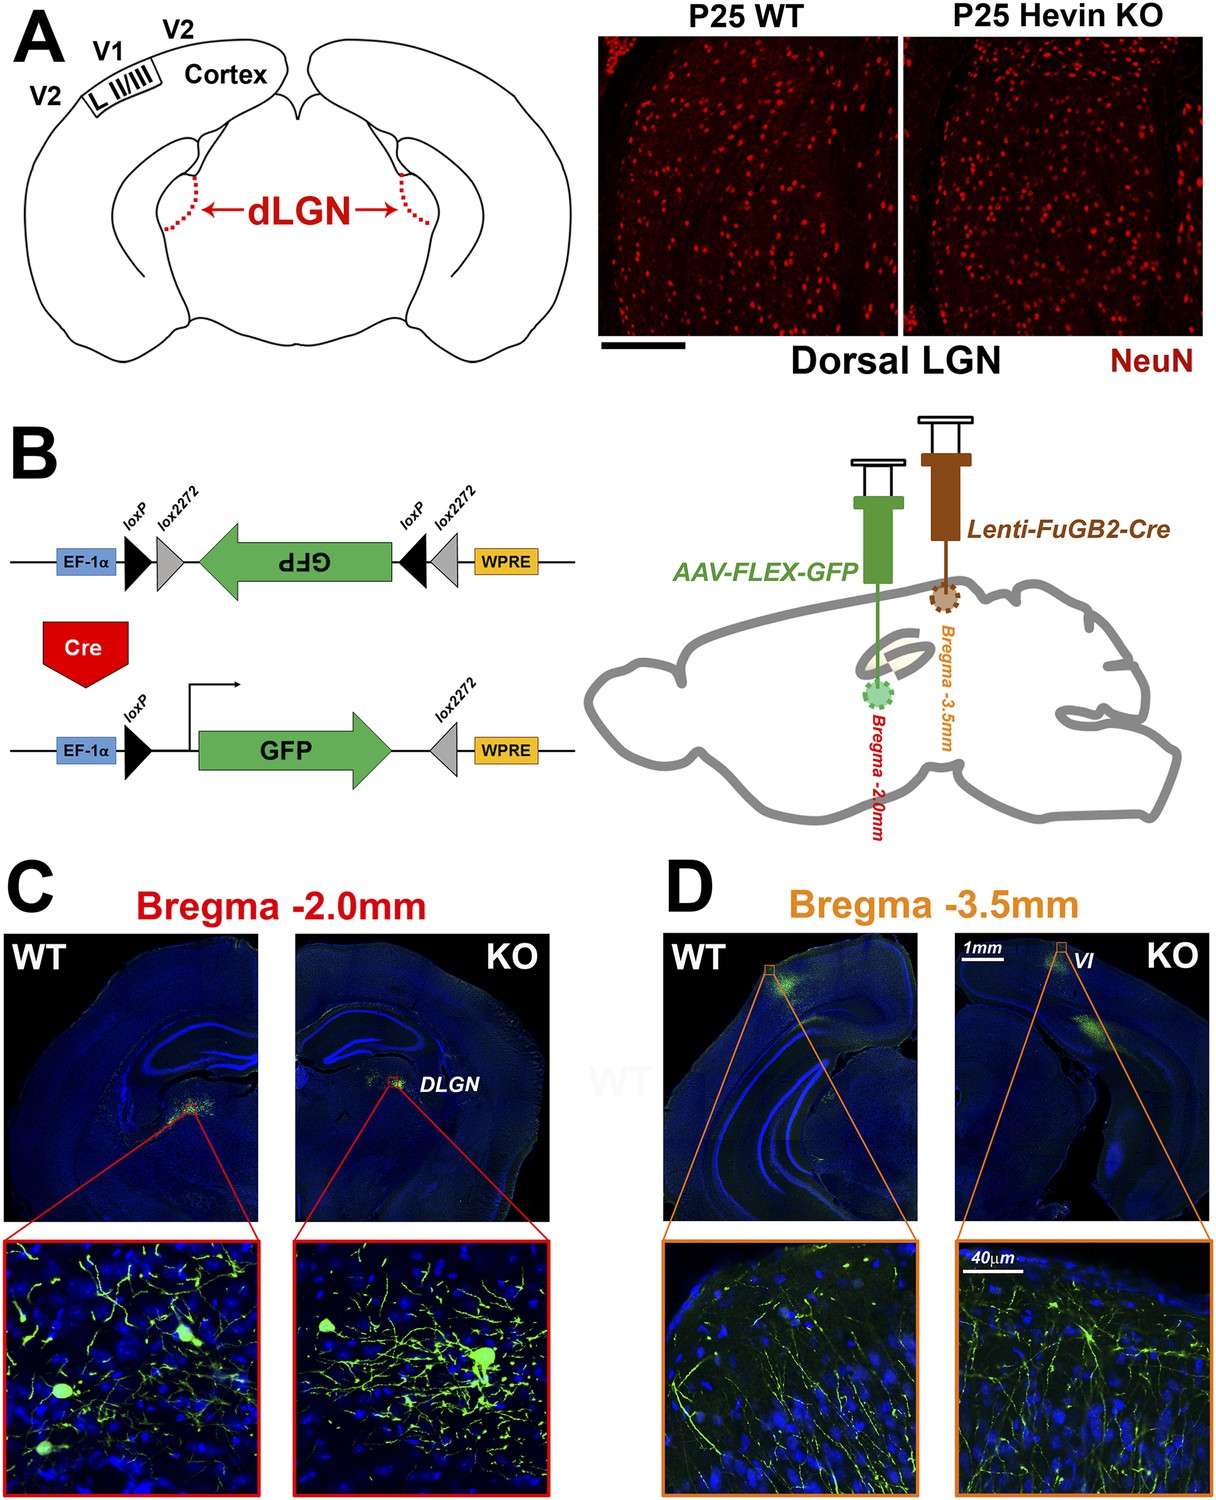
Reduced thalamocortical synapse density in hevin KO V1 is not due to deficient geniculocortical connectivity.
(A) Left: Schematic diagram of a coronal slice through mouse brain highlights the dorsal lateral geniculate nucleus (dLGN) which sends VGlut2+ projections to V1. Right: NeuN (red) staining reveals no difference in neuronal density between P25 WT and hevin KO dLGN (WT: 14.52±1.10 cells per 10,000 μm2, KO: 14.46±1.34 cells per 10,000 μm2; n = 3–4 slices per animal, 3 animals per genotype; p = 0.94, Student's t test). Scale bar, 50 µm. (B) Left: Diagram of the AAV-FLEX-GFP viral vector. The portion of the vector encoding for GFP is inverted, preventing its expression. Upon Cre recombination, the flanking lox sites are excised and the GFP region is flipped, resulting in GFP expression. Right: The AAV-FLEX-GFP virus (green) was injected into the dLGN to label projection neurons. Rabies virus glycoprotein-coated Lenti-FuGB2-Cre (brown) was injected into V1 that retrogradely transports Cre recombinase expression to the dLGN. In this dual-injection system, only neuronal projections that originate in dLGN and terminate in V1 undergo Cre recombination and thereby express GFP. (C) Representative images showing GFP+ projection neurons in the dLGN of both the WT and hevin KO at P30 (approximately 12 days after viral injection). (D) Images of GFP+ projections in the S/Z of both WT and hevin KO show that lack of hevin does not impair the ability of thalamic axons to reach their target regions. Scale bars: 1 mm (main images); 40 µm (insets).
Figure 2—figure supplement 4

Electrophysiological analysis of V1 cortical neurons in hevin KO.
(A) Representative traces from mEPSC recordings in Layer II/III neurons of V1 from WT and hevin KO. Scale bars: 20 pA and 100 ms. (B) Frequency of mEPSC was not significantly different in P23-P26 hevin KO mice compared to age-matched WT (n = 13 cells from 3 WT mice, 18 cells from 5 hevin KO mice; p > 0.05, Student's t test). (C) Amplitude of mEPSC was not significantly different in P23–P26 hevin KO mice compared to age-matched WT (n = 13 cells from 3 WT mice, 18 cells from 5 hevin KO mice; p > 0.05, Mann–Whitney U test).
Figure 3

Hevin is important for both the formation and long-term maintenance of thalamocortical synapses.
(A) Timeline of cortical synaptic development in mice. Axonal projections from the LGN reach their target areas in V1 shortly after birth. Around the time of eye opening, there is a period of intense synapse formation that gradually gives way to processes involved in synapse maturation and refinement, including synapse elimination. Multiple critical periods for different forms of plasticity in the visual system occur during this period of synapse formation and refinement. (B) At P7, the beginning of the synaptogenic period, co-localization of VGlut1 (green) and PSD95 (magenta) revealed a trend towards an increase in intracortical synapses (co-localized puncta; arrows) in the synaptic zone of hevin KO V1 (n = 3 z-stacks per animal, 3 animals per genotype; p = 0.082, nested ANOVA). (C) VGlut2 (red) and PSD95 (cyan) co-localization (arrows), representing thalamocortical synapses, was significantly decreased in P7 hevin KO compared to P7 WT (n = 3 z-stacks per animal, 3 animals per genotype; p < 0.05, nested ANOVA). Scale bars, 5 µm. (D) In the mature brain (12-weeks-old), hevin KO mice no longer have a discrepancy in VGlut1/PSD95 synaptic puncta when compared to WT (n = 3 z-stacks per animal, 5 animals per genotype; p > 0.05, Student's t test). (E) Deficient VGlut2/PSD95 synapse formation is still present in the mature hevin KO brains (n = 3 z-stacks per animal, 5 animals per genotype; p < 0.01, Student's t test). Scale bars, 5 µm.
Figure 4 with 1 supplement
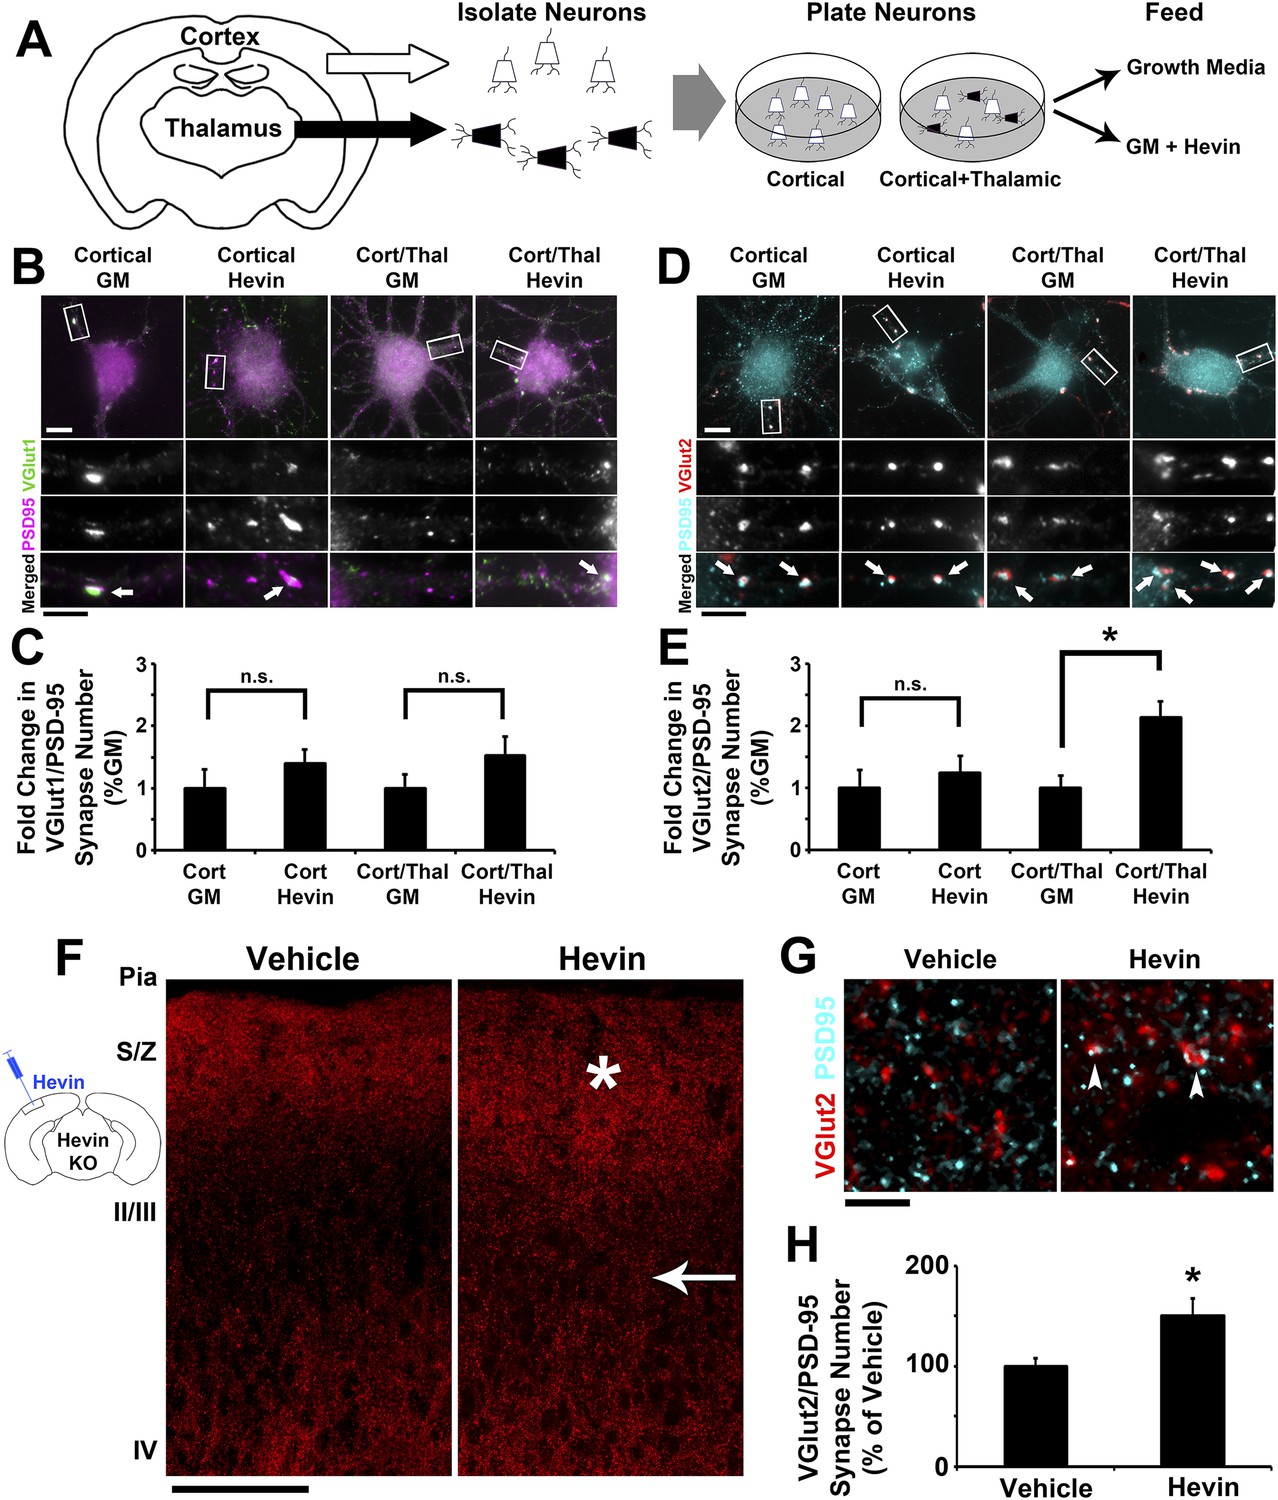
Hevin specifically induces thalamocortical synapse formation in vitro and in vivo.
(A) Schematic of the cortical/thalamic neuron co-culture system. (B) Representative images of cortical neurons cultured for 14 days in vitro (DIV), either alone or in equal densities with thalamic neurons, with or without hevin treatment. Insets show individual channels for VGlut1 (green) and PSD95 (magenta) staining, as well as the merged image. Co-localized puncta (white, arrows) represent synapses. Scale bars: 10 µm (main image), 5 µm (inset). (C) Hevin did not induce VGlut1 synapse formation onto cortical neurons, with or without thalamic neurons also present (n = 30 cells per condition; p > 0.05, Student's t test between GM and hevin treatments). (D) Same as B, except VGlut2 appears as red and PSD95 in cyan. (E) Hevin strongly induces VGlut2/PSD95 synapse formation when cortical neurons are cultured together with thalamic neurons (n = 30 cells per condition; *p > 0.01, Student's t test between GM and hevin treatments). Upon hevin treatment VGlut2/PSD95 synapses are recruited heavily to neuronal soma and proximal dendrites. (F) Hevin protein was stereotactically injected directly into Layer II/III of hevin KO V1. When compared to vehicle-injected control, hevin-injected cortex had distinctly thickened VGlut2 staining throughout S/Z and upper II/III (asterisk), as well as a dense appearance of VGlut2+ axon tracks throughout II/III (arrow). Scale bar, 100 µm. (G) Hevin-injected V1 had more VGlut2/PSD95 co-localized puncta (arrowheads) than vehicle-injected controls. Scale bar, 5 µm. (H) Hevin injection significantly increased the number of VGlut2/PSD95 synapses in hevin KO cortex (n = 2 z-stacks per animal, 3 animals per treatment; p < 0.01, Student's t test).
Figure 4—figure supplement 1
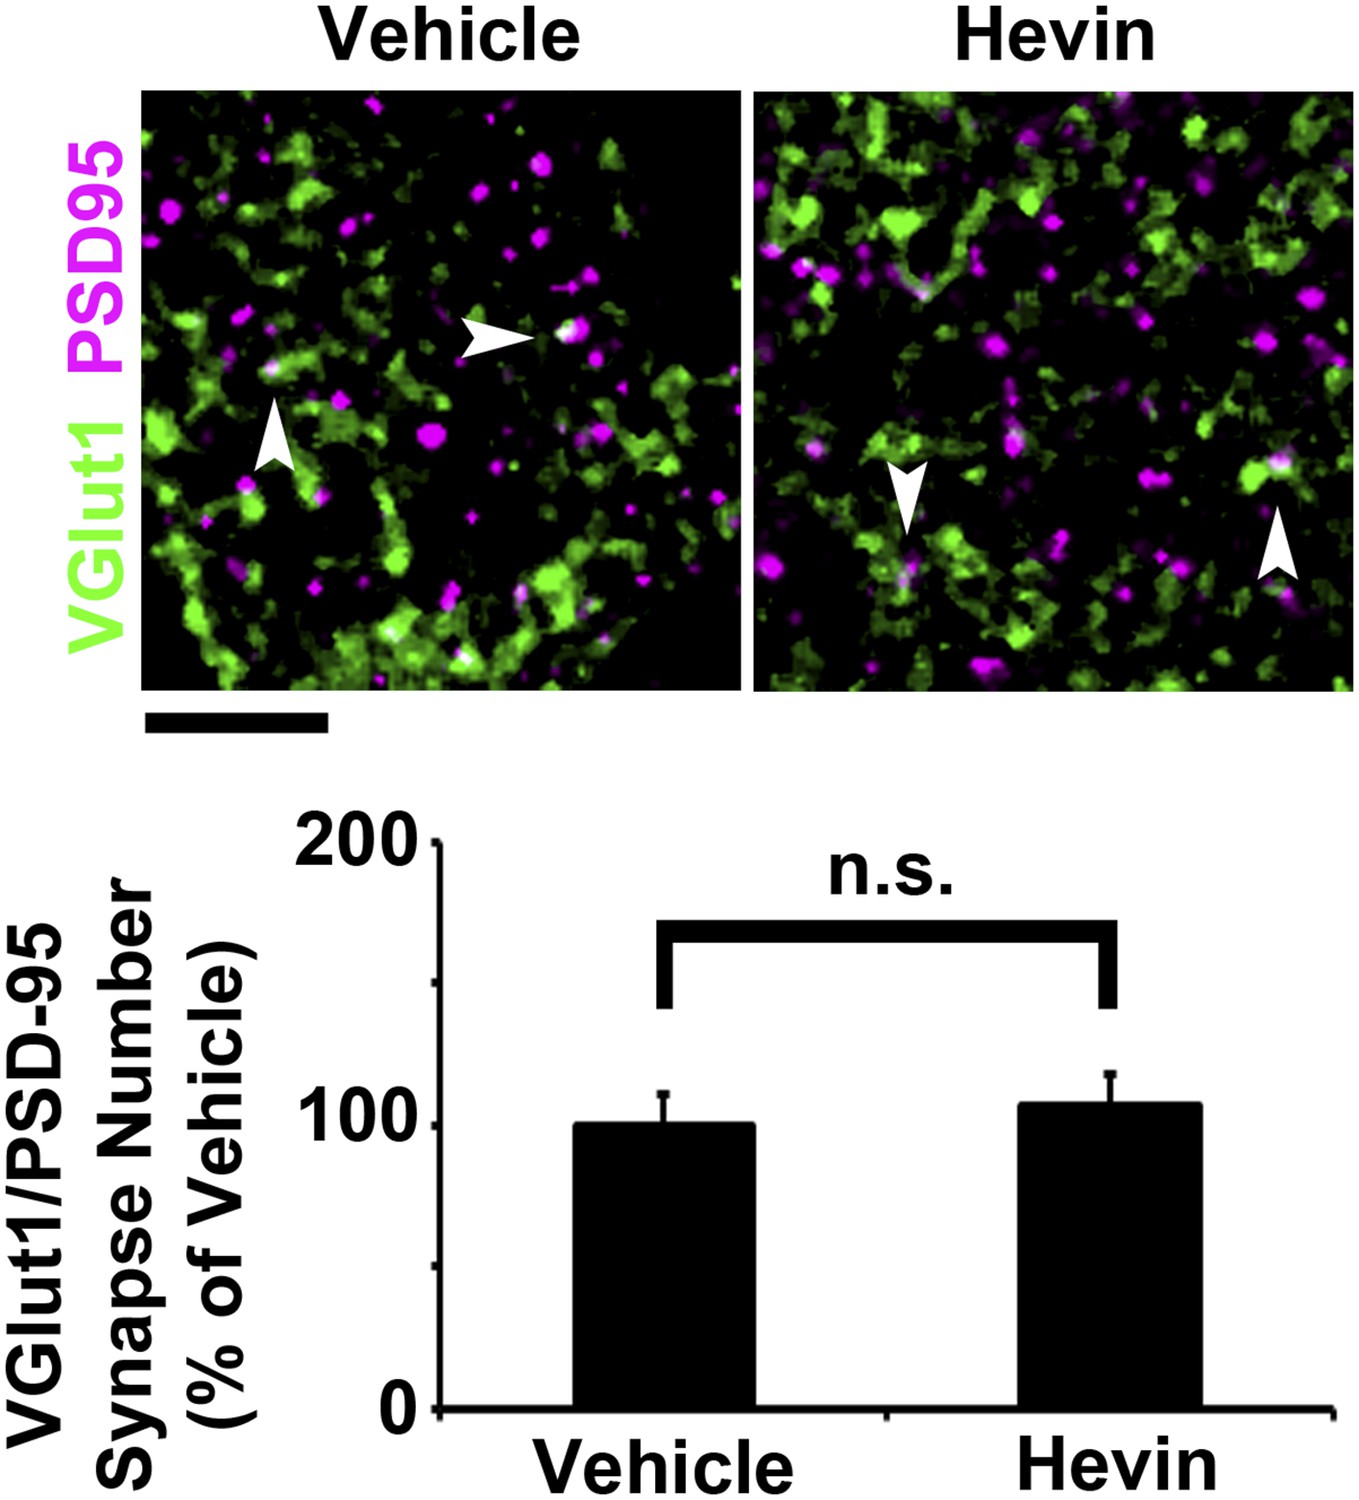
Hevin does not induce intracortical synapse formation in vivo.
Top: Synaptic staining in V1 does not show a difference in VGlut1/PSD95 co-localization (arrowheads) between hevin-injected brains and vehicle-injected controls. Scale bar, 5 µm. Bottom: Quantification of VGlut1/PSD95 synapses in hevin-injected cortex confirms that hevin does not increase the number of VGlut1+ synapses (n = 2 z-stacks per animal, 3 animals per treatment; p > 0.05, Student's t test).
Figure 5 with 1 supplement

Hevin is required for dendritic maturation and proper localization of excitatory synapses.
(A) Example 3D reconstructions of dendrites in P25 WT (left, blue) and hevin KO (right, pink) V1. Asymmetric PSD locations (i.e., excitatory synapses) are shown in red. Scale cubes, 0.5 µm3. (B) Asymmetric PSD size was decreased in P25 hevin KO vs WT (n = 278 WT synapses, 293 KO synapses; p < 0.025, Kolmogorov–Smirnov two-sample test). (C) Left: EM examples from P25 WT and P25 hevin KO show the ‘tripartite synapse’ arrangement of postsynaptic dendritic spines (yellow), presynaptic axonal boutons (green) and glial processes (blue). Scale bar, 250 nm. Right: Quantification revealed no difference in the percentage of excitatory synapses contacted by glial processes in P25 WT vs P25 hevin KO (n = 4 dendrites per animal, 2 animals per genotype; p = 0.52, Student's t test). (D) Left: Excitatory synapses, made by axons (green) onto dendritic spines (yellow) in P25 WT, were readily seen on dendritic shafts (yellow) in the hevin KO. Scale bar, 250 nm. Right, Top: Example hevin KO dendrite with multiple excitatory shaft synapses (arrows). Scale cube, 0.5 µm3. Right, Bottom: Quantification of excitatory shaft synapse density in P25 hevin KO compared to P25 WT (n = 4 dendrites per animal, 3 animals per genotype; p < 0.01, Student's t test). (E) SMEC density was increased in P25 hevin KO compared to WT (arrows indicate excitatory PSDs on SMECs; n = 4 dendrites per animal, 3 animals per genotype; p < 0.01, one-way ANOVA with Fisher's LSD posthoc test).
Figure 5—figure supplement 1
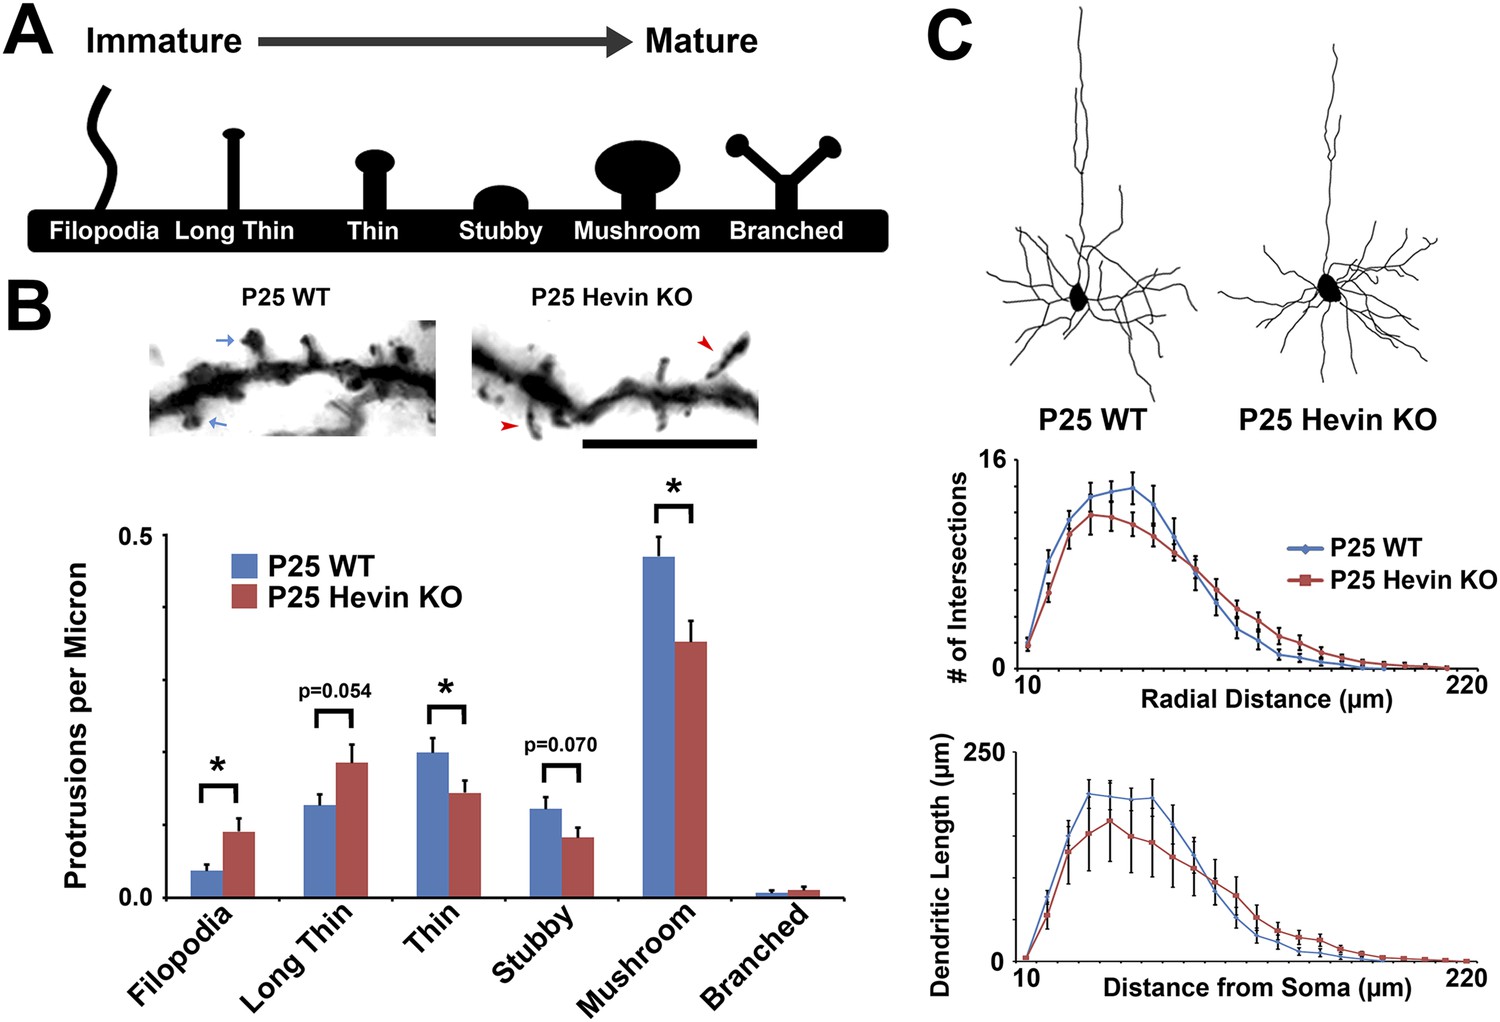
Structural immaturity across multiple spine types in hevin KO V1.
(A) Multiple spine types can be found in developing visual cortex, progressing in maturity from the long, thin filopodia-type protrusions to the enlarged-head mushroom spines (and occasional branched spines). (B) Top: Golgi-cox stained secondary dendrites from Layer II/III pyramidal neurons in V1. Scale bar, 5 µm. Immature filopodia-like spines were frequent in hevin KOs (red arrowheads) whereas mature mushroom spines (blue arrows) were seen in P25 WT. Bottom: Quantification of spine type densities revealed that immature spine types, including filopodia and long thin spines, were more frequent in the P25 hevin KO compared to WT. More intermediate-to-mature spine types, including short thin, stubby and mushroom, were less frequent in the P25 hevin KO compared to WT (n = 15 dendrites per animal, 3 animals per genotype; p < 0.01, Student's t test). (C) Top: Camera lucida images of representative Layer II/III pyramidal neurons in V1 from P25 WT and hevin KO. Bottom: Scholl analysis (p = 0.70) and neurite outgrowth (p = 0.26) analyses of Golgi-cox stained pyramidal neurons showed no significant differences between P25 WT and hevin KO (n = 4 neurons per animal, 3 animals per genotype; ANCOVA).
Figure 6
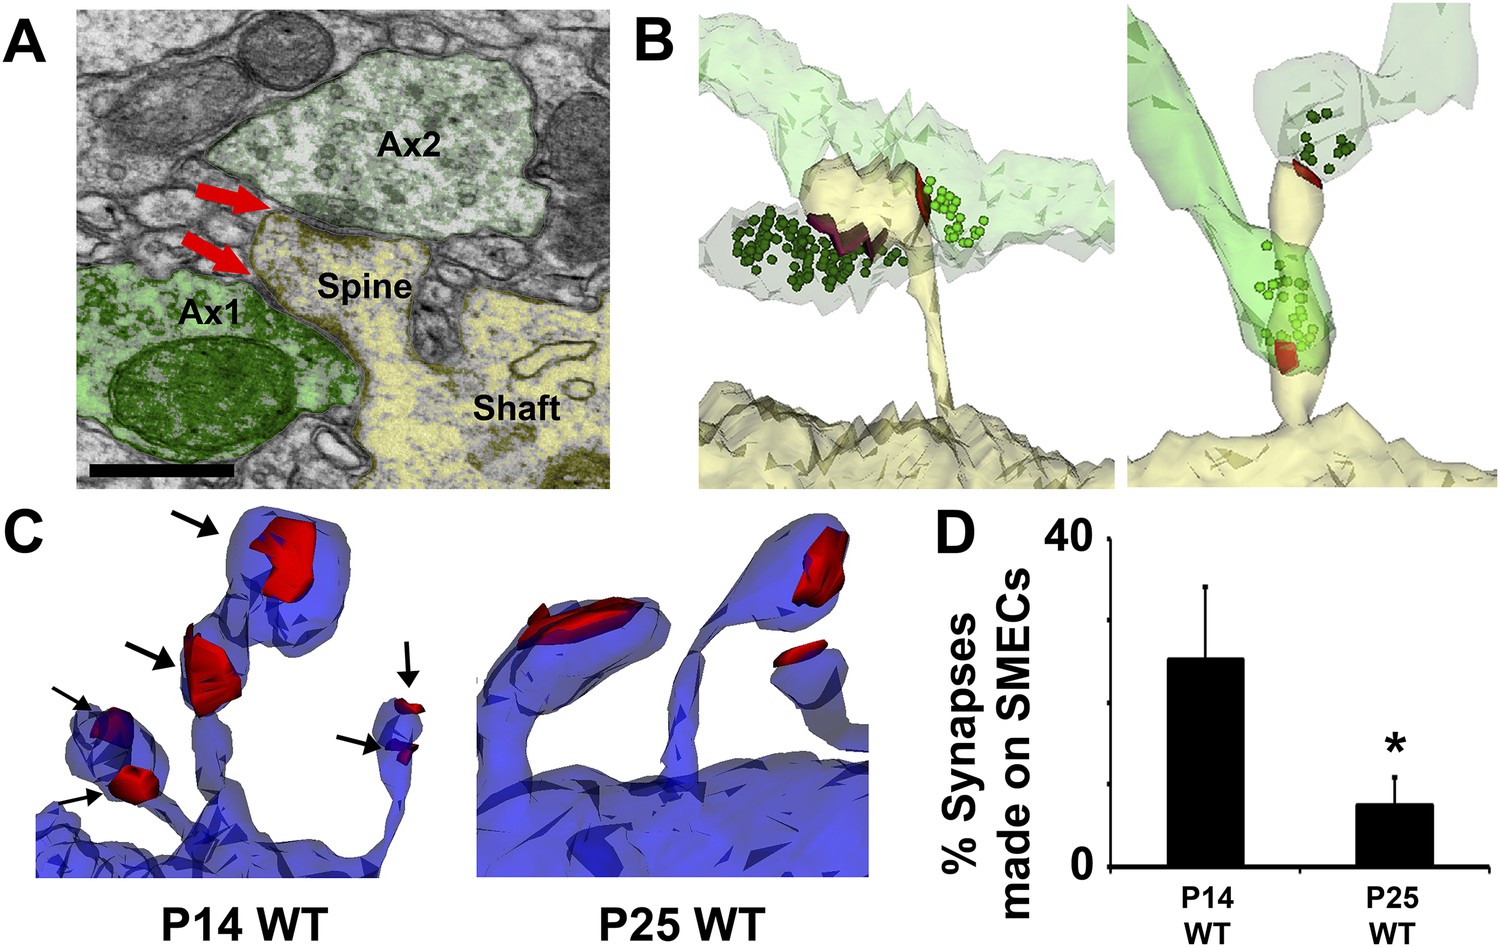
Spines with Multiple Excitatory Contacts (SMECs) represent a developmental stage in the maturation of dendritic spine structures.
(A) Electron micrograph of a SMEC: a dendritic mushroom spine (yellow) making asymmetric contacts (red arrows) with two different axonal boutons (green). Scale bar, 0.5 µm. (B) Different spatial arrangements observed in SMECs. Small green circles denote the location of glutamatergic vesicles within the axons. (C) SMECs (arrows) decrease from P14–P25 in WT. (D) Quantification of the percentage of excitatory synapses made onto SMECs in P14 WT and P25 WT mice (n = 4 dendrites per animal, 3 animals per age; p < 0.05, one-way ANOVA with Fisher's LSD posthoc test).
Figure 7
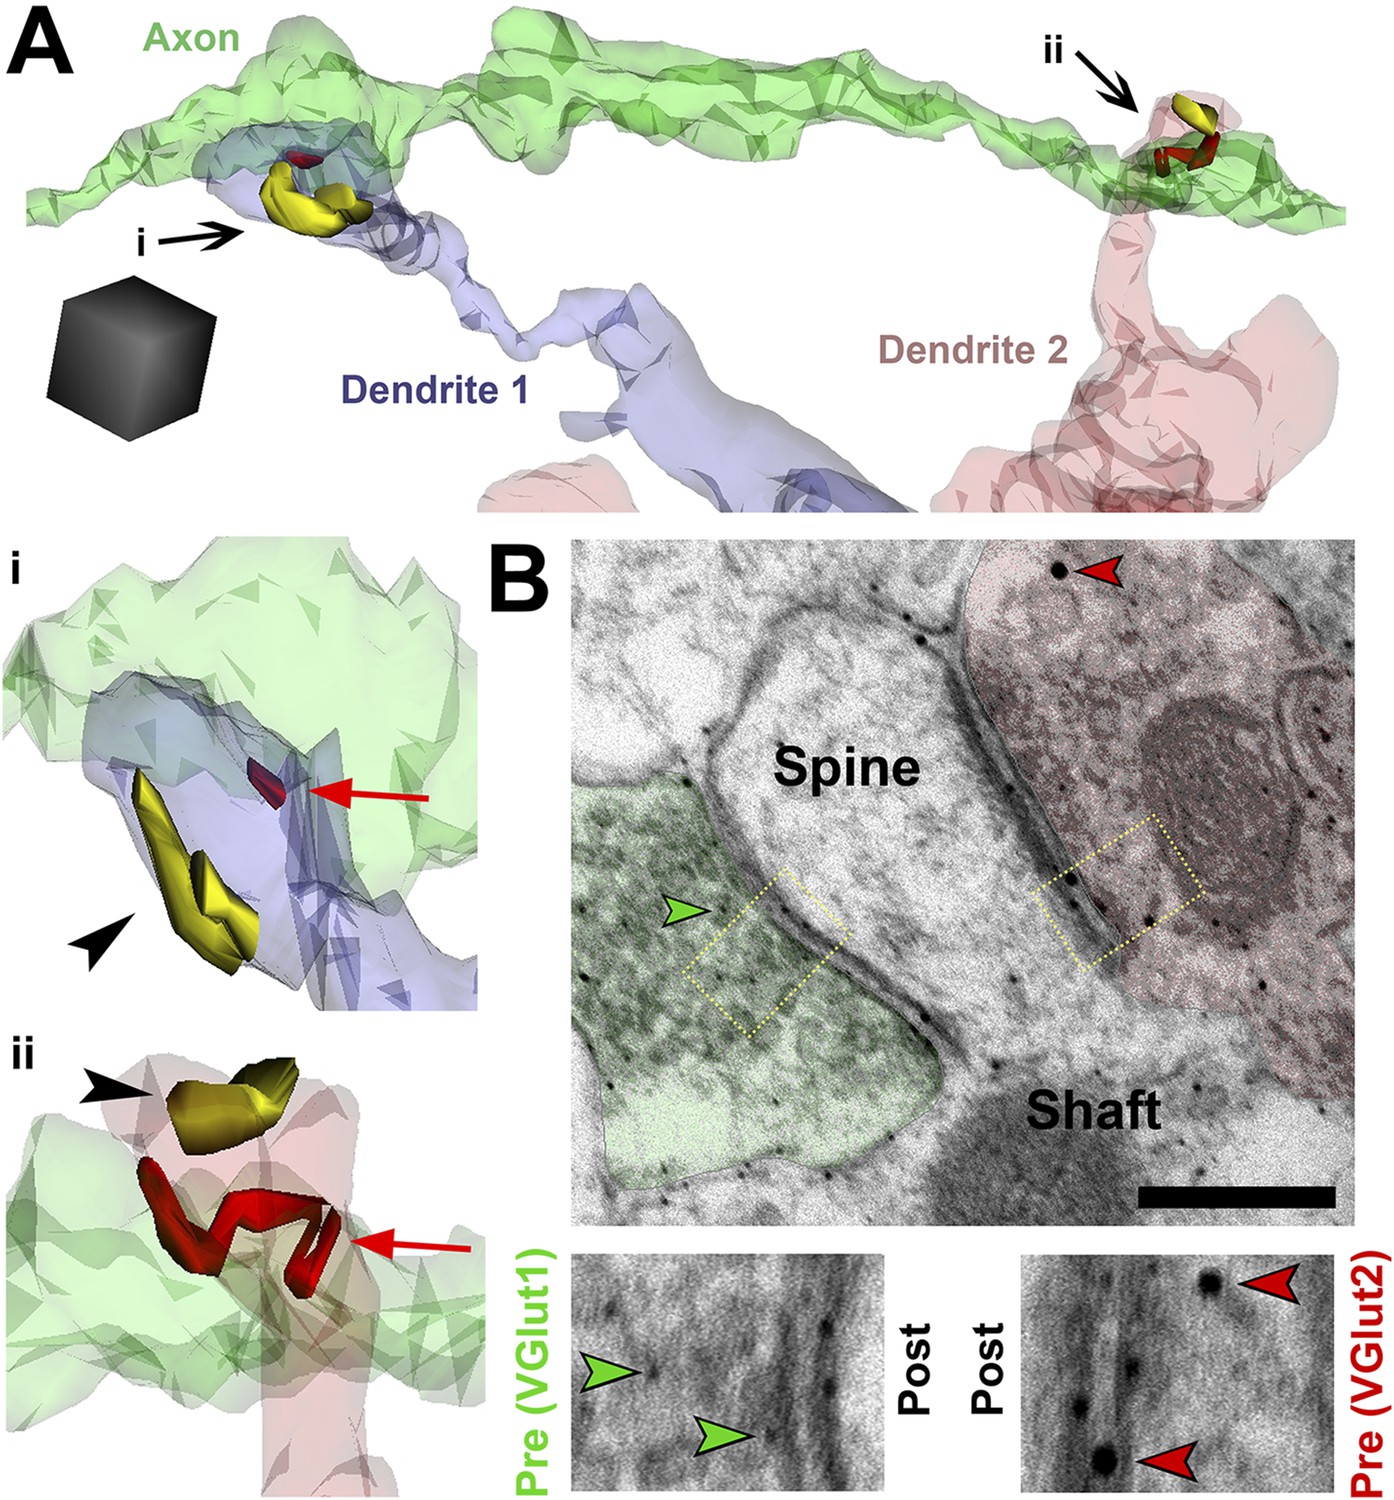
SMECs represent potential sites for competition between thalamocortical and intracortical projections.
(A) Reconstructed axon (green) from P25 hevin KO contacting multiple SMECs on two different dendrites. Quantification revealed that axons that synapsed with at least one SMEC also synapsed with another SMEC roughly 50% of the time. Scale cube, 0.5 µm3. i–ii, Zoomed-in images reveal that each SMEC makes an excitatory synapse (red; arrow) with the reconstructed axon as well as a second excitatory synapse (yellow; arrowhead) with an additional axon (not shown). (B) Immuno-EM image from V1 in P14 WT showing a SMEC simultaneously contacting a VGlut1+ (green) and VGlut2+ (red) axonal bouton. Higher magnification images (below) highlight the size difference between the small VGlut1 (green arrowheads) and large VGlut2 (red arrowheads) Nanogold particles. Scale bar, 250 nm.
Figure 8 with 2 supplements
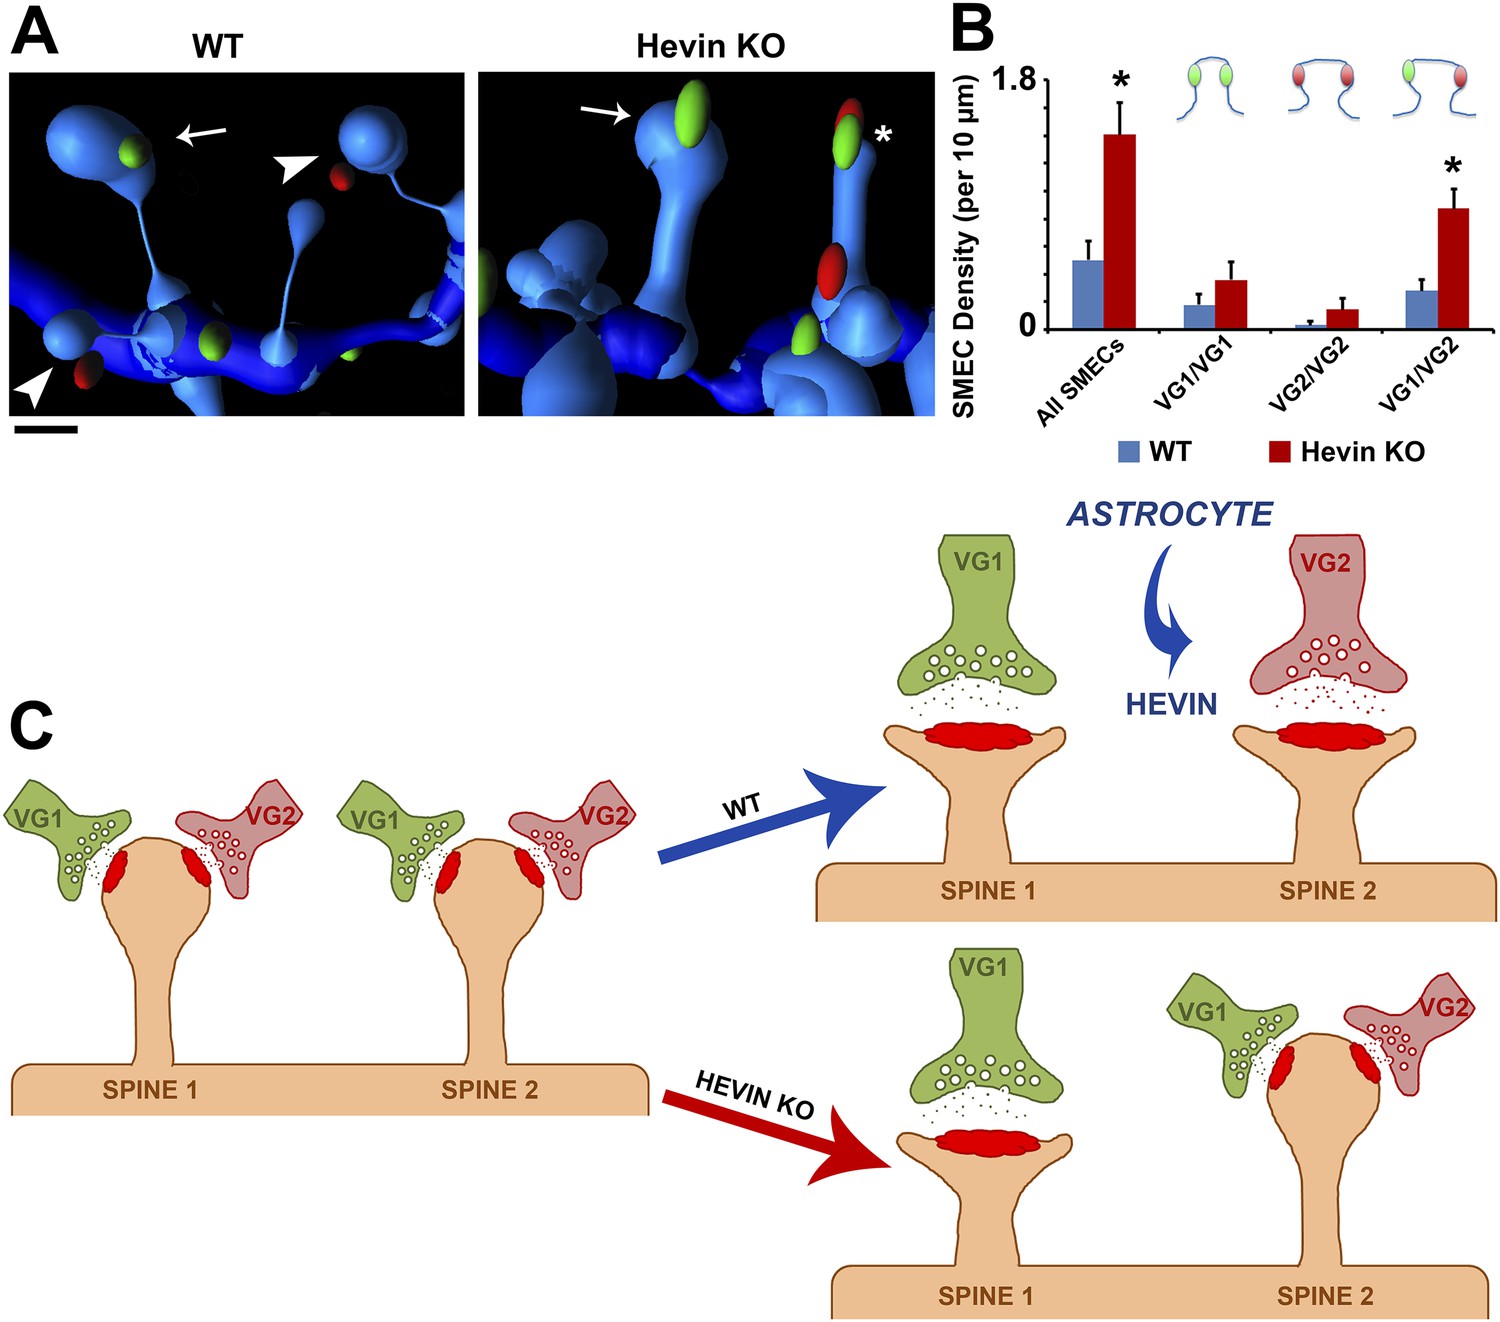
Hevin is critical for the resolution of VGlut1/VGlut2-innervated SMECs.
(A) Representative Imaris 3D reconstructions of GFP-labeled dendrites (blue) in the S/Z of P21 WT and hevin KO V1. Presynaptic puncta are rendered as elliptical ‘spots’ (green = VGlut1; red = VGlut2). Numerous unisynaptic spines can be seen in the WT (arrow = VGlut1 spine; arrowheads = VGlut2 spines). In hevin KO, a SMEC can be seen contacting both a VGlut1 and VGlut2 ‘spot’ (asterisk). A unisynaptic VGlut1 spine (arrow) is also present. Scale bar, 0.5 µm. (B) Quantification of SMEC density at P21 shows that the increase in total SMECs in the hevin KO is driven by the VGlut1/VGlut2 SMEC subtype (3 animals/genotype, n = 15 dendrites per condition; p < 0.01, Student's t test). (C) Model for astrocytic control of thalamocortical connectivity by hevin. Left: In early V1 synaptic development, intracortical (primarily VGlut1, or VG1) axons compete with thalamocortical (primarily VGlut2, or VG2) axons for synapses, occasionally forming synapses on the same dendritic spine (resulting in a SMEC). In the WT, astrocytes secrete hevin which stabilizes VGlut2+ synapses, resulting in discrete populations of VGlut1+ and VGlut2+ unisynaptic spines. In the hevin KO, VGlut2+ synapses cannot be properly stabilized. These sites either remain in competition with VGlut1, explaining the persistence of SMECs in hevin KO, or become lost, resulting in more VGlut1+ synapses overall.
Figure 8—figure supplement 1
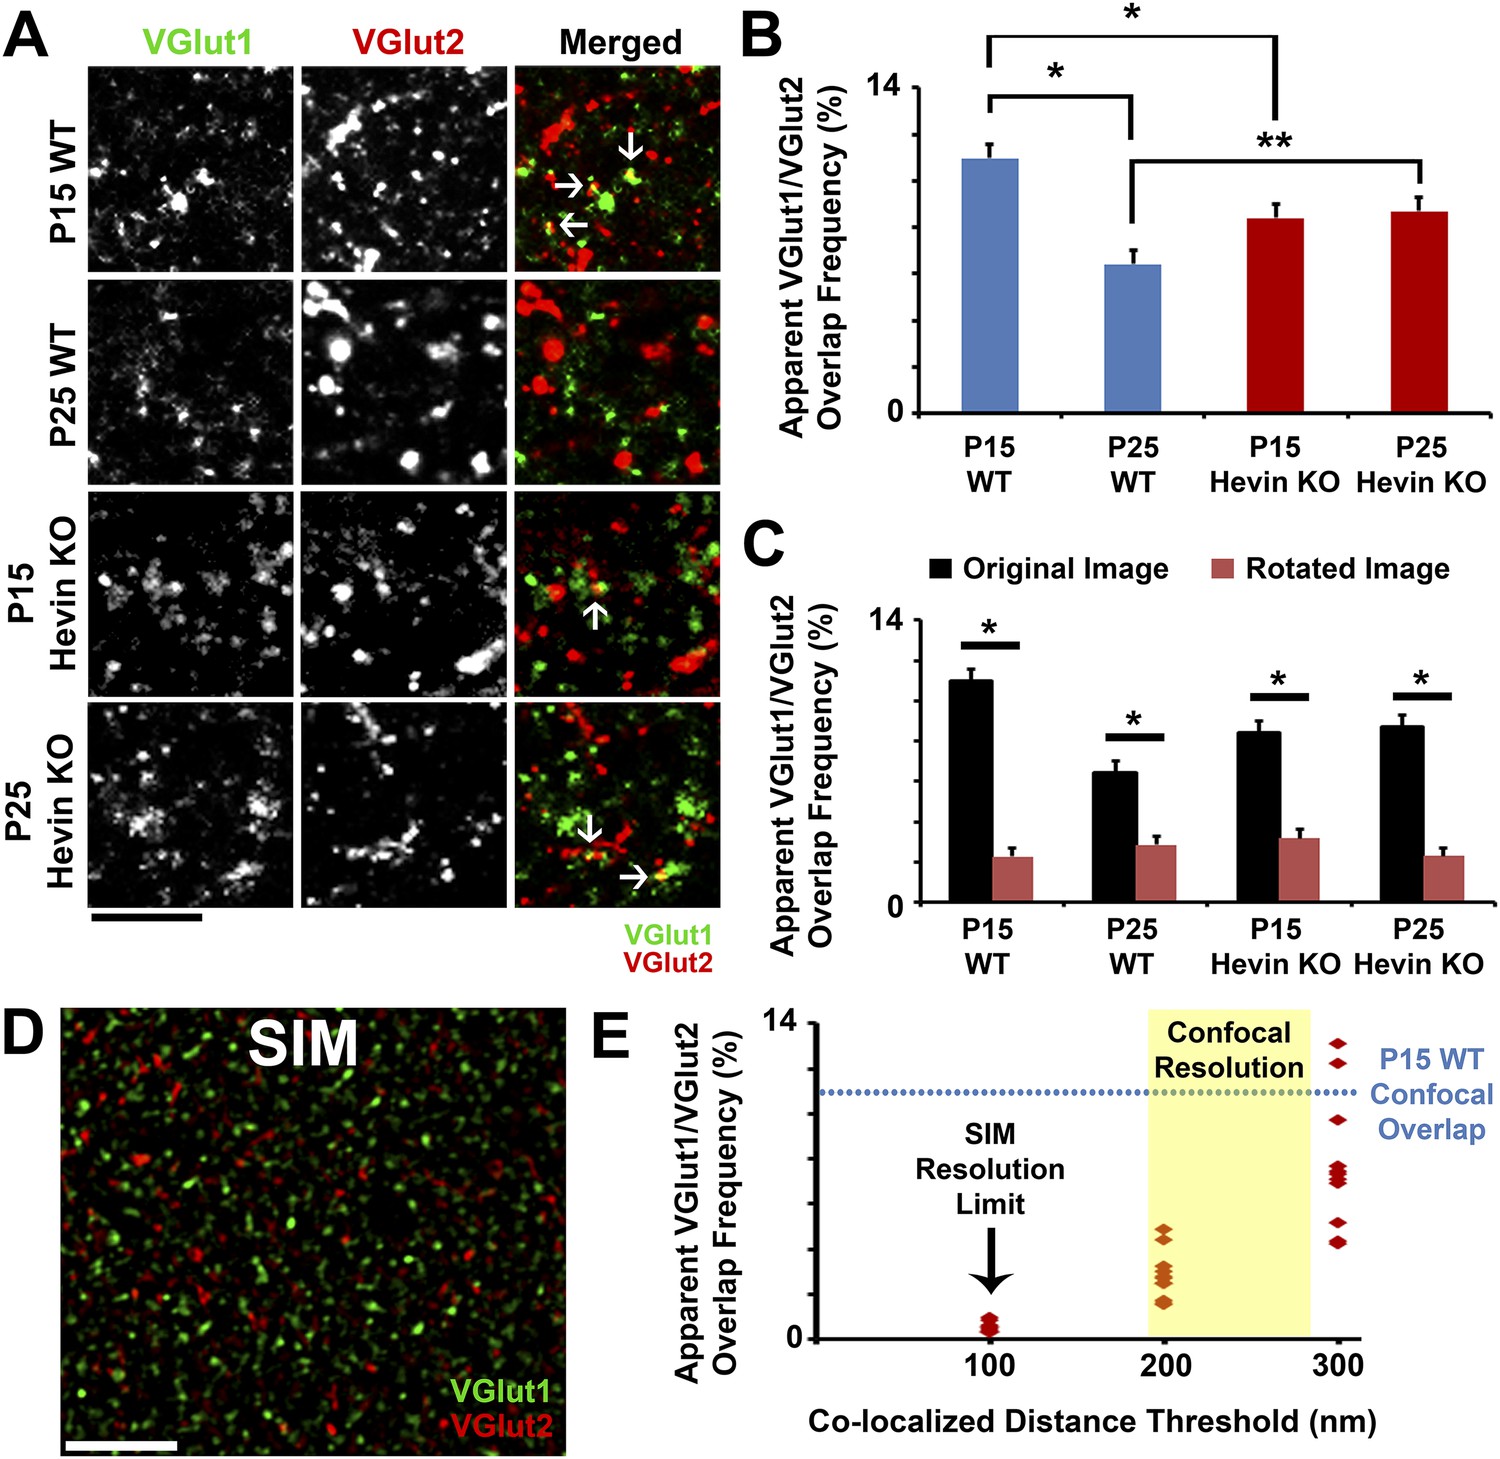
Overlap of VGlut1 and VGlut2 in light microscopy is due to close proximity of different presynaptic terminals.
(A) Apparent overlap between VGlut1 (green) and VGlut2 (red) by light microscopy appears as yellow puncta (arrows). Representative images show VGlut puncta at P15 and P25 in both WT and hevin KO. Scale bar, 5 µm. (B) Quantification of the apparent overlap in VGlut1/VGlut2 puncta, which is decreased between P15 and P25 in the WT. In the hevin KO, the VGlut1/VGlut2 overlap is slightly decreased at P15 but is unchanged as development continues to P25, at which point it is significantly higher than WT (n = 3 z-stacks per animal, 3–4 animals per genotype; *p < 0.01, **p < 0.05, nested ANOVA). (C) To show that the apparent overlap in VGlut1 and VGlut2 puncta was not due to random chance in densely stained tissue, confocal Z-stacks were split into two channels (VGlut1 and VGlut2), the VGlut2 channel was rotated 90° out of alignment, then the two channels were re-merged and analyzed for apparent co-localization of presynaptic puncta. For all conditions analyzed, overlap frequency was significantly decreased in the rotated image (red) compared to the original unrotated image (black) (n = 3 z-stacks per animal, 3–4 animals per genotype; p < 0.01, Student's t test). (D) Representative SIM image of VGlut1 (green)/VGlut2 (red)-stained S/Z in P15 WT cortex. At the high resolution afforded by SIM (∼100 nm), VGlut1 and VGlut2 presynaptic puncta do not appear co-localized. Scale bar, 5 µm. (E) Scatterplot showing the apparent overlap in VGlut1/VGlut2 puncta at differing co-localization distance thresholds. When the limit of co-localization is 100 nm between puncta, approaching the resolution of SIM, virtually no co-localization is detected. By increasing the allowable distance between co-localized puncta (closer to the resolution of confocal microscopy), VGlut1/VGlut2 overlap frequency eventually approaches the levels previously detected by confocal imaging (n = 3–4 Z-stacks each from 3 animals).
Figure 8—figure supplement 2
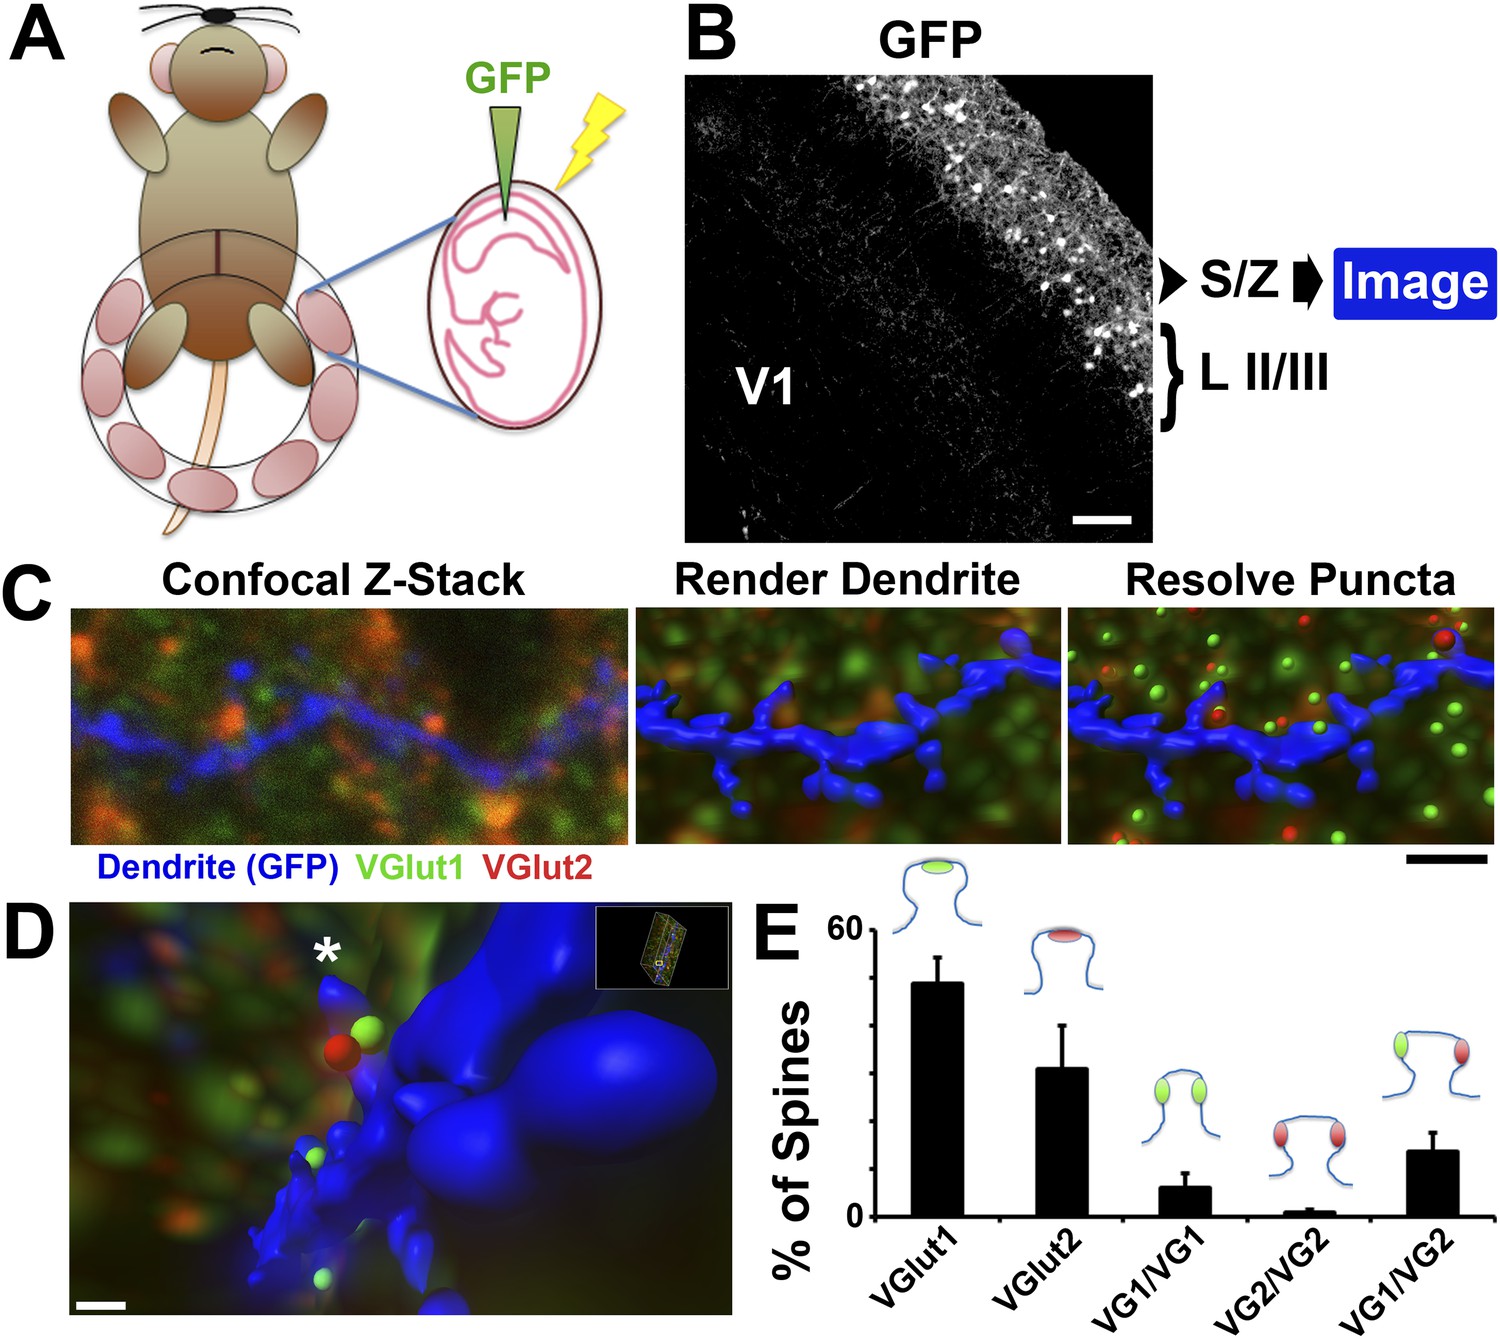
Imaging presynaptic terminals in proximity to dendritic spines.
(A) Schematic for the IUE technique. Anesthetized dams have their uterine horns exposed at E15.5. DNA plasmid containing GFP with loading dye is injected into the lateral ventricle of each pup, followed by electric pulses to facilitate uptake of the plasmid. The horns are then placed back into the dam, the incision sutured, and the dam is allowed to recover and give birth to the electroporated litter. (B) 10× magnification image taken in V1 at P15 showing that IUE resulted in specific GFP labeling of neurons in cortical Layer II/III. Secondary and tertiary dendrites from these neurons, which project to the S/Z, are then imaged by confocal microscopy. (C) Left: A single optical section taken from a confocal Z-stack shows a GFP-labeled dendrite (blue) in the S/Z along with surrounding presynaptic puncta (VGlut1-green; VGlut2-red). Middle: Imaris surface rendering was used to image the dendrite's structure, including spines, in 3D. Right: The ‘Spots’ function of Imaris allowed for the resolution of individual presynaptic puncta in three-dimensional space. Scale bar, 1 µm. (D) After applying the Matlab ‘Spots close to surface’ algorithm in Imaris, in order to isolate spots within 0.2 µm of the dendrite, spines with closely-associated presynaptic puncta can be quantified. An asterisk indicates the location of a SMEC which is contacted by both a VGlut1 and VGlut2 terminal. (E) Quantification in P15 WT V1 showing the percentage of spines that contact various presynaptic puncta, including the various subtypes of SMECs (3 animals, n = 9 dendrites).
Videos
Video 1
An axon (green) from Layer II/III V1 reconstructed in 3D from ssEM images of P25 hevin KO.
SMEC 1 from Dendrite 1 (blue) makes Synapse 1 (red) with this axon and Synapse 2 (yellow) with a second unshown axon. On a different part of this same axon, it makes Synapse 3 (red) with SMEC 2 from Dendrite 2 (pink) that also contacts a third (also unshown) axon at Synapse 4 (yellow).
Additional files
-
Source code 1
Puncta Analyzer plugin for ImageJ. This plugin allows for the quantification of co-localized synaptic puncta from immuno-stained cells or tissue. The plugin separates the original image file into red and green channels, subtracts background (rolling ball radius = 50), and asks the user to threshold each channel individually in order to detect discrete puncta without introducing noise. The Puncta Analyzer plugin then uses an algorithm to detect the number of puncta that are in close alignment across the two channels, yielding quantified co-localized puncta.
- https://doi.org/10.7554/eLife.04047.020
Download links
A two-part list of links to download the article, or parts of the article, in various formats.
Downloads (link to download the article as PDF)
Open citations (links to open the citations from this article in various online reference manager services)
Cite this article (links to download the citations from this article in formats compatible with various reference manager tools)
Astrocytes refine cortical connectivity at dendritic spines
eLife 3:e04047.
https://doi.org/10.7554/eLife.04047


